
The Performance of Shrinkage Estimator for Stock Portfolio Selection in Case of High Dimensionality


Abstract
:1. Introduction
2. Literature Review
Shrinkage Estimator of Covariance Matrix
3. Methodology
3.1. Input Data
3.2. Portfolio Performance Evaluation Methodology
3.3. Portfolio Selection
4. Result
4.1. Competing Estimators and Benchmarks
4.2. Empirical Results
5. Conclusions
Author Contributions
Funding
Institutional Review Board Statement
Informed Consent Statement
Data Availability Statement
Conflicts of Interest
References
- Bai, Jushan, and Shuzhong Shi. 2011. Estimating high dimensional covariance matrices and its applications. Annals of Economics and Finance 12: 199–215. [Google Scholar]
- Bodnar, Taras, Yarema Okhrin, and Nestor Parolya. 2021. Optimal Shrinkage-Based Portfolio Selection in High Dimensions. Journal of Business & Economic Statistics 2021: 1–17. [Google Scholar] [CrossRef]
- Chen, Yilun, Ami Wiesel, Yonina C. Eldar, and Alfred O. Hero. 2010. Shrinkage algorithms for MMSE covariance estimation. IEEE Transactions on Signal Processing 58: 5016–29. [Google Scholar] [CrossRef] [Green Version]
- Corsaro, Stefania, Valentina De Simone, and Zelda Marino. 2021. Split Bregman iteration for multi-period mean variance portfolio optimization. Applied Mathematics and Computation 392: 125715. [Google Scholar] [CrossRef] [PubMed]
- DeMiguel, Victor, and Francisco J. Nogales. 2009. Portfolio selection with robust estimation. Operations Research 57: 560–77. [Google Scholar] [CrossRef] [Green Version]
- DeMiguel, Victor, Yuliya Plyakha, Yuliya Plyakha, and Grigory Vilkov. 2013. Improving portfolio selection using option—Implied volatility and skewness. Journal of Financial and Quantitative Analysis 48: 1813–45. [Google Scholar] [CrossRef]
- Elton, Edwin J., Martin J. Gruber, Stephen Brown, and William N. Goetzmann. 2009. Modern Portfolio Theory and Investment Analysis. Hoboken: John Wiley & Sons. [Google Scholar]
- Ikeda, Yuki, and Kubokawa Tatsuya. 2016. Linear shrinkage estimation of large covariance matrices using factor models. Journal of Multivariate Analysis 152: 61–81. [Google Scholar] [CrossRef]
- Konno, Yoshihiko. 2009. Shrinkage estimators for large covariance matrices in multivariate real and complex normal distributions under an invariant quadratic loss. Journal of Multivariate Analysis 100: 2237–53. [Google Scholar] [CrossRef] [Green Version]
- Lam, Clifford. 2016. Nonparametric eigenvalue-regularized precision or covariance matrix estimator. Annals of Statistics 44: 928–53. [Google Scholar] [CrossRef]
- Ledoit, Olivier, and Michael Wolf. 2003a. Honey, I shrunk the sample covariance matrix. Journal of Portfolio Management 30: 110–19. [Google Scholar] [CrossRef] [Green Version]
- Ledoit, Olivier, and Michael Wolf. 2003b. Improved estimation of the covariance matrix of stock returns with an application to portfolio selection. Journal of Empirical Finance 10: 603–21. [Google Scholar] [CrossRef] [Green Version]
- Ledoit, Olivier, and Michael Wolf. 2004. A well-conditioned estimator for large-dimensional covariance matrices. Journal of Multivariate Analysis 88: 365–411. [Google Scholar] [CrossRef] [Green Version]
- Ledoit, Olivier, and Michael Wolf. 2017a. Nonlinear shrinkage of the covariance matrix for portfolio selection: Markowitz meets Goldilocks. Review of Financial Studies 30: 4349–88. [Google Scholar] [CrossRef]
- Ledoit, Olivier, and Michael Wolf. 2017b. Numerical implementation of the QuEST function. Computational Statistics & Data Analysis 115: 199–223. [Google Scholar]
- Ledoit, Olivier, and Michael Wolf. 2018. Optimal estimation of a large-dimensional covariance matrix under Stein’s loss. Bernoulli 24: 3791–832. [Google Scholar] [CrossRef] [Green Version]
- Nguyen, Nhat, Trung Nguyen, Tuan Tran, and An Mai. 2020. Shrinkage model selection for portfolio optimization on Vietnam stock market. The Journal of Asian Finance, Economics and Business 7: 135–45. [Google Scholar] [CrossRef]
- Senneret, Marc, Yannick Malevergne, Patrice Abry, Patrice Perrin, and Patrice Jaffrs. 2016. Covariance versus precision matrix estimation for efficient asset allocation. IEEE Journal of Selected Topics in Signal Processing 10: 982–93. [Google Scholar] [CrossRef]
- Sharpe, William F. 1964. Capital asset prices: A theory of market equilibrium under conditions of risk. The Journal of Finance 19: 425–42. [Google Scholar]
- Sun, Ruili, Tiefeng Ma, Shuangzhe Liu, and Milind Sathye. 2019. Improved Covariance Matrix Estimation for Portfolio Risk Measurement: A Review. Journal of Risk and Financial Management 12: 48. [Google Scholar] [CrossRef] [Green Version]
- Tran, Tuan, Nhat Nguyen, Trung Nguyen, and An Mai. 2020. Voting shrinkage algorithm for Covariance Matrix Estimation and its application to portfolio selection. Paper presented at RIVF International Conference on Computing and Communication Technologies, Ho Chi Minh City, Vietnam, October 14–15; Manhattan: IEEE Publishing, pp. 1–6. Available online: https://ieeexplore.ieee.org/document/9140764 (accessed on 15 July 2020).
- Yang, Liusha, Romain Couillet, and Matthew R. McKay. 2014. Minimum variance portfolio optimization with robust shrinkage covariance estimation. Paper presented at 2014 48th Asilomar Conference on Signals, Systems and Computers, Pacific Grove, CA, USA, November 2–5; pp. 1326–30. [Google Scholar]

| Estimators | Portfolio Performance Metrics | ||||||
|---|---|---|---|---|---|---|---|
| Portfolio’s Return (Annually) | Sharpe Ratio | Jensen’s Alpha | Winning Ratio | Portfolio’s Risk (Annual Volatility) | Portfolio Turnover (Daily) | Maximum Loss | |
| VN-Index | 13.00% | 0.6 | −0.18% | 55.31% | 17.03% | 0.10% | −45.34% |
| N = 50 | |||||||
| 1/N portfolio | 9.55% | 0.45 | −1.41% | 56.01% | 15.64% | 1.03% | −41.63% |
| SC | 13.87% | 0.84 | 4.86% | 54.41% | 12.02% | 3.01% | −38.46% |
| SI | 13.46% | 0.73 | 2.52% | 56.66% | 14.04% | 1.12% | −36.35% |
| Shrinkage | 13.55% | 0.82 | 3.05% | 54.73% | 11.95% | 3.59% | −38.6% |
| N = 100 | |||||||
| 1/N portfolio | 12.35% | 0.66 | 1.84% | 57.11% | 14.12% | 0.99% | −39.36% |
| SC | 11.93% | 0.8 | 4.38% | 54.26% | 9.86% | 4.11% | −27.64% |
| SI | 14.75% | 0.9 | 4.59% | 57.52% | 12.25% | 1.15% | −32.39% |
| Shrinkage | 12.69% | 0.89 | 5.06% | 54.81% | 9.63% | 3.65% | −25.81% |
| N = 200 | |||||||
| 1/N portfolio | 15.53% | 0.98 | 5.79% | 59.02% | 12.09% | 1.02% | −31.47% |
| SC | 12.69% | 1.01 | 6.07% | 55.01% | 8.68% | 5.99% | −28.86% |
| SI | 17.43% | 1.26 | 8.08% | 59.52% | 10.48% | 1.11% | −25% |
| Shrinkage | 14.28% | 1.26 | 7.56% | 55.11% | 8.07% | 4.47% | −21.86% |
| N = 350 | |||||||
| 1/N portfolio | 18.27% | 1.3 | 9.00% | 59.62% | 10.69% | 0.54% | −22.63% |
| SC | 13.95% | 0.85 | 4.89% | 55.01% | 11.9% | 2.81% | −38.76% |
| SI | 20.02% | 1.56 | 10.80% | 60.97% | 9.80% | 1.10% | −20.76% |
| Shrinkage | 18.57% | 1.85 | 11.84% | 57.87% | 7.48% | 4.38% | −16.73% |
| Performance Metrics | The size of Portfolio (N) | |||
|---|---|---|---|---|
| 50 | 100 | 200 | 350 | |
| Portfolio’s return (Annually) |  | 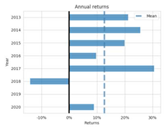 | 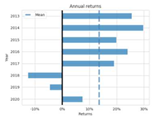 |  |
| Sharpe ratio |  | 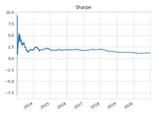 |  |  |
| Portfolio turnover (daily) | 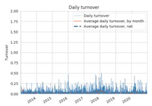 |  |  |  |
| Maximum loss | 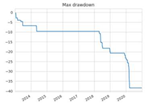 | 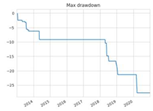 | 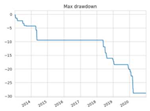 | 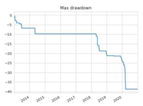 |
| Performance Metrics | The Size of Portfolio (N) | |||
|---|---|---|---|---|
| 50 | 100 | 200 | 350 | |
| Portfolio’s return (Annually) | 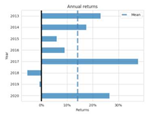 | 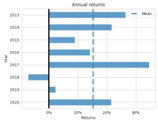 | 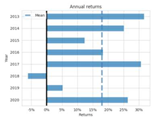 | 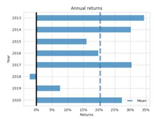 |
| Sharpe ratio | 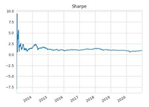 | 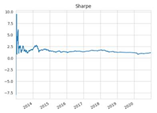 | 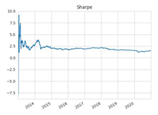 | 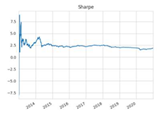 |
| Portfolio turnover (daily) | 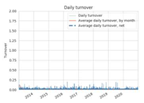 | 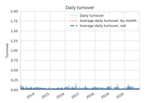 | 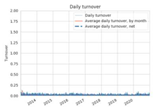 | 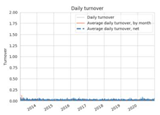 |
| Maximum loss | 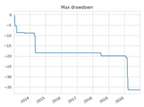 |  | 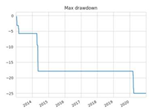 | 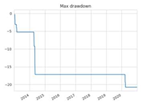 |
| Performance Metrics | The Size of Portfolio (N) | |||
|---|---|---|---|---|
| 50 | 100 | 200 | 350 | |
| Portfolio’s return (Annually) | 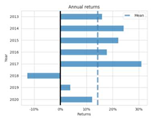 | 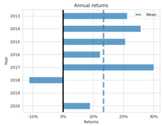 |  |  |
| Sharpe ratio | 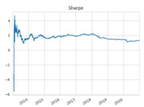 | 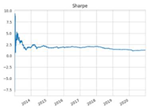 | 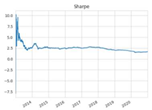 |  |
| Portfolio turnover (daily) |  | 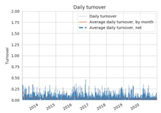 |  |  |
| Maximum loss | 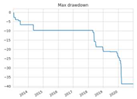 | 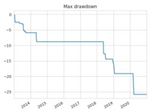 | 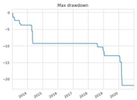 |  |
N = 50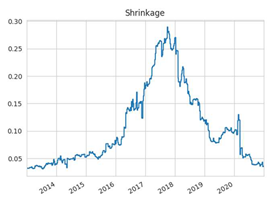 | N = 100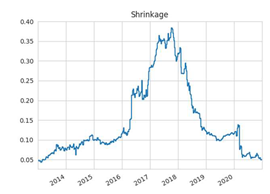 |
N = 200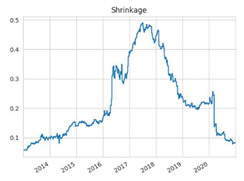 | N = 350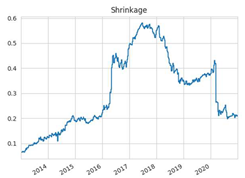 |
Publisher’s Note: MDPI stays neutral with regard to jurisdictional claims in published maps and institutional affiliations. |
© 2022 by the authors. Licensee MDPI, Basel, Switzerland. This article is an open access article distributed under the terms and conditions of the Creative Commons Attribution (CC BY) license (https://creativecommons.org/licenses/by/4.0/).
Share and Cite
Nguyen, N.M.; Nguyen, T.D.; Thalassinos, E.I.; Le, H.A. The Performance of Shrinkage Estimator for Stock Portfolio Selection in Case of High Dimensionality. J. Risk Financial Manag. 2022, 15, 249. https://doi.org/10.3390/jrfm15060249
Nguyen NM, Nguyen TD, Thalassinos EI, Le HA. The Performance of Shrinkage Estimator for Stock Portfolio Selection in Case of High Dimensionality. Journal of Risk and Financial Management. 2022; 15(6):249. https://doi.org/10.3390/jrfm15060249
Chicago/Turabian StyleNguyen, Nhat Minh, Trung Duc Nguyen, Eleftherios I. Thalassinos, and Hoang Anh Le. 2022. "The Performance of Shrinkage Estimator for Stock Portfolio Selection in Case of High Dimensionality" Journal of Risk and Financial Management 15, no. 6: 249. https://doi.org/10.3390/jrfm15060249
APA StyleNguyen, N. M., Nguyen, T. D., Thalassinos, E. I., & Le, H. A. (2022). The Performance of Shrinkage Estimator for Stock Portfolio Selection in Case of High Dimensionality. Journal of Risk and Financial Management, 15(6), 249. https://doi.org/10.3390/jrfm15060249