1. Introduction
It is well established that the high divisibility of indirect real estate investment vehicles enables a more affordable pathway for investing in real estate for all sizes of institutional investors (e.g., pension funds and insurance companies). Those vehicles allow investors to gain exposure to the real estate asset class (both locally and internationally) comparable to that of direct real estate investments (
Falkenbach and Hoesli 2017). In most cases, these real estate investment vehicles are also professionally managed, and within which portfolios are often diversified across various sectors, locations and life cycles. The majority of global institutional investors obtain their real estate exposure via the non-listed route (i.e., non-listed investment vehicles) such as non-listed funds, separate accounts and club deals (
Preqin 2018), rather than using publicly listed vehicles such as real estate investment trusts (REITs).
Investment decision-making and effective risk management require, of course, that sufficient information be available concerning those funds. The establishment of professional associations, such as the European Association for Investors in Non-Listed Real Estate Vehicles (INREV) in Europe, the Asian Association for Investors in Non-Listed Real Estate Vehicles (ANREV) in the Asia-Pacific and the National Council of Real Estate Investment Fiduciaries (NCREIF) in the US, has been a significant development in the non-listed real estate investment space. These self-regulatory professional bodies serve both researchers and investors, as their main objectives are to promote transparency, accuracy, accessibility and alignment of the interests of stakeholders, as well as being the main source of research and market information for non-listed real estate.
Non-listed real estate funds are a unique type of vehicle due to their highly unitised structure and privately traded status that provides them with the advantage of not being influenced by wider stock market volatility. They also allow investors to take advantage of high-quality fund managers’ experience and expertise in providing effective diversification strategies and robust real estate portfolio management practices. This is a key element in the financial management risk strategies required by institutional investors. Importantly, non-listed real estate funds also enable investors to tap into investment styles across a broad risk–return spectrum (i.e., core, value-add, opportunity) that are tailored to their objectives of investment and risk tolerance. This high level of flexibility and accessibility contributes significantly towards non-listed real estate funds’ popularity and acceptance by institutional investors. This sees over USD 5.7 T in real estate assets in non-listed real estate funds by the leading real estate investment managers in 2021 (e.g., Blackstone (USD 450 B), Brookfield (USD 309 B), PGIM (USD 150 B), Nuveen (USD 137 B), and MetLife (USD 135 B)) (
IPE 2021b). Non-listed real estate funds are actively supported by the leading institutional investors, with over USD 1.5 T invested in real estate (e.g., Allianz (USD 78 B; 6.0% of portfolio), APG (USD 54 B; 7.7% of portfolio), CIC (USD 54 B; 5.1% of portfolio), ADIA (USD 48 B; 7.5% of portfolio), CPPIB (USD 43 B; 9.1% of portfolio), CalPERS (USD 37 B; 9,4% of portfolio), and CalSTRS (USD 37 B; 12.5% of portfolio) (
IPE 2021a). This sees real estate as a significant asset class for accessing the greater than USD 81 T in AUM in institutional investor portfolios in 2021. Typically, real estate accounts for up to 10% of these portfolios (
Forbes 2021;
IPE 2021b;
OECD 2021;
Sovereign Wealth Funds Institute 2021), with a strong support for non-listed real estate funds by pension funds, insurance companies and sovereign wealth funds. Non-listed real estate funds are also popular with smaller institutional investors as they provide effective real estate exposure, where these smaller institutional investors are unable to access club deals and separate accounts which their larger counterparts can. In particular, they provide opportunities for effectively investing in real estate in the developed and emerging real estate markets in Asia; this includes the highly sophisticated Japanese real estate market (
ANREV 2021a,
2021b).
As mentioned previously, the implementation of non-listed real estate funds can go beyond just facilitating capital flows into new, high-quality commercial real estate assets (i.e., core real estate), but also play a significant “value-added” role in the aspects of rejuvenation and revitalisation of commercial real estate assets. This is where non-listed real estate funds specialising in the value-add strategy are fundamental, whereby investors can tap into a specialist team of professional managers with deep real estate experience and expertise dedicated to identifying, sourcing and managing value-add real estate investment opportunities, with the objective of generating higher profits on investments. Major real estate investment managers who have been successful in delivering this value-add strategy include LaSalle, CapitaLand, AEW, Hines, CBRE Global Investors, Generali, GLP, Allianz, Morgan Stanley, PGIM and Blackrock (
IPE 2021b). Japan is at the forefront of this value-added implementation of non-listed real state funds, not only due to its greater economic prowess and vibrant commercial real estate market, but also in the context of channelling private capital into the commercial real estate’s revitalisation process.
Even though the Japan commercial real estate investment market has, in general, seen a number of scholarly papers in the past, they are concentrated largely on its listed real estate investment segment. No previous study has explored country-specific real estate investment opportunities via non-core real estate funds such as value-add real estate funds in Japan. More significantly, some of the unique features of value-add real estate funds are yet to be fully understood by investors, even though there is renewed investors’ interest due to their attractive risk–return characteristics. Hence, there is a significant knowledge gap concerning the non-listed value-add real estate funds’ risk-adjusted performance and portfolio diversification benefits in an institutional investors’ portfolio. This is particularly true in the case of specific countries (e.g., in Asia); and in the case of this paper, for Japan.
Based on this premise, the research in this paper is driven by several key motivations: (1) the popularity of non-listed real estate funds as an institutional conduit to invest in real estate, (2) the renewed investment interest in using non-listed real estate funds positioned higher on the risk–return curve, and (3) the increasing significance of non-listed real estate funds’ role in the aspects of real estate assets’ revitalisation process (i.e., value-add properties). As non-listed real estate funds are an important institutional investor pathway to real estate investment, it is essential that investors and market participants are informed of their risk-adjusted performance and diversification benefits. The aim of this research is to provide a rigorous empirical investigation to highlight the unique investment opportunities offered by non-listed value-add real estate funds in Japan, establish their investment significance and empirically examine their investment performance against other asset classes. Specifically, this research proposes two research questions (RQ):
- RQ1:
How do Japan non-listed value-add real estate funds compare to the major asset classes on a risk-adjusted basis?
- RQ2:
Do Japan non-listed value-add real estate funds provide added-value and diversification benefits in a mixed-asset portfolio framework?
By addressing these two research questions, this will provide an independent investigation of the investment characteristics of Japan’s non-listed value-add real estate funds that will assist real estate investors in the style of their investment decisions that are tailored with their investment mandate, and in particular, the possibility of achieving stronger performance beyond the conventional core real estate investment strategy. Further, the authors are hopeful that this research will prompt a wider empirical discussion on commercial real estate investment opportunities for institutional investors using non-core real estate funds, which, to date, is largely limited to the core real estate investment strategy.
2. Literature Review
Even though the Japanese commercial real estate investment market has in general seen a number of scholarly papers in the past, they are concentrated largely on its listed real estate investment segment (e.g., J-REITs and real estate operating companies (REOCs)). These studies have empirically investigated the listed real estate sector (J-REITs in particular) across a wide range of topics, related to its investment performance characteristics (
Newell and Peng 2012) including its various sub-sectors (
Cho 2017;
Lin et al. 2019), the application of machine learning forecasting models (
Loo 2020), the impact of seasoned issuance of shares (
Ong et al. 2011), J-REIT takeovers (
Ma and Michayluk 2015), J-REIT IPO pricing (
Kutsuma et al. 2008), sponsor ownership (
Tang and Mori 2017), and debt information and refinancing activities on their performance (
Tang et al. 2011).
More broadly, there have been a number of important studies providing crucial information on the performance and characteristics of non-core real estate funds, especially since it has been established that investment style provides significant explanatory power over their performance (
Delfim and Hoesli 2016,
2019). These studies have mainly focused on US and Europe non-listed real estate funds, (including
Anderson et al. 2016;
Bollinger and Pagliari 2019;
Fisher and Hartzell 2016;
Fuerst and Matysiak 2013;
Gang et al. 2020;
Hahn et al. 2005;
Kiehelä and Falkenbach 2015;
Krautz and Fuerst 2015;
Morri et al. 2021;
Pagliari 2020;
Shilling and Wurtzebach 2012;
Xing et al. 2010), with a number of these papers drilling into specifics around non-listed real estate fund style, particularly non-core. The general research consensus is that non-core funds (i.e., value-add funds, opportunity funds) gave no discernible performance advantage over their core counterparts, plausibly due to higher fees, lesser effective management of funds (
Bollinger and Pagliari 2019), and excessive exposure to leverage (
Morri et al. 2021;
Pagliari 2020). This is in addition to empirical evidence showing non-core funds’ returns were more volatile (
Mansley et al. 2020), although they exhibited significant integration with direct real estate returns (
Anderson et al. 2016).
Whilst
Mansley et al. (
2020) considered style classifications for non-listed real estate funds across Asia, there is limited country-specific research in the literature for non-listed real estate funds in Asia. For China’s non-listed real estate funds, superior risk-adjusted performance and enhanced diversification benefits of non-listed real estate funds were observed (
Cho 2018), while
Gupta and Newell (
2021) and
Gupta et al. (
2018,
2020) considered the risk factors and capital flows to India’s non-listed real estate funds, but with no supporting empirical performance analysis.
3. Significance of Japan’s Commercial Real Estate
3.1. Japan: General Profile
As the world’s fourth largest country by gross domestic product (GDP) (second largest in Asia after China), with a USD 5.1 trillion economy (
World Bank 2019), Japan is a highly advanced, free-market industrialised nation. Its predominantly service- and high-tech industry-oriented economic activities (accounting for 68% and 30% of total GDP, respectively) (
CIA 2022) are the pillars of the country’s high-income economy. Japan’s economic performance has been positive by historical standards since the 2007–2009 global financial crisis (GFC), although it recorded a contraction in 2020 due to the global recession caused by the COVID-19 pandemic. The 2.8% domestic unemployment rate amongst its 125 million population is much lower than its OECD peers’ average at 7.3%, indicating the importance of household spending and private consumption as the major drivers for its ongoing economic surplus in recent years (
CIA 2022;
IMF 2020). Importantly, Japan has many economic and institutional qualities that are consistent with its advanced economy status. For example, Japan is the third most competitive economy amongst the Asian markets (global competitiveness ranking: #6), exceeded only by Singapore (#1) and Hong Kong (#3) (
WEF 2020). Japan’s strong economic stature is further supported by its strong institutional qualities; for example, it is considered as the fifth least corrupt Asia-Pacific country in the
Transparency International (
2020) Corruption Perception Index and ranked in 15th place in the
World Bank (
2020) Government Effectiveness Index.
Table 1 profiles the social, economic and real estate context of Japan.
3.2. Japan’s Real Estate Profile
Japan’s sophisticated USD 2.2 trillion commercial real estate market is the third largest in the world, after the US and China, accounting for 22% and 7% of the Asia-Pacific and the global real estate markets, respectively (
EPRA 2021). Its commercial real estate market is also regarded as “transparent”, ranked by
JLL (
2020) as the 16th most transparent real estate market in the world. Importantly, Japan has a vibrant USD 277 billion listed real estate investment space (comprising both REOCs and J-REITs), being the second largest in the world and constituting 13% of the size of its commercial real estate market. These listed real estate investment vehicles contribute approximately 4% of the Tokyo Stock Exchange’s (TSE) USD 6.8 trillion market capitalisation (
EPRA 2021). There was a total of sixty-four active Japanese REITs trading on the TSE market platform in 2020, with the Japan REIT market first established in September 2001. The J-REIT market is the second largest REIT market globally, only exceeded by the US REIT market. Leading J-REITs include the Nippon Building Fund, Nippon ProLogis, Japan REIT and GLP J-REIT. This is in addition to the Real Estate Operating Companies (REOCs) in Japan, which often act as sponsors for these J-REITs; these leading REOCs include Mitsubishi Estate, Mitsui Fudosan, Sumitomo Realty & Development, and Tokyo Land.
At USD 192 billion, transaction volumes in the Japanese commercial real estate market over the five-year period to 2020 have been significant, comparing favourably against the other global real estate markets such as the US (total transaction volumes: USD 2 trillion), Germany (USD 366 billion), UK (USD 313 billion) and France (USD 211 billion). Tokyo, Osaka and Yokohama have become the popular destinations for these investment activities, with the five major cities in Japan cumulatively absorbing over USD 153 billion in volume. Whilst domestic capital flows remain the centrepiece of real estate investment activity in Japan, there has been a rising trend in interest from overseas investors, as cross-border capital deployment accounted for about a third of this five-year transaction volume. The sources of these inbound capital flows were diverse and included real estate investors from regional countries such as Hong Kong, Singapore and China, as well as real estate investors from major countries such as the United States and France. Capital inflows to Japan’s commercial real estate transactions over this period were originated from a full range of real estate investors, but were predominantly private equity funds, REITs and REOCs, with prominent global players such as Blackstone, GIC, LaSalle, M&G, Invesco, Morgan Stanley, AXA, Mapletree and CapitaLand actively involved. The traditional real estate sectors continued to dominate the real estate acquisition investment activities in Japan over 2016–2020, with the office sector (49% of total transaction volume) and retail sector (15%) accounting for the larger shares of all transactions over this five-year period (
RCA 2021).
Table 2 presents the five-year commercial real estate transaction statistics for Japan.
Whilst Japan has seen a stagnant economy for many years and has unfavourable demographics due to its aging population, there are key reasons for investing in commercial real estate in Japan. These include being relatively attractive due to the yield gap, highly stable income returns from high-quality tenants, being politically and economically stable, large size and sophistication of the Japan real estate market, and being an important real estate market for investors as part of a global portfolio (
Sumitomo Mitsui Trust Research Institute 2020).
Overall, the Japanese real estate market provides sophisticated investment opportunities for institutional investors due to its scale, maturity, openness and transparency. Its investment stature is marked by strong real estate investor activities and the availability of multiple investment routes to tap into its substantial commercial real estate markets. However, a key investment issue is that many of the high-quality core real estate assets in Tokyo (e.g., in Marunouchi) are tightly held by the leading REOCs in Japan, resulting in very limited transactions in the core real estate space. As such, value-add real estate takes on increased importance in Japan as a commercial real estate investment opportunity for institutional investors seeking exposure to the Japanese real estate markets.
3.3. Non-Listed Value-Add Real Estate Funds
Non-listed real estate funds possess different investment styles across the broad investment risk–return spectrum, either prioritising a defensive investment strategy at the lower end of the spectrum (i.e., core) or pursuing an aggressive high growth strategy at the higher end of the risk–return scale (i.e., opportunity). The choice of investment strategy allows non-listed real estate funds to populate their portfolios with real estate assets at various stages in their life cycles, employ various value enhancement strategies, and implement different leverage levels to enhance the overall fund’s investment mandate and performance (
INREV 2012). This, in return, defines the investment style of non-listed real estate funds. Typically, investors are able to choose between three main styles—core, value-add and opportunity—based on their risk–return preference and fund mandate. The details and characteristics of each investment style of non-listed real funds are described below:
Core real estate is considered the least risky investment, with strategies including the acquisition of income-producing high quality commercial real estate assets with high quality tenants, high occupancy rates, limited exposure to speculative real estate assets (less than 5% of GAV) and low leverage levels (less than 40% of GAV). The core-plus style shares the same features as the core style, but with more emphasis on certain enhancements in rental income than the latter. Traditionally, core real estate was the main component of institutional investors’ real estate portfolios.
Value-add real estate aims to provide investors with enhanced total returns using a balanced income (income-producing assets = 50–70% of GAV) and capital appreciation approach (speculative assets accounting for less than 25% of GAV) with moderate use of leverage (40–60% of GAV). The typical life of a value-add real estate fund is up to 7 years, with target returns of up to 20%. A number of real estate asset enhancement strategies, such as active risk management, refurbishment, repositioning and some redevelopment activities, are carried out to add value to the real estate portfolio. Poorly managed assets which are not fully leased or are leased at below market rent are also part of the value-add real estate space. Increasing the real estate asset cash-flow by renovation is also an effective value-add strategy.
Opportunity real estate involves the acquisition of non-traditional real estate that requires extensive development or redevelopment, as well as intensive expert management to enhance its value. Being the riskiest real estate style, the total return is contributed mostly by capital appreciation (speculative assets = 60%+ of GAV), with much less focus on the income stream. This investment style also uses moderate to high financial leverage (60%+ of GAV).
As described above, compared to the core investment strategy, the value-add strategy allows for a more ambitious risk–return expectation and therefore a higher contribution of the portfolio’s capital appreciation component in the fund’s total return delivery. This is made possible as assets are not at their highest and best use (i.e., functional obsolescence); thus, they are likely to be able to be acquired at discounted prices, to which various value-enhancement strategies are then employed to increase the value of these assets. This reflects the need for a higher level of leverage to cover these capital expenses.
The emergence of real estate investment vehicles providing exclusive exposure to this value-add investment style is a key milestone in facilitating a greater variety in real estate investment opportunities, especially in the current context of a low interest environment and strong competition in the core real estate investment space. Investing in these non-listed value-add real estate funds is expected to deliver the performance of the underlying real estate assets, coupled with the value-enhancing skills and strategies of the investment managers. This has resulted in the creation of many Japan-focussed non-listed value-added real estate funds by major real estate investment players.
Table 3 lists some of these Japan-focussed non-listed real estate funds, including core, value-add and opportunity fund-style strategies by leading international real estate investment managers (e.g., LaSalle), leading regional players (e.g., Mapletree, GLP, PAG, ESR) and local Japan real estate investment managers (e.g., Fortress, Aetos).
3.4. Institutional Investor Intentions for Real Estate Investment in Japan
Globally, there has been increased interest in recent years in value-add real estate over core real estate for each year of 2015–2020, although this slowed in 2021 due to the impact of COVID-19, when investors sought lower risk profiles (
INREV 2021). Specifically, for Japan, there has been less impact from COVID-19 than in the US and Europe, but this still saw a significant reduction in economic activity to control for the impact of COVID-19 (
CBRE 2021a,
2021b). There was still strong institutional investor support for Japanese real estate in 2019–21, as well as local investors seeing an appetite for new real estate funds and acquiring new properties (
CBRE 2021a;
Sumitomo Mitsui Trust Research Institute 2020). In 2022, value-add real estate was the preferred style ahead of core real estate amongst Asia-Pacific investors. Similarly, Tokyo was the preferred investment destination, ahead of Shanghai, Singapore and Sydney (
CBRE 2022). This sets a strong context for the ongoing importance of value-add real estate in Japan, with subsequent sections of this paper focusing on getting this exposure via non-listed value-add real estate funds in Japan.
Overall, this section has established the significant stature of the Japanese real estate market and the importance of non-listed value-add real estate funds for the seamless deployment of investors’ capital in commercial real estate assets. The following sections will highlight the risk-adjusted performance, portfolio diversification benefits and portfolio value-added role of non-listed value-add real estate funds in Japan.
4. Methodology
4.1. Data Sources for Non-Listed Real Estate Funds
Annual total returns (in local currency: JPY (¥)) for non-listed real estate funds over the period of 2009–2020 were obtained for analysis. The principal dataset was sourced from ANREV (Association for Investors in Non-Listed Real Estate Vehicles). Based in Hong Kong with over 200 corporate members, ANREV is the professional association for non-listed real estate funds in Asia, with an agenda to improve the transparency and accessibility of non-listed real estate funds. This is achieved by enhancing understanding, promoting best practice and aligning interests, as well as being the authoritative source of research and market information on the non-listed real estate fund sector in Asia. ANREV is the equivalent of Europe’s INREV (European Association for Investors in Non-Listed Real Estate Vehicles), with ANREV complementing APREA (Asia-Pacific Real Estate Association) which covers the listed real estate space in Asia.
The ANREV annual index is a NAV-based total return index available for 2006–2020 and comprises 90 funds from over 30 major real estate fund managers with USD 136 B GAV at 2020, with steady growth in the number of funds and GAV since inception. The average gearing level across all funds was 24.5% at 2020. The real estate fund managers contributing to the ANREV index reflect both Asian players (e.g., Gaw, CITIC) and international players (e.g., CBRE Global Investors, LaSalle, Nuveen, M&G, PGIM, Tishman Speyer), across a range of real estate fund styles (core, value-added, opportunity). Inclusion criteria see at least 90% of the fund’s GAV required to be Asian real estate investments, independent of fund domicile. To be consistent with the other asset class performance measures, returns are post-tax and after accounting for fees and leverage (
ANREV 2021c). As well as the ANREV overall index, 13 sub-indices are available by style (3), country (4), region (2), structure (2) and sector (2). The ANREV annual index has improved considerably in depth and stature, comprising only 12 funds with USD 7.1 B GAV in 2005. An overall Japanese non-listed real estate index is produced as a specific country sub-index.
There were 29 Japan-focussed non-listed real estate funds, accounting for approximately 8.3% of the ANREV real estate fund universe, based on which the composite Japanese non-listed real funds total return index was constructed by ANREV. However, country-level sub-indices for Japan are not produced to identify sub-sector categories (e.g., by investment style) due to the smaller number of funds; thus, the unavailability of a total return series for analysis purposes for Japanese style-based strategies. For this reason, a bespoke index was constructed by the authors to represent the overall state and performance of Japan-focussed non-listed value-add real estate funds; as discussed in the next section.
4.2. Construction of the Bespoke Japanese Value-Add Real Estate Fund Index
While a Japanese real estate sub-index is available, more detailed sub-indices (e.g., by style) for Japan are not available from ANREV. Hence the authors produced a bespoke Japanese value-add real estate sub-index using the ANREV database “Analysis Tool” procedure, which requires a minimum number of three funds per year.
This “pure” Japanese value-add real estate fund sub-index only comprised funds which were 100% Japanese value-add real estate in the portfolio. The number of value-add funds tracked by this bespoke Japan-focussed non-listed value-add real estate fund index over 2009–2020 varied between three to ten funds, with GAV ranging between USD 1.2 billion and USD 5.9 billion being recorded. Individual funds comprising the index were de-identified for confidentiality reasons and the dataset did not include detailed fund-level returns. To the best of the authors’ knowledge, this is the first index that represents and evaluates the non-listed value-add real estate funds’ performance in Japan. This Japanese value-add index will form the focus of the risk-adjusted performance analysis in the next section of this paper.
Equivalent Japanese core real estate fund and opportunity real estate fund indices could not be produced due to the lack of sufficient fund numbers for both styles of Japanese non-listed real estate funds in many years over this timeframe of 2009–2020.
Institutional investors are also able to access pan-Asian multi-country value-add real estate funds that include Japan in their pan-Asian portfolio. Typically for non-listed value-add real estate funds, Japan accounts for 16% of the pan-Asian portfolio, compared to China (31%) and Singapore (34%) (
ANREV 2021a). However, this multi-country index could not be produced by the authors, as there were insufficient of these multi-country funds comprising Japanese value-add real estate in the portfolio in the ANREV database. As such, this sees the bespoke “pure” Japanese non-listed value-add real estate fund index developed by the authors as the primary index used in this paper.
Another important note is that this ANREV non-listed real estate fund series is constructed by using valuation-based net asset value (NAV) measures of individual funds tracked by the index. It is well documented in the literature that this exposes the non-listed real estate funds index to statistical issues related to valuation-smoothing and temporal lag due to the differences between the appraised value and the actual transaction price. These issues can cause a false impression of investment qualities of non-listed value-add real estate funds such as an unrealistically high return–risk relationship and diversification benefits. Therefore,
Geltner’s (
1993) de-smoothing filtering technique was employed using a de-smoothing parameter of α = 0.5 to reconstruct a higher resolution non-listed real estate funds total return series for the statistical analysis that accounted for the use of valuations. This resulted in one year of the total return data being used in the computation of this new de-smoothed non-listed value-add real estate funds series, effectively covering the period of 2010–2020.
4.3. Other Major Japanese Asset Classes
For comparative performance analysis and to gauge the effectiveness of non-listed value-add real estate funds in inter-asset diversification strategies, the annual total returns for major asset classes in Japan, namely stocks, bonds, direct real estate and listed real estate, were obtained for the same period. The annual total returns data were sourced from various databases such as the MSCI Japan direct real estate index (abbreviation: direct real estate), MSCI Japan stocks index (stocks), Financial Times Stock Exchange (FTSE)/European Public Real Estate Association (EPRA)/National Association of Real Estate Investment Trusts (NAREIT) Japan property index (listed real estate), ten-year interest-bearing government bonds (bonds) and the three-month Japan Government benchmark yield (cash). The MSCI Japan direct real estate index comprised 4340 properties valued at USD 227 B in December 2020 (
MSCI 2021). As the MSCI Japan direct real estate index was also valuation based, the de-smoothing procedure was also applied to this Japan direct real estate series.
One obvious limitation of the data utilized in this research is the limited time span of eleven years, corresponding to eleven annual observations, which may provide an inadequate coverage of the real estate or business market cycle. However, the period of 2010–2020 utilised in this study is crucial to assess the performance attributes of non-listed value-add real estate funds in Japan, as this period marked not only the increased confidence in the global capital markets, but also a series of adverse economic events that took place since the GFC (e.g., European sovereign debt crisis, Brexit, US-China trade war, COVID-19 pandemic).
4.4. Statistical Analysis
For both Japanese non-listed value-add real estate funds and other asset classes, average annual returns, risk and risk-adjusted returns via the Sharpe ratio were calculated individually for each asset class over the full eleven-year period of 2010–2020. To assess the relationship between fund performance and macroeconomic factors, we also regressed fund performance on the change in gross domestic product (GDP) and the change in the consumer confidence index. The correlation coefficient of returns analysis was utilised to statistically assess the relationship of these assets’ annual returns to identify portfolio diversification effectiveness, with lower correlation values indicating higher portfolio diversification potential. The correlation analysis results are presented in the inter-asset correlation matrix format for comparison purposes.
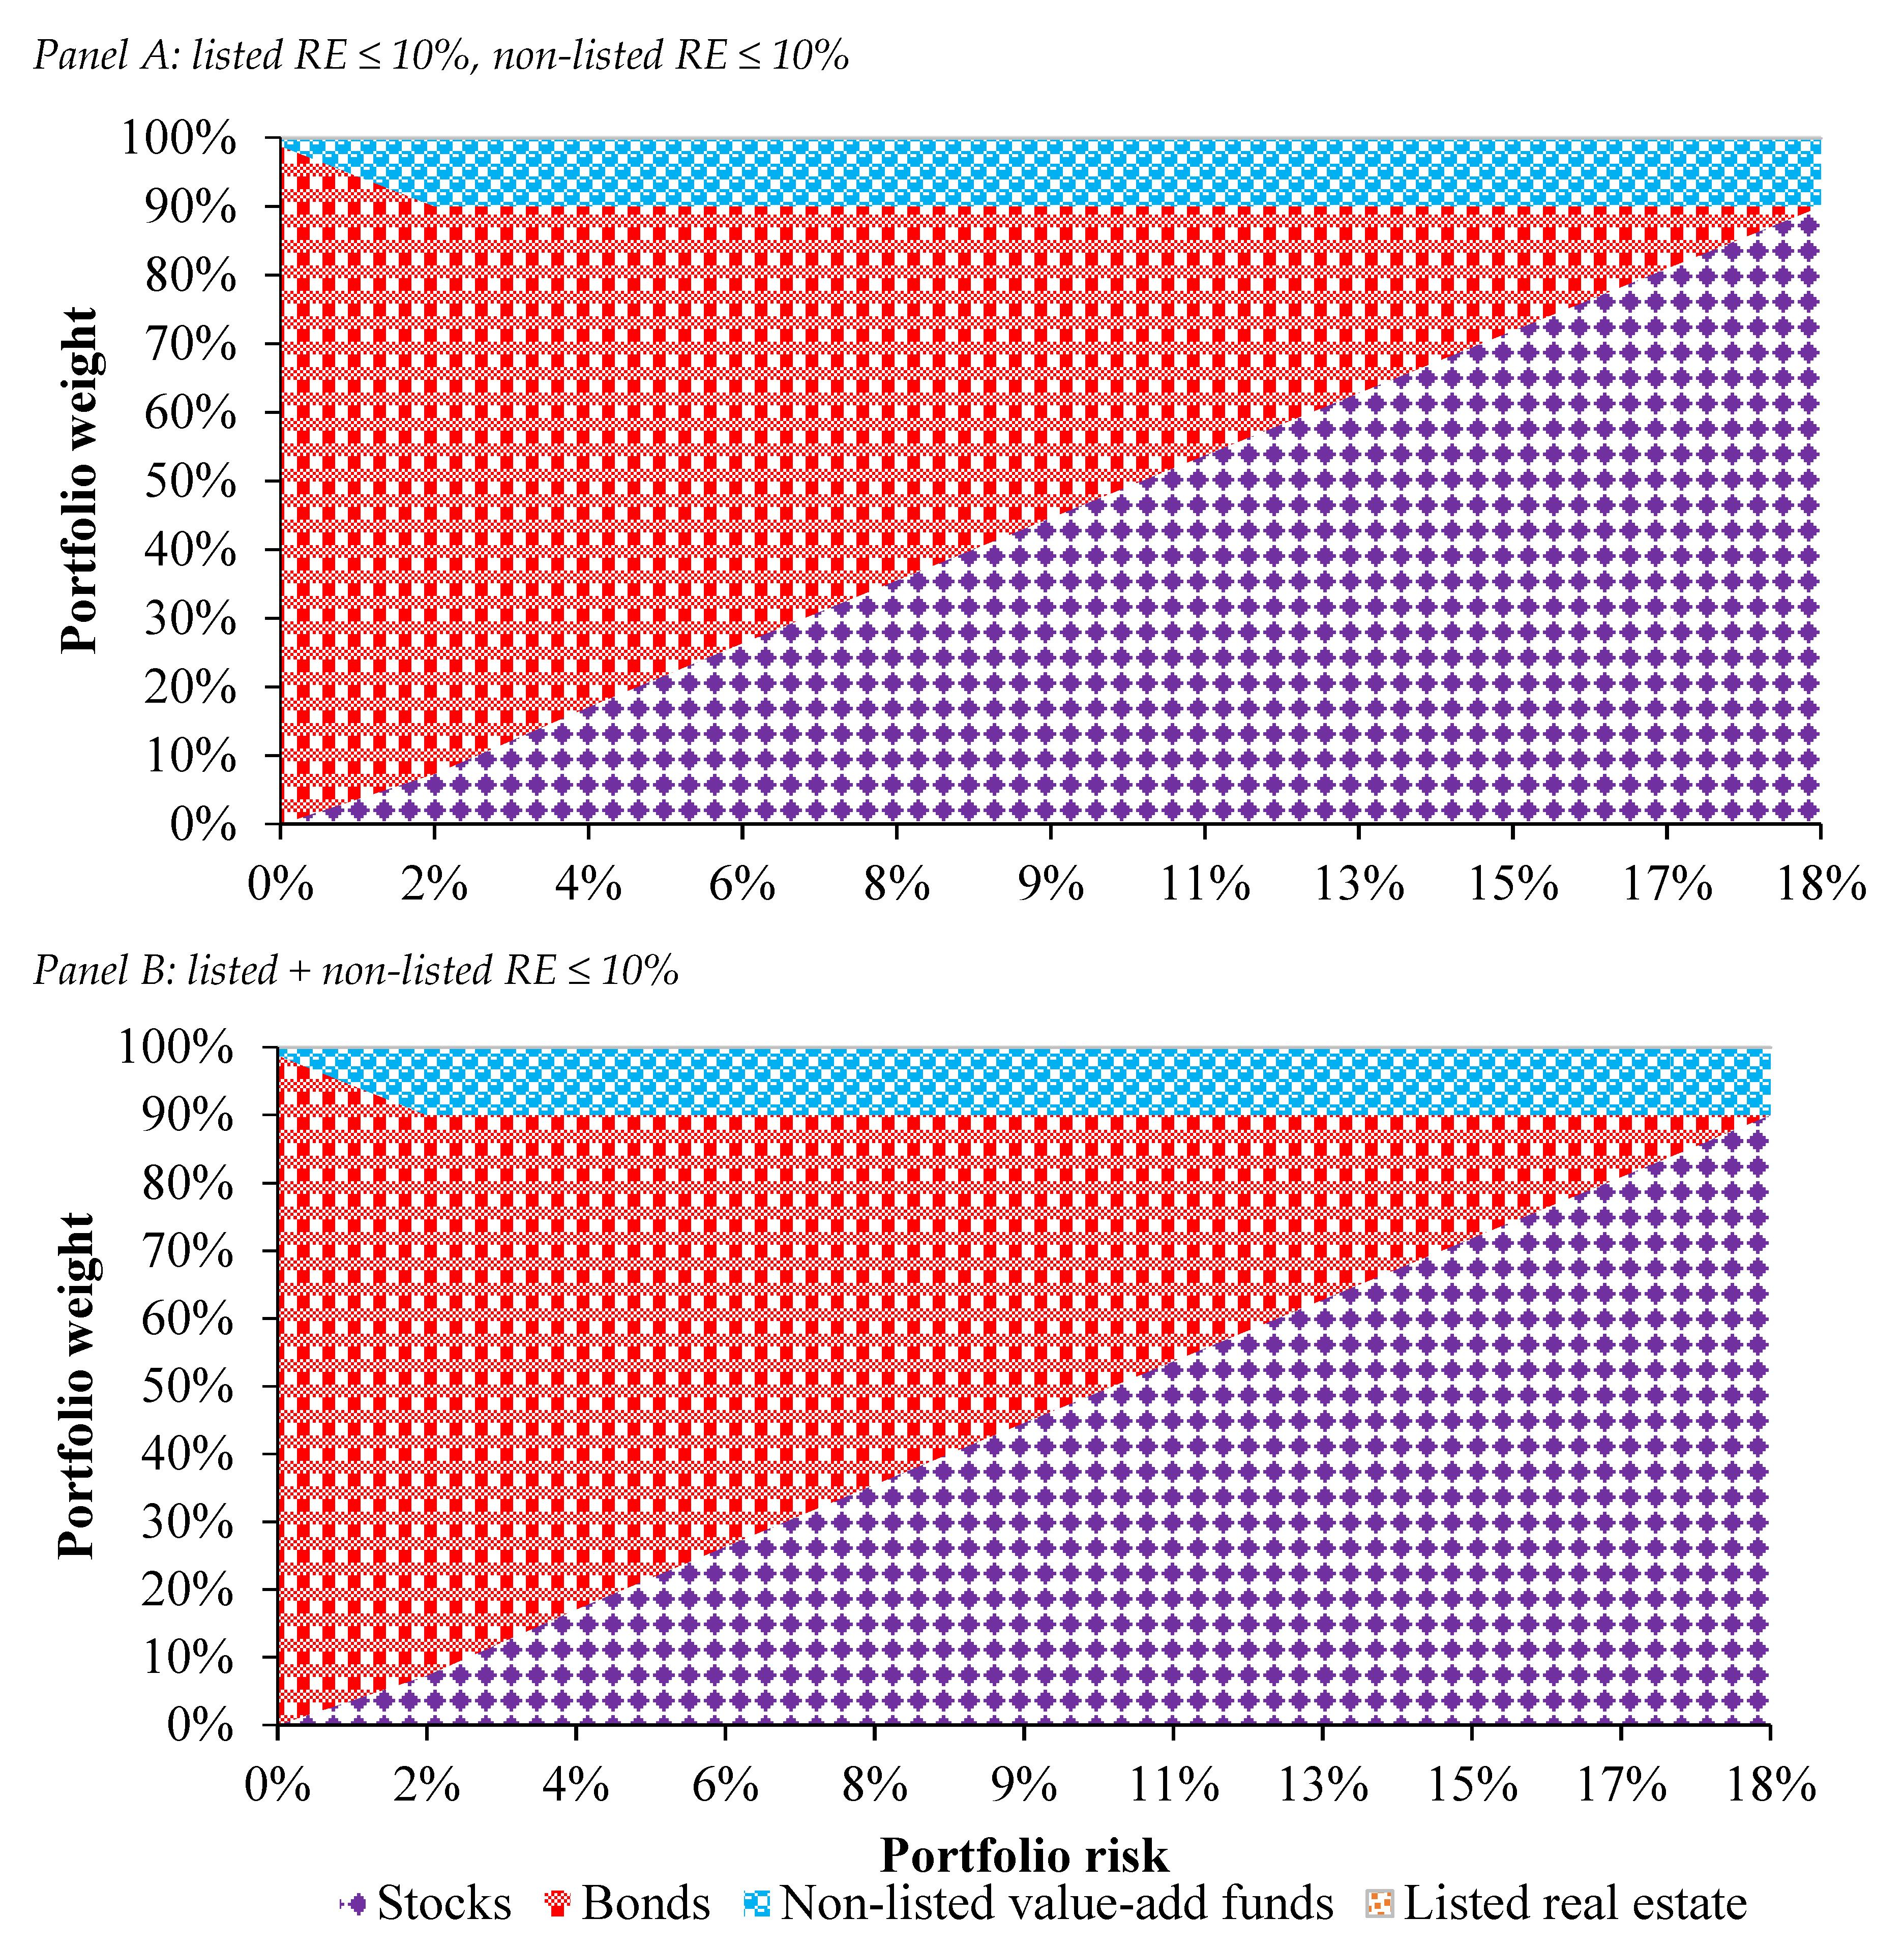
The final analysis involved the construction of mixed-asset portfolios using Markowitz’s mean-variance portfolio technique derived from the assets’ total returns. The purpose of this analysis was to examine the risk–return impact of adding the non-listed Japanese value-add real estate funds in a portfolio composed of mainstream Japan asset classes. The results of this mixed-asset portfolio analysis were presented in the form of asset allocation diagrams to assess the role and contribution of non-listed Japanese value-add real estate funds in mixed-asset portfolios. The allocations to listed real estate and real funds are capped at 10% each. This is to reflect the typical suggested allocation that has been reported in the literature (
Hoesli et al. 2004). We also perform the analyses with a 10% cap on the combined allocation to real estate to be more in line with the actual allocations by institutional investors (
PREA 2022).
5. Performance Analysis
5.1. Risk-Adjusted Returns
Table 4 presents the risk-adjusted performance analysis of non-listed Japanese value-add real estate funds and other asset classes over 2010–2020. Over this eleven-year period, non-listed value-add real estate funds have provided competitive performance relative to the other major asset classes, reflecting their high desirability as an asset class with strong investment fundamentals. In terms of the average annual return performance, non-listed value-add real estate funds (15.54% p.a.) managed to outperform other assets significantly, while the composite non-listed real estate funds (15.00% p.a.) exceeded the other mainstream asset classes, with a significant performance margin. At 6.64% p.a., the performance of direct real estate can be used to reflect the expected returns of a non-listed core real estate fund (although of course core funds would use leverage that is not reflected by the direct real estate benchmark), thus highlighting the significant performance spread in favour of non-listed value-add real estate funds in Japan.
In this current highly uncertain investment environment, the analysis shows the majority of asset classes exhibited significant levels of volatility. Despite being positioned on the riskier spectrum, non-listed value-add real estate funds show marginally less volatile total return delivery (annual risk: 12.85%) in this eleven-year investment period than their composite counterpart (16.68%) and are significantly less volatile compared to listed assets such stocks (19.90%) and listed real estate (29.52%). The results also indicate direct real estate (2.23%) as the second least volatile amongst these asset classes, exceeded only by bonds (0.49%). Overall, this comparatively low risk level observed in these non-listed value-add real estate funds indicates their ability to produce more stable and reliable returns for investors, reflecting their portfolio of income-producing commercial real estate.
Whilst direct real estate had lower risk than the non-listed real estate funds, it is much more difficult for institutional investors to use direct real estate to deliver their real estate strategy; particularly at an international level. This reflects lack of diversification issues via direct real estate investment, which can be more effectively achieved via a non-listed real estate fund. Similarly, while the risk measure used has involved the standard deviation as the standard measure of risk, it is important to recognise the other dimensions to investment risk that need to be considered by institutional investors; particularly concerning real estate. This specifically relates to legal risk, ownership risk, planning risk, exit strategies, governance, transparency and political risk. These aspects are well established, in the mature, transparent, well-developed and sophisticated Japanese real estate market, given its long history of real estate investment at an institutional investor level by real estate investment managers. These qualitative factors are more likely to be of major concern of financial risk management for institutional investors when considering international real estate investment in other Asian emerging markets that do not have this substantial track record or legal structures for controlling real estate risk, e.g., China.
Using the three-month yield as a proxy for risk-free investment, the Sharpe ratios of these asset classes were calculated to benchmark their risk-adjusted performance, with a higher ratio indicating stronger excess investment returns per unit of risk. Over this period of eleven years, the results show that non-listed value-add real estate funds in Japan were the second best-performing asset class (Sharpe rank: #2) on the Sharpe ratio risk-adjusted return basis, outclassing the other mainstream asset classes such as bonds (#3), composite non-listed real estate funds (#4), stocks (#5) and listed real estate (#6), outperformed only by direct real estate (#1). Importantly, this analysis shows tenets of the risk–return relationship in that investment in non-listed value-add real estate funds was able to generate high return premiums to offset their investment volatility. A similar characteristic can be observed in both direct real estate and bonds, as both managed to record Sharpe ratios of higher than 1.0.
We also regressed value-add fund returns on the change in GDP and in the consumer confidence index. The regression yielded an adjusted R2 of 16.1%. GDP has a positive and significant (at the 90% confidence level) impact on fund returns whereas the change in consumer confidence does not affect returns significantly. The results were found to lack significance when similar analyses were undertaken for all real estate funds and for stocks. Whereas the positive relationship between fund returns and GDP growth is interesting and as expected, caution has to be exercised so as not to over interpret those results, given the low number of observations used in the regression model. In particular, the limited number of observations does not make it possible to examine the relationships between real estate fund returns and the returns of other asset classes at different points in their joint return distributions (as examined, for instance, by
Knight et al. 2005).
5.2. Diversification Benefits
The correlation analysis for Japanese non-listed value-add real estate funds over 2010–2020 is presented in
Table 5. Over this eleven-year period, non-listed value-add real estate funds were found to offer investors with moderate diversification benefit potential with the other mainstream asset classes. For example, modest correlation coefficients were recorded between non-listed value-add real estate funds with the stock market (correlation coefficient, r = 0.40) as well as with listed real estate (r = 0.04), providing meaningful diversification benefits for institutional investment portfolios. This is in contrast to listed real estate, given its negligible diversification potential with the stock market (r = 0.71). As expected, non-listed value-add real estate funds showed a strong correlation with direct real estate (r = 0.70), indicating strong direct real estate performance delivery in this non-listed fund structure, despite the higher risk–return level for this investment strategy. This sees limited diversification advantages by mixing these two methods of real estate investment in a portfolio, with the non-listed real estate fund structure being easier to implement for most institutional investors than a direct real estate strategy in Japan. Crucially, the negative correlation between non-listed value-add real estate funds and one of the commonly held asset classes, bonds (r = −0.29), signifies the possibility of a stronger performance delivery in a multi-asset investment framework, especially for some institutional investors in Japan with their significant allocations in government bonds. This correlation coefficient analysis also offers some perspectives into the performance trends between non-listed value-add real estate funds and the composite non-listed real estate funds in Japan. For example, the analysis highlights some differentials in total return movements over the 2010–2020 period, where the value-add-focussed real estate funds delivered higher total returns, whilst being less volatile.
5.3. Mixed-Asset Portfolios
The strong performance characteristics exhibited by non-listed value-add real estate funds in Japan in the previous analysis presents the possibility for their effective strategic deployment in a mixed-asset investment portfolio by institutional investors. To test this hypothesis and address RQ2, two constrained asset allocation procedures were performed, whereby in the constrained portfolio (1), allocations in non-listed value-add real estate funds and listed real estate were each capped at 10%, while the constrained portfolio (2) applied a narrower allocation limit in total allocation for real estate, in which the cumulative allocation in non-listed value-add real estate funds and listed real estate cannot exceed 10% at any point of the portfolio risk–return spectrum. The main purpose of this constrained portfolio analysis is to replicate the actual real estate asset allocation in institutional investor portfolios, with an average of approximately 10% allocated to real estate (
IPE 2021a).
Figure 1 presents the results of this portfolio analysis for both portfolio (1) (Panel A) and portfolio (2) (Panel B). In the portfolio (1) scenario, non-listed value-add real estate funds were able to maintain their presence in the portfolio compositions at the maximum 10% level across the vast majority of the portfolio risk–return spectrum (except at the lowest portfolio risk levels), while listed real estate was excluded entirely. In the portfolio (2) scenario, in which the total commercial real estate allocation was upper-bound capped at 10%, non-listed value-add funds were still capable of achieving this 10% allocation across the vast majority of the allocated portfolio space (except at the lower portfolio risk levels) due to their superior risk-adjusted performance and more efficient correlation structure over listed real estate. In line with the allocation cap imposed on real estate allocation in these two scenarios, both portfolios also show higher exposure in government bonds in conservative portfolios and a gradual increase in stock allocations proportionate to the risk–return scale. Overall, in addressing RQ2, the results indicate that institutional investors were able to harness the unique performance characteristics of non-listed value-add real estate funds when they were formulating their portfolio investment strategy.
Whilst past performance is not indicative of future performance, this empirical analysis has provided significant investment insights for institutional investors in shaping their real estate exposure; particularly, concerning the viability of using Japanese non-listed value-add real estate funds as a real estate investment conduit for effective real estate exposure in Japan.
6. Discussion
The ability to generate superior returns on investment has always been the key objective of institutional investors. The current challenging investment environment has resulted in investors searching for alternatives that have the capability of delivering long-term outperformance for their real estate portfolios. This renewed investors’ interest has opened the door to non-core real estate investment offerings, and non-listed real estate funds are at the forefront of this structural change, as their flexible investment structure allows them to tailor for the specific needs of institutional investors across a broad spectrum of risk and return levels. It also reflects the difficulties typically experienced in seeking exposure to core direct real estate assets in Japan, with these core real estate assets tightly held by the major Japanese real estate players (e.g., J-REITs and REOCs).
At the heart of this research are the two research questions (RQ 1 and RQ 2) regarding the investment viability of non-listed value-add real estate funds in Japan, specifically aimed at empirically investigating their performance attributes. To address these two research questions, a comprehensive bespoke benchmark index was developed by the authors using the ANREV database to reflect the broad performance of Japan-focussed non-listed value-add real estate funds. The results of the analysis provide a crucial empirical validation for non-listed value-add real estate funds as a high-calibre vehicle for exposure to the real estate asset class in Japan over 2010–2020. Whilst past performance is no guarantee of future performance, investors can benefit from non-listed value-add real estate funds’ total return-focussed attributes as they delivered the strongest absolute total return performance, offsetting the added volatility associated with the riskier investment strategy, which resulted in comparatively superior risk-adjusted returns against the majority of the asset classes. In addition, value-add real estate funds were found to be significantly related to changes in GDP. Further, the level of diversification benefits offered by non-listed value-add real estate funds in Japan was observed to be highly desirable from an investment standpoint, particularly for investors with existing substantial portfolios of stocks and bonds, with this often being the case for pension funds in Japan. This evidence provides a crucial empirical justification for the inclusion of non-listed value-add real estate funds in Japan in the portfolio of institutional investors.
This issue takes on increased importance in Japan currently, as pension funds in Japan are the fifth largest market globally (only exceeded by US, UK, Netherlands and Canada) (
OECD 2021), with their portfolios having a large component of government bonds. This sees many Japanese pension funds now seeking to include other return-generating asset classes to expand the performance of their portfolios (
APREA 2014). A number of leading Japanese pension funds have recently actively looked at expanding their real estate portfolio; this includes GPIF which is the largest pension fund globally. This has included increasing their real estate exposure via non-listed funds. Similarly, for institutional investors globally seeking to access the Japanese commercial real estate markets to expand their international real estate exposure, the results of this research provide further justification for this strategy from a financial risk management perspective; particularly where obtaining core real estate exposure in Tokyo is very difficult, given the tightly held nature of the assets. The use of high-quality and experienced real estate investment managers adopting these value-add real estate investment products further adds to the ability of institutional investors to control financial risk.


