Article

Certificate of Need Laws and Health Care Use during the COVID-19 Pandemic

by
Agnitra Roy Choudhury
1,
Sriparna Ghosh
2 and
Alicia Plemmons
3,*
1
Department of Economics, College of Liberal Arts and Social Sciences, Auburn University at Montgomery, Montgomery, AL 36117, USA
2
Business & Economics, University of Cincinnati Blue Ash, Cincinnati, OH 45221, USA
3
Department of Economics & Finance, School of Business, Southern Illinois University Edwardsville, Edwardsville, IL 62025, USA
*
Author to whom correspondence should be addressed.
J. Risk Financial Manag. 2022, 15(2), 76; https://doi.org/10.3390/jrfm15020076
Submission received: 22 December 2021 / Revised: 7 February 2022 / Accepted: 10 February 2022 / Published: 13 February 2022
(This article belongs to the Special Issue Health Economics and Insurance)

Abstract

:
This paper investigates the impact of state-level Certificate-of-Need (CON) laws on COVID and non-COVID deaths in the United States during the SARS-CoV-2 pandemic. CON laws limit the expansion and acquisition of new medical services, such as new hospital beds. The coronavirus pandemic created a surge in demand for medical services, which might be exacerbated in some states that have CON laws. Our investigation focuses on mortality due to COVID and non-COVID reasons and understanding how these laws affect access to healthcare for illnesses that might require similar medical equipment to COVID patients. We find that states with high healthcare use due to COVID that reformed their CON laws during the pandemic had a reduction in mortality resulting from COVID-19, septicemia, diabetes, chronic lower respiratory disease, influenza or pneumonia, and Alzheimer’s Disease, relative to non-reforming CON states.

1. Introduction

The COVID-19 pandemic has put unprecedented stress on the US health care system. The true impact of COVID-19 on US mortality may be understated, as impact estimates fail to account for lives lost because of limited bed space and medical-intervention equipment such as respirators and ventilators. Prior to the pandemic, 36 states and the District of Columbia had Certificate of Need (CON) laws, which restrict expansion of health care facilities, equipment, and service without government approval. During the pandemic, many states reformed—repealed or suspended—their CON laws to allow hospitals to quickly adjust to surges in demand for medical services. We explore whether these legal restrictions affected mortality rates due to COVID-19 and non-COVID-19 diseases and if states that reformed their CON laws mitigated pandemic-related increases in mortality. To analyze mortality differences in states which reformed their CON laws, we combine mortality data collected from the Centers for Disease Control and Prevention (CDC) with state-level data on hospital- and ICU-bed utilization to create a balanced-panel for mid-March through June 2020. We observe time-series differences in mortality resulting from COVID-19, natural causes, septicemia, diabetes, chronic lower respiratory disease, influenza or pneumonia, and Alzheimer’s disease among states who suspended their CON laws while experiencing high hospital utilization relative to other states. The non-COVID-19 causes of death form a useful comparison group since common medical interventions for severe cases utilize similar equipment and resources to those needed for COVID-19 cases.
We find a statistically significant reduction in mortality due to non-COVID-19-related factors in states with high hospital- or ICU-bed utilization due to COVID-19. Reforming states saw a decrease of lives lost to natural causes (15 per 100,000 state residents weekly) or septicemia, diabetes, chronic lower respiratory disease, influenza or pneumonia, or Alzheimer’s disease (a combined 17 lives per 100,000 residents weekly). We also find that states with high ICU-bed utilization that subsequently reformed their CON laws prevented 10 people per 100,000 residents from dying from COVID-19 weekly during the early months of the COVID-19 pandemic.
Certificate of Need (CON) refers to a legal document required in some states for acquisitions, expansions, or creations of healthcare facilities. With the introduction of CON laws in New York in 1964, several states started enacting their own versions of such regulations. With the introduction of the National Health Planning and Resources Development Act of 1974 (later repealed in the 1980s), the Federal Government began withholding funds from states that did not implement CON laws, giving the policy a boost (Messa et al. 2012). At the start of 2020, CON laws were implemented in 36 states and the District of Columbia (Mitchell et al. 2020). The Certificate of Need laws require health care providers to obtain permission from a government entity or from competitors in the same market before purchasing new equipment or extending a service. The intended goal of these regulations by legislators is to restrict healthcare providers from overinvesting in facilities and services, as well as to ensure access of health care services for the poor (Mitchell 2016; Stratmann and Koopman 2018).
Researchers have analyzed the impact of CON laws on several variables such as cost effectiveness, access to health care, and quality of care delivered (Conover and Bailey 2020; Bailey 2019). CON laws have been justified as a cost control device (Rivers et al. 2007; Rosko and Mutter 2014; Ettner et al. 2020), a way to increase charity care (Mitchell et al. 2020), and as a form of protection for rural health care (Stratmann and Koopman 2018). These CON laws, even if well intentioned, have not resulted in higher-quality care (Mitchell 2020; Schultz et al. 2021).
CON laws allow medical providers a certain degree of market power, they restrict the hospital capacity to fewer hospital beds, which raises prices and leads to excess profits (Conover and Sloan 1998; Stratmann and Russ 2014). Implementation of CON laws by legislators is intended to allow rural hospitals or hospitals in low socioeconomic areas to maintain market power and stay in business. Since CON laws restrict the number of hospitals and hospital beds (Bailey 2018a), during an emergency, enough hospital beds may not be available within a state. This lack of hospital beds can affect the healthcare capacity for healthcare facilities to intake new patients, affecting the marginalized and aged population (Farzanegan 2020).
CON laws are associated with higher healthcare costs (Mitchell 2016; Bailey 2018b) and lower-quality healthcare (Stratmann and Wille 2016). By studying the effect of CON laws on access to care, scholars have found that it leads to fewer hospitals per capita (Stratmann and Russ 2014); fewer ambulatory surgery centers per capita (Stratmann and Koopman 2018); fewer beds per capita (Stratmann and Koopman 2018); fewer hospice care facilities (Stratmann and Russ 2014); fewer dialysis clinics (Ford and Kaserman 1993); fewer hospitals offering healthcare related services like MRI, CT, and PET scans (Stratmann and Baker 2016); longer driving distances to obtain healthcare (Cutler et al. 2010); longer wait times in emergency departments (Meyers and Sheehan 2020); and racial disparities in the provision of healthcare (DeLia et al. 2009). Yet, this series of policies have maintained popularity, and were the regulatory norm in thirty-six states and the District of Columbia prior to the recent pandemic.
The hindrance created by CON laws have again come into focus as policymakers are struggling to respond to the spread of the COVID virus (Bayne et al. 2020; Haeffele et al. 2020). Mitchell (2020) suggests that during emergency situations such as a pandemic, CON laws should be loosened to allow patients to quickly access healthcare. The literature on the effect of CON laws on mortality rates find mixed results, with papers showing a negative impact of CON laws on mortality rates (Ho et al. 2009; Cutler et al. 2010), or no significant effect on mortality rates (Robinson et al. 2001; DiSesa et al. 2006; Popescu et al. 2006). A few studies have found that states with CON laws have increased mortality rates (Vaughan-Sarrazin et al. 2002; Popescu et al. 2006; Ho 2006; Stratmann and Wille 2016). For example, mortality rates from pneumonia, heart attacks, and heart failure among patients are higher in states that have adopted CON laws (Vaughan-Sarrazin et al. 2002; Chiu 2021). They further conclude that in states with stringent CON laws, there is a higher rate of readmission, leading to lower patient satisfaction. This research study attempts to expand this discussion in pandemic policy reform to better understand the relationship between CON laws and mortality.
Most of the literature analyzes mortality resulting from specific causes of death, particularly cardiovascular issues. Using Medicare claims data for patients undergoing bypass graft surgery (CABG) between 1994 and 1999, Vaughan-Sarrazin et al. (2002) found that risk-adjusted mortality was twenty-two percent higher in the eighteen states that had no certificate of need regulation for open heart surgery, as opposed to the twenty-six states and the District of Columbia that had continuous certificate of need regulations. Ho et al. (2009) found that states that repealed CON experienced lower CABG mortality rates relative to states that kept CON. However, they did not find any evidence that CON regulations were associated with higher quality CABG or percutaneous coronary interventions (PCI). According to DiSesa et al. (2006) CON states have significantly higher hospital CABG surgery volumes, but similar mortality compared with non-CON states. Patients in states with certificate of need regulations are less likely to be admitted to hospitals with coronary revascularization services compared to patients in states without certificates of need (Popescu et al. 2006).
Our paper analyzes how CON laws impact mortality rates due to COVID and non-COVID diseases. Each of the non-COVID diseases use similar medical interventions and equipment to COVID patients. This paper aims to contribute to the literature by exploring the potential bottleneck in healthcare services created by CON laws as many healthcare services are reallocated towards COVID related healthcare services. We also contribute to the literature by investigating how the presence of CON laws exacerbate access problems to healthcare during pandemics.

2. Materials and Methods

2.1. Mortality

Preliminary mortality data is provided by the CDC. Death counts are aggregated weekly at the state level for deaths caused by COVID-19, natural causes, septicemia, diabetes, chronic lower respiratory disease, influenza or pneumonia, or Alzheimer’s disease. We focus on these causes because severe cases require some of the same types of medical equipment as COVID-19 cases, including beds, respirators, and supplemental oxygen. Our data is limited to the time frame between 1 January 2020, and 30 June 2020. This time frame was chosen because on 14 July 2020, the Trump Administration shifted the reporting standard and had the mortality data removed from the CDC website. This data were later replaced by the Biden administration in 2021. Table 1 presents the summary statistics of mortality the week before states began to relax CON laws and the last week of complete data for all diseases (data on septicemia are not comprehensive after the 22nd week). While there is a sizable per capita increase in COVID-19 deaths per 100,000 individuals and decrease in loss of life to other diseases, this aggregate snapshot may not describe state level variation in these rates.
The National Center for Health Statistics collects mortality data directly from completed death certificates reported by hospitals and states. The data cover approximately 1.5 million deaths, of which 132,366 involved COVID-19. If between 1 and 10 people die of a specific cause in a state within a week, the CDC codes this as a null entry. In these cases, we code deaths as 1, the minimum positive mortality. This means our estimates represent a conservative lower bound of the coefficient estimates.

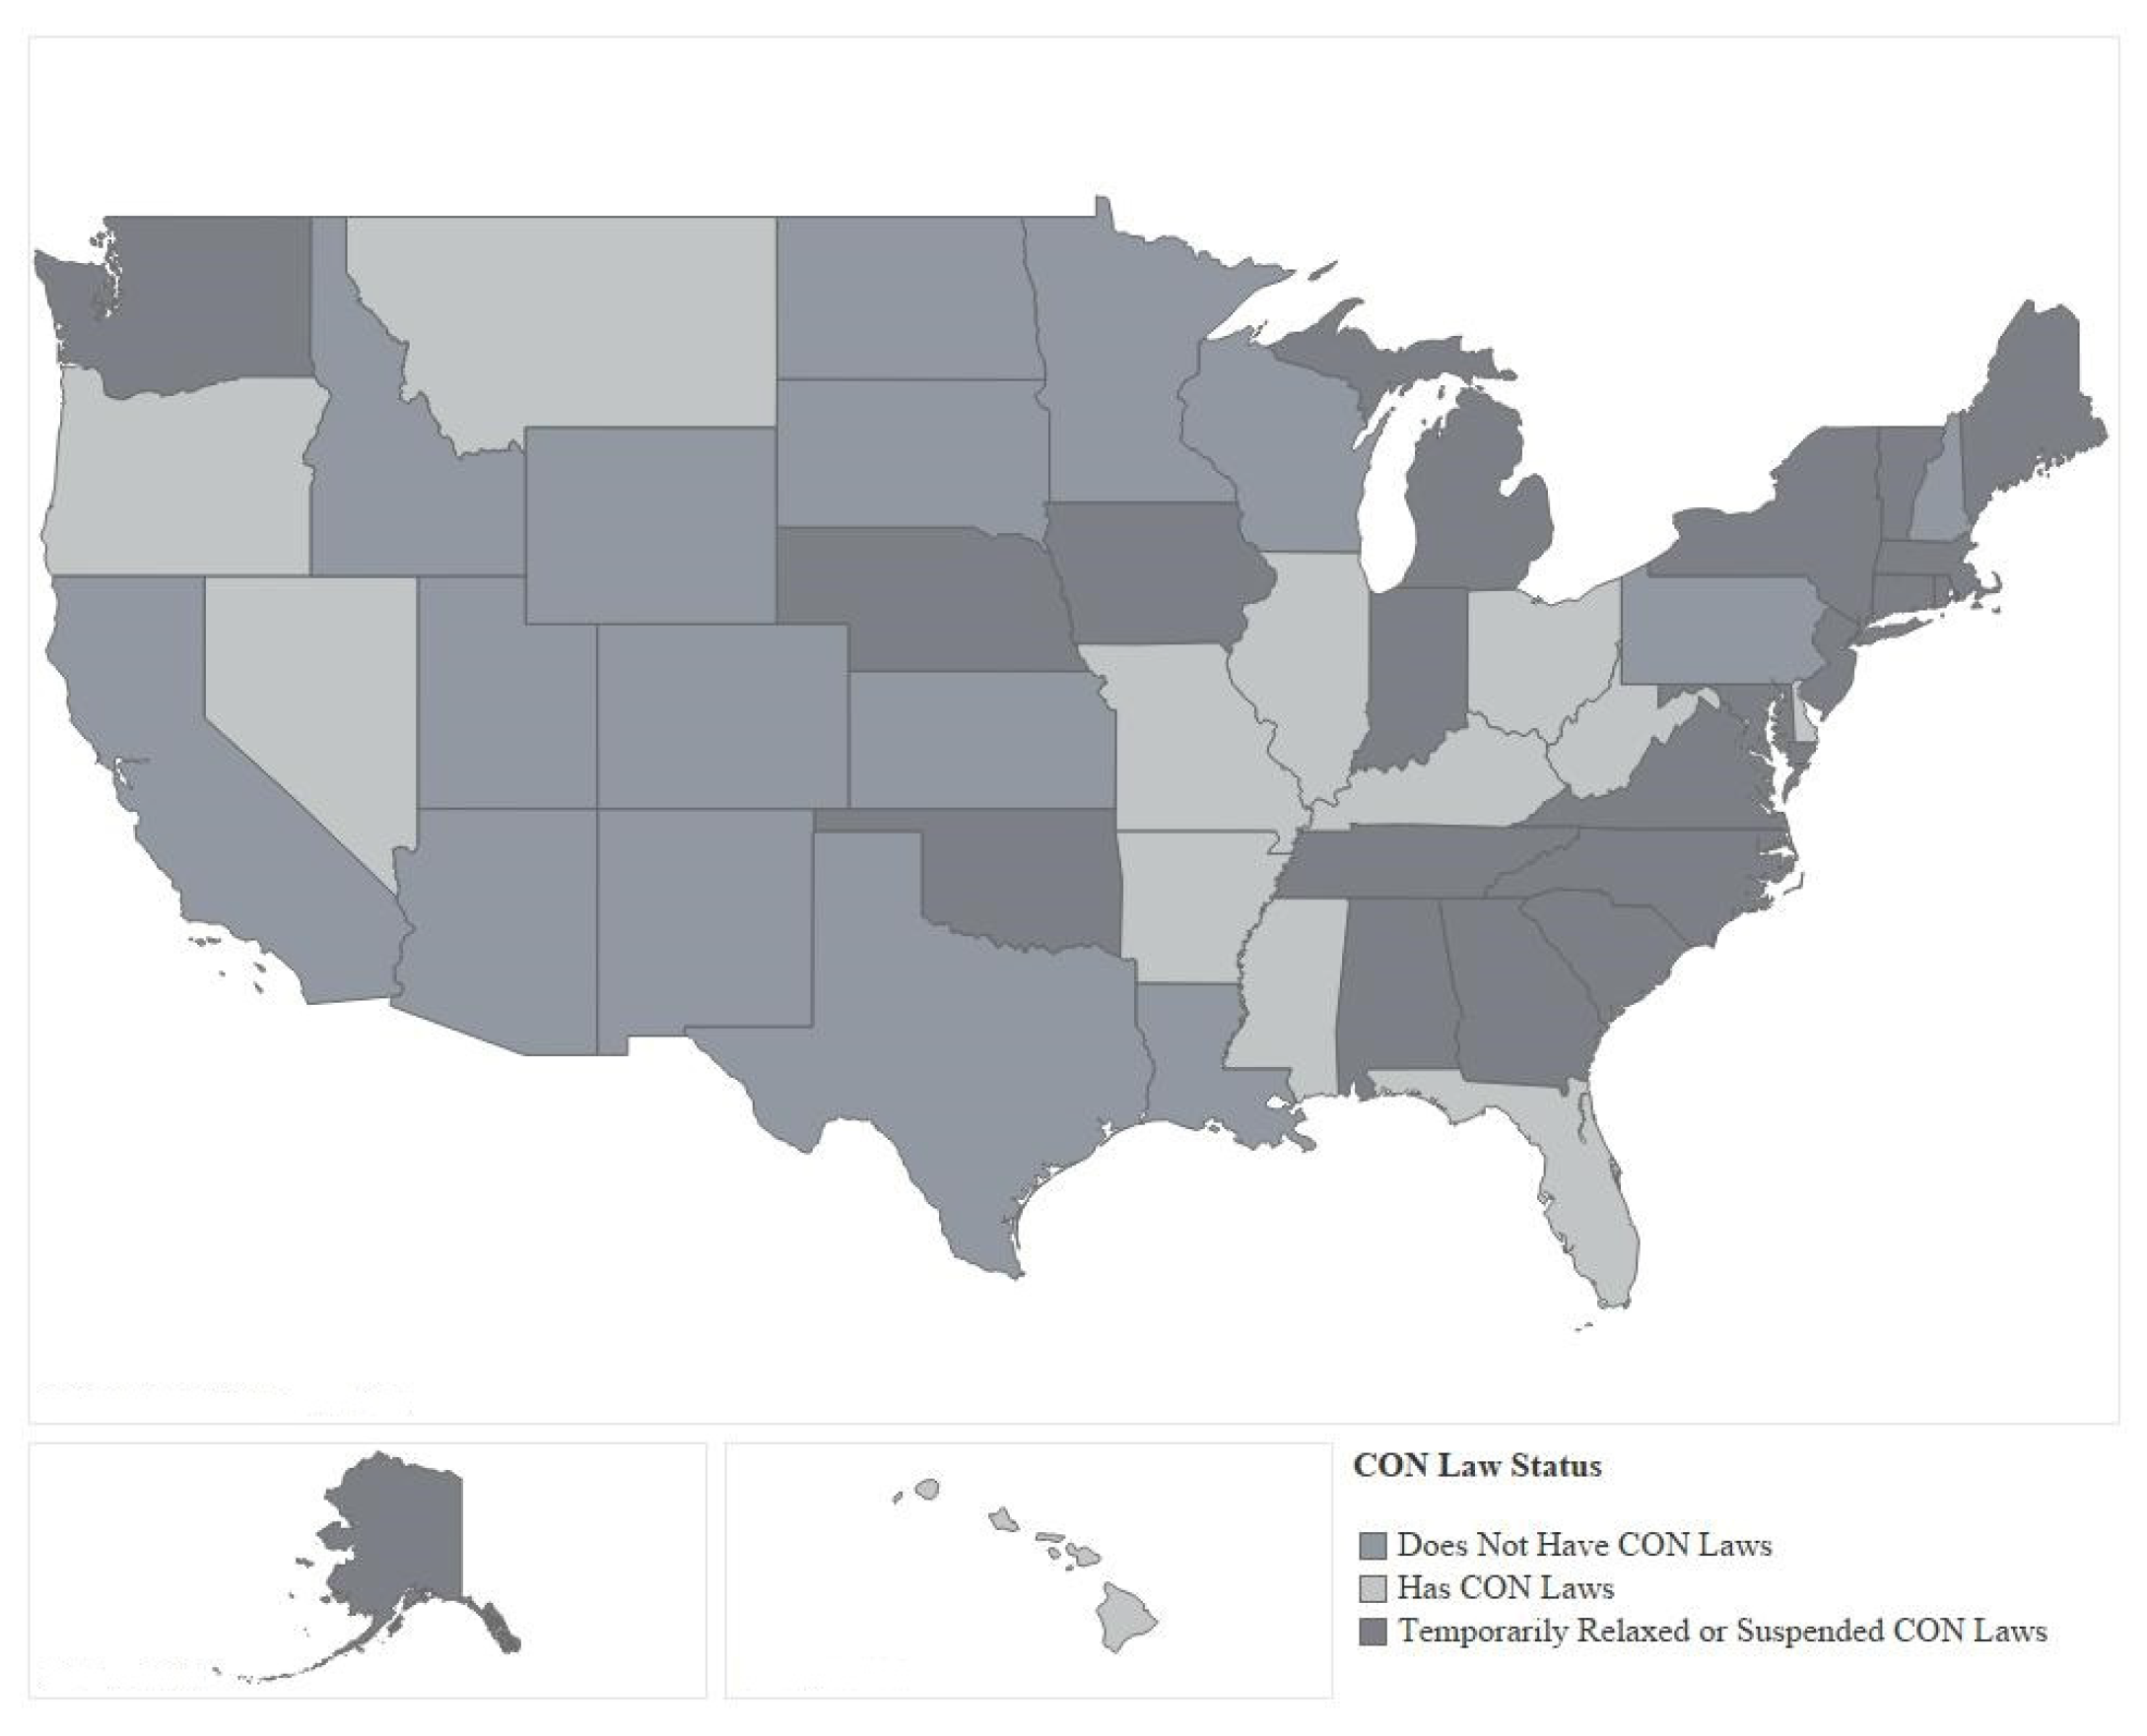
2.2. Certificate of Need Laws

Our data on state-level CON law changes are based on governors’ executive orders on acquiring medical equipment. Figure 1 maps the states with and without CON laws and those that reformed their CON laws. Table 2 provides a detailed summary of the legal changes made by each state and when the reforms were implemented. Each state is different in their explanation of CON laws- some states use executive orders to either repeal, suspend, or increase the limit of total bed capacity high enough it is non-binding relative to the number of beds being utilized by patients, while other states implement emergency policies that were already put into place prior to the pandemic. Though some states have two pieces of legislation associated with the reform, the reforms in each state were implemented on a single day. Most reforms took effect in mid-March. Due to the short differences between when executive orders were signed, we do not conduct the newer Callaway and Sant’anna difference-in-difference estimator, since this clustered implementation means that earlier regulatory changes were unlikely to affect COVID-19 rates in other states in a matter of hours or days when the incubation period of the COVID-19 virus is often longer than this window. One important assumption we make is that the reforms were not driven by the utilization of hospital beds and ICU beds by COVID-19 patients.

2.3. Hospital Utilization

Hospital capacity and utilization data come from the COVID-19 Burden Index developed by Leavitt Partners’ Torch Insight, a platform that creates index files from data updated daily by John Hopkins University. Hospital capacity refers to the number of beds within the entire hospital system that are or could be used for patients. Hospital utilization refers to the proportion of the hospital bed capacity that is currently in use. Data on COVID-19 patient bed use begin in mid-March 2020 and end at the end of June 2020. Though the data are available daily, we aggregate to weekly values to align them with the CDC mortality data. Collected variables include hospital COVID-19 cases, the upper and lower bounds of estimated hospital COVID-19 cases, ICU COVID-19 cases, total hospital-bed capacity, total ICU-bed capacity, hospital-bed utilization, ICU-bed utilization, and hospital beds and ICU beds available for COVID-19 cases. We use the information on hospital and ICU beds utilized by COVID-19 patients, in each state for each week, to proxy for the utilization of health care services. We use total hospital and ICU beds separately as proxies for the supply of health care services.

2.4. Model

We test the parallel trend assumption on mortality due to other health issues, such as septicemia, diabetes, chronic lower respiratory disease, influenza or pneumonia, and Alzheimer’s disease, to observe if there are statistically similar trend for the reforming states and the control group (combining non-CON-law states and nonreforming states). We do not replicate the test for COVID-19 because of the short time that COVID-19 had been in the country prior to our data series. The parallel trend results are provided in Table 3. Our results suggest that the trends in non-COVID-19 mortality levels were statistically similar for the reforming states compared to other states.
Each state in our analysis falls into one of three groups. First are states that never had CON laws, called the non-CON states. Second, states with CON laws that did not suspend them are labeled CON states. Finally, our treatment group, ReformCON, comprises states that reformed their CON laws between March and April to improve access to care during the pandemic.
The presence or absence of CON laws is not enough to tell us about their impact on health care access. For example, CON-law states with low hospital utilization should not see a strong impact of reform. This model framework incorporates COVID-19 patient utilization of hospital services, proxied by hospital- and ICU-bed use, into the model to determine potential differences in mortality between states with high hospital utilization and those with low utilization by COVID-19 patients.
y s t = β 0 + β 1 ( R e f o r m C O N s * P o s t s t ) + ( R e f o r m C O N s * P o s t s t * B e d s s t ) δ + η s t + M s t ψ + τ s * t + α s + μ t + ε s t
Since states reformed CON laws at different times, the timing of reform is plausibly exogenous in implementation timing because of the quick onset of the virus and the limited time frame in which states made decisions. This means that we do not adjust our coefficient estimates for differential timing and heterogeneity because policy changes in one state were unlikely to affect COVID-19 and other disease rates in surrounding states within a matter of hours or days. P o s t s t is a binary indicator that equals 1 after a state reformed its CON law, and 0 otherwise. η s t is a series of controls related to stay-at-home orders and other state-level COVID-19 mandates. State and time fixed effects are α s and μ t , respectively. We also include a state-specific quadratic time trend to control for any time-specific confounders. B e d s s t is a continuous variable, with higher values reflecting higher utilization of hospital and ICU services.
Our hypothesis is that among states with high health care utilization due to COVID-19, more people lacked access to critical lifesaving equipment in states with CON laws than in those without them. While R e f o r m C O N s * P o s t s t highlights the inherent differences in the marginal effect of reforming CON laws, this reform will have different effects within states experiencing a shortage of resources compared to those who reformed when their hospitals were not experiencing capacity constraints. In the model specification, we interact the variable for health care utilization by COVID-19 patients with the vector representing having reformed CON laws. R e f o r m C O N s * P o s t s t * B e d s s t determines the additional marginal mortality effect for states who reformed their CON laws while exhibiting high health care utilization by COVID-19 patients, relative to those who were not experiencing capacity constraints.
M is a vector that includes interactions between the dummy variables CON and ReformCON, utilization rates of hospital and ICU beds, and availability of health care services in each state. The coefficient of interest is δ, which captures the additional marginal effect of reform on mortality in states with high utilization of health care services. When we include states that never had CON laws in the control group, the results are consistent in direction, significance, and magnitude.

3. Results

We use two proxies to capture the impact of COVID-19 infections on the utilization of health care services: COVID-19 patients’ per capita use of hospital beds and COVID-19 patients’ per capita use of ICU beds. These proxies are scaled by 100,000 to allow us to interpret the results as the number of people affected per 100,000 residents. Table 4 presents the impact of reform in states with high hospital-bed utilization on mortality rates. Table 5 repeats the analysis with the utilization of ICU beds. We use nonreforming states as our control group in both tables.
After controlling for utilization of hospital beds by COVID-19 patients, we find that in reform states, mortality due to both COVID-19, and for other causes of death whose treatments require similar resources, decreased. The coefficient for R e f o r m C O N s * P o s t s t * B e d s s t is negative and statistically significant for COVID-19, natural causes, septicemia, diabetes, chronic lower respiratory disease, influenza or pneumonia, and Alzheimer’s disease. Our estimates in Table 4 suggest that the reforms in states with high utilization of hospital beds by COVID-19 patients experienced a statistically significant decrease of 20 deaths resulting from COVID-19 and 30 deaths due to natural causes per 100,000 people.
The coefficients for diabetes, influenza and pneumonia, and chronic lower respiratory diseases are also negative, but of a much lower magnitude than those for COVID-19 and natural causes. Diabetes, Alzheimer’s disease, and chronic lower respiratory diseases are long-term health issues that put patients in the high-risk pool. Complications due to influenza, pneumonia, and septicemia require the usage of intensive-care beds or ventilators, resources that are also used by COVID-19 patients. Combining the other types of respiratory-related diseases we tested, 3 fewer lives were lost per 100,000 residents, which implies that the reforms also helped non-COVID-19 patients that used similar resources in life-threatening cases.
In Table 5, Beds represents ICU-bed utilization rather than hospital-bed utilization. ICU-bed cases are the ones most likely to be life threatening. We find that the coefficient of interest is statistically significant for all seven causes of death. The magnitudes are much lower for COVID-19 and natural causes than what we found when using hospital-bed utilization as the proxy. Reforming states with high ICU-bed utilization by COVID-19 patients saw a reduction in lives lost to COVID-19 (10 people per 100,000), natural causes (15 people per 100,000), and the additional respiratory-related diseases (2 people per 100,000).

4. Discussion

A Certificate of Need is a government-provided legal document required in some states to build, expand, or diversify the services and equipment offerings within health care facilities. At the start of 2020, CON laws were in place in 36 states and the District of Columbia (Mitchell 2020). Such laws require health care providers to obtain permission from a government or from competitors in the same geographic market before purchasing any new equipment or extending a new service. The goal is to prevent providers from overinvesting in facilities and services and to ensure that individuals from low socioeconomic areas have access to health care (Mitchell 2016; Stratmann and Wille 2016).
CON laws have been justified as a cost-control device (Rivers et al. 2007), a way to increase charity care (Mitchell 2020), and a means of protecting rural health care providers. CON laws give medical providers a certain degree of market power by allowing them to restrict hospital capacity, often through limiting the number of beds within a facility, which raises prices and increases profits (Conover and Sloan 1998; Stratmann and Russ 2014). This market power was intended by early policymakers to allow rural hospitals and hospitals in low-socioeconomic-status areas to stay in business. Since CON laws restrict the number of hospitals and hospital beds, there might not be enough hospital capacity available during an emergency (Bailey 2018a).
CON laws are a focus of attention for policy makers as they struggle with how to respond to the spread of COVID-19 (Bayne et al. 2020; Haeffele et al. 2020). Mitchell (2020) suggests that during pandemics, CON laws should be loosened to allow patients to quickly access health care, as the regulatory environment and policy barriers during emergencies can have longstanding effects on individual health conditions and local economies (Gungoraydinoglu et al. 2021). The literature on the effect of CON laws on mortality rates finds mixed results, with some papers showing a negative impact (Cutler et al. 2010; Ho et al. 2009), some showing no significant effect (DiSesa et al. 2006; Popescu et al. 2006; Robinson et al. 2001), and a few showing a positive effect (Ho 2006; Popescu et al. 2006; Stratmann and Wille 2016; Vaughan-Sarrazin et al. 2002). We expand the discussion of CON laws to focus on mortality-related demand surges under pandemic conditions.
Our research sought to answer whether states that legally limit hospitals from expanding and acquiring healthcare-related goods and services bore a disproportionate impact of the pandemic on COVID-19 and non-COVID-19 mortality. This question is crucial, since, with the massive surge in new patients demanding health care services, CON laws limit beds, respirators, ambulatory services, and CT/MRI imaging, which are resources necessary for the care of both COVID-19 and non-COVID-19 patients. Did these reforms save lives?
When we account for hospital- and ICU-bed utilization, we find that states with high health care utilization that reform their CON laws during the pandemic experience a significant reduction in weekly mortality for both COVID-19 and non-COVID-19 patients. This reduction was large and significant for natural causes, septicemia, diabetes, chronic lower respiratory disease, influenza or pneumonia, and Alzheimer’s, resulting in a combined effect of 33 lives saved per 100,000 people. COVID-19 mortality additionally reduced by 20 lives per 100,000 in states who reformed their CON laws while experiencing demand surges for beds and services. Our research study contributes to the literature by using real-time data from the first wave of the COVID-19 pandemic and individually collected executive orders. We consider the utilization of hospital beds and CON law reforms during the early pandemic for both COVID-19 patients and for patients suffering from other respiratory illnesses. This methodology contributes to the literature by both including these direct and indirect effects of CON law reform during a healthcare pandemic which has important policy implications for future executive order reforms.

Author Contributions

Conceptualization, A.R.C. and A.P.; Methodology, A.R.C. and S.G.; Software, A.R.C., A.P. and S.G.; Validation, A.R.C., A.P. and S.G.; Formal Analysis, A.R.C.; Investigation, S.G. and A.R.C.; Data Curation, S.G.; Writing—Original Draft Preparation, A.P. and A.R.C.; Writing—Review & Editing, A.R.C., S.G. and A.P.; Visualization, A.P. All authors have read and agreed to the published version of the manuscript.

Funding

This research received no external funding.

Institutional Review Board Statement

Not applicable.

Informed Consent Statement

Not applicable.

Data Availability Statement

Publicly available datasets were analyzed in this study. Regularly updated versions of the Daily Updates of Totals by Week and State: Provisional Death Counts for Coronavirus Disease 2019 is available from the CDC: https://www.cdc.gov/nchs/nvss/vsrr/covid19/index.htm (accessed on 30 June 2020).

Conflicts of Interest

The authors report no conflict of interest.

References

  1. Bailey, James. 2018a. The Effect of Certificate of Need Laws on All-Cause Mortality. Health Services Research 53: 49–62. [Google Scholar] [CrossRef] [PubMed]
  2. Bailey, James. 2018b. Does “Excess Supply” Drive Excessive Health Spending? The Case of Certificate-of-Need Laws. The Journal of Private Enterprise 33: 91–109. [Google Scholar]
  3. Bailey, James. 2019. Can Health Spending be Reined in Through Supply Restraints? An Evaluation of Certificate-of-Need Laws. Journal of Public Health 27: 7755–60. [Google Scholar] [CrossRef]
  4. Bayne, Ethan, Conor Norris, and Edward Timmons. 2020. A Primer on Emergency Occupational Licensing Reforms for Combating COVID-19. Arlington: Mercatus Policy Brief, Mercatus Center at George Mason University, March 26. [Google Scholar]
  5. Chiu, Kevin. 2021. The Impact of Certificate of Need Laws on Heart Attack Mortality: Evidence from County Borders. Journal of Health Economics 79: 1–17. [Google Scholar] [CrossRef]
  6. Conover, Christopher, and Frank Sloan. 1998. Does Removing Certificate of Need Regulations Lead to a Surge in Health Care Spending? Journal of Health Politics: Policy and Law 23: 455–81. [Google Scholar] [CrossRef]
  7. Conover, Christopher, and James Bailey. 2020. Certificate of Need Laws: A Systematic Review and Cost-Effectiveness Analysis. BMC Health Services Research 20: 748. [Google Scholar] [CrossRef]
  8. Cutler, David, Robert Huckman, and Jonathan Kolstad. 2010. Input Constraints and the Efficiency of Entry: Lessons from Cardiac Surgery. American Economic Journal: Economic Policy 2: 51–76. [Google Scholar] [CrossRef]
  9. DeLia, Derek, Joel Cantor, Amy Tiedemann, and Cecilia Huang. 2009. Effects of Regulation and Competition on Health Care Disparities: The Case of Cardiac Angiography in New Jersey. Journal of Health Politics: Policy and Law 34: 63–91. [Google Scholar] [CrossRef]
  10. DiSesa, Verdi J., Sean M. O’Brien, Karl F. Welke, Sarah M. Beland, Constance K. Haan, Mary S. Vaughan-Sarrazin, and Eric D. Peterson. 2006. Contemporary Impact of State Certificate of Need Regulations for Cardiac Surgery: An Analysis Using the Society of Thoracic Surgeon’s National Cardiac Surgery Database. Circulation 111: 2122–29. [Google Scholar] [CrossRef] [Green Version]
  11. Ettner, Susan, Jacqueline Zinn, Haiyong Xu, Heather Ladd, Eugene Nuccio, Dara Sorkin, and Dana Mukamel. 2020. Certificate of Need and the Cost of Competition in Home Healthcare Markets. Home Health Care Services Quarterly 39: 51–64. [Google Scholar] [CrossRef]
  12. Farzanegan, Mohammad. 2020. Ageing Society and SARS-CoV-2 Mortality: Does Healthcare Absorptive Capacity Matter? Journal of Risk and Financial Management 13: 277. [Google Scholar] [CrossRef]
  13. Ford, Jon, and David Kaserman. 1993. Certificate of Need Regulation and Entry: Evidence from the Dialysis Industry. Southern Economic Journal 59: 783–91. [Google Scholar] [CrossRef]
  14. Gungoraydinoglu, Ali, Illke Ӧztekin, and Ӧzde Ӧztekin. 2021. The Impact of COVID-19 and Its Policy Responses on Local Economy and Health Conditions. Journal of Risk and Financial Management 14: 233. [Google Scholar] [CrossRef]
  15. Haeffele, Stefanie, Anne Hobson, and Virgil Storr. 2020. Coming Back from COVID-19: Lessons in Entrepreneurship from Disaster Recovery Research. Arlington: Mercatus Policy Brief, Mercatus Center at George Mason University, April 29. [Google Scholar]
  16. Ho, Vivian. 2006. Does Certificate of Need Affect Cardiac Outcomes and Costs? International Journal of Health Care Finance & Economics 6: 300–24. [Google Scholar]
  17. Ho, Vivian, Meei-Hsiang Ku-Goto, and James Jollis. 2009. Certificate of Need (CON) for Cardiac Care: Controversy Over the Contributions of CON. Health Services Research 44, Pt 1: 483–500. [Google Scholar] [CrossRef]
  18. Messa, Indu, Robert Meeker, and Suresh Mukherji. 2012. Certificate of Need. Neuroimaging Clinics of North America 22: 443–50. [Google Scholar] [CrossRef]
  19. Meyers, Molly, and Kathleen Sheehan. 2020. The Impact of Certificate of Need Laws on Emergency Department Wait Times. The Journal of Private Enterprise 35: 59–75. [Google Scholar]
  20. Mitchell, Matthew. 2016. Do Certificate of Need Laws Limit Spending? Arlington: Mercatus Policy Brief, Mercatus Center at George Mason University, September 29. [Google Scholar]
  21. Mitchell, Matthew. 2020. First, Do No Harm: Three Ways that Policymakers Can Make It Easier for Healthcare. Arlington: Mercatus Policy Brief, Mercatus Center at George Mason University, March 26. [Google Scholar]
  22. Mitchell, Matthew, Elise Amez-Droz, and Anna Parsons. 2020. Phasing Out Certificate of Need Laws: A Menu of Options. Arlington: Mercatus Policy Brief, Mercatus Center at George Mason University, February 25. [Google Scholar]
  23. Popescu, Ioana, Mary Vaughan-Sarrazin, and Gary Rosenthal. 2006. Certificate of Need Regulations Do Not Restrict Access to Coronary Revascularization after Acute Myocardial Infarction. JAMA 295: 2141–47. [Google Scholar] [CrossRef] [Green Version]
  24. Rivers, Patrick, Myron Fottler, and Mustafa Younis. 2007. Does Certificate of Need Really Contain Hospital Costs in the United States? Health Education Journal 66: 229–44. [Google Scholar] [CrossRef]
  25. Robinson, Jamie, David Nash, Elizabeth Moxey, and John O’Connor. 2001. Certificate of Need and the Quality of Cardiac Surgery. American Journal of Medical Quality 16: 155–60. [Google Scholar] [CrossRef]
  26. Rosko, Michael, and Ryan Mutter. 2014. The Association of Hospital Cost-Inefficiency with Certificate-of-Need Regulation. Medical Care Research and Review 71: 280–98. [Google Scholar] [CrossRef] [PubMed]
  27. Schultz, Olivia, Lewis Shi, and Michael Lee. 2021. Assessing the Efficacy of Certificate of Need Laws Through Total Joint Arthroplasty. Journal for Healthcare Quality 43: E1–E7. [Google Scholar] [CrossRef] [PubMed]
  28. Stratmann, Thomas, and Christopher Koopman. 2018. Entry Regulation and Rural Health Care: Certificate of Need Laws, Ambulatory Surgical Centers, and Community Hospitals, Mercatus Working Paper. Arlington: Mercatus Center at George Mason University, February 18. [Google Scholar]
  29. Stratmann, Thomas, and David Wille. 2016. Certificate of Need Laws and Hospital Quality, Mercatus Working Paper. Arlington: Mercatus Center at George Mason University, September 27. [Google Scholar]
  30. Stratmann, Thomas, and Jake Russ. 2014. Do Certificate of Need Laws Increase Indigent Care? Arlington: Mercatus Policy Brief, Mercatus Center at George Mason University, July 15. [Google Scholar]
  31. Stratmann, Thomas, and Matthew Baker. 2016. Are Certificate of Need Laws Barriers to Entry? How They Affect Access to MRI, CT, and PET Scans. Mercatus Working Paper. Arlington: Mercatus Center at George Mason University, January 12. [Google Scholar]
  32. Vaughan-Sarrazin, Mary, Edward Hannan, Carol Gormley, and Gary Rosenthal. 2002. Mortality in Medicare Beneficiaries Following Coronary Artery Bypass Graft Surgery in States with and without Certificate of Need Regulation. JAMA 288: 1859–66. [Google Scholar] [CrossRef] [PubMed] [Green Version]
Figure 1. Map of CON Laws.
Jrfm 15 00076 g001
Table 1. Descriptive statistics of hospital fatalities for the week before the policy change and the last week of full data for all diseases.
Week 10
Best Case Scenario: Deaths Per 100,000
State TypeCOVID-19NaturalSepticemiaDiabetesChronic Lower Respiratory DiseaseInfluenza and/or PneumoniaAlzheimer’s Disease
Reformed CON Laws0.025116.24550.19490.38910.90620.34920.7062
Always Had CON Laws0.000318.46250.16940.54181.26180.41870.6814
Never Had CON Laws0.002316.31950.14880.49651.08350.38780.7207
Week 22
Best Case Scenario: Deaths Per 100,000
State TypeCOVID-19NaturalSepticemiaDiabetesChronic Lower Respiratory DiseaseInfluenza and/or PneumoniaAlzheimer’s Disease
Reformed CON Laws0.813110.98270.08230.24670.43890.11150.3787
Always Had CON Laws0.35309.69410.03940.21180.42670.08770.3615
Never Had CON Laws0.551210.73140.08180.28980.55800.07920.4128
Note: Each of these deaths are per 100,000 individuals within the state in each week within the sample period. The top half of the table denotes the summary statistics during the early pandemic (Week 10) prior to any state changing their CON laws. The bottom half of the table denotes the summary statistics during towards the end of the sample period (Week 22). Comparing these two weeks, there is a sizable increase in deaths related to COVID-19.
Table 2. List of initial documents initiating CON law changes.
StateDateLegal Document
Alabama2 April 20205th Supplemental State of Emergency
Alaska11 March 2020Administrative Order No. 315
Connecticut14 March 2020Executive Order No. 7B
Georgia20 March 2020Executive Order 3.20.20.2
Indiana16 March 2020Executive Order 20-04 and Executive Order 20-05
Iowa17 March 2020Proclamation of Disaster Emergency
Maine6 April 2020Executive Order No. 35
Massachusetts24 March 2020Order of the Commissioner of Public Health Regarding Determination of Need Approvals Related to COVID-19
Maryland3 April 2020Sec. 10.24.01.20 Emergency Certificate of Need. (Already established, MHCC Executive Director alerted hospitals of Emergency CON on 3 April)
Michigan17 March 2020Executive Order No. 2020-13
Nebraska31 March 2020Executive Order No. 20-12
New Jersey13 March 2020Executive Order No. 103; followed by the Temporary Operational Waivers during a State of Emergency from NJ Commissioner
New York23 March 2020Executive Order 202.10
North Carolina12 March 2020Executive Order No. 116 (10 March); followed by NC DHHS memo to hospitals (12 March)
Oklahoma8 April 2020Executive Order No. 2020-13
Rhode Island10 April 2020Executive Order No. 20-21
South Carolina19 March 2020Executive Order No. 2020-11
Tennessee19 March 2020Executive Order No. 15
Vermont25 March 2020Executive Order No. 01-20; followed by GMCB Certificate of Need Bulletin 002
Virginia12 March 2020Executive Order Amended Number 51 (2020)
Washington30 March 2020Proclamation 20-36
Note: Each state differs in their explanation of the COVID-19 adjustments. For example, some completely repeal CON laws while other categorize it as an emergency approval process or expand the percentage a hospital can increase things such as beds to a point that it is non-binding. There is no common language between states in the treatment of CON laws. Most executive orders do not directly waive CON laws but instead allow health departments to implement established emergency protocols that include temporary easement of CON laws. To the best of our knowledge these dates, and orders are the initial point of capacity expansions in response to COVID-19 by state. Many were rescinded or repealed after our sample period.
Table 3. Parallel trend estimates of the effect of reforming CON laws.
Underlying Cause of Death
Natural DeathSepticemiaDiabetesChronic Lower Respiratory DiseaseInfluenza or PneumoniaAlzheimer’s Disease
Reform Trend0.0001
(0.0018)
−0.0001
(0.0001)
−0.0002
(0.0001)
−0.0002
(0.0001)
−0.0001
(0.0002)
−0.0001
(0.0002)
CON1.9719 ***
(0.0000)
0.0727 ***
(0.0000)
0.3716 ***
(0.0000)
0.2764 ***
(0.0000)
0.2022 ***
(0.0000)
0.8039 ***
(0.0000)
Reform5.2513 ***
(0.0089)
0.2938 ***
(0.0005)
0.3128 ***
(0.0006)
0.6830 ***
(0.0016)
0.4461 ***
(0.0009)
0.8963 ***
(0.0010)
Time Fixed EffectYesYesYesYesYesYes
State Fixed EffectYesYesYesYesYesYes
Standard ErrorsCluster
(State)
Cluster
(State)
Cluster
(State)
Cluster
(State)
Cluster
(State)
Cluster
(State)
Obs.432432432432432432
R20.89780.76030.66580.68900.67150.6401
*** p < 0.01.
Table 4. Coefficient estimates of the effect of reforming CON laws and incorporating total ICU beds available.
Underlying Cause of Death
COVID-19 DeathNatural DeathSepticemiaDiabetesChronic Lower Respiratory DiseaseInfluenza or PneumoniaAlzheimer’s Disease
ReformCON∗Post−0.3199
(0.8987)
−0.2382
(0.8987)
0.0040
(0.0187)
−0.0070
(0.0469)
0.0293
(0.0618)
−0.0143
(0.0370)
0.0372
(0.0446)
Beds10.4329 ***
(3.0566)
18.9124 ***
(5.2612)
−0.0464
(0.1183)
−0.4915 *
(0.2536)
0.7162 **
(0.3616)
0.1031
(0.2082)
0.3003
(0.2335)
CON∗Beds1.5541
(2.3519)
−6.9342
(5.0495)
0.1910 *
(0.1055)
−0.5667 **
(0.2592)
−0.0293
(0.0618)
0.2082
(0.2587)
−0.2615
(0.2344)
Reform∗Beds15.0771 ***
(2.5894)
17.5832 ***
(4.2993)
0.2639 **
(0.1088)
0.2016
(0.2170)
0.0198
(0.3050)
0.8753 ***
(0.1879)
0.5467 **
(0.2159)
ReformCON∗Post∗Beds−19.6168 ***
(1.2672)
−29.0114 ***
(1.2592)
−0.2052 ***
(0.0396)
−0.6635 ***
(0.0945)
−0.5879 ***
(0.1071)
−0.6718 ***
(0.0638)
−0.7261 ***
(0.2181)
Social-Distancing-Mandate ControlsYesYesYesYesYesYesYes
Time TrendsQuadraticQuadraticQuadraticQuadraticQuadraticQuadraticQuadratic
Time Fixed EffectYesYesYesYesYesYesYes
State Fixed EffectYesYesYesYesYesYesYes
Standard ErrorsCluster (State)Cluster (State)Cluster (State)Cluster (State)Cluster (State)Cluster (State)Cluster (State)
Observations936936936936936936936
R20.770.770.690.600.700.640.61
*** p < 0.01, ** p < 0.05, * p < 0.10. Note: This model follows a difference-in-difference framework with staggered implementation, which, combined with the multiple treatment periods is why there is not a separately denoted Post variable. The methodology section includes a discussion of the required assumptions. Our interpretation, for example, of the septicemia results are that CON law states with high hospital-bed utilization saw a reduction of 0.2052 deaths per 100,000 individuals per week, relative to CON law states that chose not the reform in the post period.
Table 5. Coefficient estimates of the effect of reforming CON laws and incorporating total ICU beds available.
Underlying Cause of Death
COVID-19 DeathNatural DeathSepticemiaDiabetesChronic Lower Respiratory DiseaseInfluenza or PneumoniaAlzheimer’s Disease
ReformCON∗Post−0.4196
(0.4677)
−0.4818
(0.8742)
−0.0040
(0.0185)
0.0037
(0.0456)
0.0119
(0.0608)
−0.0159
(0.0370)
0.0375
(0.0440)
Beds3.6663 ***
(1.2225)
6.6828 ***
(1.9590)
−0.0226
(0.0449)
0.1842
(0.0890)
−0.2448 *
(0.1334)
0.0325
(0.0812)
0.1218
(0.0872)
CON∗Beds−0.1229
(1.1398)
−4.0593 *
(2.2129)
0.0671 *
(0.0398)
−0.2125 **
(0.0923)
−0.3628 **
(0.1543)
0.0580
(0.0959)
−0.1031
(0.0865)
Reform∗Beds8.6279 ***
(1.0430)
10.8012 ***
(1.5802)
0.1293 ***
(0.0409)
0.1515 **
(0.0742)
0.0732
(0.1111)
0.4372 ***
(0.0739)
0.2908 ***
(0.0832)
ReformCON∗Post∗Beds−10.0872 ***
(0.6176)
−14.6622 ***
(0.7137)
−0.1048 ***
(0.0197)
−0.3188 ***
(0.0385)
−0.2806 ***
(0.0411)
−0.3585 ***
(0.0299)
−0.3725 ***
(0.0824)
Social-Distancing-Mandate ControlsYesYesYesYesYesYesYes
Time TrendsQuadraticQuadraticQuadraticQuadraticQuadraticQuadraticQuadratic
Time Fixed EffectYesYesYesYesYesYesYes
State Fixed EffectYesYesYesYesYesYesYes
Standard ErrorsCluster (State)Cluster (State)Cluster (State)Cluster (State)Cluster (State)Cluster (State)Cluster (State)
Observations936936936936936936936
R20.760.770.690.600.700.640.61
*** p < 0.01, ** p < 0.05, * p < 0.10. Note: This model follows a difference-in-difference framework with staggered implementation, which, combined with the multiple treatment periods is why there is not a separately denoted Post variable. The methodology section includes a discussion of the required assumptions. Our interpretation, for example, of the septicemia results are that CON law states with high ICU-bed utilization saw a reduction of 0.1048 deaths per 100,000 individuals per week, relative to CON law states that chose not the reform in the post period.
Publisher’s Note: MDPI stays neutral with regard to jurisdictional claims in published maps and institutional affiliations.

