1. Introduction
Several factors influence the development of sovereign gross public debt, and I will present the relevant literature in the second part of the study. After that, I will also demonstrate the mechanism of action of the factors. The significance of these factors/components is that their values positively or negatively affect the size of public debt. However, over time, the size of the components will have a significant impact on economic policy choices, financial performance, and prospects.
In the methodological part of the study, I demonstrate the factors influencing the development of public debt. I have viewed the change in the debt trajectory over the past nine years (2011–2019) with empirical characteristics. The breakdown of debt growth into factors can be done in several ways, and it is worth analyzing these factors for a variety of purposes.
Using the method of breaking down into conventional factors, the study analyzes the impact of the following four components on the government debt ratio: (1) the extent to which it can be considered a consequence of the budget deficit, (2) the impact of expected or surprise changes in GDP growth, and (3) the exchange rate of debt denominated in foreign currency. These components are the analysis’s input/independent/variables, and the output/dependent/variable is the ratio of government debt to GDP.
The study aims to present a stylized methodology that has not been used previously. The effect of the components influencing the public debt of a national economy can be demonstrated in a novel way, separately.
The hypotheses of the study are as follows:
Hypothesis 1 (H1). In 2011–2019, the euro area member states experienced strong economic growth. The gross sovereign debt of the member states decreased significantly by the end of the period.
Hypothesis 2 (H2). The public debt ratio to GDP could not have decreased without the “debt reduction effort”—deleveraging—declared in the member states’ economic policies.
Hypothesis 3 (H3). The budget balance directly changes, so this variable had the most significant effect on the change in government debt ratios of the member states.
The study shows the impact of the three macroeconomic variables of the euro area member states—economic growth, budget balance, and real interest rate—on the change in the gross government debt of each member state. Before the study processes the empirical data for the three macroeconomic variables, the literature on the variables are presented in the next section.
1.1. Literature Review
1.1.1. State Budget Literature
Since the emergence of modern economies, the state budget’s balance—deficit or surplus—has occupied the professional public. Today’s global economy has already surpassed the view Adam Smith put forward: only a reasonable budget in balance. Deficit is a significant contributor to the increase in government debt. There are several theories to explain the formation of the balance. According to
Szybowski (
2018), the budget deficit leading to public debt is caused by excessive expenditure, which can be caused by the militarization of the economy, extensive public administration, or high social transfers. Sometimes deficits can be caused by too low taxes and other government revenues. Still, the main reason is the failure to adjust public spending in line with the economy’s profitability.
Other research, such as, the impact of the welfare state on growth and the general government deficit by
Atkinson (
1995), or on the negative trends in redistribution and public finances by
Larch (
2010), trace the development of debt.
Alesina et al. (
1995) blame the inadequacy of public finance management and the tactical tricks of political struggle for the emergence and persistence of deficits.
The lack of public finances is one of the most critical macroeconomic fundamentals. A key question about public finances is whether fiscal policy is sustainable. The amount of the budget balance draws attention to the sustainability of public finances. According to
Mendoza and Oviedo (
2003), this is nothing more than the same expenditure as the current general government revenue.
Alvarado et al. (
2004) consider a country’s fiscal policy sustainable if it meets different conditions of budgetary constraints.
Alfonso and Rault’s (
2015) analysis of EU countries shows that public finances have been sustainable across the EU but highlights that fiscal sustainability is uncertain for several member states.
Alfonso and Toffano (
2013) demonstrated fiscal regime changes using Markov’s budgetary rules. The results of quarterly data have shown shifts in fiscal systems, sometimes accompanied by regime changes affecting monetary developments. In addition to, but in the context of the state budget,
Garcia and Rigobon (
2004) examined the conditions for public debt sustainability from a risk management perspective.
1.1.2. Literature on the Impact of Economic Output
When examining economic output (which is measured by changes in GDP in the macroeconomy), it is essential to consider that it is not the absolute size of the debt stock that is of economic importance but its ratio to GDP. Therefore, the economic growth rate should also be considered when performing an analysis.
Kocner (
2014) compared the results of the newly acceding EU countries with the authors
Reinhart and Rogoff (
2010), and identified that the results were the same for the correlation between public debt and GDP.
The level of government debt has no significant effect on GDP. The turning point occurs when the 90 percent threshold is crossed. The empirical work of
Kumar and Woo (
2010) highlighted the growth-inhibiting effect of rising debt ratios, thus confirming
Schclarek’s (
2004) research findings.
Barro (
1989) highlighted the neutral impact of indebtedness on economic growth. According to his theory, market participants prepare for a period of future austerity and tax increases at a time of fiscal stimulus and accelerating public indebtedness. However, with this preparation, they neutralize the impact of public demand stimulus policy.
Égert (
2012) examined the relationship between economic growth and public debt from an empirical perspective. He reaffirmed the previous consensus among researchers on the mechanisms of impact (inflation, taxes, bond yields, uncertainty) through which indebtedness can dampen economic growth.
Research into the optimal threshold for a sovereign debt ratio has intensified following the global financial crisis. Most of these studies have reached broadly similar conclusions.
Baum et al. (
2012), by examining 20 year data from 12 Eurozone member states; and
Checherita-Westphal and Rother (
2010), who studied the same economies between 1970 and 2011, ranked the optimal level of public debt between 90 and 100 percent.
Misztal (
2010) estimated the optimal government debt ratio at 65 percent based on his calculations for the 27 EU member states during 2000–2010. Contrary to the results of the above studies,
Herndon et al. (
2014) found no significant difference in the average and median GDP growth of countries with debt levels below or above the 90 percent threshold. The researchers concluded that government debt and GDP growth varied significantly across nations and periods.
1.1.3. Real Interest Rate Literature
Loans are needed to finance public debt. The price of loans (interest) includes the risk of the given loan. Suppose the risk of funding the public debt of a shared national economy is high due to economic fundamentals, in this case, it is manifested in the higher interest rates expected by investors. However, due to the high real interest rate, the exact costs of financing public debt are also increased. If the real interest rate exceeds the actual increase, a surplus is required at the primary balance for the unchanged debt ratio. With a substantial interest rate lower than the real growth rate of the economy, the stability of the debt ratio can be ensured, even in the case of a primary deficit.
Wyplosz’s (
2019) critique of
Blanchard’s (
2019) claim essentially questions the relevance of Blanchard’s empirical motivation. Wyplosz examines data from 22 developed countries and draws attention to the fact that the case of the United States is by no means typical. In many countries, debts are more exceptional when interest rates are lower than growth is rational. In contrast, if the interest rate on government debt is lower than the economy’s growth rate, simple arithmetic shows that the initial debt can be “increased,” i.e., the government debt-to-GDP ratio is close to zero even with a zero primary balance (2019). Thus, Wyplosz questions the general validity of Blanchard’s initial motivation.
However, researchers have reached a consensus on the statement that the real burden on government interest expenditures is only the real interest rate in addition to inflation compensation. In the study, the real interest rate is nothing more than: ((1 + nominal interest rate)/(1 + inflation rate)) − 1.
The study of
Thalassinos and Yannis (
2021) points to a close relationship between the subprime mortgage crisis that erupted in 2008 and the sovereign debt crisis. Following the global economic crisis of 2008, fundamental changes in monetary policy have taken place in the euro area countries and in other economies. Interest rates have been close to zero for a long time. Central banks were forced to conduct economic stimulus activities within the Zero Lower Bound (ZLB) limits. Near-zero and historically-low interest rates have already created a new set of conditions in the economy. However, in line with the central bank inflation targets, the fight against the risk of deflation has remained a priority. The persistently low level of spending, and weak aggregate demand, has highlighted the need to stimulate lending. As a result of these developments, some central banks have exceeded the perceived lower interest rate limit, i.e., they have reduced the interest rate to a negative range.
Previously, the general economic approach was that the lower interest rate limit was at zero. According to
Hicks (
1937), based on the logic of a zero lower interest rate threshold, the presence of cash providing zero nominal interest at equilibrium precludes the existence of negative interest rates. The non-negative interest rate was more reasonable to keep some money than to have loans at lower rates.
If the cost of holding money can be ignored, saving cash is always more profitable than lending at an interest rate below zero. Consequently, the interest rate must always be positive. However,
Rognlie (
2016) pointed out that the cost of keeping money can never be ignored. The same idea was reinforced by
Anderson and Liu (
2013), i.e., maintaining cash is not free. Thus, based on a logical principle, money does not provide a zero threshold for market interest rates.
As described in the introduction to this subchapter, low and even markedly negative interest rates can reduce government debt. Lowering interest rates below zero can also be justified, as in the absence of this, low inflation will limit further declines in real rates. It follows that high real interest rates cannot help reduce high debt burdens and support aggregate demand (
Jobst and Lin 2016).
Most of the results of empirical research on real interest rates acknowledge the positive impact of negative real interest rates on government debt financing. However,
Arteta et al. (
2016), criticizes the findings. He concludes that if all countries simultaneously apply nearly the same level of negative real interest rates, this will lead to competitive devaluations. However, this may be impossible for trading partners to do.
1.1.4. The Effect of the Currency Component of Sovereign Government Debt on Changes in Debt
In some cases, especially in times of economic shocks, governments may be forced to issue government bonds in currencies other than their own because of the size, or underdevelopment, of their capital markets. At the same time, with other foreign currency issues, other very significant risk factors emerge. These risks include changes in interest expense and portfolio value due to exchange rate volatility. A greater risk is the volatility of foreign exchange rates, as the national currency may depreciate against the money of the issued government bond. In such a case, the difference in devaluation, the revaluation loss, increases government debt. The reverse can also be effective if the national currency appreciates against the money, in which case the difference in appreciation reduces public debt.
2. Materials and Methods
The study analyzes gross nominal government consolidated debt, i.e., as defined by Maastricht, using a breakdown using conventional factors. Research into these factors will be a possible resolution. I collected data on member states’ government debt, deficit, GDP change, and real interest rates for this study. The second term (independent variable) corresponded to the change in the debt ratio attributable to economic growth (GDP growth effect). The third term (independent variable) denoted the change in the debt ratio attributable to the real interest rate (real interest rate effect).
The independent variables presented above in the analysis were expressed in the value of the sovereign government debt ratio of the euro area member states as a dependent variable.
The effect of each independent variable on government debt should be interpreted as meaning that if the budget balance is negative, it increases; if it is positive, it reduces government debt. If the value of the change in GDP is negative, it grows; if it is positive, it reduces public debt. If the real interest rate is negative, it reduces it; positive, it increases public debt.
In the study, we first performed a correlation calculation with the data of the member states using Excel–Correl and then placed the obtained Pearson coefficients in
Table 1. I presented the correlation calculations in the following order: first, I calculated the relationship between the budget deficit and the government debt ratio of the euro area member states for the years 2011–2019 by member state. I then completed the same calculation between economic growth and government debt ratio, and finally between the real interest rate and the government debt ratio.
I performed the hierarchical cluster analysis with SPSS software. Hierarchical cluster analysis is most appropriate way to create homogeneous groups based on predefined variables, according to
Rapkin and Luke (
1993). Using this method, I examined the change in the government debt ratio of euro area member states over time in the context of the independent variables. I subsequently performed a cluster analysis with the correlation values shown in
Table 1.
To simplify the analysis, I organized the hierarchical clusters generated by clusters by aggregation, and analyzed them. The ordering into clusters was justified because, in the countries classified in it, the individual components had a similar effect, the difference being only in the strength of the impact.
The first cluster: a group of countries with robust inverse correlations; second cluster: a group of countries with a moderately strong inverse correlation relationship; third cluster: a group of countries with a relatively robust and straight-line relationship; fourt cluster: a group of countries with extreme, direct proportions. All values are given in percentage points. In interpreting the results, if the value of each independent variable changed by one percentage point, the number of percentage points of change of government debt as a share of GDP, is shown.
In this study, the three dependent variables used for the analysis have already been used in several articles to calculate debt dynamics, see
Ncube and Rajhi (
2014).
The sources of data required for the hierarchical cluster analysis of euro area member states were budget deficit (
Eurostat 2020a), economic growth (
Eurostat 2020b), real interest rate
DBN (
2020), and sovereign consolidated gross government debt (
Eurostat 2020c).
3. Results
The correlation values calculated from the data in the table above are given in
Table 1, below:
Table 1.
Correlation values between government debt and independent variables in euro area member states, 2011–2019.
Table 1.
Correlation values between government debt and independent variables in euro area member states, 2011–2019.
| Country | With Balance | With Economic Growth | With the Real Interest Rate |
|---|
| 1. BE | 0.5759 | −0.3797 | 0.4819 |
| 2. DE | 0.9020 | 0.1097 | 0.8623 |
| 3. EE | 0.3209 | −0.8818 | 0.5223 |
| 4. IE | 0.8528 | −0.4417 | 0.7077 |
| 5. EL | −0.5681 | 0.6861 | −0.7762 |
| 6. ES | −0.7217 | 0.6170 | −0.6827 |
| 7. FR | −0.9365 | 0.1855 | −0.8720 |
| 8. IT | −0.7020 | 0.3828 | −0.8143 |
| 9. CY | −0.1240 | 0.1075 | 0.2373 |
| 10. LV | 0.4047 | 0.1374 | 0.1485 |
| 11. LT | −0.0515 | −0.5830 | 0.6074 |
| 12. LU | 0.1173 | −0.0103 | 0.2734 |
| 13. MT | 0.8541 | −0.6546 | 0.7772 |
| 14. NL | 0.8064 | −0.5575 | 0.7759 |
| 15. AT | 0.8411 | −0.2933 | 0.3058 |
| 16. PT | 0.2280 | −0.0298 | −0.1357 |
| 17. SI | −0.1664 | 0.5379 | −0.4746 |
| 18. SK | −0.1568 | −0.2580 | 0.1620 |
| 19. FI | 0.1175 | 0.1757 | 0.1437 |
According to
Guilford (
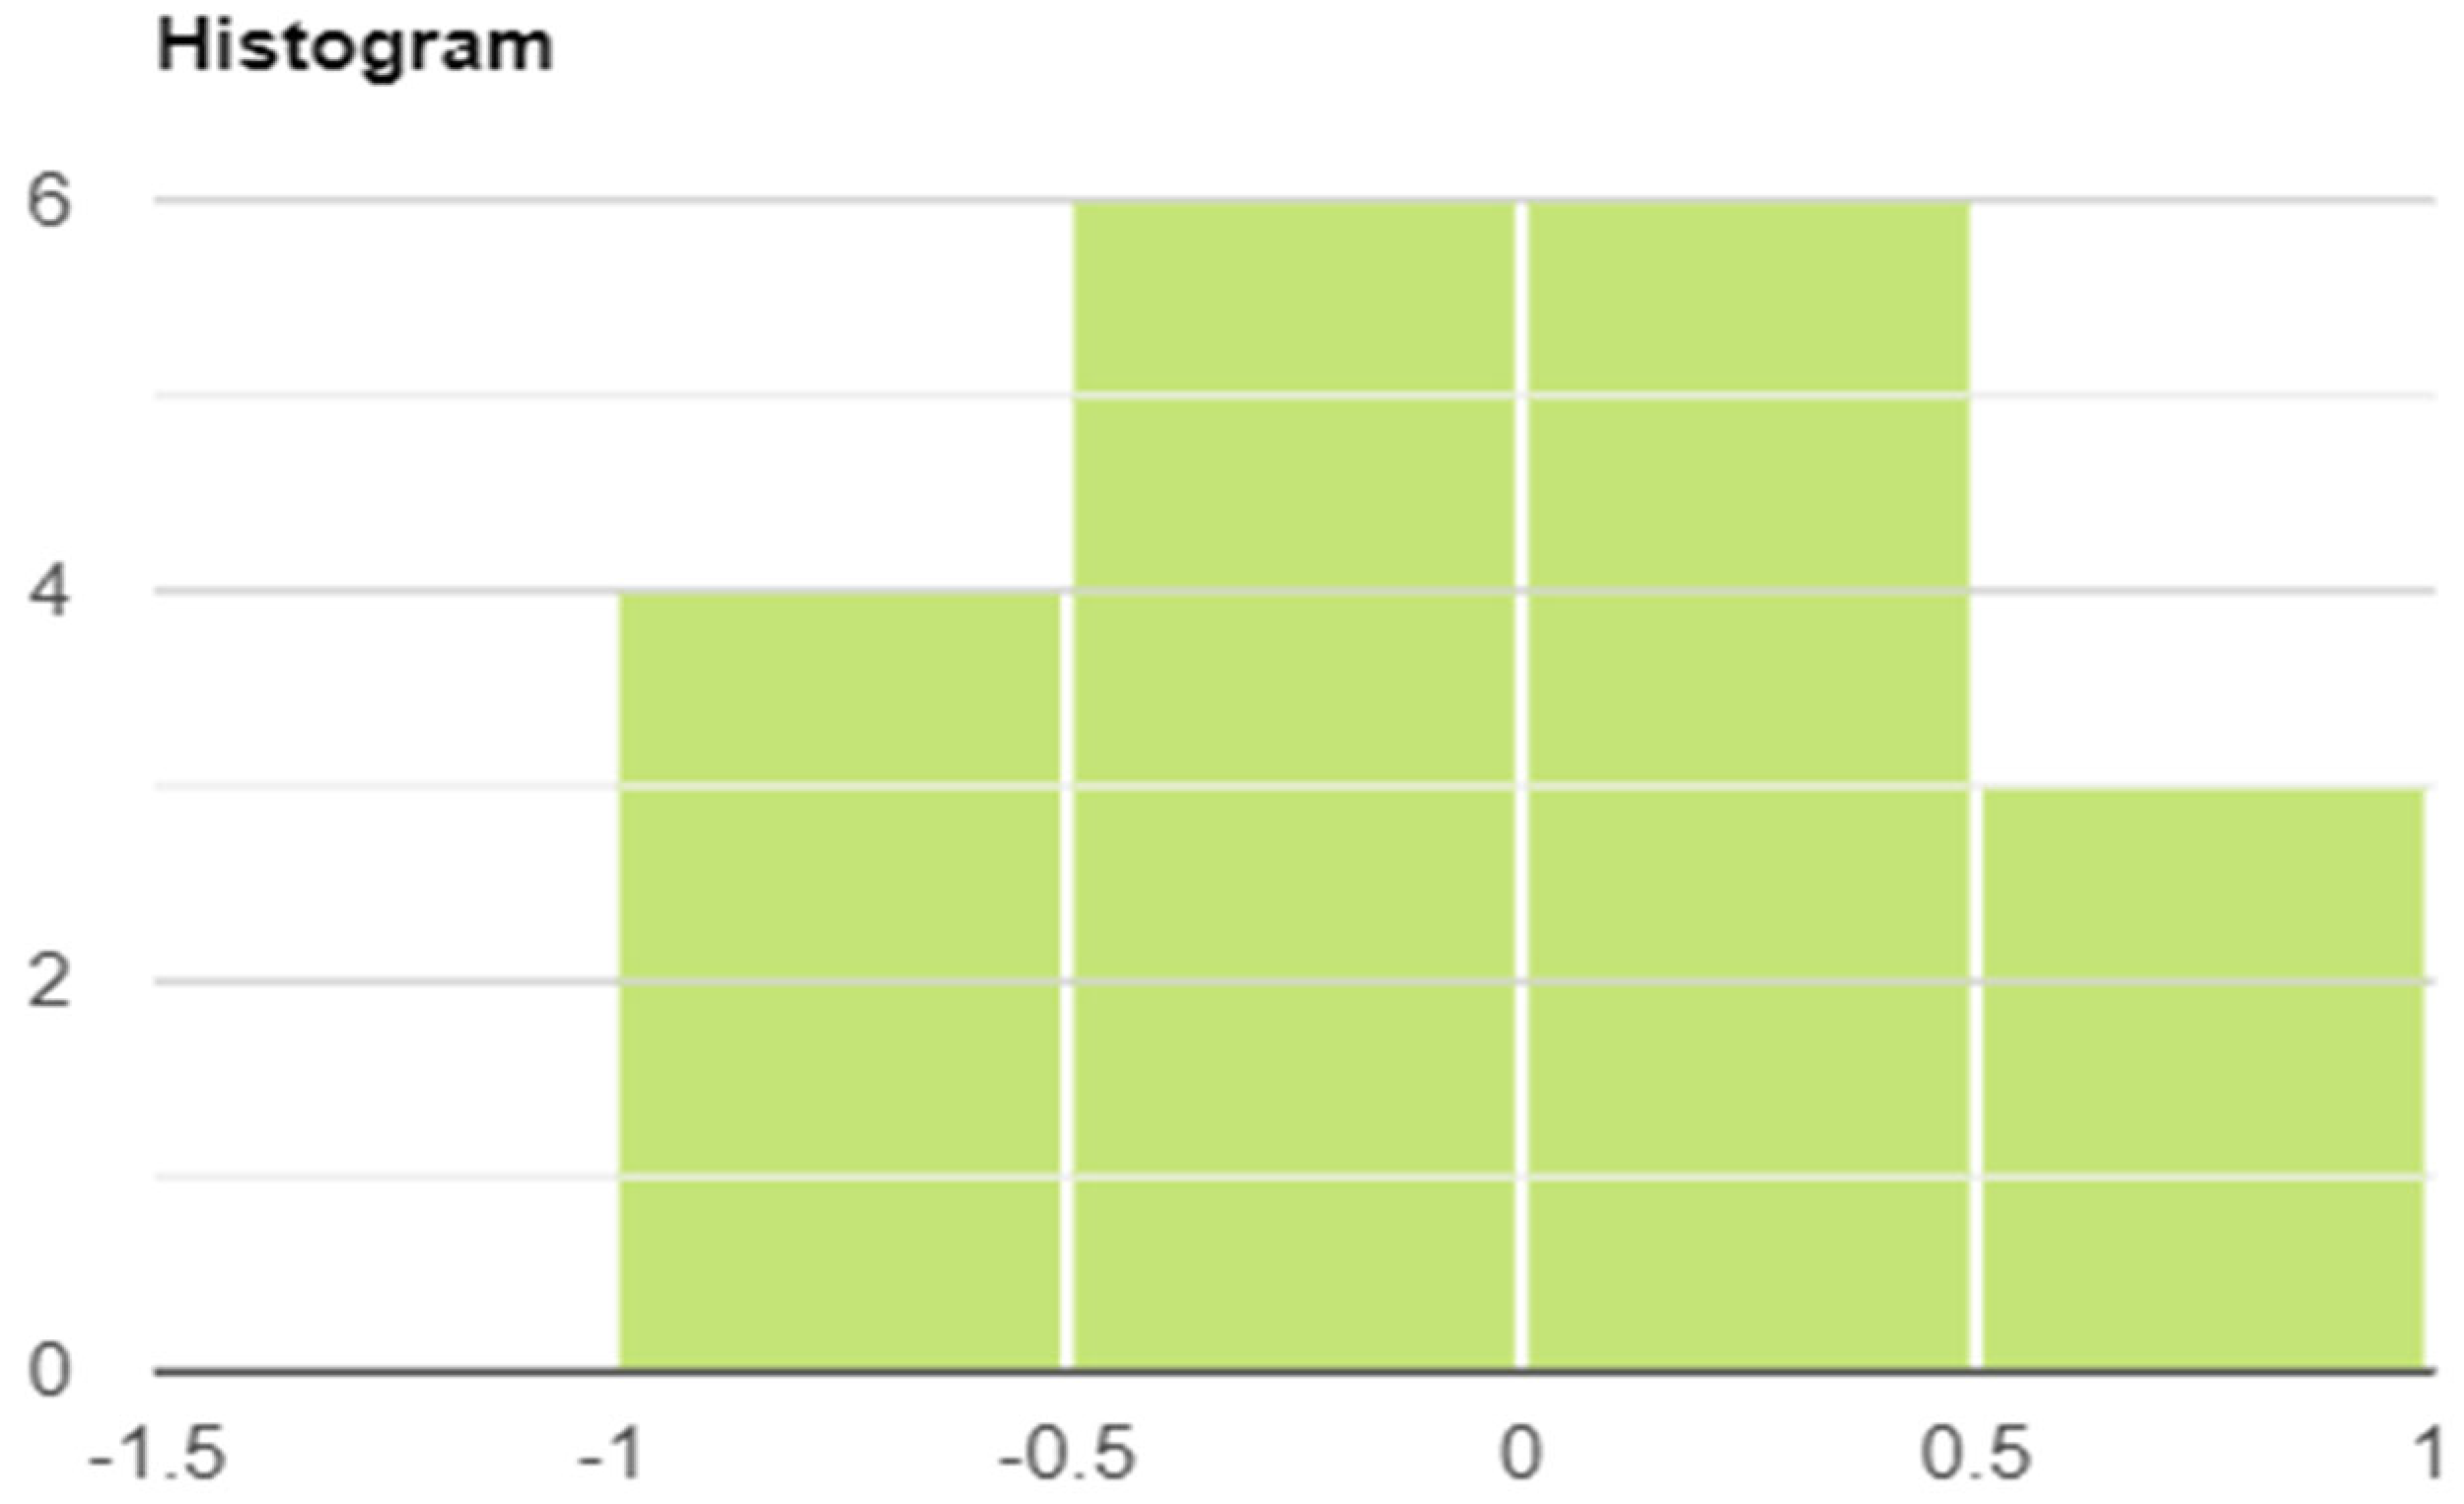
1953), it is relevant to note the value of Pearson’s correlation coefficient obtained from the calculations. If it is close to +1 or −1, we say it is a close, or high, correlation between the two variables. The closer the relationship, the closer the absolute value of the correlation coefficient is to 1. The looser the relationship between two variables, the closer the value of the correlation coefficient is to 0. If the correlation coefficient is positive, the relationship between the two variables is straight; if the correlation coefficient is negative, the relationship between the two variables is inversely proportional. The data in the table show how closely the dependent variable (the evolution of government debt) is related to the independent variables (economic growth, budget balance, and real interest rates), separately by member state. The results of the calculations are first present in the form of a histogram. Written analysis of the results follows the figures.
3.1. Empirical Results, Clusters Based on Budget Deficits
Before performing a hierarchical cluster analysis, the study examined the distribution of the correlation coefficient data. Data can only be used for clustering if they are normally distributed. The tool for testing normality is the Shapiro–Wilk test. Testing is performed on all three variables in the study.
Shapiro–Wilk test results:
p-value: 0.183, W: 0.931, sample size (n): 19, average (
): 0.137, median: 0.117, sample standard deviation (S): 0.589, sum of Squares: 6.236, b: 2.41, skewness: −0.285, skewness shape symmetrical (pval = 0.586), excess kurtosis: −0.991, kurtosis shape: mesokurtic, normal like (pval = 0.329). Since
p = 0.183 (
p > 0.05), the variable had a normal distribution, see
Figure 1.
I organized the SPSS hierarchical clusters into clusters by aggregation and analyzed them to simplify the analysis. I presented the theoretical basis of cluster arrangement in Chapter 2.
First cluster, interval: [−1.0; −0.5]. With hierarchical clustering, four countries were included in this group: France, Spain, Italy, and Greece. The correlation coefficient of −0.9365 for France showed that the increase in the country’s government debt ratio from 87.8 percent to 98.1 was least affected by the deficit budget throughout the period under review. In France, the growth rate of public expenditure outpaced that of the economy (with tax revenue as a share of GDP unchanged), leading to a deterioration in the budget balance. Over the past nine years, such a process has taken place, with budget deficits averaging around four percent, one percentage point above the EU maximum of three percent. Nevertheless, the other two influencing factors (economic growth and real interest rates) played a more significant role in increasing the country’s 10.3 percent GDP debt ratio, shown in
Section 3.2 and
Section 3.3. I present in subsections.
Its exceptionally high budget deficit explains Spain’s first place in the cluster. Under review, the budget deficit ratio to GDP ranged from −2.5 to −10.7 percent, one of the highest among euro area member states. These values contributed decisively to the increase in the government debt ratio from 69.9 percent to 95.5 percent. Similar processes and discounts were found for Italy and Greece. The Italian budget closed with a deficit each year under review, with the government debt ratio rising from 119.7 to 134.7 percent. The Greek budget reached the highest deficit in the euro area in 2013 (−13.2 percent). The deficit was always high in the first five years, and the budget closed with only a minimal surplus in the next four years. The country’s public debt ratio rose from 175.2 to 180.5 percent, the highest in the euro area and the European Union.
Second cluster, interval: [−0.5; 0.0]. Similar macroeconomic developments took place in the macroeconomic data of the other four countries in the cluster (Lithuania, Slovenia, Slovakia, and Cyprus). The period began with a high state budget deficit and only gradually moderated. In the case of Cyprus and Slovenia, the government debt ratio increased, while in Lithuania and Slovakia, the indicator’s value stagnated.
Third cluster, interval: [0.0; 0.5]. Estonia, Lithuania, Luxembourg, Finland, and Portugal form the group. Estonia is the member state of the Eurozone with the lowest government debt ratio; the balance to GDP was only 8.4 percent at the end of 2019. Its budget was balanced, closing eight times out of the nine years examined. Lithuania’s government debt ratio was on a declining trend, which was already low. In 2019, it was 36.9 percent, which is less than half the Eurozone average. Its budget balance ranges from −1.6 to 0.2 percent over the past eight years. In the years examined, Luxembourg closed with a relatively low government debt ratio and a surplus budget. Finland had a moderate government debt ratio but a budget deficit of 0.7–3.0. Portugal was the worst-performing member of the cluster. The public debt ratio started from the highest, and its budget balance started at a high rate. Despite this, the country entered a cluster with a moderately strong, straight-line relationship explained by two factors. Its government debt ratio increased slightly (by +2.8 percent), and the other was that its budget balance declined most dynamically, improving from a deficit of −7.7 percent to a surplus of 0.1 percent.
Fourth cluster, interval: [0.5; 1.0]: There is a robust, straight-line correlation between the positive change/decrease in the government deficit and the government debt ratio in Belgium, Germany, Malta, Ireland, Austria, and the Netherlands. In Belgium, this is explained because the country’s budget deficit has been small in recent years over the period under review. Still, the country’s budget closed with a significant surplus at the beginning of the period. This fact also contributed significantly to the country’s government debt ratio falling from 103.5 percent to 98.1 percent. In the countries included in the cluster, there was a significant decrease in the public debt ratio during the review. One of the determining factors is that the general government deficit was decreasing in the examined years 2011–2019. The budget has already closed with a surplus in all countries in recent years.
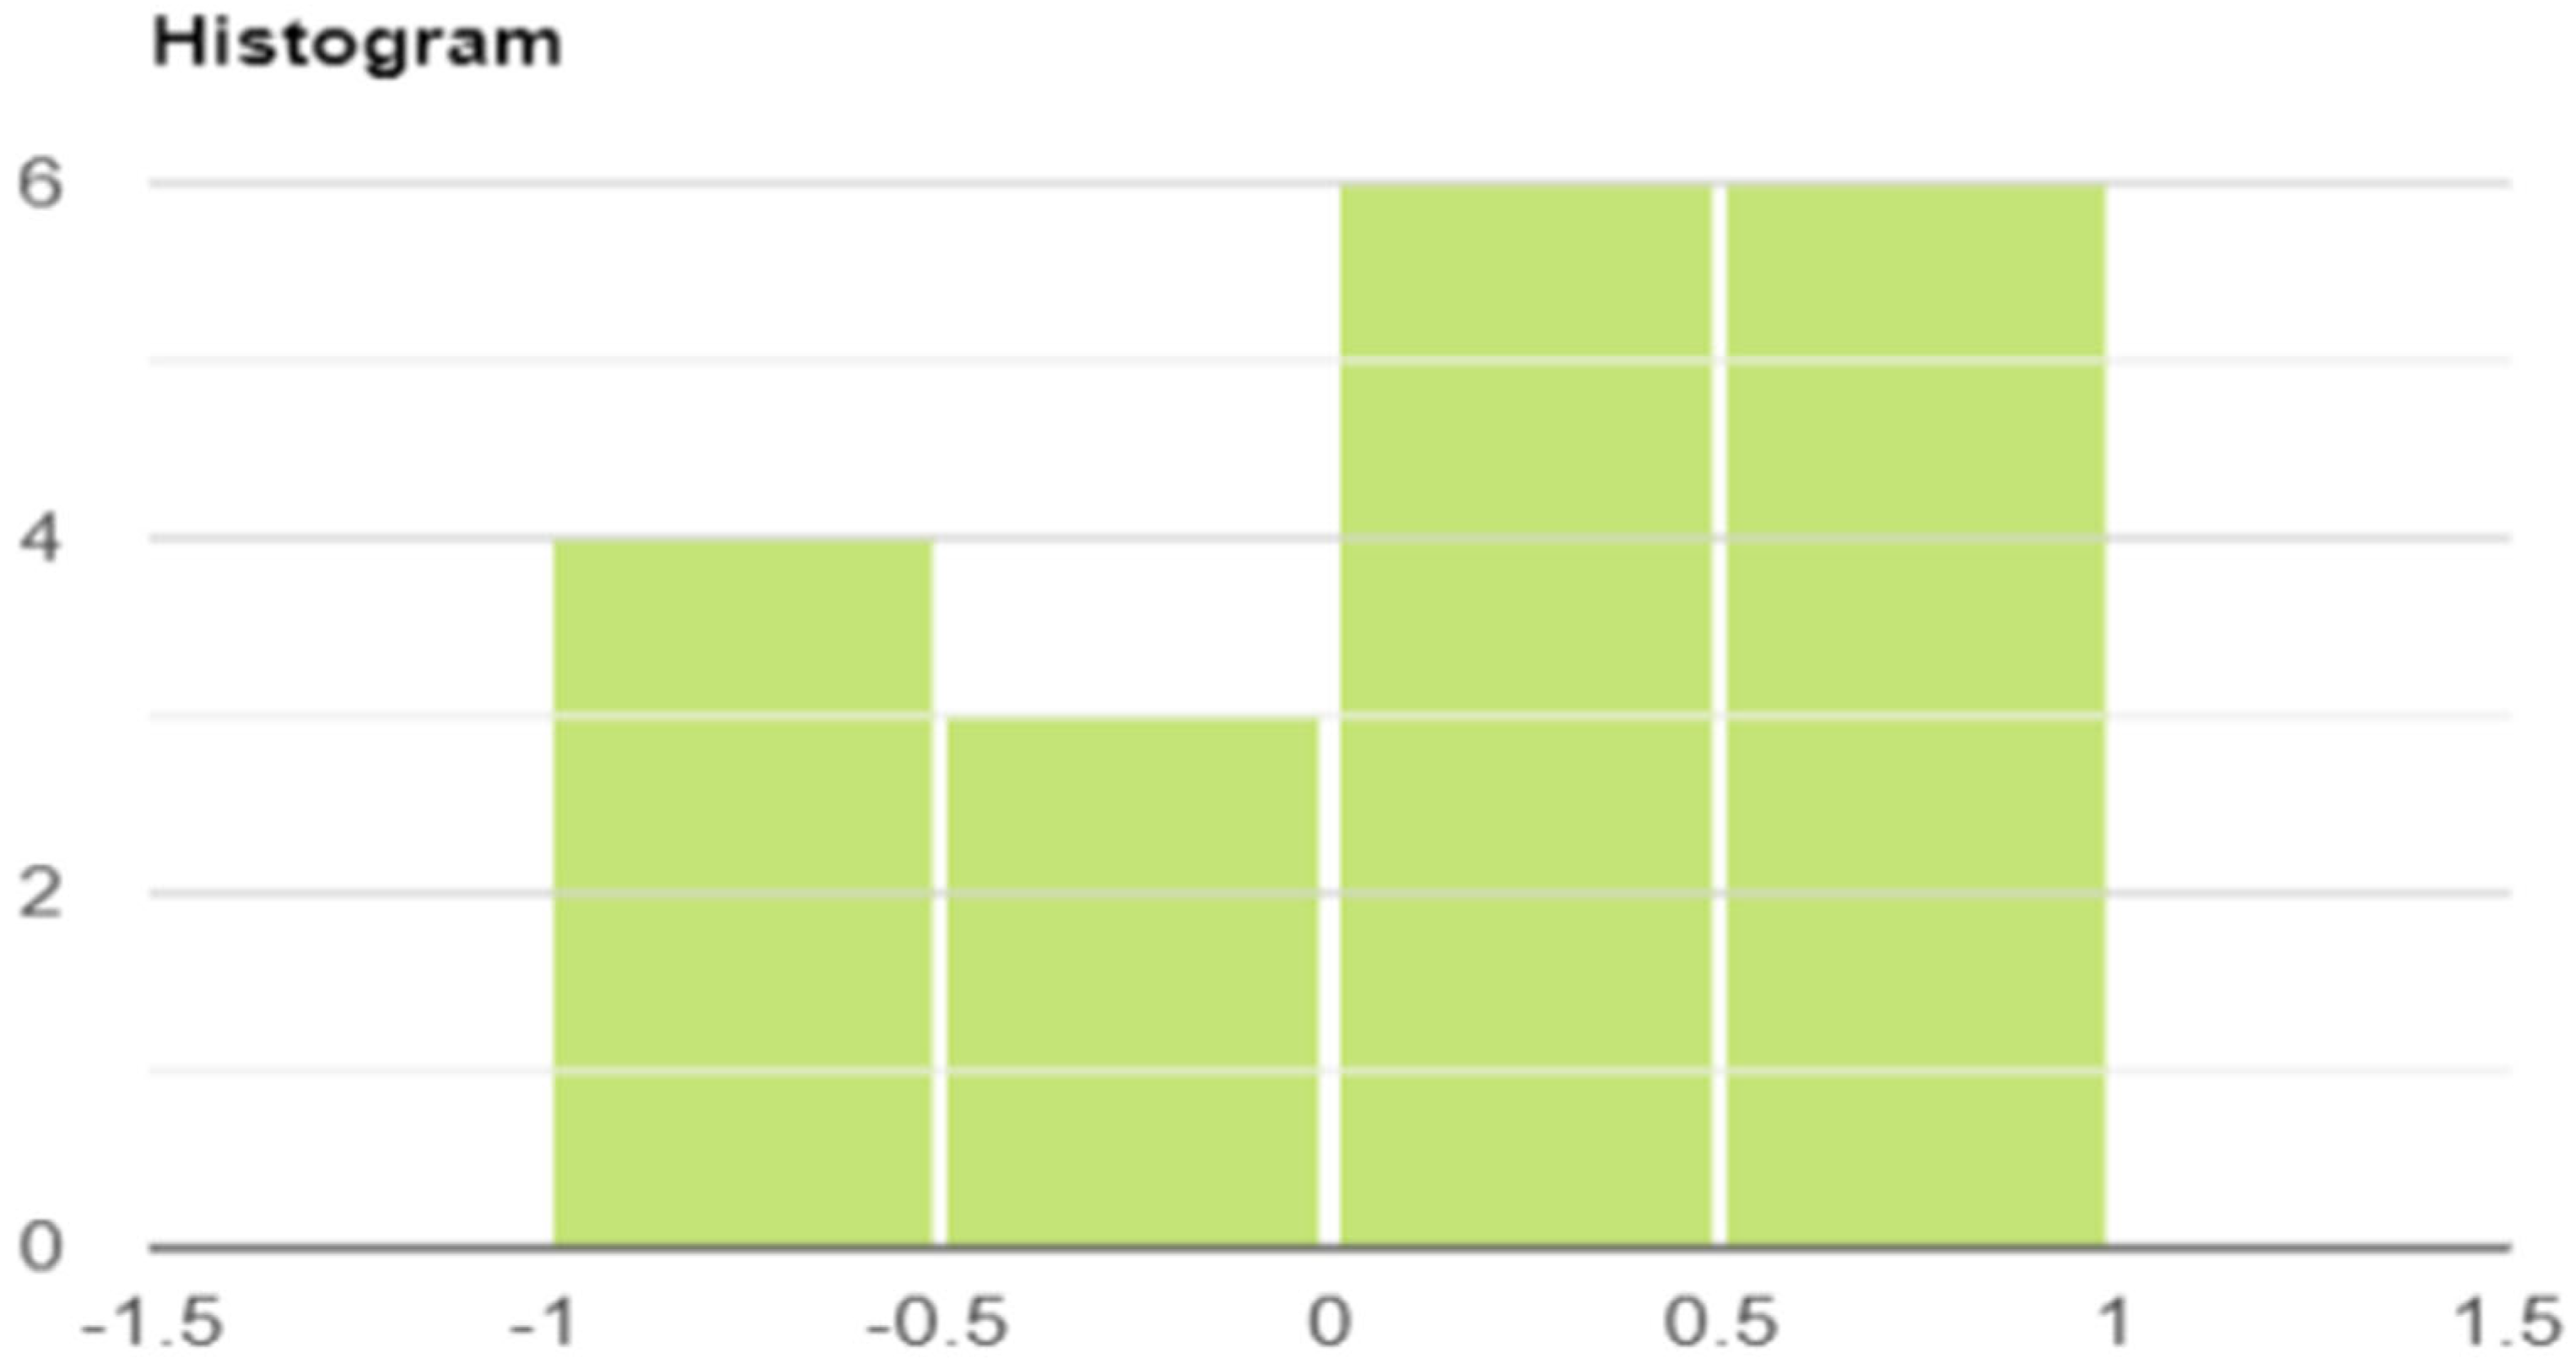
3.2. Empirical Results, Clusters Based on Economic Growth
Shapiro–Wilk test results:
p-value: 0.729, W: 0.968, sample size (n): 19, average (
): −0.059, median: −0.0103, sample standard deviation (S): 0.452, sum of squares: 3.675, b: 1.886, skewness: −0.0423, skewness shape symmetrical skew: potentially symmetrical (pval = 0.936), excess kurtosis: −0.875, kurtosis shape: normal tails potentially mesokurtic, normal like tails (pval = 0.388). Since
p = 0.729 (
p > 0.05), the variable has a normal distribution, see
Figure 2.
First cluster, interval: [−1.0; −0.5]. Estonia, Malta, Lithuania, and the Netherlands form groups. Estonia’s public debt-to-GDP ratio was meager among euro area countries, ranging from 6.1 to 10.6 percent between 2011 and 2019. The country’s temporary budget deficits explain the minimal rate increase. All other countries in the cluster significantly decreased the government debt ratio. Malta −26.7 percent, Lithuania −3.8 percent, the and Netherlands −13.0 percent.
Second cluster, interval: [−0.5; 0.0]. Ireland, Belgium, Austria, Slovakia, Portugal, and Luxembourg are members of the cluster. Luxembourg, Portugal, and Slovakia showed a slight increase in the government debt ratio. These countries had the slowest average economic growth at just 2.1 percent. However, in all other countries in the cluster, the rate of decline was significant, with Ireland at −53.6 percent, Belgium at −5.4 percent, and Austria at −11.9 percent. The primary explanation for this is that the average economic growth in these countries was 3.9 percent during the period under review. Outstanding among the group is Ireland, where the government debt ratio fell by 53.6 percent, while the average annual economic growth was 6.8 percent.
Third cluster, interval: [0.0; −0.5]. Cyprus, Latvia, Germany, Finland, France, and Italy are members of the cluster. The correlation coefficients between these countries’ government debt ratios and economic growth were positive, meaning that a moderately robust and straight-line relationship can be detected between the two variables. The government debt ratio of Germany and Latvia decreased, while that of the other countries increased. The government debt ratios of the other member states of the group have risen. This is mainly explained by the fact that the economic growth of these countries was deficient, only 1.4 percent. The situation in Italy is particularly striking, as the average annual economic growth in GDP over the period under review is only 0.1 percent. The country’s low economic growth value could not reduce public debt, which rose from 119.7 percent in 2011 to 134.7.
Fourth cluster, interval [0.5; 1.0]. Slovenia, Spain, and Greece were included in this cluster. The development of their economic growth primarily influenced the government debt ratio of these countries. The increase in government debt ratios was as follows: Slovenia 19.1 percent, Spain 25.6 percent, and Greece 5.3 percent. These countries’ average annual economic growth lagged significantly behind the euro area countries. In the case of Slovenia, the average yearly GDP growth was 2, in Spain 1.2 percent, while in Greece −1.7 percent, so GDP decreased.
3.3. Empirical Results, Clusters Based on Real Interest Rates
Shapiro–Wilk test results: Shapiro–Wilk test results:
p-value: 0.0714, W: 0.909, sample size (n): 19, average (
): 0.104, median: 0.237, sample standard deviation (S): 0.584, sum of squares: 6.151, b: 2.365, skewness: −0.481, skewness shape: symmetrical_skew potentially symmetrical (pval = 0.358), excess kurtosis: −1.109, kurtosis shape: normal tails, potentially mesokurtic, normal like tails (pval = 0.274). Since
p = 0.0714 (
p > 0.05), the variable has a normal distribution, see
Figure 3.
First cluster, interval: [−1.0; −0.5]. France, Italy, Spain and Greece are members of the group. In the case of high real interest rates, the explicit costs of financing public debt are also high. In the case of government interest expenditure, the real burden is only the real interest rate in addition to the inflation compensation. Of the countries in the cluster, Greece’s average real interest rate was the highest in the period under review, at nine percent. With such a high real interest rate, the reduction of public debt is only mathematically conceivable, and its reduction is almost ruled out in economic policy. With such a high real interest rate, Greece’s public debt could have been reduced only if economic growth had exceeded it. The situation in Italy is similar to that of the Greece, in that the real interest rate was positive every year, but its rate was significantly lower, averaging two percent. However, this rate was accompanied by low economic growth of only 0.1 percent. As a result, Italian public debt has risen significantly. Data for France were the best in this cluster. Real interest rates on financial instruments financing French public debt were positive at the beginning of the period under review, but have turned negative in recent years, averaging just 0.5 percent. This contributed significantly to the fact that public debt grew at a more moderate pace than in France or in Italy.
Second cluster, interval [−0.5; 0.0]. Slovenia, Finland and Portugal are members of the cluster, respectively. With hierarchical cluster analysis, the four countries in this group have common features based on real interest rates. All countries increased public debt, but to varying degrees. Examining countries in terms of real interest rates, it was seen that they financed their public debt with high real interest rates at the beginning of the period under review. Portugal was in a particularly difficult situation, with real interest rates above 10 percent at the beginning of the period (10.5 percent in 2011 and 11.0 percent in 2012). In the second half of the period, the real interest rates of all countries in the group started to decline and by the end of the period the national economy was able to finance its public debt with negative real interest rates. Negative real interest rates made a significant contribution to increasing the public debt of these countries with only moderate dynamics in the last years of the period.
Third cluster, interval [0.0; 0.5]. Latvia, Slovakia, Cyprus, Luxembourg, Austria, and Belgium are members of the cluster. The correlation between real interest rates and government debt was medium-strong and positive for these countries. Cyprus, Luxembourg, and Slovakia saw their government debt ratios rise, while Latvia, Belgium, and Austria fell. The common feature in these countries is that they already financed their public debt with positive real interest rates at the beginning of the period under review (except Luxembourg, which already had a negative real interest rate in 2011). However, this was followed by the highly low-interest-rate environment in several developed countries, resulting in negative real interest rates. In all the countries in the cluster, this was the case at the end of the study period. In the second half of the period, the low negative real interest rates effectively supported the moderation in the dynamics of government debt ratios in these countries and their public debt.
Fourth cluster, interval: [0.5; 1.0]. Using hierarchical cluster analysis, Estonia, Lithuania, Ireland, the Netherlands, Malta, and Germany were included in this cluster. In these economies (except for Estonia, which has the lowest government debt ratio), the weighted government debt ratio declined. At the beginning of the period under review, all countries financed their public debt with positive (even very high) real interest rates. However, in the second half of the period, real interest rates became negative in all economies (due to the highly low-interest-rate environment mentioned earlier). Due to cheap financing sources, the direct costs of public debt decreased significantly. These countries became the ones that contributed most to the decline in their government debt ratios by robust cuts in real interest rates by turning negative.
4. Discussion
The study showed how the primary drivers of government debt growth (economic growth, budget deficit, and real interest rates) shaped the government debt ratios of euro area member states, depending on monetary policy and external and internal economic conditions. I did not address the economic policy context in this study, and my analysis is limited to the main trends of macro processes. My research presents the consequence (change in the government debt ratio), but I do not name the cause. At the end of 2019, the origins of government debt ratios in euro area member states would require a separate study. The causes of public debt are studied by
Pescatori et al. (
2014),
Yared (
2019), and
Holzmann and Neck (
2001).
The aggregate government debt ratio of the 19 euro area member states fell from 87.7 percent to 84.0 percent by the end of 2019, relative to GDP. Meanwhile, economic output, as a share of GDP, increased dynamically over the period under review. Suppose we accept the statistical rule that a plus or minus five percent change in any indicator can be significant. In that case, the first hypothesis is not met because, in this case, the gross sovereign debt ratio should have fallen below 83.3 percent.
The second hypothesis was confirmed as the gross sovereign debt ratio of the member states decreased overall. If the intention of debt reduction was not declared or deleveraged in the member states’ economic policies, there was no reduction in public debt relative to GDP. A government’s intention to reduce public debt alone was not enough, it also required favorable macroeconomic developments. Debt reduction was not possible without an economic policy objective.
Each component contributed to the decrease, to varying degrees, in the independent variables. The most significant factor in the decline of the aggregate government debt ratio, of the euro area member states, was the decline in the general government deficit, as indicated by the average value of the government debt cluster of 0.136. The trend reduction of deficiencies was observed in all member states. Even out of the 19 member states, 12 national economies had surplus general government balances at the end of the period. The budget balance and surplus indicate a state of equilibrium in a national economy in which nominal public debt can also decrease (ceteris paribus).
In certain circumstances, monetary policy may have a realistic goal of debt inflation. The financial tool for this is when a negative real interest rate environment develops, which means inflation is higher than the bond market yields. The preliminary hypothesis was fulfilled in that in the second half of the period under review, negative real interest rates developed in all euro area member states (except Cyprus); they contributed as the second most crucial factor in reducing government debt ratios. The contribution of negative real interest rates to the reduction in the government debt ratio of euro area member countries is explained by the average value of the government debt cluster with real interest rates of 0.104.
Economic growth can also be an influential factor in reducing sovereign gross government debt. Suppose the budget is balanced and economic growth is higher than the interest rate on government debt. In that case, it can be seen with the help of simple arithmetic that the debt can be “increased,” i.e., government debt as a proportion of GDP converges to zero. Economic growth could not play this theoretically optimal role. It contributed the least of the three components to reducing the euro area member states’ sovereign gross government debt ratio. The average value of this component in the cluster of government debt was −0.059. The value of the coefficient close to zero shows that the two variables (government debt ratio and economic growth) are uncorrelated.
The ratio of gross consolidated government debt to GDP declined moderately in the euro area. The study showed how closely the decline in government debt was related to the three macroeconomic variables. The study examined the closeness of the relationship using a macroeconomic method. The study did not address the political implications of the reduction in government debt, as this would be a completely different approach to the research topic. The policy implications of the reduction in the government debt ratio are detailed and summarized by the
European Commission (
2019).
The macroeconomic model presented in this study is widely used by researchers in practice, primarily to forecast the public debt of a selected country. This method is also used, for example, in the study by
Fitch Ratings (
2021).
The limitation of the research is that the econometric model used here cannot be applied to examine the public debt of all countries. The model can be used to analyze countries’ public debt in which the currency of the payment instrument and the money financing the debt is the same. If these currencies are the same, no exchange rate appreciation or devaluation is required.
The future direction of research on this topic could be, for example, if a study examines the specific fiscal instruments (such as structural reforms, fiscal investment, etc.) and monetary instruments (such as changes in central bank base rates, central bank asset purchases, etc.) used by member states to reduce public debt over the period.


