Article

A Fractal View on Losses Attributable to Scams in the Market for Initial Coin Offerings

School of Accounting and Finance, University of Vaasa, P.O. Box 700, FI-65101 Vaasa, Finland
*
Author to whom correspondence should be addressed.
J. Risk Financial Manag. 2022, 15(12), 579; https://doi.org/10.3390/jrfm15120579
Submission received: 10 November 2022 / Revised: 29 November 2022 / Accepted: 1 December 2022 / Published: 5 December 2022
(This article belongs to the Special Issue New Developments in Entrepreneurial Finance)

Abstract

:
Analogous to traditional Initial Public Offerings (IPO), Initial Coin Offerings (ICOs) represent an emerging channel through which firms can access external funding using the new evolving digital financial market for tokens. However, while ICOs represent an alternative funding channel for startups, the ICO market is essentially unregulated, which creates opportunities for fraud such as ‘ICO scams’. This paper addresses the question as to what the expected losses attributable to scams in the market for ICOs are. Using web scrapping techniques, all ICOs launched between August 2014 and December 2019 were first screened for accusations of fraud, before a novel methodological framework was employed to understand the true costs associated with scams. The findings reveal that 56.80% of ICOs were subject to scams, corresponding to 65.80% of the relevant market capitalization, estimated at USD 15.38 billion. Moreover, it is found that the loss distribution due to scam ICOs is governed by a fractal process. Specifically, the power law exponent for the distribution governing losses due to scam ICOs suggests that the second moment is not defined, rendering the sample mean unstable. Taken together, the results in this paper provide evidence that we have not yet seen the largest loss in the market for ICOs and are supportive of an urgent need for ICO market regulations from governments and regulatory agencies.

1. Introduction

New technologies built on blockchain are revolutionizing the business world (Fisch 2019; Härdle et al. 2020; Gan et al. 2021; Grobys et al. 2022). For startups and entrepreneurs, such innovations offer new opportunities to access external finance through alternative channels. One such channel is the Initial Coin Offering (ICO). First emerging in 2013 (Fisch 2019; Gan et al. 2021), ICOs have been compared to more traditional financing channels, including initial public offerings (IPOs), venture capital (VC) and crowdfunding (Block et al. 2021). Most analogous to Initial Public Offerings (IPOs) (Howell et al. 2020; Härdle et al. 2020; Hornuf et al. 2022), ICOs utilize blockchain technologies, whereby a blockchain-based issuer sells cryptographically secured digital assets—typically referred to as tokens. These tokens give token holders the right to an issuer’s product or service.
For new firms, ICOs offer several interesting and attractive features, including (i) an absence of entry constraints, (ii) scope for exponential growth, (iii) an absence of geographical barriers, and (iv) simple validation, while to investors they can offer potentially lucrative returns (Fisch 2019; Fisch and Momtaz 2020; Benedetti and Kostovetsky 2021; Czaja and Röder 2022). Yet, despite the potential of ICOs to support the growth of new businesses, they are also associated with significant risks. Notably, unlike IPOs, which are subject to strict legal regulations, the unregulated nature of the ICO market, combined with confusion regarding underlying technologies, mean ICOs exhibit high potential for scam-related fraud, which can be very harmful to investors (Howell et al. 2020). An estimate by the research group SATIS, suggests that 78% of all ICOs to date that successfully raise their targets have turned out to be scams, which can erode investor trust.
Given this, an important question is what are the expected losses attributable to scams in the market for ICOs? The answer to this question is important because it can inform policy makers seeking to better understand the nature and impact of fraud in this largely unregulated market, and could contribute to the development of future regulation designed to protect market participants. This paper addresses that question by exploring the size of expected losses associated with scam ICOs using a novel methodology based on power laws. Doing so meant analyzing the population of 5036 ICOs launched between August 2014 and December 2019. Screening the available data on scam accusations and available data on raised funding, 576 ICOs were identified with available relevant information, corresponding to cumulative losses of USD 10.12 billion, which highlights the enormous societal impact of this criminal activity. The largest loss in the sample is the so-called ‘Petro-scam’, where investors lost a total of USD 735 million. In this respect, it is important to note that the Venezuelan Legislative Assembly also declared Petro as illegal in 2018.
This study makes several contributions. First, it contributes to the emerging literature on ICOs. Recent studies have examined the extent to which ICOs are connected to cryptocurrency markets. For example, Allen et al. (2022) investigate whether the ICO market in 2017–2018 and in 2021 exhibits contagion from Bitcoin and Ether prices and present evidence that correlations are typically low except when a cryptocurrency bubble bursts. Other studies have focused on determinants of successful IPOs (e.g., An et al. 2019; Fisch 2019; Howell et al. 2020; Czaja and Röder 2022) and found that several factors can reduce information asymmetries alongside some non-traditional factors (e.g., Howell et al. 2020; Czaja and Röder 2022). Additionally, studies such as Bellavitis et al. (2020) demonstrate how country ICO bans and the role of the media and universities can influence the diffusion of ICOs across the world. Cumming et al. (2019) describe the inadequacies of current enforcement of ICOs under existing regulatory frameworks and argue for the importance of international regulation of this market. There is also literature exploring asymmetric information theory related to ICO issuances. Notably, Hornuf et al. (2022) investigate whether the degree of prior information exposure to investors predicts various ICO frauds. They show that fraudulent ICOs are typically associated with significantly higher funding amounts raised, and that issuers who post their code on GitHub are at a greater risk from phishing and hacker activities. The present study both complements and reinforces these streams by showing that the expected losses attributable to ICO fraud are of economic significance because the sums of financial means involved are substantial and by modeling the costs associated with ICO scams.
This paper also adds to knowledge regarding the degree to which man-made phenomena are exposed to tail risks by exploring, for the first time, how losses in the ICO market may be explained by sociobiology (i.e., related to natural processes): specifically, by power laws. Man-made phenomena are often fat-tailed-distributed and, hence, can be modeled via power laws (West and Salk 1987). In doing so, it complements recent papers that model such behavior in traditional financial markets. An exemplar is Clauset et al. (2009), who argue, and demonstrate empirically, that power law distributions occur in many situations of scientific interest and have significant consequences for our understanding of man-made phenomena. Most closely related, however, is Warusawitharana (2018), who estimates the power law coefficients of 41 stocks over the 2003 to 2014 period and finds that the power law coefficient of the cross-sectional distribution ranges between 2.09 and 3.46. Other recent studies test the power law hypotheses for the realized variance of asset markets (Grobys 2021), the volatility processes (Grobys et al. 2021) and the hacking of cryptocurrencies (Grobys et al. 2022). Extending this literature, the present study is the first to derive implications from power laws for modeling losses in the market for ICOs.
In sum, the present study makes a novel contribution to the aforementioned research streams, by (i) first identifying 13 distinct types of scams observed in the cluster for scam ICOs and (ii) second, through exploring the tail risk associated with losses due to scam ICOs. This is an important and timely issue given that the sums of funding and, especially, losses, as demonstrated in this paper, involved in this new market are highly significant. Moreover, it also contributes to a broad and fast-growing interdisciplinary literature that considers issues related to new digital ecosystems, especially the literature investigating aspects of Bitcoin and Ethereum ecosystems (e.g., Yermack 2017; Aune et al. 2017; Howell et al. 2020; Härdle et al. 2020; Makarov and Schoar 2020; Chod et al. 2020; King and Koutmos 2021; Grobys et al. 2022; Allen et al. 2022). For example, Grobys and Sapkota (2020) analyze the default risk of 143 cryptocurrencies from 2014 to 2018 and estimate that about 60% of all cryptocurrencies eventually end up in default, while Chod et al. (2020) demonstrate that a blockchain protocol that leverages Bitcoin can help increase the transparency of firms’ supply chain operations, which, in turn, allows firms to access lower-cost external financing through a positive signaling effect. Perhaps most closely related in this stream to the present study is Foley et al. (2019), who propose a model to identify illegal activities in Bitcoin. The authors find that about one-quarter of all users (26%) and close to one-half of Bitcoin transactions (46%) are associated with illegal activity. Finally, Grobys et al. (2022) adopt a fractal perspective of cyberattacks in the Bitcoin market and show the expected loss associated with cyberattacks is 106,171.49 coins. All these studies show that, unlike traditional asset markets, new digital financial markets involve different types of risks such as fraud risk, risk of money laundering or credit risk. The present study adds to this literature by providing novel evidence of the costs associated with ICO scams.
The rest of the paper is organized as follows: Section 2 describes the process of data retrieval and generation of the ICO scam sample. Section 3 presents the empirical framework and discusses the results. Section 4 concludes.

2. Data

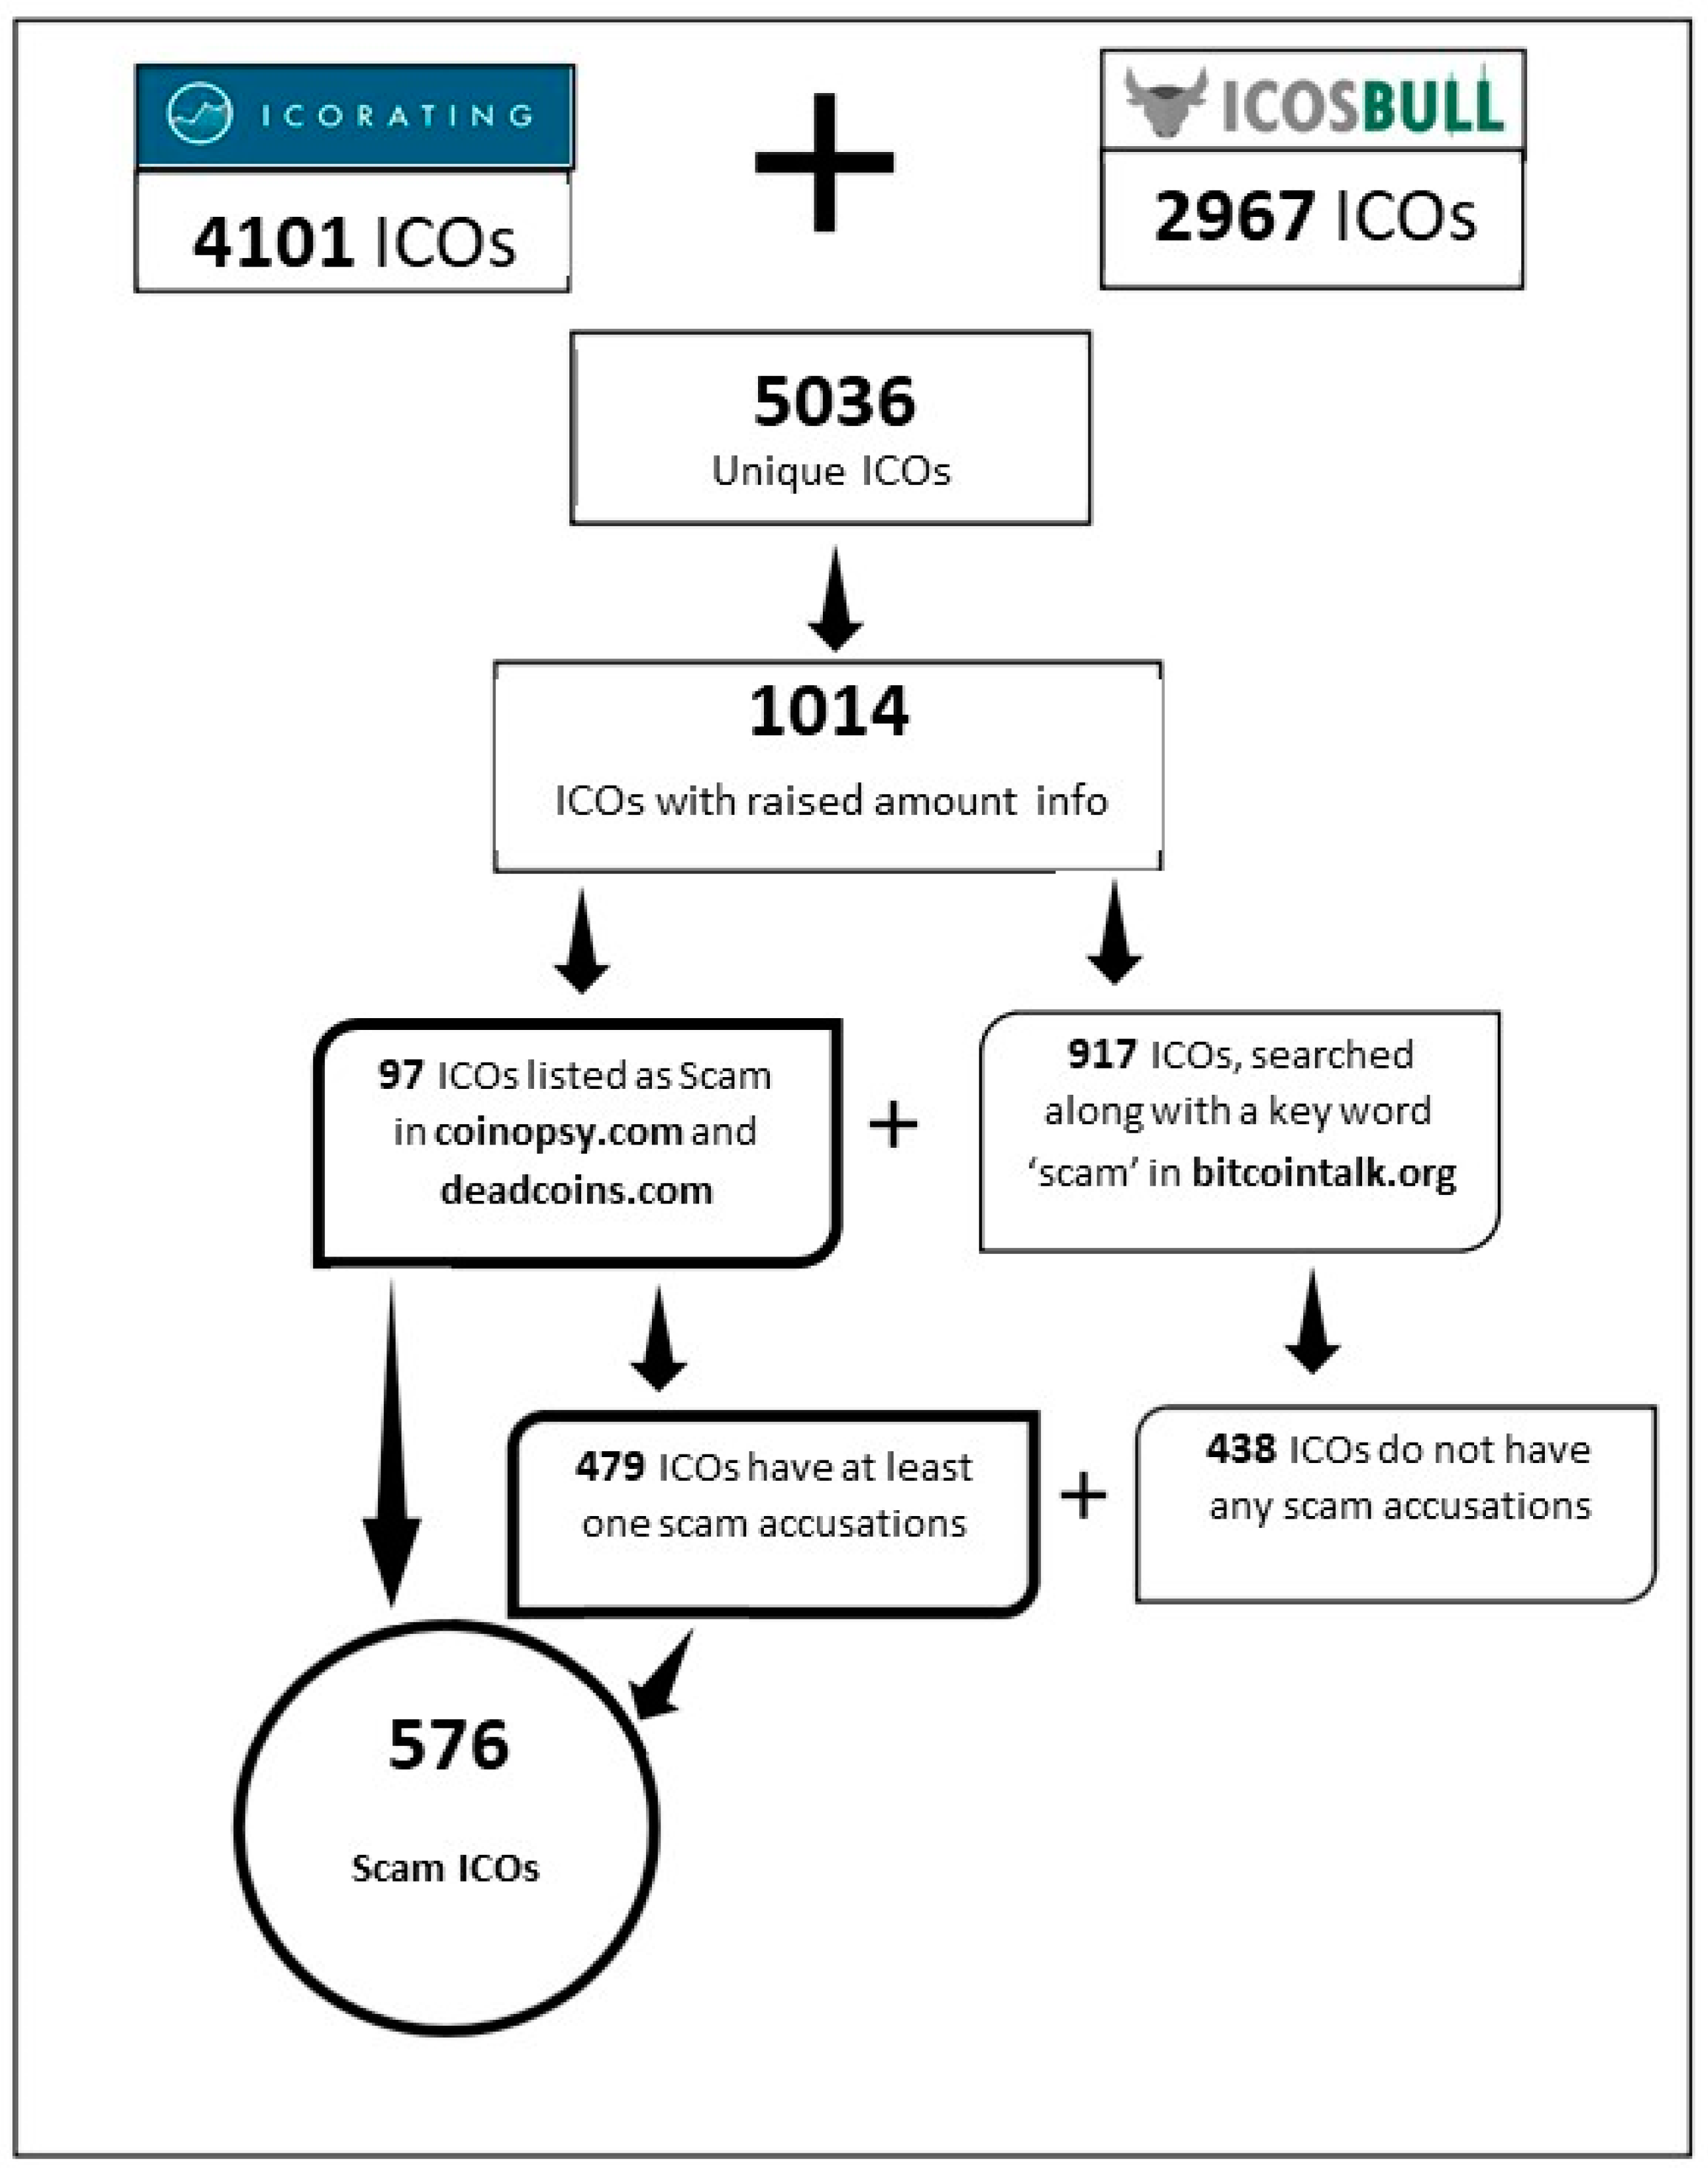
2.1. Retrieving Data for ICO Scams

Using the R program, rvest and xml2 web scrapping packages were applied to download data from the website icorating.com. This website provides data on the risk score and the hype score for more than 5000 ICOs with additional information on the amount of raised funding in terms of USD (for some of them). Similarly, the website icosbull.com provides data on basic, financial, and social signals for around 3000 ICOs. The financial information for these ICOs was also extracted using the same web scrapping packages. Unfortunately, financial information for many ICOs—especially on the raised amount, important for this study—were missing on these two websites (as well as on major ICO database providers such as icobench, neironix, icoholders, etc.) Nevertheless, after combining data from icorating.com and icosbull.com for only the unique ICOs issued during the sample period, it was possible to collect a rich dataset containing information on the amount of raised funding for 1014 ICOs (from a population of 5036 ICOs) launched between August 2014 and December 2019. Figure 1 illustrates the process of data retrieval.

2.2. Identifying Scams in the ICO Market

To identify scams in the ICO market, the total population of 5036 identified ICOs were examined. A particular challenge in the data gathering process relates to searching for websites and/or databases that list ICOs which turned out to be scam. Fortunately, there are websites such as deadcoins.com or coinopsy.com enlisting coins and tokens that are not traded anymore, often referred to as ‘dead coins’ or ‘dead tokens’, which aided classification. On investigation, the website deadcoins.com exhibited a list of 2000 dead coins and tokens, and, similarly, the internet provider coinopsy.com reported a list of 1700 dead coins and tokens (of which most happened to be listed on deadcoins.com also), documenting issues behind the default. While, unfortunately, these websites do not provide information on the financials, they do provide additional information which facilitated the identification of the ‘type of the scam’.
From the available sample of 1014 ICOs with information on raised funding, it was possible to use information from the (aforementioned) websites listing dead coins to categorize 97 ICOs as a ‘scam listed by the third party’. All third-party data presented herein were obtained from publicly available sources believed to be reliable. For the rest of the 917 ICOs with financial information on raised amount not listed by any third party, each ICO was searched in the Bitcoin Talk forum (website: bitcointalk.org accessed between January and December 2020) to classify them as either ‘scam’ or ‘legit’. Interestingly, nearly all ICOs have been announced on bitcointalk.org and other forums, including Bitcoin.com, Altcoin Talks, Bitcoin Garden. This is the essential part of a PR campaign. However, Bitcoin Talk is the one deserving most attention given it is the biggest and most popular of such platforms, especially when it comes to the announcements of new coins/tokens.
Using the search term ‘{name}{space}{scam}’ on the Bitcoin Talk forum, all remaining ICOs were manually searched (i.e., those not listed by any third parties as a scam). In total, 917 manual searches were made, every time with a different ICO name and attaching the keyword ‘scam’ to it. The search results showed multiple threads, where the search terms ‘name of the ICO’ and ‘scam’ appear together. Following a careful study of those threads, an ICO was marked as ‘scam’ if any of the forum members had at least one scam accusations of that particular ICO; otherwise, the corresponding ICO was coded as legitimate (e.g., ‘legit’). In total, it was possible to identify scam accusations for 576 ICOs (including those 97 ICOs listed by the third-party websites). The remaining ICOs were marked as ‘legit’ to reflect the fact they are non-scam ICOs.
It is important to highlight that Liebau and Schueffel (2019) apply a similar approach to identify scam ICOs, in which each individual ICO is checked along with the keyword ‘scam’. However, they carried out their search using the Lexis Nexis news database for a sample covering only 45 ICOs. Conversely, this study focused on the Bitcoin Forum for scam identification because it is, as per now, the world’s largest FinTech forum. The section ‘trading discussion’ on the website bitcointalk.org contains more than 800,000 posts discussing scam accusations, reputation, and other trading topics about coins or tokens. In the ‘trading discussion’ section, 211,000 threads are created only for scam accusations, whereas 84,000 threads are for reputation (i.e., for promotion). A preliminary data analysis suggests that USD 10.12 billion of raised funding in the market for ICOs was lost due to scams, which is 65.80% of the total amount raised. Note again that the estimate is based on a total of 1014 ICOs which exhibited available data on the amount of raised funding.
A report by the SATISGROUP (2018) published on the Bloomberg research terminal helped identify many scam ICOs. This report found that, for data up until July 2018, approximately 78% of all launched ICOs were subject to fraud, corresponding to 11% of total market capitalization. The present study followed a similar approach as the SATISGROUP. That is, it was assessed whether an ICO project either ‘had an intention’ or ‘had no intention’ of fulfilling the project development duties with the funds, and/or was deemed by the community as a scam. The difference between this approach and their approach is that the present study directly (manually) looked into the forum/community discussion on scam accusations. Since ICOs in the data sample were able to raise significant amounts of funding, we believe that they hypothetically fulfill key criteria to signal themselves as legitimate ICOs—even though most of them ultimately were not. However, using rather simple statistical approaches—based on characteristics—may not accurately differentiate between fake and real ICOs. In this regard, Chainalysis, a blogging website decoding Ethereum scams, identified over 2000 scam addresses on Ethereum that have received funds from nearly 40,000 unique users during the 2016–2018 period. Note that having ERC-20 as standard guidelines, many ICOs are using the Ethereum blockchain for token offerings. However, in this research, besides the Ethereum channel, many tokens use their own channels and possibly other channels such as Waves. Since the present study employs a more work-intensive approach to identify scams, scams were not categorized based on the channels used by the tokens.

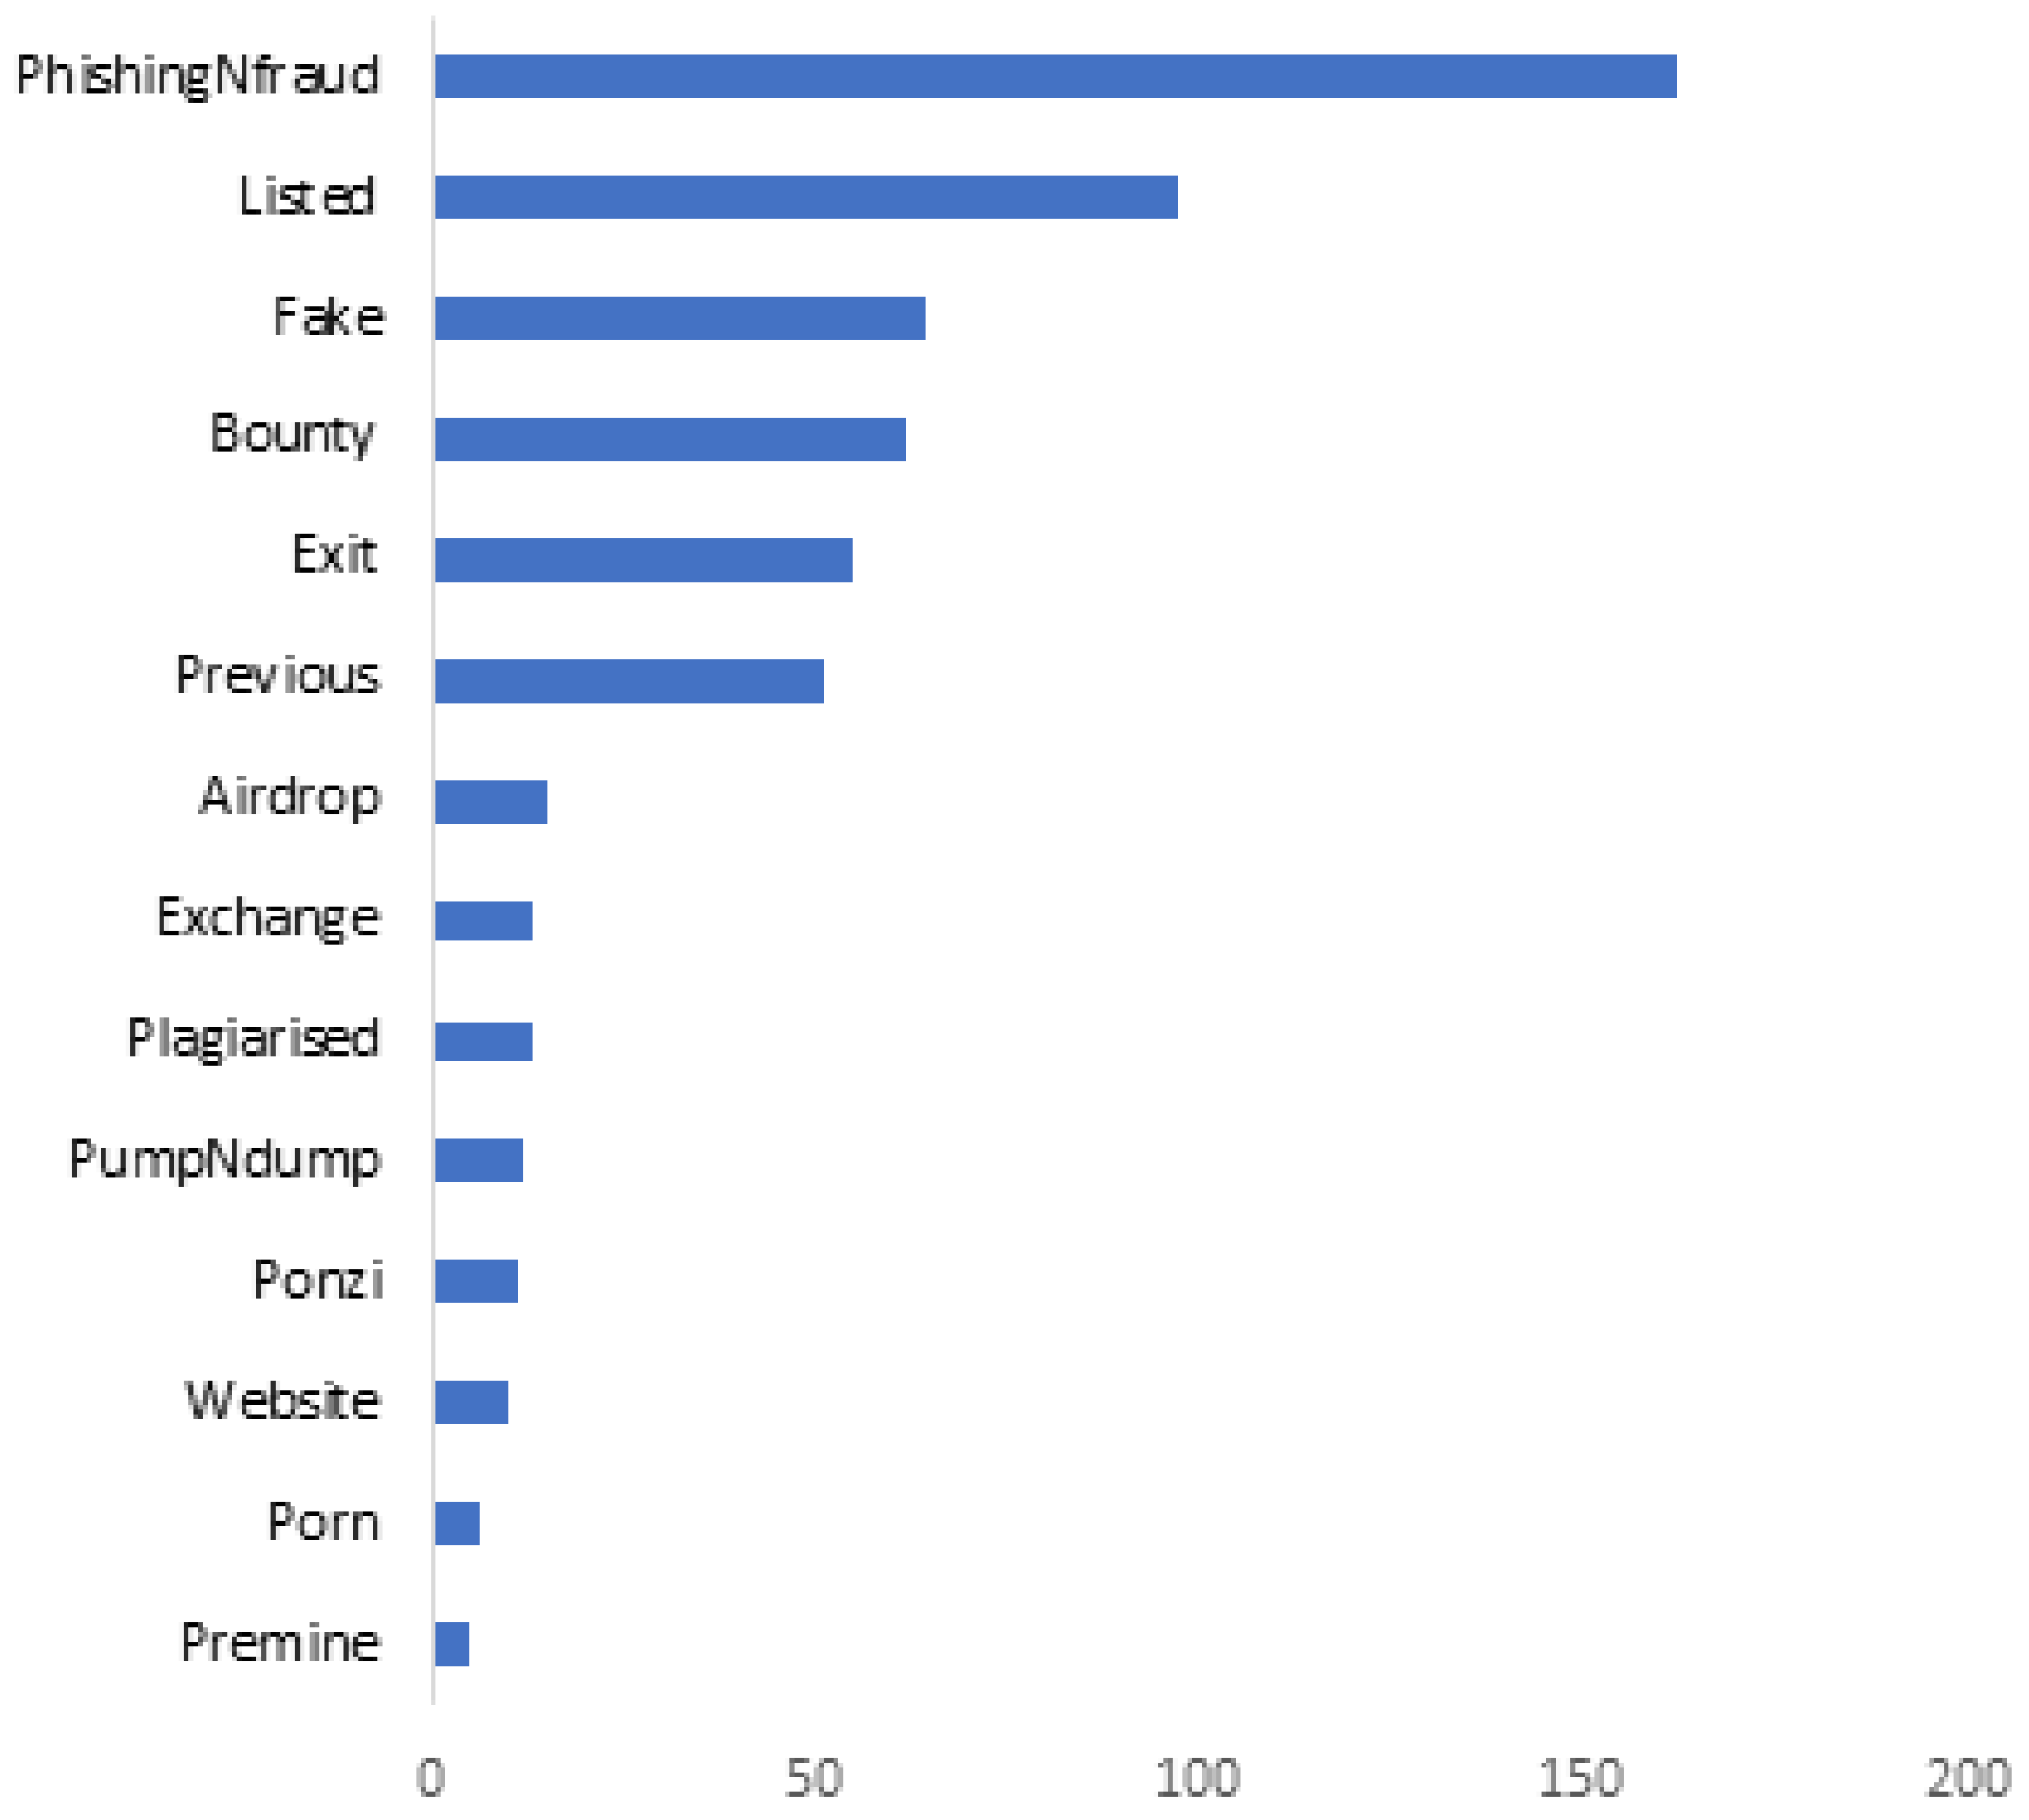
2.3. Clustering Scams in the ICO Market

Analyzing the hand-collected data, several different ways in which investors are fooled by scammers were identified. These scam incidents were then classified into thirteen different types of scams based on their nature. Fist, categorized ICOs were retrieved and matched from the websites deadcoins.com and coinopsy.com as ‘Listed’. Second, users receiving spam emails, suspicious links and pop-ups, questions for personal and financial details, error on withdrawals, pending withdrawals, balance disappearing form the wallet, etc., are some common accusations which were categorized as ‘PhishingNfraud’. A third category of ICO scams was classified as ‘Fake’. Specifically, an ICO was tagged as fake if a Bitcoin Talk forum member identified the ICO with fake team/project/wallet/social media/trading, etc. Another scamming tool is a so-called ‘bounty program’, which entails financial rewards mostly in tokens for users’ PR activities, such as promoting ICO on forums, telegrams, messengers, translating and localizing documents, and posting on social media and blogs, etc. However, many ICOs fail to pay or do not pay bounty to those promotors. Hence, these ICOs were classified under ‘Bounty Scam’ if a bounty hunter has accused the ICO as a scam for not paying his/her bounty. The results are summarized in Figure 2.
The fifth common type of scam among ICOs in the sample is the so-called ‘Exit Scam’, according to which developers and promotors (the ones who collected the funds in an ICO) suddenly disappear, leaving the investors with no information. There were also numerous incidences of ICO scam accusations where the same group of scammers were also actively scamming in other projects. These were categorized as ‘Previous Scammers’. Unfortunately, due to the lack of regulations, the same individual/team/promotor can potentially fool the naïve investors repeatedly.
The sixth classified scam in the sample is the ‘Airdrop Scam’, which is a type of fraud where scammers steal a wallet’s private keys from users. More specifically, scammers create a booby trap and users willing click on the links and give away their private information to acquire free tokens, ultimately losing their coins to scammers. It is important to note that, given there are more than 32,000 crypto exchanges/markets around the world, it is difficult for users to identify scam exchanges. Developers that would like to take advantage of this situation preferably launch the ICO at a fraudulent exchange. This type of scam was categorized as an ‘Exchange scam’. Furthermore, it can be observed that copying the whitepaper of a promising ICO and launching it using a similar or different name has also been a new trend among scammers. This type of scam was classified as a ‘Whitepaper Plagiarism Scam’. Fortunately, users are becoming more familiar with this type of scam and typically report it in the Bitcoin Talk forum.
‘Pump and Dump’ is another technique associated with scams that can be observed in the sample. Unfortunately, one cannot directly observe this type of scam at the very beginning of a project but only when it is already too late. Usually, investors and traders rush to buy the tokens at an early phase when the price is low. Similarly, some investors buy them in fear of missing out at a high price. Once the scammers complete the sell, the price suddenly crashes. Moreover, a ‘Ponzi scam’ is another category of scam that was observed in the data. While it is similar to a classic pyramid scam, the essential difference is that a Ponzi scam requires that victims also invest in some product(s) or service(s) associated with the ICO, with promised returns at a later stage. As a new method of scamming investors, it was observed that scammers launch websites that resemble similar names and domain names of existing ICOs or projects. New (or naïve) investors that are unaware of the original websites fall into this trap and lose their coins. Hence, this type of scam was classified as a ‘Website scam’.
Disconcertingly, the so-called ‘Porn scam’ was found to have become increasingly popular among scammers. Some ICOs offer premium access to their porn sites and/or their products. This is perhaps the easiest way of scamming people because a user of such a website might be hesitant to report a scam because in many countries/societies watching porn is strictly prohibited. Hence, this type of scam is a ‘Porn scam’. Finally, the last type of scam identified in the data was categorized as a ‘Pre-mine scam’. Pre-mining occurs when a fraction of the tokens for a project are made available to a group of developers and promotors prior to their offering to the public. This is an important aspect to distribute rewards to developers. However, if the fraction of the tokens reserved for a pre-mine is high, there is probably some reason to be concerned. An ICO was categorized as a ‘Pre-mine scam’ if some tokens are shared among the developers and the promotors after the final token sale instead of burning the unsold tokens. This is defrauding investors because a higher token circulation supply generally implies a lower token price. Moreover, there is a chance to manipulate the market if developers have the large fraction of the tokens from the pre-mining activity. This also applies to the context of cryptocurrencies (Grobys and Sapkota 2020).

3. Statistical Analysis

3.1. Descriptive Statistics

As previously discussed, from an initial sample of 5036 ICOs identified, a final sample of 1014 ICOs with available data on the amount of raised funding was found. Of these, 576 ICOs (56.80%) exhibited scam accusations. Table 1 reports the descriptive statistics for the full sample. From this table, one can observe that the average loss for scam ICOs is estimated to be USD 17.6 million. Importantly, the value of the kurtosis exceeds 120, which suggests that the distribution is not normally distributed.

3.2. What Statistical Information Resides in the Tails? Evidence from Extreme Value Theory (EVT)

Cirillo and Taleb (2020) emphasize that fat tails represent a common—yet often ignored—regularity in many fields of science and knowledge and argue that the main problem of naïve risk management is that it consistently uses wrong thin-tailed distributions and, therefore, (severely) underestimates tail risks. Hence, using the naïve sample average, as reported in Table 1, may result in incorrect risk assessments. To illustrate, if one considers the sample of scam ICOs, the top 20% share of cumulative losses corresponds to 72% of the cumulative total, whereas one can show that, for normally distributed data, the corresponding figure is about 45%. Note that the top 20% of scam ICOs are reported in Appendix A Table A1.
That means scam ICOs exhibit extremely fat tails, which are similar to the well-known Pareto 80/20 distribution, where the top 20% share of cumulative realizations corresponds to 80% of the cumulative total. In this way, scam ICOs can be thought of as consistent with what Cirillo and Taleb (2020, p. 1) refer to as the “tail wags the dog effect”, according to which, “more statistical information resides in the extremes and the less in the ‘bulk’ (that is the events of high frequency), where it becomes almost noise.” As the authors’ point out, this means that “the law of large numbers works slowly under fat tails, the bulk becomes increasingly dominated by noise, and averages and higher moments– even when they exist–become uninformative and unreliable, while extremes are rich in information” (p. 2).
Given the aforementioned finding and the observations of Cirillo and Taleb (2020), the ten largest observations of each sample’s tail were retrieved and a generalized Pareto distribution (GPD) fitted, given by:
GPD ( ξ , β ) = 1 ( 1 + ξ z β ) 1 ξ           if   ξ 0 ,
GPD ( ξ , β ) = 1 e z β                                     if   ξ = 0 ,
where ξ and β define the shape and scale parameters, respectively, and z { x | x > u } , in which u defines the tail threshold. EVT uses this limiting distribution to model tails of distributions, i.e., for data exceeding a certain threshold (or peaks over threshold, abbreviated as POT). Even if the main advantage of asymptotic laws used to derive the asymptotic extreme value distributions in Equations (1a,b) is that they do not require knowledge of the parent distribution, it is possible to consider ξ to draw inferences concerning the parent distribution.
According to Bermudez and Kotz (2010), the flexibility of the GPD to assume many different forms enables its application to a variety of practical situations. Referring to Equations (1a) and (1b), one can infer that: (1) ξ > 0 if the GPD reduces to a fat-tailed distribution (e.g., Pareto distribution), (2) ξ = 0 if we have an exponential distribution, and (3) ξ < 0 if we have a thin-tailed distribution.
Here we begin the empirical analysis by employing the POT approach, which is common practice in risk management, and allocate 10% of the parent distributions into the POT cluster and estimate the corresponding shape and scale parameters using the Method of Moments (MOM), that is, ξ ^ = 0.5 ( z ¯ 2 s 2 1 ) , and β ^ = 0.5 z ¯ ( z ¯ 2 s 2 + 1 ) , where z ¯ and s 2 are the sample mean and standard deviation, provided z { x | x > u } . The results are reported in Table 2.
Apart from 10% of the parent distributions, up to ±5 sample observations above and below the 10% threshold were allocated to check the robustness. The observed values are ξ ^ = 0.26 and β ^ = 72,726,189.66 . The corresponding Shadow mean is given by:
E [ z ] = β 1 ξ u ξ ξ 1 ,
ξ > 1 , u > 0 , β u ξ > 0 , and is estimated as USD 114.97 million for scam ICOs and USD 126.42 million for successful ICOs. As a robustness check, up to ±5 sample observations above and below the 10% threshold of the parent distribution were collected and ξ ^ , β ^ , and E [ z ] were re-estimated. Notably, all estimates for ξ ^ are positive. Hence, the result can be considered robust.
Next, to estimate the corresponding t-statistics, bootstrapping is employed using constructed synthetic samples, randomly drawing with a replacement from each corresponding cluster z { x | x > u } . Each synthetic sample has 58 realizations for the scam ICOs’ extreme value sample, which corresponds to 10% of the observations in the tails of the original data set. The bootstrapping procedure gives an estimated t-statistic for ξ ^ of 17.77, which indicates statistical significance at any conventional level. Since the estimate is significantly positive, one can infer that the parent distribution must be in line with a Pareto-type distribution.

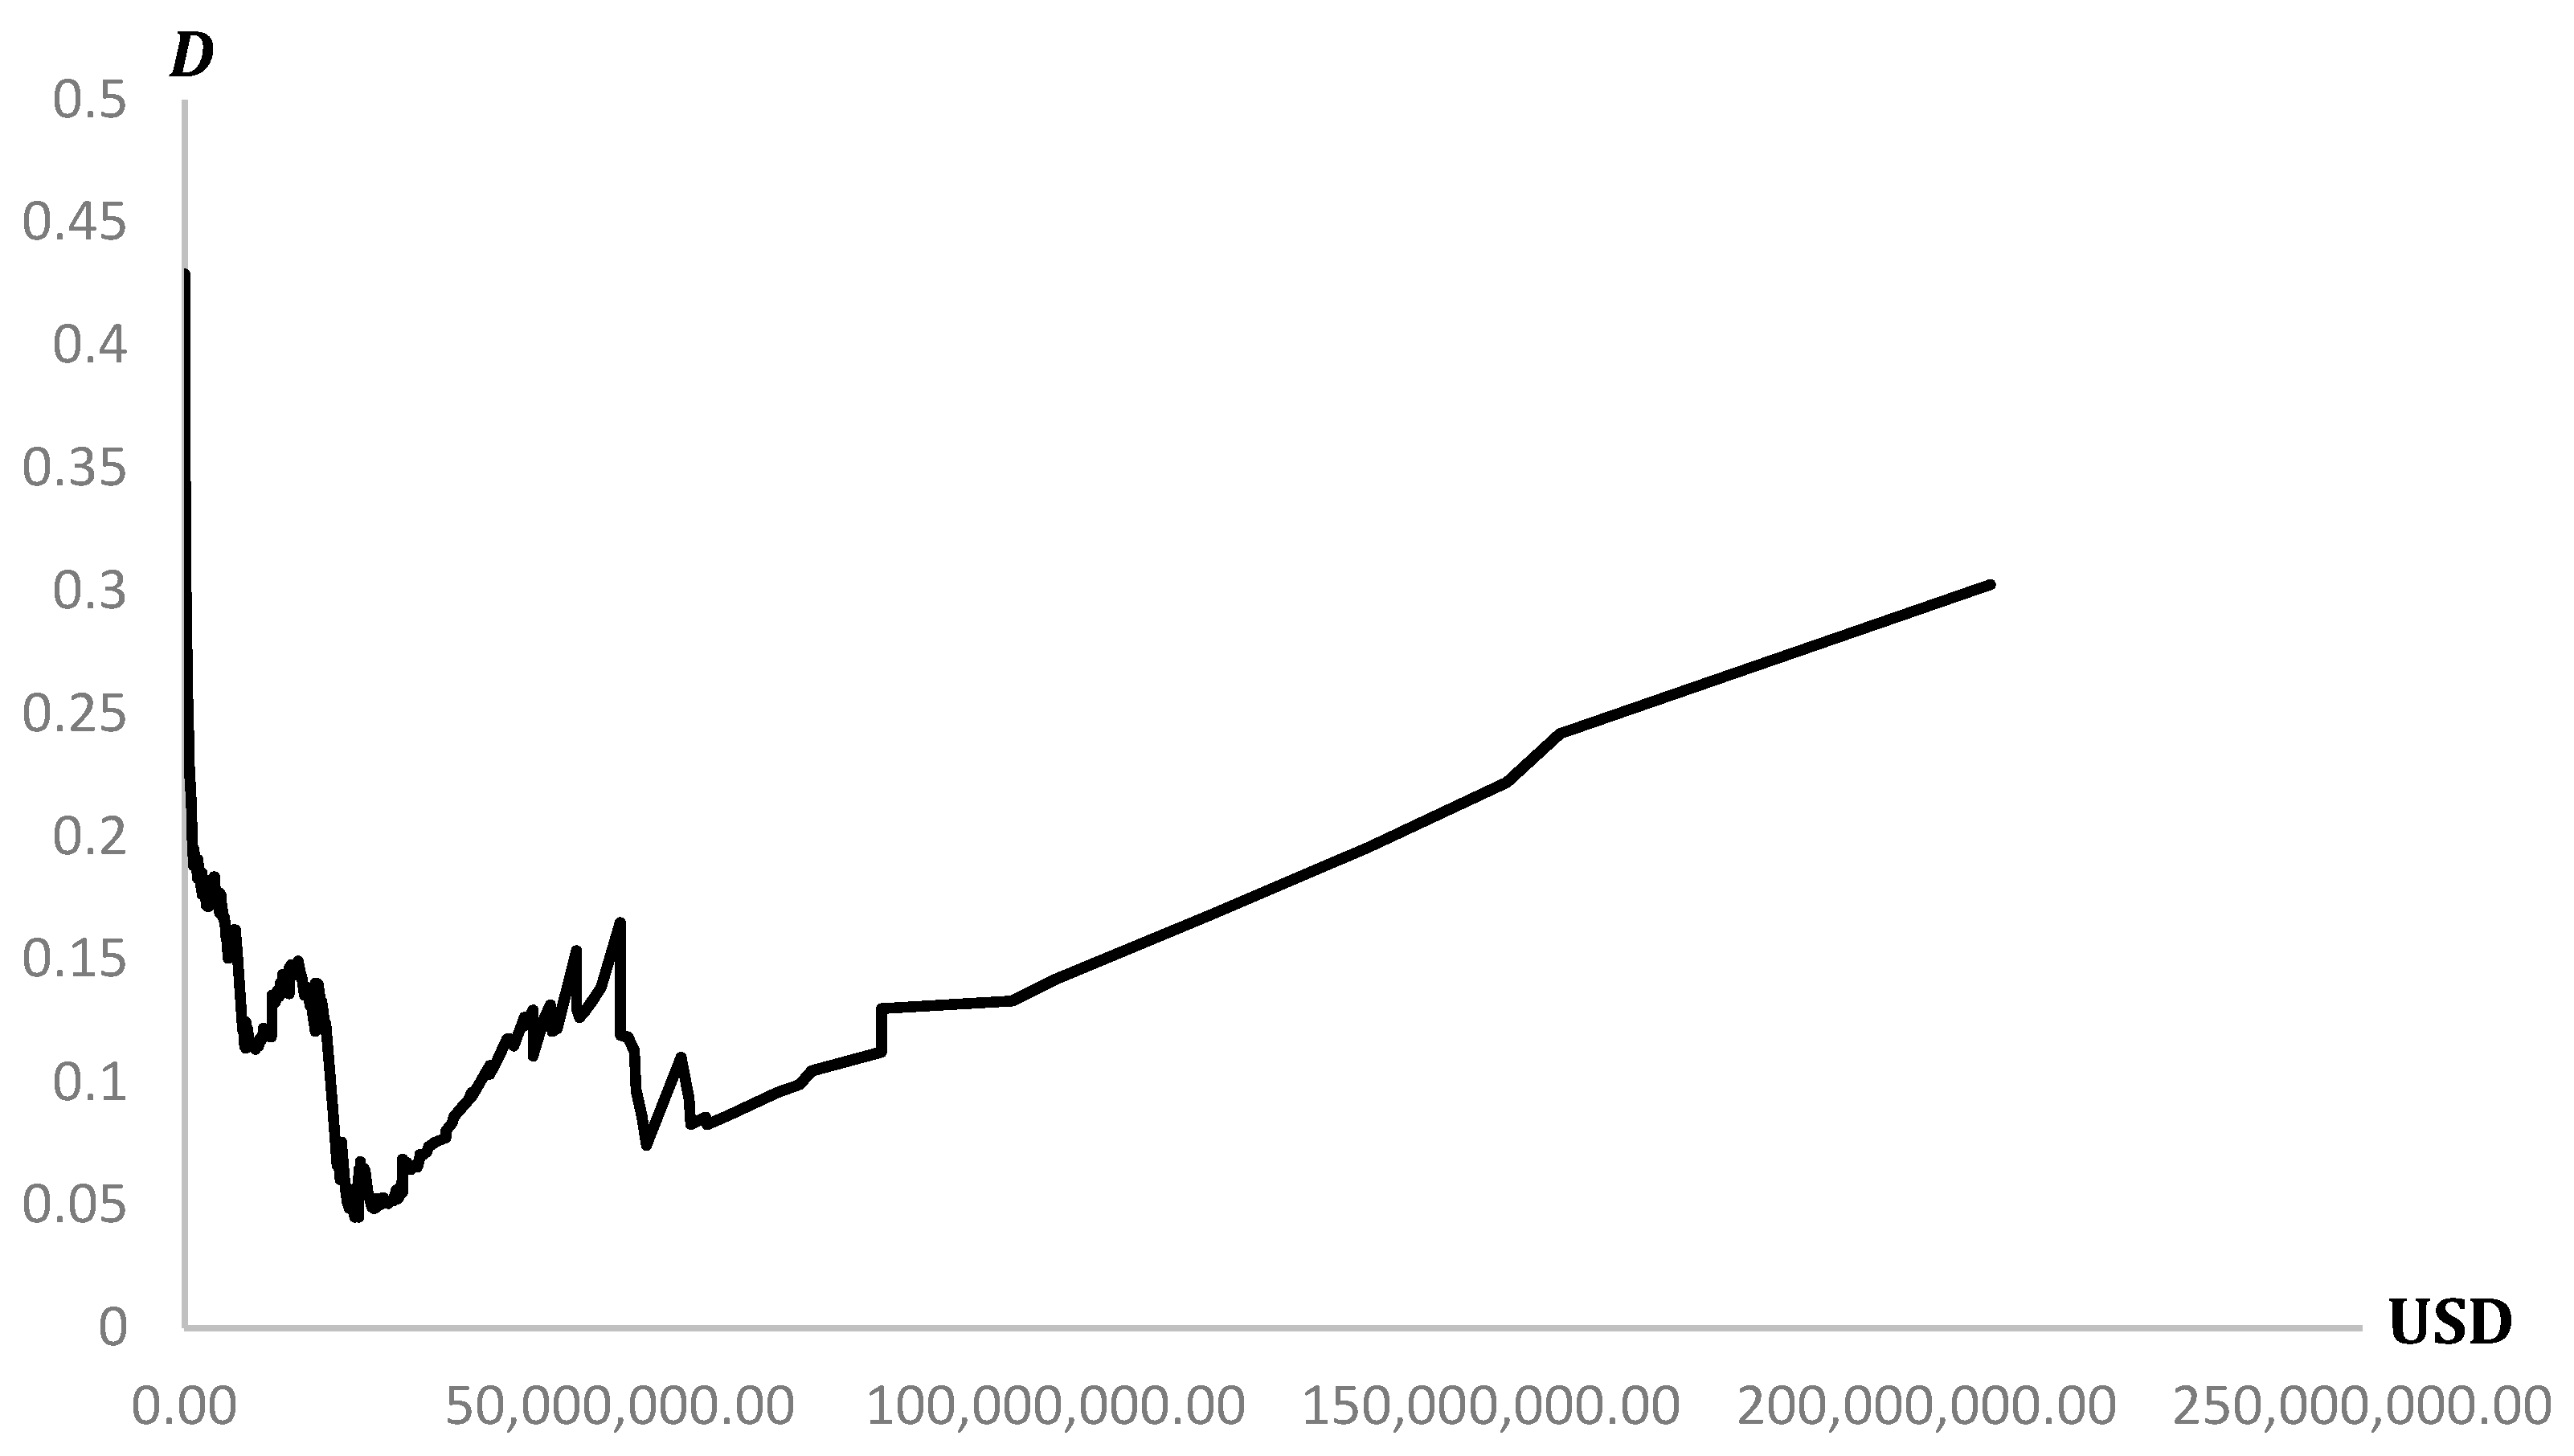
3.3. What Information Resides in the Parent Distribution? Evidence from Power Laws

Given the evidence discussed in the previous sections, in this section, the distribution of losses from scam ICOs are modeled as Pareto-type distributions using power laws, and we test the following power law null hypothesis:
p ( x ) = C x α
where C = ( α 1 ) x M I N α 1 with α { + | α > 1 } , x { + | x M I N x < } , x M I N is the minimum amount of losses due to scam ICOs, and α is the magnitude of a distribution-specific tail exponent. Note that, following the notation in Clauset et al. (2009), it can be shown that the expectation, or E [ X ] , is given by
E [ X | X x M I N ] = x M I N x p ( x ) d x = ( α 1 ) ( α 2 ) x M I N ,
whereas the second moment, or E [ X 2 ] , is defined as
[ X 2 | X x M I N ] = x M I N x 2 p ( x ) d x = ( α 1 ) ( α 3 ) x M I N 2 ,
and higher moments of order k are analogously defined as
E [ X k | X x M I N ] = ( α 1 ) ( α 1 k ) x M I N k
From Equation (2), we observe that the mean only exists for α > 2 , whereas the variance only exists for α > 3 . Following White et al. (2008) and Clauset et al. (2009), we employ MLE and estimate the tail exponent as
α ^ = 1 + N ( i = 1 N ln ( x i x M I N ) ) 1 ,
where α ^ denotes the MLE estimator, and N denotes the number of sample observations exceeding x M I N , that is, x i x M I N . As seen from Equations (3)–(5), the minimum value x M I N is essential for the calculation of the power law exponent. A question concerns which MLE estimator α ^ in association with x M I N is most accurate in describing the data-generating processes. Following Clauset et al. (2009), the lower threshold x M I N is estimated by making use of the Kolmogorov–Smirnov (KS) approach. This statistic is simply the maximum distance D between the data and fitted cumulative density functions (CDFs) and is given by
D = M A X x x M I N | S ( x ) P ( x ) | ,
where S ( x ) is the CDF of the data for the observation with a value of at least x M I N , and P ( x ) is the CDF for the power law model that best fits the data in the region of x x M I N . The estimate of x M I N is the value of x ^ M I N that minimizes D.
Figure 3 and Figure 4 report the α ^ / x ^ M I N graph and the D / x ^ M I N graph for the sample of scam ICOs. Clauset et al. (2009) document that it is common practice to choose the value for x M I N , where beyond which α ^ is stable. However, estimating the exact value for x M I N is not a trivial issue. As the authors’ highlight, if one chooses too low a value for x M I N , this results in a biased estimate of α ^ , given we would be attempting to fit a power law model to non-power law data. Conversely, if a value for x M I N is chosen which is too high, this would effectively remove legitimate data points x i < x ^ M I N , resulting in an increase in both the statistical error on α ^ and the bias from finite sample size effects. To address such issues, the authors propose an approach, which we adopt, that chooses the value for the estimate x ^ M I N that makes the probability distributions of the measured data and the best-fit power law model as similar as possible above x ^ M I N . The goodness-of-fit test they propose compares D from Equation (7) with distance measurements for comparable synthetic data sets drawn from the hypothesized model. The p-value is defined to be the fraction of the synthetic distances that are larger than the empirical distance. Given a significance level of 5%, the power law null hypothesis is not rejected for p-values exceeding 5%, as the difference between the empirical data and the model can be attributed to statistical fluctuations alone.
From the D / x ^ M I N graphs in Figure 3 and Figure 4, it can be observed that the minimum value for D is reached for USD 19.50 million. The corresponding estimated alpha associated with x ^ M I N is, according to the α ^ / x ^ M I N graph, 2.5052. For testing the power law null hypothesis, the program plpva written by Aaron Clauset is employed. The test results are reported in Table 3. As shown, since the corresponding p-values exceed 5% by a substantial margin, one cannot reject the power law null hypotheses.

3.4. What Are the Implications?

Taleb (2020) notes the tail exponent of a power law function captures (by extrapolation) the low-probability deviation not seen in the data and plays an important role in determining the mean. Moreover, Cirillo and Taleb (2020) show that the use of naïve statistics, such as the sample mean, may dramatically underestimate risk. Importantly, the lower the economic magnitude of the exponent, the higher is the impact of those low-probability deviations not seen in the empirical data. Since α ^ = 2.5052 , we see from Equation (3) that the expected value for the theoretical first moment exists. Due to the stochastic properties of those fat-tailed data, we do not observe it in finite samples. To illustrate this issue, we simulate 100,000 samples using power laws defined as p ( x ) = ( α 1 ) x M I N α 1 x α , with a parameter vector ( α ^ , x ^ M I N ) = ( 2.5051 ,   19,500,000.00 ) , using
x p ( x ) = [ ( 1 α ) [ ( 1 p ( x ) ) ( α 1 ) x M I N α 1 + 1 ( 1 α ) x M I N ( 1 α ) ] ] 1 ( 1 α )
where x p ( x ) denotes the corresponding value of the power law function that is associated with the probability p ( x ) (see Grobys 2021). Each sample has 500 realizations x p ( x ) . For each sample, the empirical sample mean is computed, before the 100,000 sample means are sorted for each synthetic power law model in an increasing order and the distributional characteristics are computed.
Table 4 provides an overview of the corresponding distribution and sample-specific characteristics. It can be clearly observed from Table 4 that the estimated sample mean is sample-specific. Note that the problem of sample specificity has been elaborated on in Grobys (2021). While the actual tail of the loss distribution is USD 56.44 million, we see that, with a 1% probability, the sample average loss exceeds USD 108.26 million. Moreover, in 0.01% of the sample averages, the sample average losses due to scam ICOs exceed USD 1.73 billion, which is more than 30 times higher than the estimated average of the actual sample’s tail.

4. Conclusions and Implications

4.1. Conclusions

ICOs have become an important alternative financing channel for startups to raise funds without the involvement of financial intermediaries, and a new market for investors with potentially attractive, though risky, returns. Unfortunately, due to the lack of regulation, the market for ICOs has become notorious for scammers. In this paper, we apply power laws to address the question as to what the expected losses attributable to scams in the market for ICOs are. It is noteworthy that the present study follows Taleb (2020, p. 91), who asserts that “power laws should be the norm”, and is further motived by the seminal paper of Mandelbrot (1963, p. 438), which argued “that there is strong pragmatic reason to begin the study of economic distributions and time series by those that satisfy the law of Pareto.”.
After screening more than 5000 ICOs, a final sample of 1014 ICOs that had available data on the raised amounts of funding was generated. Although 97 ICOs were listed as scams on the webpages coinopsy.com and deadcoins.com, it was found that 479 ICOs have at least one reported scam accusation on bitcointalk.org. Such scams are harmful to investors. The evidence presented in this paper infers that 56.80% of all launched ICOs were subject to fraud, corresponding to 65.80% of the overall market capitalization. Specifically, from the total of USD 15.38 billion raised by the 1014 ICOs, USD 10.12 billion were lost due to scams. Naïve statistics suggest that the average loss associated with a scam ICO is USD 17.57 million. However, the findings of this paper infer that these figures may be misleading because the underlying distribution governing losses due to scam ICOs follows a Pareto-type distribution, having extremely fat tails. For this reason, the tail of the distributions was modeled using power laws, whereby it was found that one cannot reject the power law null hypothesis.

4.2. Implications

The findings in this paper have notable implications for future research and policy makers looking to better understand and regulate ICO markets. Importantly, they highlight that the economic magnitude of the power law exponent associated with losses due to scam ICOs indicates that the theoretical second moment is not defined. A simulation experiment showed that losses due to scam ICOs are highly exposed to low-probability and high-impact events. Specifically, in 10 out of 100,000 sample averages—or with a probability of 0.01%—the sample average associated with losses exceeded USD 1.73 billion. This is an interesting finding because the sample average loss in the actual tail of the loss distribution is only USD 56.44 million. Taken together, the results in this paper help advance understanding of the ICO market and indicate that we have not yet observed the largest loss due to scams in the market for ICOs.
Taken together, this study’s findings contribute to a need to reevaluate regulation and corporate governance mechanisms in the context of the whole of digital finance to help mitigate fraudulent behaviors (e.g., Cumming et al. 2019). For example, King and Koutmos (2021) highlight warnings from the Securities and Exchange Commission regarding growing market manipulation and fraud in cryptocurrency markets, while Hornuf et al. (2022), in the context of ICOs, argue for the need to install third-party governance assessing the quality of the issuers, such as specialized platforms, or the engagement of institutional investors and venture capital funds that can perform effective due diligence by verifying the quality of projects. This paper reinforces this view by showing that the expected losses attributable to ICO fraud are of economic significance because the sums of financial means involved are substantial.
There are several corporate governance mechanisms that could be used to reassure prospective investors about the potential for scams and help prevent fraudulent behaviors in ICO markets: (i). Implementation of effective KYC/AML procedures—ICO issuers should implement proper KYC (Know Your Customers)/AML (Anti Money Laundry) procedures to verify the identity of their investors and to prevent money laundering. (ii). Conduct due diligence on ICO projects—potential investors should conduct due diligence on ICO projects before investing, to identify red flags and to avoid scams. (iii). Regulation of ICO markets—governments and financial regulators should create regulations for ICO markets to protect investors and to reduce the chances of fraud. (iv). Development of industry standards—industry associations and standards bodies should develop industry standards for ICOs, to improve transparency and to reduce the chances of fraud. (v). Education of investors—investors should be educated about the risks associated with investing in ICOs, to make informed investment decisions and to avoid being scammed. (vi). Creating a blacklist—list of known scams and fraudsters, and warning investors to avoid these. (vii). Most importantly, third-party audit—requiring all ICOs to undergo a third-party audit. (viii). Working closely with law enforcement agencies to investigate and prosecute any cases of fraud or corruption in the ICO market.
There are also several ways that platforms themselves could help reduce the number of scams and protect investors. For example, platforms could provide more information on how to spot a scam, offer a way to report scams, or even offer a way to verify the identity of other users. However, it is ultimately up to the users to be vigilant and take precautions when using these platforms. One possible role for the platforms would be to provide data that could be used to identify areas where safety and scams are more likely to occur. These data could be used to help develop strategies to mitigate these risks. Most importantly, the platforms can play a role in identifying the scams and stopping them from being able to advertise. However, it is difficult to identify all scams, and it is also difficult to keep up with the ever-changing ways that scammers operate. There is no sure way to prevent all scams, but the platforms can help by making it more difficult for scammers to advertise. Yet, the implications of identifying risk in the ICO market are significant. By understanding the risks associated with investing in ICOs, investors can make more informed decisions about which ICOs to invest in and how much to invest. Additionally, by identifying risks early on, investors can avoid potential losses and protect their investment portfolios, otherwise ICO scams can damage the reputation of the cryptocurrency industry as a whole.

Author Contributions

Conceptualization, K.G., T.K. and N.S..; methodology, K.G.; software, K.G. and N.S.; validation, K.G., T.K. and N.S.; formal analysis, K.G. and N.S.; investigation, K.G., T.K. and N.S.; resources, K.G., T.K. and N.S.; data curation, N.S.; writing—original draft preparation, K.G., T.K. and N.S.; writing—review and editing, K.G., T.K. and N.S.; visualization, N.S.; supervision, K.G., T.K. and N.S.; project administration, K.G., T.K. and N.S.; funding acquisition, K.G. and N.S. All authors have read and agreed to the published version of the manuscript.

Funding

Klaus Grobys and Niranjan Sapkota gratefully acknowledge the Project Research Grant (Grant no. 190405) by the Foundation for Economic Education (LIIKESIVISTYSRAHASTO), Finland.

Institutional Review Board Statement

Not applicable.

Informed Consent Statement

Not applicable.

Data Availability Statement

Not applicable.

Conflicts of Interest

The authors declare no conflict of interest.

Appendix A

Table A1. Top 20% of losses due to scam ICOs. Notes: This table reports the largest 20% of losses due to scam ICOs.
No.S.No/NameICO.Rating.Hype.ScoreICO.Rating.Risk.ScoreRaised.USD
1PetroLowVery High735,000,000
2PincoinLowNotRated660,000,000
3TaTaTuMediumNotRated575,000,000
4filecoinHighLow257,000,000
5TezosMediumNotRated232,000,000
6PolymathVery HighNotRated207,326,000
7SIRINLABSVery HighLow157,886,000
8BankeraVery HighLow151,800,000
9NelunsMediumNotRated136,000,000
10OrbsMediumNotRated118,000,000
11EnvionHighHigh100,000,000
12ComsaMediumMedium95,000,000
13OKOINLowHigh80,000,000
14TenxHighLow80,000,000
15FlashmoniLowMedium72,000,000
16bankexHighLow70,600,000
17HyconMediumNotRated68,000,000
18ZeepinHighNotRated62,600,000
19ACChainVery HighVery High60,000,000
20WPPHighHigh59,780,000
21TronLowMedium58,098,000
22ElastosHighNotRated57,891,000
23AlchemyMediumHigh57,000,000
24MobileGoMediumNotRated53,000,000
25NexoMediumNotRated52,500,000
26NeuromationHighMedium51,835,000
27CrypteriumHighMedium51,657,000
28SwissborgHighMedium50,890,000
29OdysseyMediumHigh50,000,000
30savedroidMediumHigh50,000,000
31BlockStackMediumLow50,000,000
32CelsiusVery HighMedium50,000,000
33HybridBlockHighMedium47,830,000
34GoNetworkHighMedium46,790,000
35iungoHighNotRated45,979,000
36NAGACoinMediumVery High45,319,000
37LoopringHighMedium45,000,000
38ArcBlockHighMedium45,000,000
39FrescoLowHigh45,000,000
40indahashHighLow42,716,000
41FusionMediumMedium42,200,000
42ConsentiumMediumHigh42,000,000
43SONMHighNotRated42,000,000
44FinomMediumMedium41,285,000
45ElectroneumMediumLow40,000,000
46DatawalletHighLow40,000,000
47YggdrashMediumHigh40,000,000
48HurifyMediumLow40,000,000
49WePowerHighMedium40,000,000
50FANTOMHighMedium39,400,000
510chainMediumNotRated39,000,000
52StellarHighNotRated39,000,000
53RipioMediumNotRated37,800,000
54Crypto20HighMedium37,698,000
55KeltaMediumHigh37,378,000
56MoneyTokenHighVery High37,189,000
57MonethaHighVery Low37,000,000
58WanchainHighLow35,658,000
59PundiXHighNotRated35,000,000
60AgrelloHighMedium35,000,000
61BasicAttentionTokenVery HighNotRated35,000,000
62SHIVOMHighMedium35,000,000
63stoxHighMedium33,000,000
64BackToTheFutureMediumMedium33,000,000
65CivicHighNotRated33,000,000
66SingularityNETHighNotRated32,848,000
67JET8MediumMedium32,700,000
68QlinkLowLow32,000,000
69PolybiusMediumNotRated31,000,000
70CyberMilesVery HighMedium30,882,000
71STORMTokenHighMedium30,716,000
72Play2LiveMediumLow30,000,000
73ShipChainHighNotRated30,000,000
74DigitalTicksMediumNotRated30,000,000
75havvenMediumMedium30,000,000
76JioCoinLowHigh30,000,000
77FitrovaLowNotRated29,028,000
78FaceterMediumLow28,610,000
79UniversaHighLow28,559,000
80AirCoinLowNotRated27,988,000
81RefereumHighLow27,800,000
82SentinelProtocolHighMedium27,700,000
83EidooMediumNotRated27,423,000
84AIONHighNotRated27,000,000
85OmiseGOMediumNotRated27,000,000
86UserViceMediumHigh26,893,000
87MonacoMediumLow26,700,000
88PchainMediumNotRated26,674,000
89SENSEMediumMedium26,000,000
90PowerLedgerHighMedium26,000,000
91EssentiaVery HighMedium25,500,000
92AitheonMediumNotRated25,353,000
93BitdepositaryLowNotRated25,000,000
94StoriqaHighLow25,000,000
95APEXMediumNotRated25,000,000
96AtonomiHighLow25,000,000
97MadnetworkLowMedium25,000,000
98TelcoinMediumMedium25,000,000
99TierionMediumLow25,000,000
100AELFHighNotRated24,750,000
101InterValueLowNotRated24,500,000
102AeternityMediumNotRated24,427,000
103ParkGeneMediumLow24,335,000
1040xProjectMediumMedium24,000,000
105DecentralandMediumMedium24,000,000
106EgretiaHighLow23,650,000
107CrowdMachineHighMedium23,606,000
108SophiaTXHighMedium23,470,000
109NeuroChainMediumLow23,400,000
110mandalaHighNotRated22,752,000
111ForestingLowNotRated22,734,000
112KYC.LEGALLowNotRated22,500,000
113OriginTrailVery HighMedium22,500,000
114THEKEYMediumNotRated22,000,000
115MidexMediumMedium22,000,000

Appendix B

Table A2. Types of ICO scams. Notes: This table depicts 13 different types of ICO scams. %Count is the percentage of a particular ICO scam in numbers, whereas %Amount is the percentage of a particular ICO scam.
S.No.ScamType/Year2016201720182019No.ICOs%CountRaisedUSD(B)%Amount
1Premine023050.87000.0480.47
2Porn014161.04000.0310.31
3Website0541101.74000.1791.77
4Ponzi1442111.91003.8741.13
5PumpNdump0570122.08000.1981.96
6Plagiarised0490132.26000.2222.20
7Exchange01111132.26000.0560.56
8Airdrop1860152.60000.8628.52
9Previous014343518.85000.4214.16
10Exit012412559.55001.48714.70
11Bounty185126210.76000.6516.43
12Fake0243646411.11000.5535.46
13PhishingNfraud054101716228.13002.22622.00
Listed by third parties1336129716.84003.0730.34
Total 576100.0010.119100.00

References

  1. Allen, Franklin, Antonio Fatás, and Beatrice di Mauro. 2022. Was the ICO Boom Just a Sideshow of the Bitcoin and Ether Momentum? CEPR Discussion Paper No. DP16908. Washington, DC: CEPR. [Google Scholar]
  2. An, Jiafu, Tinghua Duan, Wenxuan Hou, and Xinyu Xu. 2019. Initial coin offerings and entrepreneurial finance: The role of founders’ characteristics. Journal of Alternative Investments 21: 26–40. [Google Scholar] [CrossRef] [Green Version]
  3. Aune, Rune, Adam Krellenstein, Maureen O’Hara, and Ouziel Slama. 2017. Footprints on a blockchain: Trading and information leakage in distributed ledgers. Journal of Trading 12: 5–13. [Google Scholar] [CrossRef]
  4. Bellavitis, Cristiano, Douglas Cumming, and Tom Vanacker. 2020. Ban, Boom, and Echo! Entrepreneurship and Initial Coin Offerings. Entrepreneurship Theory and Practice, in press. [Google Scholar]
  5. Benedetti, Hugo, and Leonard Kostovetsky. 2021. Digital tulips? Returns to investors in initial coin offerings. Journal of Corporate Finance 66: 101786. [Google Scholar] [CrossRef]
  6. Bermudez, Patrícia, and Samuel Kotz. 2010. Parameter estimation of the generalized Pareto distribution—Part I. Journal of Statistical Planning and Inference 140: 1353–73. [Google Scholar] [CrossRef]
  7. Block, Joern, Alexander Groh, Lars Hornuf, Tom Vanacker, and Silvio Vismara. 2021. The entrepreneurial finance markets of the future: A comparison of crowdfunding and initial coin offerings. Small Business Economics 57: 865–82. [Google Scholar] [CrossRef] [Green Version]
  8. Chod, Jiri, Nikolaos Trichakis, Gerry Tsoukalas, Henry Aspegren, and Mark Weber. 2020. On the Financing Benefits of Supply Chain Transparency and Blockchain Adoption. Management Science 66: 4378–96. [Google Scholar] [CrossRef]
  9. Cirillo, Pasquale, and Nassim Taleb. 2020. Tail risk of contagious diseases. Nature Physics 16: 606–13. [Google Scholar] [CrossRef]
  10. Clauset, Aaron, Cosma Shalizi, and Mark Newman. 2009. Power-Law Distributions in Empirical Data. SIAM Review 51: 661–703. [Google Scholar] [CrossRef] [Green Version]
  11. Cumming, Douglas, Sofia Johan, and Anshum Pant. 2019. Regulation of the Crypto-Economy: Managing Risks, Challenges, and Regulatory Uncertainty. Journal of Risk and Financial Management 12: 126. [Google Scholar] [CrossRef] [Green Version]
  12. Czaja, Daniel, and Florian Röder. 2022. Signalling in Initial Coin Offerings: The Key Role of Entrepreneurs’ Self-efficacy and Media Presence. Abacus 58: 24–61. [Google Scholar] [CrossRef]
  13. Fisch, Christian. 2019. Initial coin offerings (ICOs) to finance new ventures. Journal of Business Venturing 34: 1–22. [Google Scholar] [CrossRef]
  14. Fisch, Christian, and Paul Momtaz. 2020. Institutional investors and post-ICO performance: An empirical analysis of investor returns in initial coin offerings (ICOs). Journal of Corporate Finance 64: 101679. [Google Scholar] [CrossRef]
  15. Foley, Sean, Jonathan Karlsen, and Tālis Putniņš. 2019. Sex, Drugs, and Bitcoin: How Much Illegal Activity Is Financed Through Cryptocurrencies? Review of Financial Studies 32: 1798–853. [Google Scholar] [CrossRef]
  16. Gan, Jingxing, Gerry Tsoukalas, and Serguei Netessine. 2021. Initial Coin Offerings, Speculation, and Asset Tokenization. Management Science 67: 914–31. [Google Scholar] [CrossRef]
  17. Grobys, Klaus. 2021. What do we know about the second moment of financial markets? International Review of Financial Analysis 78: 101891. [Google Scholar] [CrossRef]
  18. Grobys, Klaus, and Niranjan Sapkota. 2020. Predicting Cryptocurrency Defaults. Applied Economics 52: 5060–76. [Google Scholar] [CrossRef]
  19. Grobys, Klaus, Josephine Dufitinema, Niranjan Sapkota, and James Kolari. 2022. What’s the expected loss when Bitcoin is under cyberattack? A fractal process analysis. Journal of International Financial Markets, Institutions and Money 77: 101534. [Google Scholar] [CrossRef]
  20. Grobys, Klaus, Juha Junttila, James Kolari, and Niranjan Sapkota. 2021. On the stability of stablecoins. Journal of Empirical Finance 64: 207–23. [Google Scholar] [CrossRef]
  21. Härdle, Wolfgang, Campbell Harvey, and Raphael Reule. 2020. Understanding Cryptocurrencies. Journal of Financial Econometrics 18: 181–208. [Google Scholar]
  22. Hornuf, Lars, Theresa Kück, and Armin Schwienbacher. 2022. Initial coin offerings, information disclosure, and fraud. Small Business Economics 58: 1741–59. [Google Scholar] [CrossRef]
  23. Howell, Sabrina, Marina Niessner, and David Yermack. 2020. Initial Coin Offerings: Financing Growth with Cryptocurrency Token Sales. Review of Financial Studies 33: 3925–74. [Google Scholar] [CrossRef]
  24. King, Timothy, and Dimitrios Koutmos. 2021. Herding and feedback trading in cryptocurrency markets. Annals of Operations Research 300: 79–96. [Google Scholar] [CrossRef] [PubMed]
  25. Liebau, Daniel, and Patrick Schueffel. 2019. Cryptocurrencies & initial coin offerings: Are they scams—An empirical study. Journal of the British Blockchain Association 2: 1–7. [Google Scholar]
  26. Makarov, Igor, and Antoinette Schoar. 2020. Trading and arbitrage in cryptocurrency markets. Journal of Financial Economics 135: 293–319. [Google Scholar] [CrossRef] [Green Version]
  27. Mandelbrot, Benoit. 1963. New methods in statistical economics. Journal of Political Economy 71: 421–40. [Google Scholar] [CrossRef]
  28. SATISGROUP. 2018. Cryptoasset Market Coverage Initiation: Network Creation. Bloomberg. Available online: https://research.bloomberg.com/pub/res/d28giW28tf6G7T_Wr77aU0gDgFQ (accessed on 12 February 2022).
  29. Taleb, Nassim. 2020. Statistical Consequences of Fat Tails: Real World Preasymptotics, Epistemology, and Applications. Cambridge: STEM Academic Press. [Google Scholar]
  30. Warusawitharana, Missaka. 2018. Time-varying volatility and the power law distribution of stock returns. Journal of Empirical Finance 49: 123–41. [Google Scholar] [CrossRef] [Green Version]
  31. West, Bruce, and Jonas Salk. 1987. Complexity, organization and uncertainty. European Journal of Operational Research 30: 117–28. [Google Scholar] [CrossRef]
  32. White, Ethan, Brian Enquist, and Jessica Green. 2008. On estimating the exponent of power-law frequency distributions. Ecology 89: 905–12. [Google Scholar] [CrossRef] [Green Version]
  33. Yermack, David. 2017. Corporate governance and blockchains. Review of Finance 21: 7–31. [Google Scholar] [CrossRef]
Figure 1. Data collection process. This figure illustrates the internal elaboration of the data collection process we followed for this research, through which we retrieved our final sample of 576 scam incidents in the ICO market.
Jrfm 15 00579 g001
Figure 2. Categorizing scams in the ICO market. This figure categorizes the sample of 576 ICO scams into 13 different categories. Appendix B Table A2 table provides further details regarding these 13 different types of ICO scams.
Jrfm 15 00579 g002
Figure 3. Power law exponent depending on the chosen minimum for scam ICOs. This figure plots the alpha depending on the chosen minimum value.
Jrfm 15 00579 g003
Figure 4. KS distance depending on the chosen minimum for scam ICOs. This figure plots the KS distance D depending on the chosen minimum value.
Jrfm 15 00579 g004
Table 1. Descriptive statistics. This table reports the descriptive statistics for losses attributable to scam Initial Coin Offerings (ICOs). Figures are presented in terms of USD.
MetricScam ICOs
Mean17,572,118
Median6,834,500
Maximum735,000,000
Minimum2000
Std.Dev52,493,273
Skewness10.10
Kurtosis123.83
Observations576
Table 2. Extreme Value Theory. The ten largest observations of the sample’s tail are retrieved and a generalized Pareto distribution (GPD) fitted, given by: GPD ( ξ , β ) = 1 ( 1 + ξ z β ) 1 ξ ,   if   ξ 0 ,   GPD ( ξ , β ) = 1 e z β ,   if   ξ = 0 , where ξ and β define the shape and scale parameters, respectively, and z { x | x > u } , in which u defines the tail threshold. EVT uses this limiting distribution to model tails of distributions, i.e., for data exceeding a certain threshold (or peaks over threshold, abbreviated as POT). Referring to those equations, one can infer that: (1) ξ > 0 if the GPD reduces to a fat-tailed distribution (e.g., Pareto distribution), (2) ξ = 0 if we have an exponential distribution, and (3) ξ < 0 if we have a thin-tailed distribution. We allocate 10% of the parent distribution into the POT cluster and estimate the corresponding shape and scale parameters using the Method of Moments (MOM), that is, ξ ^ = 0.5 ( z ¯ 2 s 2 1 ) and β ^ = 0.5 z ¯ ( z ¯ 2 s 2 + 1 ) , where z ¯ and s 2 are the sample mean and standard deviation, provided z { x | x > u } . The corresponding Shadow mean is given by: E [ z ] = β 1 ξ u ξ ξ 1 , ξ > 1 , u > 0 , β u ξ > 0 . The corresponding point estimates for the 10% cluster is marked in bold figures. Apart from 10% of the parent distributions, we also allocate up to ±5 sample observations above and below the 10% threshold to check robustness.
Observations ξ ^ β ^ E [ z ]
530.2578,036,414.26119,847,707.12
540.2576,897,073.34118,810,941.11
550.2575,799,745.10117,807,080.01
560.2574,745,097.02116,835,426.70
570.2673,730,512.28115,894,319.95
580.2672,726,189.66114,973,797.53
590.2671,747,661.60114,077,909.17
600.2670,808,483.95113,210,077.37
610.2669,906,366.34112,368,925.18
620.2669,039,192.80111,553,164.53
630.2768,162,429.69110,748,741.31
Table 3. Estimates for the power law model. This table reports the estimates for the power law model p ( x ) = ( α 1 ) x M I N α 1 x α using maximum likelihood estimation (MLE). The tail exponent α is estimated as, α ^ = 1 + N ( i = 1 N ln ( x i x M I N ) ) 1 , where α ^ denotes the MLE estimator and N denotes the number of observations, provided x i x M I N . In this model, the estimate x ^ M I N is assessed via the Kolmogorov–Smirnov or KS statistic, which is the maximum distance between the CDFs of the data and the fitted model, D = M A X x x M I N | S ( x ) P ( x ) | , where S ( x ) is the CDF of the data for the observation with a value of at least x M I N , and P ( x ) is the CDF for the power law model that best fits the data in the region x x M I N . The estimate of the x ^ M I N is the value of x M I N that minimizes D. To test the power law hypothesis, we follow Clauset et al. (2009) by employing the parameter vector ( α ^ , x ^ M I N ) = ( 2.5051 ,   19,500,000.00 ) in goodness-of-fit tests, thereby generating p-values that quantify the plausibility of the power law null hypothesis. Specifically, this test compares D with distance measurements for comparable synthetic data sets drawn from the hypothesized model. The corresponding p-value is defined to be the fraction of the synthetic distances that are larger than the empirical distance. Given a significance level of 5%, the power law null hypothesis is not rejected for p-values exceeding 5%, as the difference between the empirical data and the model can be attributed to statistical fluctuations alone.
Sample α ^ x ^ M I N (in USD) Observations (in % of the Total)KS Test (p-Value)
Scam ICOs2.505219,500,000.00132 (22.92%)0.4650
Table 4. Simulated power law models. We simulate 100,000 samples using power laws defined as p ( x ) = ( α 1 ) x M I N α 1 x α , with a parameter vector ( α ^ , x ^ M I N ) = ( 2.5051 ,   19,500,000.00 ) , and x p ( x ) = [ ( 1 α ) [ ( 1 p ( x ) ) ( α 1 ) x M I N α 1 + 1 ( 1 α ) x M I N ( 1 α ) ] ] 1 ( 1 α ) , where x p ( x ) , denotes the corresponding value of the power law function that is associated with the probability p ( x ) (see Grobys 2021). Each sample has 500 realizations x p ( x ) . The empirical sample mean is computed for each sample. This table provides an overview of the corresponding distribution- and sample-specific characteristics, where simulated losses in scam ICOs are presented in USD. For instance, for 1% of the simulated samples, the estimated average loss exceeds USD 108.26 million.
% of DistributionSimulated Losses (Scam ICOs)
50% 54,698,776.50
upper25% 59,635,399.20
upper 10% 66,936,376.82
upper 5% 74,535,280.77
upper 1% 108,263,805.74
upper 0.1% 322,072,331.30
upper 0.01% 1,726,332,507.79
Publisher’s Note: MDPI stays neutral with regard to jurisdictional claims in published maps and institutional affiliations.

