
Factor Endowments, Economic Integration, Round-Tripping, and Inward FDI: Evidence from the Baltic Economies


Abstract
1. Introduction
2. Literature Review
3. Theoretical Framework
4. Data and Methodology
5. Empirical Analysis
6. Conclusions
Author Contributions
Funding
Informed Consent Statement
Data Availability Statement
Conflicts of Interest
Appendix A


| Partners scope: 2004–2017; N: 548 | Armenia, Australia, Austria, Bangladesh, Belgium, Belize, Bulgaria, Canada, China, Cyprus, Czech Republic, Denmark, Estonia, Finland, France, Germany, Greece, Hong Kong SAR, Hungary, Iceland, India, Ireland, Israel, Italy, Japan, Kazakhstan, Kyrgyzstan, Lithuania, Luxembourg, Malta, Mauritius, Moldova, The Netherlands, New Zealand, Norway, Panama, Poland, Romania, Russia, Saudi Arabia, Singapore, Slovakia, South Africa, South Korea, Spain, Sweden, Switzerland, Turkey, Ukraine, United Kingdom, United States, Vietnam. |
| Offshore sample | Belize, Cyprus, Hong Kong SAR, Malaysia, Mauritius, The Netherlands, Luxembourg, Panama, Singapore. |
| Soviet sample | Armenia, Estonia, Kazakhstan, Kyrgyzstan, Lithuania, Moldova, Russia, Ukraine. |
| EU sample | Austria, Belgium, Cyprus, Czech Republic, Denmark, Estonia, Finland, France, Germany, Greece, Hungary, Ireland, Italy, Latvia, Lithuania, Luxembourg, Malta, The Netherlands, Poland, Portugal, Slovakia, Slovenia, Spain, Sweden, United Kingdom. |
| EFTA sample | Iceland, Norway, Switzerland. |
| EU FTA sample | Canada, Iceland, Kazakhstan, South Korea, Norway, Switzerland, Turkey, Ukraine. |
| Partners scope: 2004–2017; N: 465 | Austria, Belgium, Bulgaria, Canada, China, Cyprus, Czech Republic, Denmark, Finland, France, Germany, Hong Kong SAR, Hungary, Iceland, India, Ireland, Italy, Japan, Kazakhstan, Latvia, Lithuania, Luxembourg, Malta, The Netherlands, Norway, Poland, Russia, Singapore, Slovakia, South Korea, Spain, Sweden, Switzerland, Turkey, Ukraine, United Kingdom, United States. |
| Offshore sample | Cyprus, Hong Kong SAR, The Netherlands, Luxembourg, Singapore. |
| Soviet sample | Latvia, Lithuania, Moldova, Russia, Tajikistan, Ukraine. |
| EU sample | Austria, Belgium, Cyprus, Czech Republic, Denmark, Estonia, Finland, France, Germany, Greece, Hungary, Ireland, Italy, Latvia, Lithuania, Luxembourg, Malta, The Netherlands, Poland, Portugal, Slovakia, Slovenia, Spain, Sweden, United Kingdom. |
| EFTA sample | Iceland, Norway, Switzerland. |
| EU FTA sample | Canada, Iceland, Kazakhstan, Norway, South Korea, Switzerland, Turkey, Ukraine. |
| Partners scope: 2004–2017; N: 742 | Albania, Algeria, Argentina, Armenia, Australia, Austria, Bangladesh, Belgium, Belize, Brazil, Bulgaria, Canada, Chile, China, Croatia, Cyprus, Czech Republic, Denmark, Egypt, Estonia, Finland, France, Germany, Greece, Honduras, Hong Kong SAR, Hungary, Iceland, India, Ireland, Israel, Italy, Japan, Jordan, Kazakhstan, Korea, Kyrgyzstan, Latvia, Luxembourg, Malta, Malaysia, Mexico, The Netherlands, New Zealand, Norway, Pakistan, Panama, Poland, Portugal, Romania, Russia, Saudi Arabia, Singapore, Slovakia, Slovenia, South Africa, Spain, Syria, Sweden, Switzerland, Tajikistan, Thailand, Tunisia, Turkey, Ukraine, United Kingdom, United States, Vietnam. |
| Offshore sample | Belize, Cyprus, Hong Kong SAR, Luxembourg, Malaysia, The Netherlands, Panama, Singapore. |
| Soviet sample | Armenia, Estonia, Kazakhstan, Kyrgyzstan, Latvia, Moldova, Russia, Tajikistan, Ukraine. |
| EU sample | Austria, Belgium, Cyprus, Czech Republic, Denmark, Estonia, Finland, France, Germany, Greece, Hungary, Ireland, Italy, Latvia, Lithuania, Luxembourg, Malta, The Netherlands, Poland, Portugal, Slovakia, Slovenia, Spain, Sweden, United Kingdom. |
| EFTA sample | Iceland, Norway, Switzerland. |
| EU FTA sample | Canada, Iceland, Kazakhstan, Norway, South Korea, Switzerland, Turkey, Ukraine. |
| Variable | Definition | Source |
|---|---|---|
| FDI | Bilateral direct investment equity stock data from non-resident entities includes investment by a direct investor in its direct investment enterprise (immediate or not), retail funds, real estate investment (including investment properties and vacation homes), pass-through transactions, transactions that reach or surpass the threshold of 10% or more voting power, reverse investment by a direct investment enterprise in its own immediate or indirect investor (IMF 2019). We then applied Pacific exchange rate and used USD to obtain final results (Antweiler 2020), log. | Bank of Estonia (2020) Bank of Latvia (2020) Bank of Lithuania (2020) |
| voice | Perceptions of the extent to which a host country citizens are able to participate in selecting their government, freedom of association, and a free media, percentile rank, log. | World Development Indicators |
| urban_pop | Total urban population in host country, millions, log. | World Development Indicators |
| total_pop | Total population in host country, millions, log. | World Development Indicators |
| tf_home | Trade freedom index for the country-of-origin of FDI, log. | Heritage Foundation |
| tc | Trade freedom index for the recipient country of FDI, log. | Heritage Foundation |
| tax | Tax revenue in host country (% of GDP), log. | World Development Indicators |
| stab | Political stability and absence of violence/terrorism in the host country measures perceptions of the likelihood of political instability, including terrorism, percentile rank, log. | World Development Indicators |
| soviet | Dummy variable reflects if partner country was a former member of the Soviet Union. | Own calculation |
| regq | Perceptions of the ability of the government to formulate and implement sound policies and regulations and promote private sector, percentile rank, log. | World Development Indicators |
| offshore | Dummy variable reflects if partner country is in one of the offshore blacklists or indicated as round-trip FDI partner. | Damgaard et al. (2019) |
| law | Perceptions of the extent to which agents have confidence in and abide by the rules of society, quality of contract enforcement, property rights, percentile rank, log. | World Development Indicators |
| KOF | KOF globalization index, de facto, log. | Gygli et al. (2018) |
| k_diff | Physical capital difference adjusted for the number of employed population (in constant 2010 USD million), log. | Penn World Table |
| ic | Investment freedom index for the recipient country of inward FDI, log. | Heritage Foundation |
| hc_diff | Human capital difference, adjusted for the number of employed population, log. | Penn World Table |
| gov | Perceptions of the quality of public services, the quality of the civil service and the degree of its independence from political pressures, percentile rank, log. | World Development Indicators |
| gdp_sum | Sum of real GDPs (in constant 2010 USD million), log. | Penn World Table |
| gdp_diff | Squared difference of GDPs (in constant 2010 USD million), log. | Penn World Table |
| distance | Geographical distance between home and host countries, log (between capital cities, in km). | CEPII |
| open | Economic openness index of host country, log | World Development Indicators |
| corrup | Perceptions of the extent to which public power is exercised for private gain in the host country, percentile rank, log. | World Development Indicators |
| contig | Dummy, one if partner country shares common border with the recipient country of inward FDI. | Own calculation |
| efta | Dummy, one if parent country is a member of the European Free Trade Association. | Own calculation |
| euro_zone | Dummy, one if parent and host countries are both members of the Eurozone. | Own calculation |
| eu | Dummy, one if parent and host countries are both members of the European Union. | Own calculation |
| eu_fta | Dummy, one if has active bilateral trade agreement with third party countries. | European Commission (2020) |

| Variable | General Case | Restricted Case | ||
|---|---|---|---|---|
| incl. prob. | post mean | incl. prob. | post mean | |
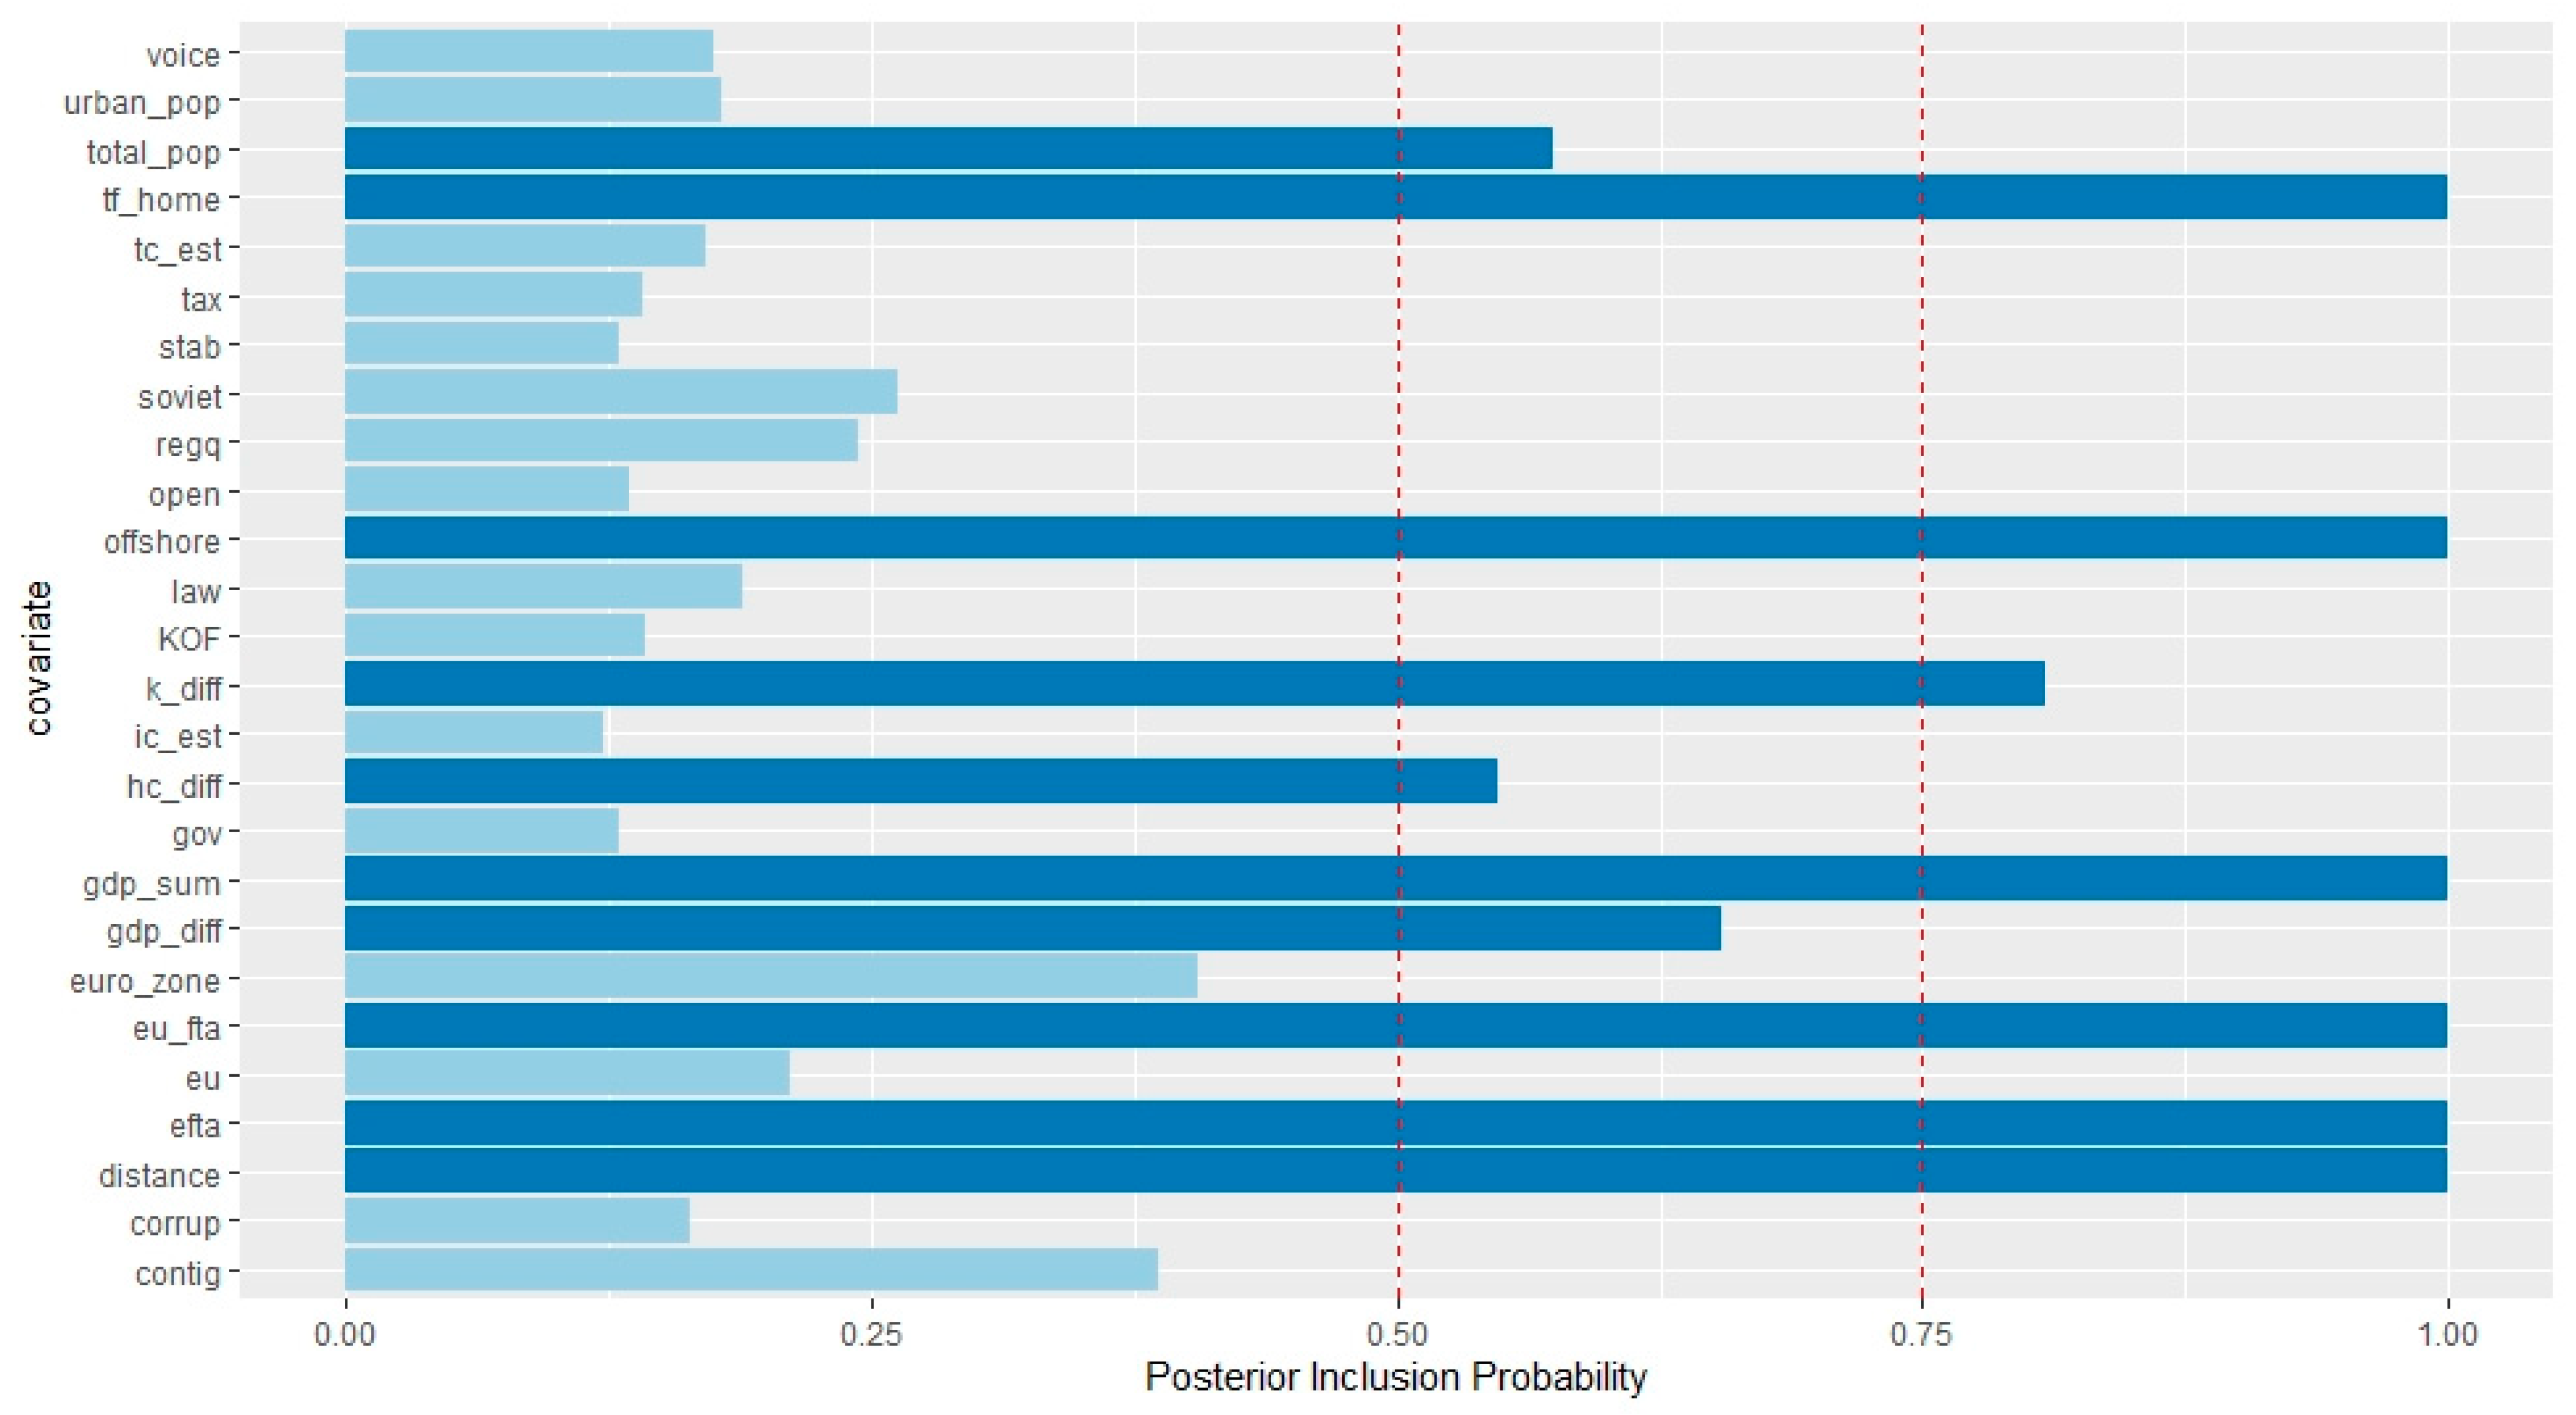
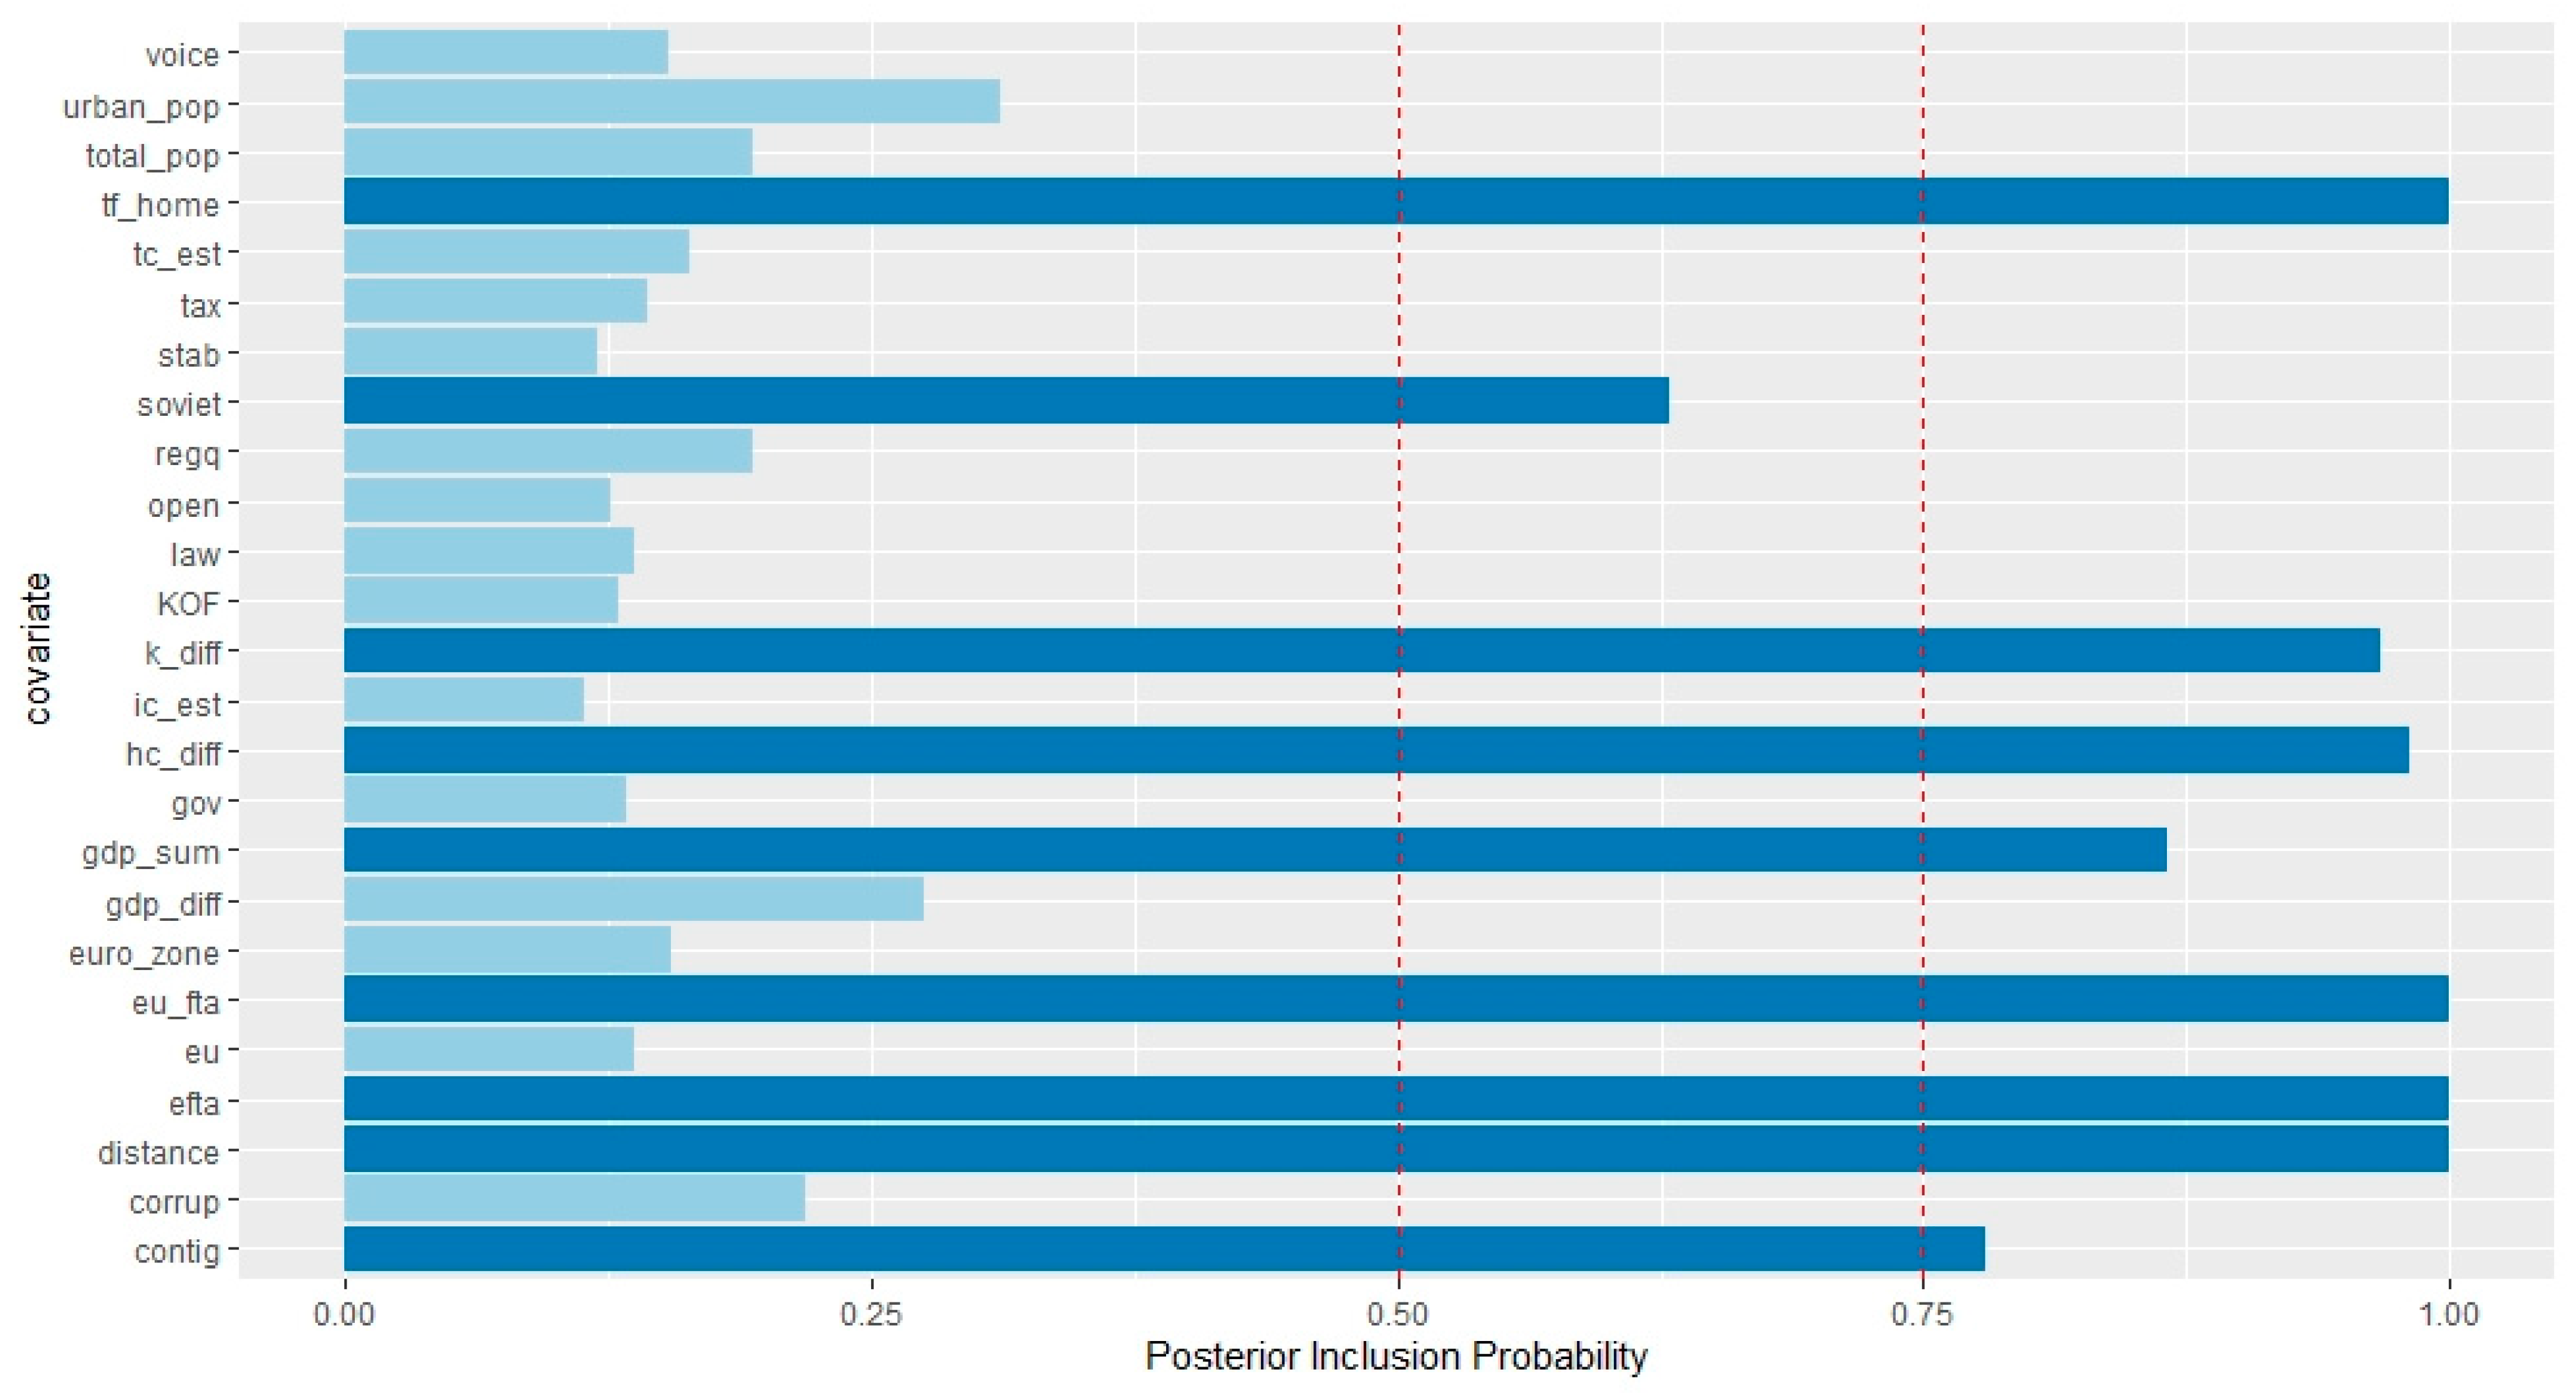
| gdp_diff | 0.659 | −0.110 | 0.274 | 0.017 |
| k_diff | 0.808 | 0.220 | 0.966 | 0.323 |
| hc_diff | 0.554 | 0.399 | 0.978 | 1.195 |
| gdp_sum | 1 | 0.895 | 0.865 | 0.613 |
| distance | 1 | −1.472 | 1 | −1.422 |
| tf_home | 0.999 | 4.746 | 1 | 7.200 |
| ic_est | 0.124 | C | 0.114 | C |
| tc_est | 0.175 | −0.861 | 0.162 | −1.178 |
| urban_pop | 0.179 | 5.974 | 0.309 | 14.190 |
| total_pop | 0.572 | −15.770 | 0.193 | −3.253 |
| tax | 0.144 | 0.026 | 0.145 | 0.116 |
| open | 0.135 | −0.018 | 0.127 | 0.031 |
| KOF | 0.143 | 0.126 | 0.130 | 0.140 |
| stab | 0.130 | −0.132 | 0.120 | −0.067 |
| voice | 0.177 | 0.506 | 0.152 | 0.327 |
| gov | 0.129 | −0.096 | 0.129 | −0.312 |
| regq | 0.245 | 1.366 | 0.190 | 1.014 |
| law | 0.187 | 0.764 | 0.135 | 0.295 |
| corrup | 0.164 | −0.049 | 0.222 | 0.543 |
| soviet | 0.264 | 0.107 | 0.632 | 0.420 |
| contig | 0.388 | 0.286 | 0.778 | 0.845 |
| eu | 0.214 | 0.082 | 0.135 | 0.004 |
| eu_fta | 0.999 | −2.034 | 0.999 | −2.096 |
| offshore | 1 | 2.422 | N/A | N/A |
| euro_zone | 1 | 0.162 | 1 | 0.033 |
| efta | 0.407 | 3.134 | 0.157 | 3.017 |
| Variable | General Case | Restricted Case | ||
|---|---|---|---|---|
| incl. prob. | post mean | incl. prob. | post mean | |
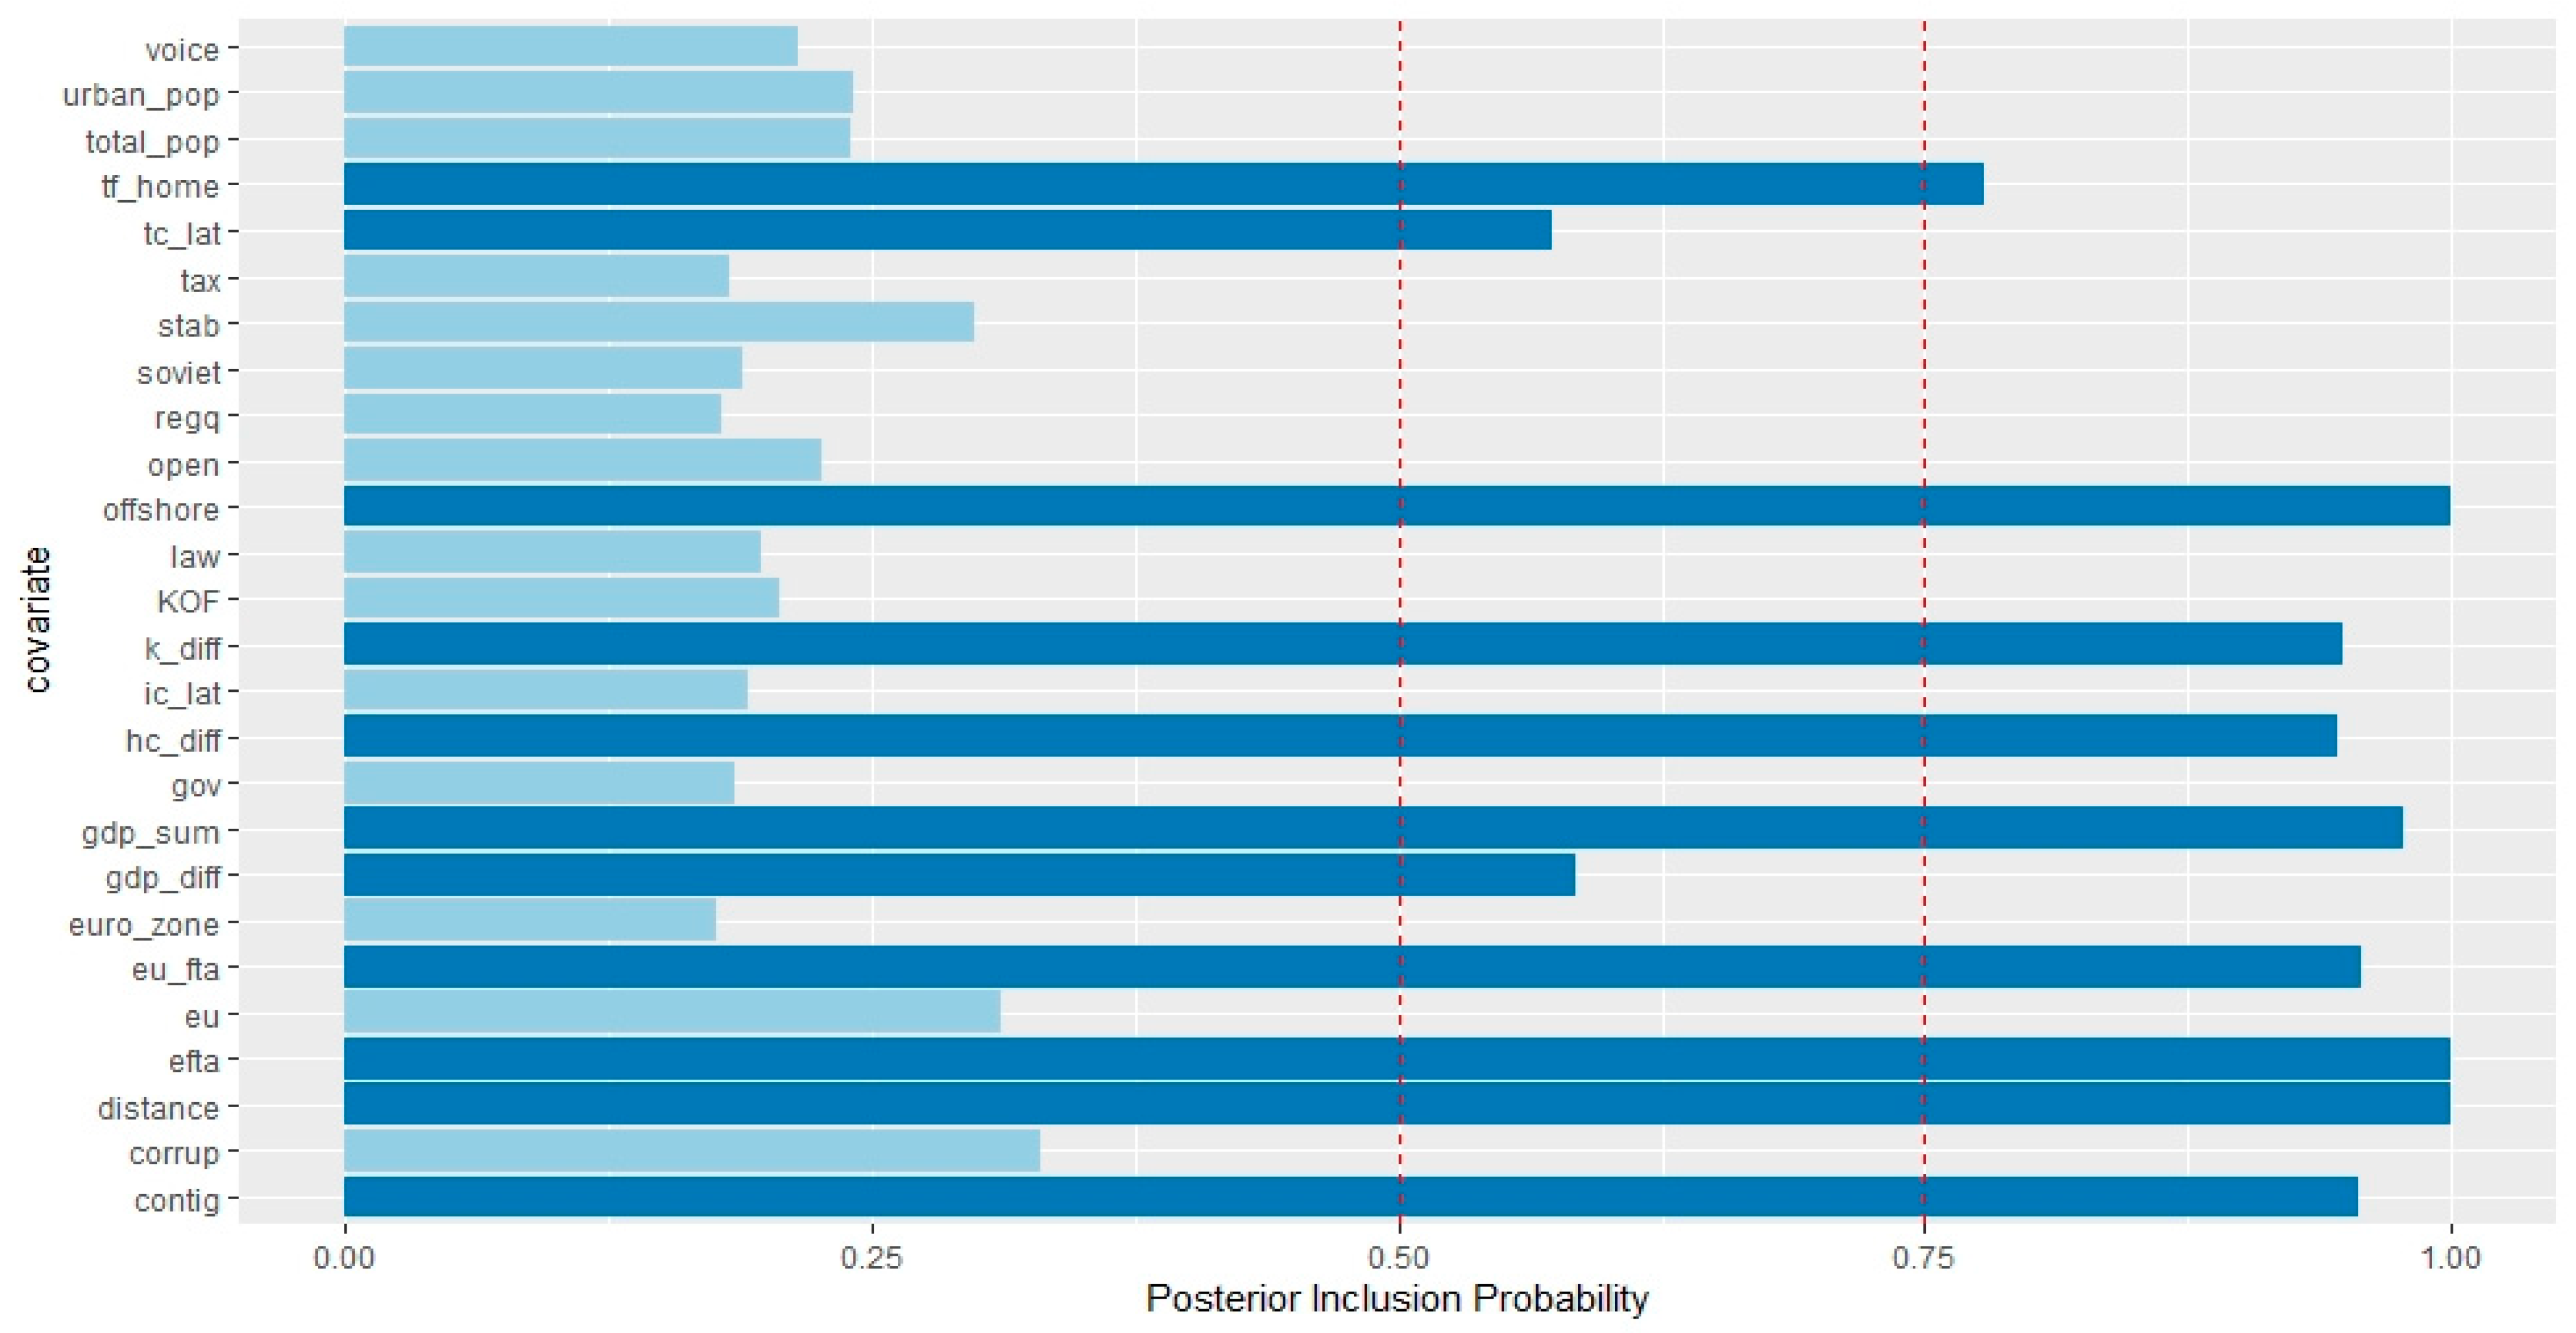
| gdp_diff | 0.584 | −0.112 | 0.613 | 0.109 |
| k_diff | 0.948 | −0.276 | 0.503 | −0.103 |
| hc_diff | 0.945 | 0.427 | 0.738 | 0.322 |
| gdp_sum | 0.977 | 0.586 | 0.470 | 0.122 |
| distance | 1 | −1.070 | 1 | −0.886 |
| tf_home | 0.778 | 1.438 | 0.991 | 3.166 |
| ic_lat | 0.227 | −0.090 | 0.147 | −0.104 |
| tc_lat | 0.573 | 4.427 | 0.295 | 1.584 |
| urban_pop | 0.241 | −9.333 | 0.178 | −3.587 |
| total_pop | 0.240 | 8.565 | 0.175 | 3.193 |
| tax | 0.182 | −0.046 | 0.141 | −0.028 |
| open | 0.226 | 0.278 | 0.172 | 0.196 |
| KOF | 0.206 | 0.214 | 0.154 | 0.091 |
| stab | 0.299 | −0.515 | 0.289 | −0.489 |
| voice | 0.215 | −1.183 | 0.188 | −1.206 |
| gov | 0.185 | −0.163 | 0.148 | −0.170 |
| regq | 0.178 | 0.268 | 0.166 | 0.559 |
| law | 0.197 | 0.154 | 0.171 | 0.287 |
| corrup | 0.329 | 1.366 | 0.222 | 0.760 |
| soviet | 0.188 | −0.026 | 0.313 | −0.159 |
| contig | 0.955 | 1.116 | 0.999 | 1.880 |
| eu | 0.311 | 0.121 | 0.230 | −0.104 |
| eu_fta | 0.957 | −1.041 | 0.994 | −1.250 |
| offshore | 1 | 1.266 | N/A | N/A |
| euro_zone | 0.177 | 0.021 | 0.179 | −0.046 |
| efta | 1 | 2.192 | 1 | 2.484 |
| Variable | General Case | Restricted Case | ||
|---|---|---|---|---|
| incl. prob. | post mean | incl. prob. | post mean | |
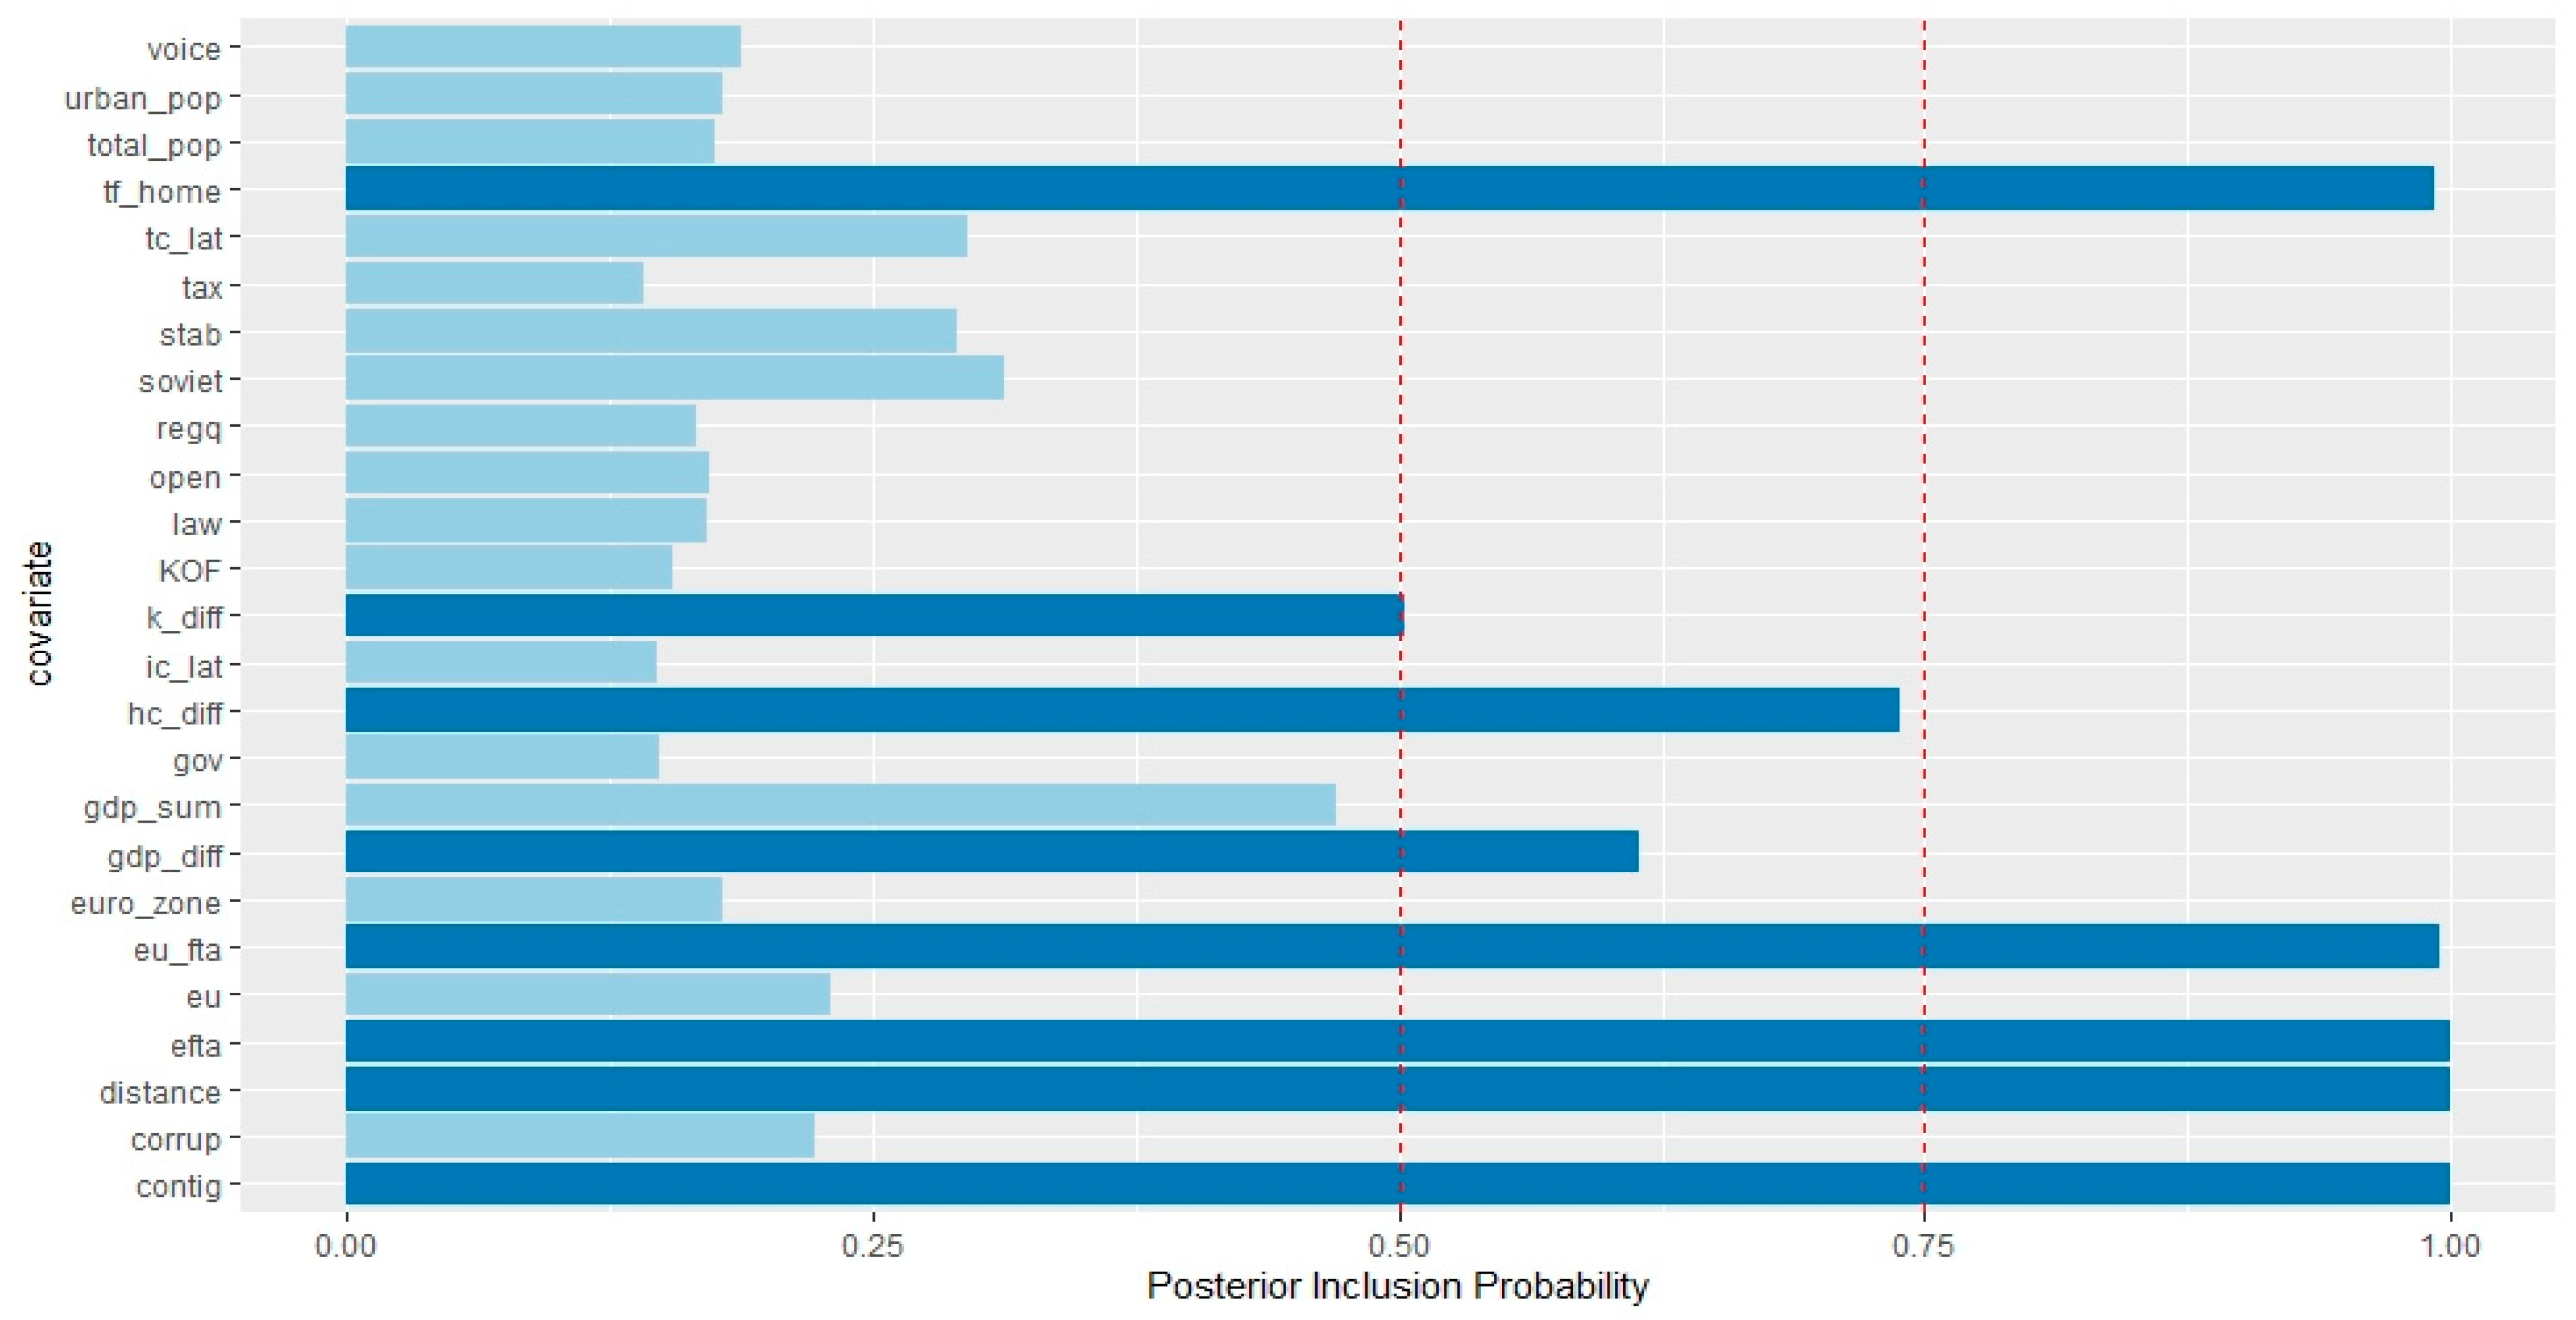
| gdp_diff | 1 | −0.014 | 0.999 | 0.413 |
| k_diff | 1 | 0.348 | 1 | 0.234 |
| hc_diff | 1 | 0.818 | 0.716 | 0.960 |
| gdp_sum | 0.941 | 0.986 | 0.073 | 0.002 |
| distance | 1 | −1.313 | 1 | −1.494 |
| tf_home | 1 | 6.367 | 1 | 6.983 |
| ic_ltu | 0.133 | −0.153 | 0.137 | −0.268 |
| tc_ltu | 0.132 | −0.145 | 0.115 | −0.462 |
| urban_pop | 0.129 | 0.446 | 0.185 | 1.397 |
| total_pop | 0.128 | 0.106 | 0.177 | −0.085 |
| tax | 0.115 | 0.115 | 0.139 | 0.184 |
| open | 0.129 | −0.217 | 0.157 | −0.175 |
| KOF | 0.119 | −0.217 | 0.167 | −0.454 |
| stab | 0.086 | −0.014 | 0.073 | 0.034 |
| voice | 0.122 | −0.413 | 0.091 | −0.226 |
| gov | 0.126 | −0.220 | 0.100 | −0.187 |
| regq | 0.104 | −0.134 | 0.086 | −0.100 |
| law | 0.126 | −0.160 | 0.144 | −0.350 |
| corrup | 0.136 | −0.221 | 0.110 | −0.177 |
| soviet | 0.998 | 1.435 | 0.998 | 1.447 |
| contig | 0.902 | 1.318 | 0.714 | 0.900 |
| eu | 1 | 1.869 | 0.999 | 1.650 |
| eu_fta | 0.172 | 0.099 | 0.105 | −0.005 |
| offshore | 1 | 2.370 | N/A | N/A |
| euro_zone | 0.174 | 0.079 | 0.140 | 0.061 |
| efta | 0.922 | 1.452 | 0.966 | 1.353 |
| gdp_diff | k_diff | hc_diff | gdp_sum | distance | tf_home | ic_est | tc_est | urb_pop | tax | open | KOF | stab | voice | gov | regq | law | corrup | soviet | contig | eu | eu_fta | offshore | euro_z | efta | |
|---|---|---|---|---|---|---|---|---|---|---|---|---|---|---|---|---|---|---|---|---|---|---|---|---|---|
| gdp_diff | 0.67881 | 0.59644 | 0.50137 | 0.67881 | 0.67881 | 0.67881 | 0.10339 | 0.11533 | 0.11081 | 0.12664 | 0.11696 | 0.12646 | 0.11613 | 0.18467 | 0.11557 | 0.29482 | 0.20207 | 0.14982 | 0.21713 | 0.29711 | 0.14891 | 0.67861 | 0.67881 | 0.33797 | 0.67881 |
| k_diff | 0.59644 | 0.81591 | 0.56895 | 0.81591 | 0.81591 | 0.81589 | 0.12134 | 0.13653 | 0.12958 | 0.15047 | 0.13684 | 0.14898 | 0.13526 | 0.22036 | 0.13463 | 0.34945 | 0.24326 | 0.17624 | 0.27248 | 0.39248 | 0.2007 | 0.81547 | 0.81591 | 0.39393 | 0.81591 |
| hc_diff | 0.50137 | 0.56895 | 0.60316 | 0.60316 | 0.60316 | 0.60314 | 0.0975 | 0.10742 | 0.10453 | 0.11861 | 0.10811 | 0.11676 | 0.10863 | 0.16853 | 0.10872 | 0.26469 | 0.19216 | 0.13933 | 0.22955 | 0.30001 | 0.15841 | 0.60286 | 0.60316 | 0.29252 | 0.60316 |
| gdp_sum | 0.67881 | 0.81591 | 0.60316 | 1 | 1 | 0.99998 | 0.13705 | 0.15552 | 0.14595 | 0.17358 | 0.156 | 0.16996 | 0.1536 | 0.25789 | 0.15217 | 0.40955 | 0.28254 | 0.2015 | 0.30807 | 0.42845 | 0.2213 | 0.99955 | 1 | 0.51186 | 1 |
| distance | 0.67881 | 0.81591 | 0.60316 | 1 | 1 | 0.99998 | 0.13705 | 0.15552 | 0.14595 | 0.17358 | 0.156 | 0.16996 | 0.1536 | 0.25789 | 0.15217 | 0.40955 | 0.28254 | 0.2015 | 0.30807 | 0.42845 | 0.2213 | 0.99955 | 1 | 0.51186 | 1 |
| tf_home | 0.67881 | 0.81589 | 0.60314 | 0.99998 | 0.99998 | 0.99998 | 0.13705 | 0.15552 | 0.14595 | 0.17358 | 0.156 | 0.16996 | 0.1536 | 0.25789 | 0.15216 | 0.40953 | 0.28253 | 0.20149 | 0.30807 | 0.42845 | 0.22129 | 0.99953 | 0.99998 | 0.51185 | 0.99998 |
| ic_est | 0.10339 | 0.12134 | 0.0975 | 0.13705 | 0.13705 | 0.13705 | 0.13705 | 0.02869 | 0.02724 | 0.03108 | 0.02787 | 0.02964 | 0.02902 | 0.04125 | 0.02902 | 0.05941 | 0.04727 | 0.03434 | 0.05365 | 0.07066 | 0.04118 | 0.13699 | 0.13705 | 0.07359 | 0.13705 |
| tc_est | 0.11533 | 0.13653 | 0.10742 | 0.15552 | 0.15552 | 0.15552 | 0.02869 | 0.15552 | 0.03193 | 0.03243 | 0.02981 | 0.03157 | 0.03077 | 0.04161 | 0.03231 | 0.06071 | 0.05479 | 0.03651 | 0.0579 | 0.07741 | 0.04522 | 0.15547 | 0.15552 | 0.08204 | 0.15552 |
| urb_pop | 0.11081 | 0.12958 | 0.10453 | 0.14595 | 0.14595 | 0.14595 | 0.02724 | 0.03193 | 0.14595 | 0.03212 | 0.03106 | 0.03357 | 0.03287 | 0.04199 | 0.03342 | 0.06149 | 0.0531 | 0.03781 | 0.05703 | 0.07662 | 0.04345 | 0.14588 | 0.14595 | 0.07785 | 0.14595 |
| tax | 0.12664 | 0.15047 | 0.11861 | 0.17358 | 0.17358 | 0.17358 | 0.03108 | 0.03243 | 0.03212 | 0.17358 | 0.03979 | 0.04063 | 0.03474 | 0.04279 | 0.03285 | 0.06281 | 0.05548 | 0.03582 | 0.0656 | 0.08559 | 0.0483 | 0.17349 | 0.17358 | 0.09247 | 0.17358 |
| open | 0.11696 | 0.13684 | 0.10811 | 0.156 | 0.156 | 0.156 | 0.02787 | 0.02981 | 0.03106 | 0.03979 | 0.156 | 0.03305 | 0.03249 | 0.04129 | 0.03195 | 0.06046 | 0.04983 | 0.0368 | 0.05716 | 0.07813 | 0.04578 | 0.15589 | 0.156 | 0.08003 | 0.156 |
| KOF | 0.12646 | 0.14898 | 0.11676 | 0.16996 | 0.16996 | 0.16996 | 0.02964 | 0.03157 | 0.03357 | 0.04063 | 0.03305 | 0.16996 | 0.03501 | 0.04196 | 0.03228 | 0.06502 | 0.0522 | 0.03838 | 0.06136 | 0.08459 | 0.04869 | 0.16989 | 0.16996 | 0.08316 | 0.16996 |
| stab | 0.11613 | 0.13526 | 0.10863 | 0.1536 | 0.1536 | 0.1536 | 0.02902 | 0.03077 | 0.03287 | 0.03474 | 0.03249 | 0.03501 | 0.1536 | 0.05091 | 0.03313 | 0.06022 | 0.05265 | 0.04072 | 0.05884 | 0.07898 | 0.04581 | 0.15354 | 0.1536 | 0.08246 | 0.1536 |
| voice | 0.18467 | 0.22036 | 0.16853 | 0.25789 | 0.25789 | 0.25789 | 0.04125 | 0.04161 | 0.04199 | 0.04279 | 0.04129 | 0.04196 | 0.05091 | 0.25789 | 0.04527 | 0.06036 | 0.06003 | 0.04404 | 0.08541 | 0.11936 | 0.0663 | 0.25779 | 0.25789 | 0.11583 | 0.25789 |
| gov | 0.11557 | 0.13463 | 0.10872 | 0.15217 | 0.15217 | 0.15216 | 0.02902 | 0.03231 | 0.03342 | 0.03285 | 0.03195 | 0.03228 | 0.03313 | 0.04527 | 0.15217 | 0.06359 | 0.06067 | 0.03854 | 0.05906 | 0.07815 | 0.04586 | 0.1521 | 0.15217 | 0.08042 | 0.15217 |
| regq | 0.29482 | 0.34945 | 0.26469 | 0.40955 | 0.40955 | 0.40953 | 0.05941 | 0.06071 | 0.06149 | 0.06281 | 0.06046 | 0.06502 | 0.06022 | 0.06036 | 0.06359 | 0.40955 | 0.08712 | 0.05781 | 0.12527 | 0.18262 | 0.10184 | 0.4094 | 0.40955 | 0.16589 | 0.40955 |
| law | 0.20207 | 0.24326 | 0.19216 | 0.28254 | 0.28254 | 0.28253 | 0.04727 | 0.05479 | 0.0531 | 0.05548 | 0.04983 | 0.0522 | 0.05265 | 0.06003 | 0.06067 | 0.08712 | 0.28254 | 0.07047 | 0.1003 | 0.1313 | 0.0744 | 0.2824 | 0.28254 | 0.1606 | 0.28254 |
| corrup | 0.14982 | 0.17624 | 0.13933 | 0.2015 | 0.2015 | 0.20149 | 0.03434 | 0.03651 | 0.03781 | 0.03582 | 0.0368 | 0.03838 | 0.04072 | 0.04404 | 0.03854 | 0.05781 | 0.07047 | 0.2015 | 0.07263 | 0.09955 | 0.05449 | 0.20142 | 0.2015 | 0.09992 | 0.2015 |
| soviet | 0.21713 | 0.27248 | 0.22955 | 0.30807 | 0.30807 | 0.30807 | 0.05365 | 0.0579 | 0.05703 | 0.0656 | 0.05716 | 0.06136 | 0.05884 | 0.08541 | 0.05906 | 0.12527 | 0.1003 | 0.07263 | 0.30807 | 0.13472 | 0.10569 | 0.30778 | 0.30807 | 0.17655 | 0.30807 |
| contig | 0.29711 | 0.39248 | 0.30001 | 0.42845 | 0.42845 | 0.42845 | 0.07066 | 0.07741 | 0.07662 | 0.08559 | 0.07813 | 0.08459 | 0.07898 | 0.11936 | 0.07815 | 0.18262 | 0.1313 | 0.09955 | 0.13472 | 0.42845 | 0.14431 | 0.42802 | 0.42845 | 0.21064 | 0.42845 |
| eu | 0.14891 | 0.2007 | 0.15841 | 0.2213 | 0.2213 | 0.22129 | 0.04118 | 0.04522 | 0.04345 | 0.0483 | 0.04578 | 0.04869 | 0.04581 | 0.0663 | 0.04586 | 0.10184 | 0.0744 | 0.05449 | 0.10569 | 0.14431 | 0.2213 | 0.22089 | 0.2213 | 0.09477 | 0.2213 |
| eu_fta | 0.67861 | 0.81547 | 0.60286 | 0.99955 | 0.99955 | 0.99953 | 0.13699 | 0.15547 | 0.14588 | 0.17349 | 0.15589 | 0.16989 | 0.15354 | 0.25779 | 0.1521 | 0.4094 | 0.2824 | 0.20142 | 0.30778 | 0.42802 | 0.22089 | 0.99955 | 0.99955 | 0.51172 | 0.99955 |
| offshore | 0.67881 | 0.81591 | 0.60316 | 1 | 1 | 0.99998 | 0.13705 | 0.15552 | 0.14595 | 0.17358 | 0.156 | 0.16996 | 0.1536 | 0.25789 | 0.15217 | 0.40955 | 0.28254 | 0.2015 | 0.30807 | 0.42845 | 0.2213 | 0.99955 | 1 | 0.51186 | 1 |
| euro_z | 0.33797 | 0.39393 | 0.29252 | 0.51186 | 0.51186 | 0.51185 | 0.07359 | 0.08204 | 0.07785 | 0.09247 | 0.08003 | 0.08316 | 0.08246 | 0.11583 | 0.08042 | 0.16589 | 0.1606 | 0.09992 | 0.17655 | 0.21064 | 0.09477 | 0.51172 | 0.51186 | 0.51186 | 0.51186 |
| efta | 0.67881 | 0.81591 | 0.60316 | 1 | 1 | 0.99998 | 0.13705 | 0.15552 | 0.14595 | 0.17358 | 0.156 | 0.16996 | 0.1536 | 0.25789 | 0.15217 | 0.40955 | 0.28254 | 0.2015 | 0.30807 | 0.42845 | 0.2213 | 0.99955 | 1 | 0.51186 | 1 |
| gdp_diff | hc_diff | gdp_sum | distance | k_diff | ic_lat | tc_lat | tf_home | urb_pop | total_pop | tax | open | KOF | stab | voice | gov | regq | law | corrup | soviet | contig | eu | eu_fta | euro_z | efta | offshore | |
|---|---|---|---|---|---|---|---|---|---|---|---|---|---|---|---|---|---|---|---|---|---|---|---|---|---|---|
| gdp_diff | 0.58619 | 0.57122 | 0.56294 | 0.58619 | 0.55142 | 0.12408 | 0.3304 | 0.48532 | 0.15485 | 0.15093 | 0.11907 | 0.14549 | 0.13262 | 0.19138 | 0.14286 | 0.12161 | 0.11636 | 0.12664 | 0.21138 | 0.11993 | 0.54489 | 0.17592 | 0.56459 | 0.11101 | 0.58614 | 0.58619 |
| hc_diff | 0.57122 | 0.94605 | 0.92944 | 0.94605 | 0.89363 | 0.18463 | 0.53536 | 0.76427 | 0.23545 | 0.22881 | 0.17674 | 0.21512 | 0.19644 | 0.28599 | 0.20852 | 0.17947 | 0.1741 | 0.19113 | 0.31604 | 0.18106 | 0.90408 | 0.2859 | 0.9071 | 0.16857 | 0.94591 | 0.94605 |
| gdp_sum | 0.56294 | 0.92944 | 0.97675 | 0.97675 | 0.92454 | 0.18732 | 0.55952 | 0.76677 | 0.24146 | 0.23438 | 0.18036 | 0.21985 | 0.20053 | 0.29124 | 0.21219 | 0.18286 | 0.17677 | 0.19436 | 0.32176 | 0.18467 | 0.93183 | 0.30362 | 0.93307 | 0.17217 | 0.97661 | 0.97675 |
| distance | 0.58619 | 0.94605 | 0.97675 | 1 | 0.94733 | 0.19112 | 0.57401 | 0.78022 | 0.24613 | 0.23908 | 0.18385 | 0.22407 | 0.20441 | 0.29662 | 0.21627 | 0.18653 | 0.18002 | 0.19852 | 0.32793 | 0.18897 | 0.95497 | 0.3121 | 0.95497 | 0.17588 | 0.99986 | 1 |
| k_diff | 0.55142 | 0.89363 | 0.92454 | 0.94733 | 0.94733 | 0.18291 | 0.54502 | 0.73112 | 0.23483 | 0.22806 | 0.17518 | 0.21425 | 0.19555 | 0.28362 | 0.20644 | 0.17808 | 0.17177 | 0.18952 | 0.3144 | 0.17754 | 0.90289 | 0.29282 | 0.90801 | 0.16845 | 0.94722 | 0.94733 |
| ic_lat | 0.12408 | 0.18463 | 0.18732 | 0.19112 | 0.18291 | 0.19112 | 0.10522 | 0.15756 | 0.05319 | 0.05213 | 0.04487 | 0.05585 | 0.04943 | 0.06844 | 0.05127 | 0.0433 | 0.04196 | 0.04619 | 0.07418 | 0.04385 | 0.18412 | 0.06674 | 0.18406 | 0.04301 | 0.19108 | 0.19112 |
| tc_lat | 0.3304 | 0.53536 | 0.55952 | 0.57401 | 0.54502 | 0.10522 | 0.57401 | 0.4141 | 0.09776 | 0.09664 | 0.09501 | 0.10814 | 0.10219 | 0.11082 | 0.10717 | 0.09414 | 0.0909 | 0.09523 | 0.13307 | 0.10568 | 0.54418 | 0.18801 | 0.54325 | 0.10012 | 0.57393 | 0.57401 |
| tf_home | 0.48532 | 0.76427 | 0.76677 | 0.78022 | 0.73112 | 0.15756 | 0.4141 | 0.78022 | 0.19958 | 0.1942 | 0.15019 | 0.18226 | 0.1665 | 0.24212 | 0.17724 | 0.15227 | 0.14993 | 0.16486 | 0.2664 | 0.15294 | 0.75628 | 0.21631 | 0.75616 | 0.14281 | 0.78012 | 0.78022 |
| urb_pop | 0.15485 | 0.23545 | 0.24146 | 0.24613 | 0.23483 | 0.05319 | 0.09776 | 0.19958 | 0.24613 | 0.072 | 0.05366 | 0.05752 | 0.05443 | 0.0768 | 0.06247 | 0.05671 | 0.05044 | 0.05189 | 0.09919 | 0.05425 | 0.23642 | 0.08262 | 0.23678 | 0.05078 | 0.2461 | 0.24613 |
| total_pop | 0.15093 | 0.22881 | 0.23438 | 0.23908 | 0.22806 | 0.05213 | 0.09664 | 0.1942 | 0.072 | 0.23908 | 0.05301 | 0.0562 | 0.05481 | 0.07619 | 0.06059 | 0.05476 | 0.04854 | 0.05002 | 0.09675 | 0.05211 | 0.2298 | 0.0818 | 0.2304 | 0.04943 | 0.23905 | 0.23908 |
| tax | 0.11907 | 0.17674 | 0.18036 | 0.18385 | 0.17518 | 0.04487 | 0.09501 | 0.15019 | 0.05366 | 0.05301 | 0.18385 | 0.05258 | 0.04828 | 0.06467 | 0.04777 | 0.04233 | 0.04266 | 0.04659 | 0.07918 | 0.04273 | 0.17735 | 0.06574 | 0.17684 | 0.04144 | 0.18384 | 0.18385 |
| open | 0.14549 | 0.21512 | 0.21985 | 0.22407 | 0.21425 | 0.05585 | 0.10814 | 0.18226 | 0.05752 | 0.0562 | 0.05258 | 0.22407 | 0.05025 | 0.09813 | 0.05495 | 0.05131 | 0.04821 | 0.05335 | 0.08803 | 0.05054 | 0.21506 | 0.07747 | 0.21543 | 0.04896 | 0.22403 | 0.22407 |
| KOF | 0.13262 | 0.19644 | 0.20053 | 0.20441 | 0.19555 | 0.04943 | 0.10219 | 0.1665 | 0.05443 | 0.05481 | 0.04828 | 0.05025 | 0.20441 | 0.08611 | 0.05252 | 0.04748 | 0.04678 | 0.04986 | 0.08651 | 0.04744 | 0.19645 | 0.0719 | 0.19703 | 0.04438 | 0.20438 | 0.20441 |
| stab | 0.19138 | 0.28599 | 0.29124 | 0.29662 | 0.28362 | 0.06844 | 0.11082 | 0.24212 | 0.0768 | 0.07619 | 0.06467 | 0.09813 | 0.08611 | 0.29662 | 0.06893 | 0.06607 | 0.06329 | 0.06487 | 0.1514 | 0.06721 | 0.28506 | 0.10198 | 0.28568 | 0.06142 | 0.29659 | 0.29662 |
| voice | 0.14286 | 0.20852 | 0.21219 | 0.21627 | 0.20644 | 0.05127 | 0.10717 | 0.17724 | 0.06247 | 0.06059 | 0.04777 | 0.05495 | 0.05252 | 0.06893 | 0.21627 | 0.04924 | 0.0489 | 0.05737 | 0.10342 | 0.04983 | 0.20776 | 0.07496 | 0.20782 | 0.04835 | 0.21624 | 0.21627 |
| gov | 0.12161 | 0.17947 | 0.18286 | 0.18653 | 0.17808 | 0.0433 | 0.09414 | 0.15227 | 0.05671 | 0.05476 | 0.04233 | 0.05131 | 0.04748 | 0.06607 | 0.04924 | 0.18653 | 0.04207 | 0.04413 | 0.07344 | 0.04318 | 0.17943 | 0.06535 | 0.17992 | 0.0417 | 0.18652 | 0.18653 |
| regq | 0.11636 | 0.1741 | 0.17677 | 0.18002 | 0.17177 | 0.04196 | 0.0909 | 0.14993 | 0.05044 | 0.04854 | 0.04266 | 0.04821 | 0.04678 | 0.06329 | 0.0489 | 0.04207 | 0.18002 | 0.04194 | 0.07227 | 0.04165 | 0.17315 | 0.06186 | 0.17375 | 0.03917 | 0.18 | 0.18002 |
| law | 0.12664 | 0.19113 | 0.19436 | 0.19852 | 0.18952 | 0.04619 | 0.09523 | 0.16486 | 0.05189 | 0.05002 | 0.04659 | 0.05335 | 0.04986 | 0.06487 | 0.05737 | 0.04413 | 0.04194 | 0.19852 | 0.08006 | 0.04553 | 0.19132 | 0.0683 | 0.19126 | 0.04307 | 0.1985 | 0.19852 |
| corrup | 0.21138 | 0.31604 | 0.32176 | 0.32793 | 0.3144 | 0.07418 | 0.13307 | 0.2664 | 0.09919 | 0.09675 | 0.07918 | 0.08803 | 0.08651 | 0.1514 | 0.10342 | 0.07344 | 0.07227 | 0.08006 | 0.32793 | 0.07502 | 0.31527 | 0.11294 | 0.31654 | 0.06893 | 0.32788 | 0.32793 |
| soviet | 0.11993 | 0.18106 | 0.18467 | 0.18897 | 0.17754 | 0.04385 | 0.10568 | 0.15294 | 0.05425 | 0.05211 | 0.04273 | 0.05054 | 0.04744 | 0.06721 | 0.04983 | 0.04318 | 0.04165 | 0.04553 | 0.07502 | 0.18897 | 0.18284 | 0.05789 | 0.18234 | 0.0405 | 0.18893 | 0.18897 |
| contig | 0.54489 | 0.90408 | 0.93183 | 0.95497 | 0.90289 | 0.18412 | 0.54418 | 0.75628 | 0.23642 | 0.2298 | 0.17735 | 0.21506 | 0.19645 | 0.28506 | 0.20776 | 0.17943 | 0.17315 | 0.19132 | 0.31527 | 0.18284 | 0.95497 | 0.30601 | 0.91033 | 0.16987 | 0.95483 | 0.95497 |
| eu | 0.17592 | 0.2859 | 0.30362 | 0.3121 | 0.29282 | 0.06674 | 0.18801 | 0.21631 | 0.08262 | 0.0818 | 0.06574 | 0.07747 | 0.0719 | 0.10198 | 0.07496 | 0.06535 | 0.06186 | 0.0683 | 0.11294 | 0.05789 | 0.30601 | 0.3121 | 0.27292 | 0.05853 | 0.31196 | 0.3121 |
| eu_fta | 0.56459 | 0.9071 | 0.93307 | 0.95497 | 0.90801 | 0.18406 | 0.54325 | 0.75616 | 0.23678 | 0.2304 | 0.17684 | 0.21543 | 0.19703 | 0.28568 | 0.20782 | 0.17992 | 0.17375 | 0.19126 | 0.31654 | 0.18234 | 0.91033 | 0.27292 | 0.95497 | 0.16952 | 0.95492 | 0.95497 |
| euro_z | 0.11101 | 0.16857 | 0.17217 | 0.17588 | 0.16845 | 0.04301 | 0.10012 | 0.14281 | 0.05078 | 0.04943 | 0.04144 | 0.04896 | 0.04438 | 0.06142 | 0.04835 | 0.0417 | 0.03917 | 0.04307 | 0.06893 | 0.0405 | 0.16987 | 0.05853 | 0.16952 | 0.17588 | 0.17584 | 0.17588 |
| efta | 0.58614 | 0.94591 | 0.97661 | 0.99986 | 0.94722 | 0.19108 | 0.57393 | 0.78012 | 0.2461 | 0.23905 | 0.18384 | 0.22403 | 0.20438 | 0.29659 | 0.21624 | 0.18652 | 0.18 | 0.1985 | 0.32788 | 0.18893 | 0.95483 | 0.31196 | 0.95492 | 0.17584 | 0.99986 | 0.99986 |
| offshore | 0.58619 | 0.94605 | 0.97675 | 1 | 0.94733 | 0.19112 | 0.57401 | 0.78022 | 0.24613 | 0.23908 | 0.18385 | 0.22407 | 0.20441 | 0.29662 | 0.21627 | 0.18653 | 0.18002 | 0.19852 | 0.32793 | 0.18897 | 0.95497 | 0.3121 | 0.95497 | 0.17588 | 0.99986 | 1 |
| gdp_diff | hc_diff | gdp_sum | distance | k_diff | ic_ltu | tc_ltu | tf_home | urb_pop | total_pop | tax | open | KOF | stab | voice | gov | regq | law | corrup | soviet | contig | eu | eu_fta | euro_z | efta | offshore | |
|---|---|---|---|---|---|---|---|---|---|---|---|---|---|---|---|---|---|---|---|---|---|---|---|---|---|---|
| gdp_diff | 0.15023 | 0.15023 | 0.15023 | 0.15023 | 0.14458 | 0.02078 | 0.01785 | 0.15023 | 0.02307 | 0.02326 | 0.02305 | 0.02 | 0.0228 | 0.01606 | 0.02234 | 0.02123 | 0.01779 | 0.02234 | 0.02474 | 0.15002 | 0.13717 | 0.15023 | 0.03177 | 0.03158 | 0.13721 | 0.15023 |
| hc_diff | 0.15023 | 1 | 1 | 1 | 0.94212 | 0.1209 | 0.10104 | 1 | 0.1285 | 0.12987 | 0.12898 | 0.11512 | 0.13086 | 0.08617 | 0.12081 | 0.12148 | 0.10158 | 0.12605 | 0.13706 | 0.99799 | 0.9014 | 0.99999 | 0.17239 | 0.17304 | 0.92337 | 1 |
| gdp_sum | 0.15023 | 1 | 1 | 1 | 0.94212 | 0.1209 | 0.10104 | 1 | 0.1285 | 0.12987 | 0.12898 | 0.11512 | 0.13086 | 0.08617 | 0.12081 | 0.12148 | 0.10158 | 0.12605 | 0.13706 | 0.99799 | 0.9014 | 0.99999 | 0.17239 | 0.17304 | 0.92337 | 1 |
| distance | 0.15023 | 1 | 1 | 1 | 0.94212 | 0.1209 | 0.10104 | 1 | 0.1285 | 0.12987 | 0.12898 | 0.11512 | 0.13086 | 0.08617 | 0.12081 | 0.12148 | 0.10158 | 0.12605 | 0.13706 | 0.99799 | 0.9014 | 0.99999 | 0.17239 | 0.17304 | 0.92337 | 1 |
| k_diff | 0.14458 | 0.94212 | 0.94212 | 0.94212 | 0.94212 | 0.11515 | 0.0963 | 0.94212 | 0.12241 | 0.12356 | 0.12314 | 0.10961 | 0.12468 | 0.08253 | 0.11578 | 0.1154 | 0.09712 | 0.11937 | 0.13099 | 0.94012 | 0.87986 | 0.94211 | 0.16811 | 0.16473 | 0.86612 | 0.94212 |
| ic_ltu | 0.02078 | 0.1209 | 0.1209 | 0.1209 | 0.11515 | 0.1209 | 0.01253 | 0.1209 | 0.01417 | 0.01409 | 0.01378 | 0.01295 | 0.01475 | 0.01212 | 0.01579 | 0.0155 | 0.01281 | 0.01398 | 0.01522 | 0.12062 | 0.11078 | 0.1209 | 0.02192 | 0.02246 | 0.11203 | 0.1209 |
| tc_ltu | 0.01785 | 0.10104 | 0.10104 | 0.10104 | 0.0963 | 0.01253 | 0.10104 | 0.10104 | 0.01325 | 0.01346 | 0.01293 | 0.01223 | 0.01304 | 0.01059 | 0.01493 | 0.01381 | 0.01154 | 0.01298 | 0.0151 | 0.1009 | 0.0932 | 0.10103 | 0.01913 | 0.02212 | 0.09348 | 0.10104 |
| tf_home | 0.15023 | 1 | 1 | 1 | 0.94212 | 0.1209 | 0.10104 | 1 | 0.1285 | 0.12987 | 0.12898 | 0.11512 | 0.13086 | 0.08617 | 0.12081 | 0.12148 | 0.10158 | 0.12605 | 0.13706 | 0.99799 | 0.9014 | 0.99999 | 0.17239 | 0.17304 | 0.92337 | 1 |
| urb_pop | 0.02307 | 0.1285 | 0.1285 | 0.1285 | 0.12241 | 0.01417 | 0.01325 | 0.1285 | 0.1285 | 0.01339 | 0.01394 | 0.01373 | 0.01303 | 0.0128 | 0.01472 | 0.01532 | 0.01318 | 0.01366 | 0.01548 | 0.1283 | 0.11863 | 0.1285 | 0.0244 | 0.0281 | 0.11862 | 0.1285 |
| total_pop | 0.02326 | 0.12987 | 0.12987 | 0.12987 | 0.12356 | 0.01409 | 0.01346 | 0.12987 | 0.01339 | 0.12987 | 0.01436 | 0.01363 | 0.01336 | 0.01306 | 0.01451 | 0.01479 | 0.01295 | 0.01366 | 0.01473 | 0.12954 | 0.11935 | 0.12987 | 0.02441 | 0.02888 | 0.12023 | 0.12987 |
| tax | 0.02305 | 0.12898 | 0.12898 | 0.12898 | 0.12314 | 0.01378 | 0.01293 | 0.12898 | 0.01394 | 0.01436 | 0.12898 | 0.01348 | 0.01499 | 0.0131 | 0.01644 | 0.01923 | 0.01456 | 0.01603 | 0.01556 | 0.12878 | 0.11831 | 0.12898 | 0.02372 | 0.02414 | 0.11941 | 0.12898 |
| open | 0.02 | 0.11512 | 0.11512 | 0.11512 | 0.10961 | 0.01295 | 0.01223 | 0.11512 | 0.01373 | 0.01363 | 0.01348 | 0.11512 | 0.01346 | 0.0117 | 0.01614 | 0.01666 | 0.01305 | 0.01423 | 0.0165 | 0.11492 | 0.1057 | 0.11512 | 0.02225 | 0.02358 | 0.10658 | 0.11512 |
| KOF | 0.0228 | 0.13086 | 0.13086 | 0.13086 | 0.12468 | 0.01475 | 0.01304 | 0.13086 | 0.01303 | 0.01336 | 0.01499 | 0.01346 | 0.13086 | 0.01294 | 0.01484 | 0.01443 | 0.0125 | 0.01343 | 0.01555 | 0.13066 | 0.12008 | 0.13086 | 0.02412 | 0.02865 | 0.12077 | 0.13086 |
| stab | 0.01606 | 0.08617 | 0.08617 | 0.08617 | 0.08253 | 0.01212 | 0.01059 | 0.08617 | 0.0128 | 0.01306 | 0.0131 | 0.0117 | 0.01294 | 0.08617 | 0.01268 | 0.01273 | 0.01003 | 0.01228 | 0.01442 | 0.08604 | 0.07985 | 0.08617 | 0.01785 | 0.0186 | 0.07908 | 0.08617 |
| voice | 0.02234 | 0.12081 | 0.12081 | 0.12081 | 0.11578 | 0.01579 | 0.01493 | 0.12081 | 0.01472 | 0.01451 | 0.01644 | 0.01614 | 0.01484 | 0.01268 | 0.12081 | 0.01358 | 0.01258 | 0.01379 | 0.01448 | 0.1206 | 0.11172 | 0.12081 | 0.02327 | 0.02834 | 0.11146 | 0.12081 |
| gov | 0.02123 | 0.12148 | 0.12148 | 0.12148 | 0.1154 | 0.0155 | 0.01381 | 0.12148 | 0.01532 | 0.01479 | 0.01923 | 0.01666 | 0.01443 | 0.01273 | 0.01358 | 0.12148 | 0.01262 | 0.01457 | 0.01581 | 0.12129 | 0.11174 | 0.12147 | 0.02357 | 0.03211 | 0.11213 | 0.12148 |
| regq | 0.01779 | 0.10158 | 0.10158 | 0.10158 | 0.09712 | 0.01281 | 0.01154 | 0.10158 | 0.01318 | 0.01295 | 0.01456 | 0.01305 | 0.0125 | 0.01003 | 0.01258 | 0.01262 | 0.10158 | 0.01262 | 0.0147 | 0.1014 | 0.09375 | 0.10157 | 0.01935 | 0.02086 | 0.09396 | 0.10158 |
| law | 0.02234 | 0.12605 | 0.12605 | 0.12605 | 0.11937 | 0.01398 | 0.01298 | 0.12605 | 0.01366 | 0.01366 | 0.01603 | 0.01423 | 0.01343 | 0.01228 | 0.01379 | 0.01457 | 0.01262 | 0.12605 | 0.0153 | 0.12584 | 0.1152 | 0.12605 | 0.02383 | 0.02899 | 0.11675 | 0.12605 |
| corrup | 0.02474 | 0.13706 | 0.13706 | 0.13706 | 0.13099 | 0.01522 | 0.0151 | 0.13706 | 0.01548 | 0.01473 | 0.01556 | 0.0165 | 0.01555 | 0.01442 | 0.01448 | 0.01581 | 0.0147 | 0.0153 | 0.13706 | 0.13682 | 0.12578 | 0.13706 | 0.02663 | 0.02978 | 0.12651 | 0.13706 |
| soviet | 0.15002 | 0.99799 | 0.99799 | 0.99799 | 0.94012 | 0.12062 | 0.1009 | 0.99799 | 0.1283 | 0.12954 | 0.12878 | 0.11492 | 0.13066 | 0.08604 | 0.1206 | 0.12129 | 0.1014 | 0.12584 | 0.13682 | 0.99799 | 0.8994 | 0.99799 | 0.17223 | 0.17272 | 0.92139 | 0.99799 |
| contig | 0.13717 | 0.9014 | 0.9014 | 0.9014 | 0.87986 | 0.11078 | 0.0932 | 0.9014 | 0.11863 | 0.11935 | 0.11831 | 0.1057 | 0.12008 | 0.07985 | 0.11172 | 0.11174 | 0.09375 | 0.1152 | 0.12578 | 0.8994 | 0.9014 | 0.90139 | 0.16355 | 0.16062 | 0.82739 | 0.9014 |
| eu | 0.15023 | 0.99999 | 0.99999 | 0.99999 | 0.94211 | 0.1209 | 0.10103 | 0.99999 | 0.1285 | 0.12987 | 0.12898 | 0.11512 | 0.13086 | 0.08617 | 0.12081 | 0.12147 | 0.10157 | 0.12605 | 0.13706 | 0.99799 | 0.90139 | 0.99999 | 0.17238 | 0.17303 | 0.92336 | 0.99999 |
| eu_fta | 0.03177 | 0.17239 | 0.17239 | 0.17239 | 0.16811 | 0.02192 | 0.01913 | 0.17239 | 0.0244 | 0.02441 | 0.02372 | 0.02225 | 0.02412 | 0.01785 | 0.02327 | 0.02357 | 0.01935 | 0.02383 | 0.02663 | 0.17223 | 0.16355 | 0.17238 | 0.17239 | 0.03207 | 0.09746 | 0.17239 |
| euro_z | 0.03158 | 0.17304 | 0.17304 | 0.17304 | 0.16473 | 0.02246 | 0.02212 | 0.17304 | 0.0281 | 0.02888 | 0.02414 | 0.02358 | 0.02865 | 0.0186 | 0.02834 | 0.03211 | 0.02086 | 0.02899 | 0.02978 | 0.17272 | 0.16062 | 0.17303 | 0.03207 | 0.17304 | 0.16197 | 0.17304 |
| efta | 0.13721 | 0.92337 | 0.92337 | 0.92337 | 0.86612 | 0.11203 | 0.09348 | 0.92337 | 0.11862 | 0.12023 | 0.11941 | 0.10658 | 0.12077 | 0.07908 | 0.11146 | 0.11213 | 0.09396 | 0.11675 | 0.12651 | 0.92139 | 0.82739 | 0.92336 | 0.09746 | 0.16197 | 0.92337 | 0.92337 |
| offshore | 0.15023 | 1 | 1 | 1 | 0.94212 | 0.1209 | 0.10104 | 1 | 0.1285 | 0.12987 | 0.12898 | 0.11512 | 0.13086 | 0.08617 | 0.12081 | 0.12148 | 0.10158 | 0.12605 | 0.13706 | 0.99799 | 0.9014 | 0.99999 | 0.17239 | 0.17304 | 0.92337 | 1 |
References
- Pacific Exchange Rate Service. Available online: https://fx.sauder.ubc.ca/ (accessed on 10 December 2020).
- Bank of Czech Republic. 2020. Foreign Direct Investment Statistics: 2019 (EUR Million). Available online: https://www.cnb.cz/export/sites/cnb/en/statistics/bop_stat/bop_publications/pzi_books/PZI_2019_EN.pdf (accessed on 10 December 2020).
- Bank of Estonia. 2020. Direct Investment Position in Estonia and Abroad by Country (EUR Million). Available online: https://statistika.eestipank.ee/#/en/p/146/r/2293/2122 (accessed on 10 December 2020).
- Bank of Latvia. 2020. Direct Investment Position in Latvia (EUR Million). Available online: https://statdb.bank.lv/lb/Data.aspx?id=128 (accessed on 10 December 2020).
- Bank of Lithuania. 2020. Foreign Direct Investment by Country (EUR Million). Available online: https://www.lb.lt/en/inward-foreign-direct-investment-by-country-1 (accessed on 10 December 2020).
- Bank of Poland. 2020. Foreign Direct Investment in Poland. Available online: https://www.nbp.pl/homen.aspx?f=/en/publikacje/ziben/ziben.html (accessed on 10 December 2020).
- Barbieri, Maria Maddalena, and James O. Berger. 2004. Optimal predictive model selection. The Annals of Statistics 32: 870–97. [Google Scholar] [CrossRef]
- Bayarri, Maria J., James O. Berger, Anabel Forte, and Gonzalo García-Donato. 2012. Criteria for Bayesian model choice with application to variable selection. The Annals of Statistics 40: 1550–77. [Google Scholar] [CrossRef]
- Beck, Krzysztof. 2021. Capital mobility and the synchronization of business cycles: Evidence from the European Union. Review of International Economics. [Google Scholar] [CrossRef]
- Bergstrand, Jeffrey H., and Peter Egger. 2007. A knowledge and physical capital model of international trade flows, foreign direct investment and multinational enterprises. Journal of International Economics 73: 278–308. [Google Scholar] [CrossRef]
- Blonigen, Bruce A., and Jeremy Piger. 2014. Determinants of foreign direct investment. Canadian Journal of Economics/Revue Canadienne D’économique 47: 775–812. [Google Scholar] [CrossRef]
- Borsos, Julianna. 1997. Foreign Direct Investment and Technology Transfer. Results of a Survey in Selected Branches in Estonia (No. 580). ETLA Discussion Papers. Helsinki: ETLA Economic Research. [Google Scholar]
- Borsos, Julianna, and Mika Erkkilä. 2002. Regional Integration in the Baltic Rim-FDI and Trade-Based Integration in the Triangle of Finland, Estonia and St. Petersburg (No. 539). ETLA Discussion Papers. Helsinki: ETLA Economic Research. [Google Scholar]
- Camarero, Mariam, Laura Montolio, and Cecilio Tamarit. 2019. What drives German foreign direct investment? New evidence using Bayesian statistical techniques. Economic Modelling 83: 326–45. [Google Scholar] [CrossRef]
- Camarero, Mariam, Sergi Moliner, and Cecilio Tamarit. 2021. Japan’s FDI drivers in a time of financial uncertainty. New evidence based on Bayesian Model Averaging. Japan and the World Economy 57: 101058. [Google Scholar] [CrossRef]
- Caves, Richard E. 2007. Multinational Enterprise and Economic Analysis, 2nd ed. Cambridge: Cambridge University Press. [Google Scholar]
- Cicak, Kresimir, and Petar Soric. 2015. The interrelationship of FDI and GDP in European transition countries. International Journal of Management Science and Business Administration 1: 41–58. [Google Scholar] [CrossRef]
- Cieślik, Andrzej. 2019. Determinants of foreign direct investment from EU-15 countries in Poland. Central European Economic Journal 6: 39–52. [Google Scholar] [CrossRef]
- Damgaard, Jannick, Thomas Elkjaer, and Niels Johannesen. 2019. What Is Real and What Is not in the Global FDI Network? IMF Working Paper WP/19/274. Washington, DC: International Monetary Fund. [Google Scholar]
- Davies, Ronald B., and James R. Markusen. 2020. The Structure of Multinational Firms’ International Activities. NBER Working Paper 26827. Cambridge: National Bureau of Economic Research. [Google Scholar]
- Ehrlich, Laura, Ulo Kaasik, and Anu Randveer. 2002. The Impact of Scandinavian Economies on Estonia via Foreign Trade and Direct Investments (No. 2002-4). Tallinn: Bank of Estonia. [Google Scholar]
- Eicher, S. Theo, Helfman Lindy, and Lenkoski Alex. 2012. Robust FDI determinants: Bayesian model averaging in the presence of selection bias. Journal of Macroeconomics 34: 637–51. [Google Scholar] [CrossRef]
- European Commission. 2020. Negotiations and Agreements. Available online: https://ec.europa.eu/trade/policy/countries-and-regions/negotiations-and-agreements/index_en.htm#_europe (accessed on 15 December 2020).
- Feenstra, Robert C., Robert Inklaar, and Marcel P. Timmer. 2015. The Next Generation of the Penn World Table. American Economic Review 105: 3150–82. [Google Scholar] [CrossRef]
- Forte, Anabel, Gonzalo Garcia-Donato, and Mark Steel. 2018. Methods and tools for Bayesian variable selection and model averaging in normal linear regression. International Statistical Review 86: 237–58. [Google Scholar] [CrossRef]
- Garcia-Donato, Gonzalo, and Miguel A. Martinez-Beneito. 2013. On sampling strategies in Bayesian variable selection problems with large model spaces. Journal of the American Statistical Association 108: 340–52. [Google Scholar] [CrossRef]
- Güngör, Hakan, and Ayla Ogus Binatli. 2010. The Effect of European Accession Prospects on Foreign Direct Investment Flows. Working Papers in Economics (No. 10/06). Izmir: Izmir University of Economics. [Google Scholar]
- Gygli, Savina, Florian Haelg, Niklas Potrafke, and Jan-Egbert Sturm. 2018. The KOF Globalization Index-Revisited. Munich: Center for Economic Studies and Ifo Institute. [Google Scholar] [CrossRef]
- Helpman, Elhanan. 1984. A simple theory of international trade with multinational corporations. Journal of Political Economy 92: 451–71. [Google Scholar] [CrossRef]
- Helpman, Elhanan, and Paul R. Krugman. 1985. Market Structure and Foreign Trade: Increasing Returns, Imperfect Competition, and the International Economy. Cambridge: MIT Press. [Google Scholar]
- Heritage Foundation. 2020. Index of Economic Freedom. Available online: https://www.heritage.org/index/ (accessed on 17 December 2020).
- Hunya, Gabor. 2004. FDI in Small Countries: The Baltic States. WIIW Research Report No. 307. Vienna: Vienna Institute for International Economic Studies. [Google Scholar]
- International Monetary Fund. 2019. Glossary of Foreign Direct Investment Terms. Available online: https://www.imf.org/external/np/sta/di/glossary (accessed on 1 December 2020).
- Irandoust, Manuchehr. 2016. Structural changes, FDI, and economic growth: Evidence from the Baltic States. Journal of Economic Structures 5: 14. [Google Scholar] [CrossRef]
- Kotilainen, Markku, and Nuutti Nikula. 2010. Why Do Firms Invest in The Baltic Sea Region? ETLA Discussion Papers (No. 1229). Helsinki: ETLA Economic Research. [Google Scholar]
- Krugman, Paul. 1983. The New Theories of International Trade and Multinational Enterprise: In the International Corporation in the 1980s. Edited by David. B. Audretsch and Charles Kindleberger. Cambrige: MIT Press. [Google Scholar]
- Ley, Eduardo, and Mark F. J. Steel. 2007. Jointness in Bayesian variable selection with applications to growth regression. Journal of Macroeconomics 29: 476–93. [Google Scholar] [CrossRef]
- Markusen, James R. 1984. Multinationals, multi-plant economies, and the gains from trade. Journal of International Economics 16: 205–26. [Google Scholar] [CrossRef]
- Markusen, James R. 2002. Multinational Firms and the Theory of International Trade. Cambridge: MIT Press. [Google Scholar]
- Markusen, James R. 2013. Putting per-capita income back into trade theory. Journal of International Economics 90: 255–65. [Google Scholar] [CrossRef]
- Mickiewicz, T., S. Radosevic, and U. Varblane. 2000. The Value of Diversity: Foreign Direct Investment and Employment in Central Europe during Economic Recovery (No. 5). Tartu: Tartu University Press. [Google Scholar]
- Raftery, E. Adrian. 1995. Bayesian model selection in social research. Sociological Methodology, 111–63. [Google Scholar] [CrossRef]
- Reiljan, Janno, Ele Reiljan, and Kairi Andresson. 2001. Attractiveness of central and Eastern European countries for foreign direct investment in the context of European integration: The case of Estonia. In 41st ERSA Congress, Zagreb. Louvain-la-Neuve: European RegionalScience Association (ERSA). [Google Scholar]
- Sala-i-Martin, Xavier, Gernot Doppelhofer, and Ronald I. Miller. 2004. Determinants of long-term growth: A Bayesian averaging of classical estimates (BACE) approach. American Economic Review 94: 813–35. [Google Scholar] [CrossRef]
- Scott, James G., and James O. Berger. 2006. An exploration of aspects of Bayesian multiple testing. Journal of Statistical Planning and Inference 136: 2144–62. [Google Scholar] [CrossRef]
- Simionescu, Mihaela. 2018. What drives economic growth in some CEE countries? Studia Universitatis Vasile Goldis Arad–Economics Series 28: 46–56. [Google Scholar] [CrossRef]
- The World Bank. 2020. The Worldwide Governance Indicators. Available online: https://info.worldbank.org/governance/wgi/ (accessed on 10 December 2020).
- Titarenko, Deniss. 2006. The influence of foreign direct investment on domestic investment processes in Latvia. Transport and Telecommunication 7: 76–83. [Google Scholar]
- Vahter, Priit. 2004. The effect of foreign direct investment on labor productivity: Evidence from Estonia and Slovenia. In University of Tartu Economics and Business Administration Working Paper (32-2004). Tartu: Tartu University Press. [Google Scholar]


Publisher’s Note: MDPI stays neutral with regard to jurisdictional claims in published maps and institutional affiliations. |
© 2021 by the authors. Licensee MDPI, Basel, Switzerland. This article is an open access article distributed under the terms and conditions of the Creative Commons Attribution (CC BY) license (https://creativecommons.org/licenses/by/4.0/).
Share and Cite
Cieślik, A.; Gurshev, O. Factor Endowments, Economic Integration, Round-Tripping, and Inward FDI: Evidence from the Baltic Economies. J. Risk Financial Manag. 2021, 14, 348. https://doi.org/10.3390/jrfm14080348
Cieślik A, Gurshev O. Factor Endowments, Economic Integration, Round-Tripping, and Inward FDI: Evidence from the Baltic Economies. Journal of Risk and Financial Management. 2021; 14(8):348. https://doi.org/10.3390/jrfm14080348
Chicago/Turabian StyleCieślik, Andrzej, and Oleg Gurshev. 2021. "Factor Endowments, Economic Integration, Round-Tripping, and Inward FDI: Evidence from the Baltic Economies" Journal of Risk and Financial Management 14, no. 8: 348. https://doi.org/10.3390/jrfm14080348
APA StyleCieślik, A., & Gurshev, O. (2021). Factor Endowments, Economic Integration, Round-Tripping, and Inward FDI: Evidence from the Baltic Economies. Journal of Risk and Financial Management, 14(8), 348. https://doi.org/10.3390/jrfm14080348