1. Introduction
The divergence between interest rates across countries, predominantly between developed and developing economies, has created an environment in which investors consider arbitrage strategies in order to earn risk-free profits. One of these strategies is the currency carry trade, which involves borrowing in a relatively low interest rate currency, in order to invest in a high interest rate currency. It is important to note that currency carry trade is a popular investment strategy prompted by the return-seeking nature of investors amid interest rate differentials across economies. The underlying principle behind the strategy is that investors borrow funds in a relatively lower interest rate currency and invest the borrowed funds in a currency with a relatively higher interest rate. The carry trade strategy’s profitability is essentially dependent on violating the Uncovered Interest Rate Parity (UIP) theory, which posits that any profits presented by the interest rate differential should be offset by subsequent movements in the exchange rate. Given that the uncovered interest rate parity determines the equilibrium exchange rate between currencies, its violation ultimately provides the possibility of arbitrage, occasioned by the currency’s carry trade strategy.
The currency carry trade strategy necessitates a funding currency—ideally a currency with a low interest rate; and an investment currency—one with a relatively higher interest rate. Japan’s yen (yen) and the U.S. dollar (dollar), in particular, have been attractive funding currencies as a result of their respective economies’ low interest rates, their relatively stable values in comparison to most currencies, and their liquidity (
Habib and Stracca 2012).
The rationale behind carry trade strategies supports the notion that positive returns are predominantly driven by investors’ appetite for risks, particularly in taking long positions in currencies that are relatively much riskier in order to realise high returns as compensation for the risk taken. It is in that context that emerging markets’ currencies are often the preferred targets for carry trade operations and that safe haven currencies, such as the dollar or yen, are the funding currencies (see
Gilmore and Hayashi 2012;
Hossfeld and MacDonald 2015).
While a carry trade operation often involves derivative markets, in that investors short the safe haven currencies and long the riskier currency,
Morema and Bonga-Bonga (
2020) show that the operation may also involve the deployment of the borrowed funds into assets such as stocks, bonds, commodities, or real estate that are denominated in the risky currency. As such, it may be expected that the inherent risk related to carry trade operations may transmit to asset markets due to the unwinding of currency carry trade. Unfortunately, no study has ever assessed the extent of risk transmission from the carry trade market to asset markets that are denominated in risky currencies by distinguishing the effects between the equity and bond markets.
Very few studies have assessed the relationship between the carry trade and asset markets. For example,
Christiansen et al. (
2011) explain the performance of the currency carry trade by making use of an asset pricing model and regime switching model. The authors find that carry trade market is mean reverting in regimes of high foreign exchange volatility and has much higher exposure to the stock market.
Liu and Yang (
2017) use a conditional value-at-risk (CoVaR) model to show that there is systemic contagion between carry trade strategies and stock markets in the U.S., European, and Asia-Pacific regions. Such a contagion was particularly considerable during the 2000–2001 dot-com bubble and 2007–2009 U.S. credit crisis.
Lee and Chang (
2013) find that there is a positive relationship between currency carry trade returns and investor sentiment, and, as a result, developments in the currency carry trade market can spill over into other asset markets.
Huang and Wu (
2021) assess asymmetric dependence and its dynamics across returns to carry trade, stock, and bond markets by making use of a copula-based model. The authors find that there was a significant increase in carry trade-stock dependence and substantially negative carry trade-bond and stock-bond during the 2007–2008 global financial crisis. Moreover, the authors evaluate the out-of-sample predictability of dependence in the context of asset-allocation strategies and find that risk-averse investors obtain substantial economic values by incorporating asymmetry and dynamics into dependence timing, especially during crisis periods. These findings provide new implications for asset-allocation strategies and risk management during turbulent market phases.
Schulze (
2021) investigates the unifying risk-based explanation of currency returns and stock returns when countries’ interest rate differential plays a leading part in the carry-trade performance. In doing so, the author addresses carry-trade returns from a risk-pricing perspective and examines if these returns can be connected to cross-country differences in risk pricing in the interest-rate market compared to the stock market. The results of the study indicate significant and persistent cross-country differences in risk aversion in the interest-rate market compared to the implied risk aversion in the stock market.
Filipozzi and Harkmann (
2020) investigate the efficiency of different hedging strategies for an investor holding a portfolio of foreign currency bonds by comparing the strategies of no hedge with those of fully hedged. The authors make use of the ordinary least squares (OLS) approach and the optimal hedge ratios to this end. The results of the study show that sophisticated hedging strategies are found to be superior to the simple strategies because they lower the portfolio risk in domestic currency terms and improve the Sharpe ratios for multi-asset portfolios. The results also show that dynamic hedging strategies implies holding a limited carry trade position by being long in high-yielding currencies but short in low-yielding currencies. Furthermore, carry trades are shown to be part of an optimal portfolio.
However, none of these studies distinguish between the equity and bond markets in assessing the cross-transmission between carry trade and asset markets. Such a distinction is necessary, as it may provide an insight on the extent of volatility transmission or contagion between the carry trade and asset markets, distinguishing between equity and bond markets. Thus, the contribution of this paper is twofold; firstly, the paper assesses the extent of volatility spillover between the carry trade and asset markets in South Africa, as a representative of an emerging economy in Africa, by distinguishing between the equity and bond markets. Secondly, the paper will evaluate the dynamic correlation between the carry trade payoffs (returns) and the asset market returns in South Africa. Such an evaluation is important as it allows us to assess how major economic and financial events, such as the global financial crisis, have affected the co-movement between the carry trade and asset markets. The paper will attempt to answer the following two research questions: What is the extent of risk transmission or volatility spillover between the carry trade market and asset markets, distinguishing between equity and bond markets? What is the trend of the dynamic correlation between carry trade returns and asset market returns in South Africa?
In order to assess the extent of the cross transmission of risks between currency carry trade and asset markets, bond and equity markets, this paper uses a family of multivariate GARCH models, especially the VAR-BEKK GARCH model. Moreover, the paper assesses the extent of the dynamic correlation between carry trade payoffs and asset returns by using a multivariate DCC GARCH model.
This is an important study in the context of an emerging market such as South Africa, as it provides insight on assessing the exposure of domestic financial markets to external speculative decisions. The cross-market linkages, if any, will help to uncover which of the asset markets, between the bond and equity markets, are mostly connected to currency carry trade activities, especially in terms of volatility spillovers or risk transmission.
It is important to note that the Johannesburg stock exchange (JSE) is the only stock market in South Africa. It is the largest and most developed stock market in Africa and the 16th largest in the world with equity market capitalisation of 881.61 billion U.S. dollar in 2018 and 372 listed companies in the same year. The bond market in South Africa was managed by The Bond Exchange of South Africa (BESA) until 2007, when it resolved to demutualise in order to grow its business and expand into other markets. It was then acquired by the JSE in 2009. In addition to the equity market, the JSE oversees the largest listed debt market in Africa, both by market capitalisation and by liquidity. The South African’s debt market capitalisation was 200.29 billion in 2018 (see
Atenga and Mougoué forthcoming).
The steady interest rate in South Africa, combined with expansionary fiscal and monetary policies in the United States and Europe, contributed to the attractiveness of currency carry trade in South Africa, providing considerable returns for investors against near-zero rates in developed countries.
The remainder of this paper is divided as follows:
Section 2 outlines the methodologies used in the paper.
Section 3 presents the data.
Section 4 summarises the estimation of the model and interpretation of the results, and
Section 5 concludes the paper.
2. Methodology
The paper employs a VAR- BEKK-GARCH model to assess the extent of cross-transmission of volatility shocks between currency carry trade and equity or bond market in South Africa. It is important to note that the conditional mean equations were estimated using a VAR model, with one lag determined according the Akaike Information Criteria (AIC). The conditional variances are estimated from the BEKK-GARCH model. Four bivariate models are estimated, each combining U.S. dollar- or yen-funded carry trade with either the equity or bond market. The conditional mean and volatility equations are expressed as follows:
where
is a two-dimensional vector and
coefficients. The error
is heteroscedastic with a mean of zero and variance
.
The equation of the covariance matrix for a bivariate model is as follows:
where
are elements of matrices and
are elements of matrices
.
The diagonal parameters in matrices capture the effects of volatility shocks to k on j conditional volatility. For example, the coefficient shows how volatility shocks to variable two affect variable one’s conditional volatility. The coefficient captures the spillover effect. The parameter d shows the asymmetric behaviour of volatility shocks.
The covariance matrices, as in Equation (2), are estimated by maximising the following Quasi-Maximum Likelihood method:
where the total number of used observations is represented by
T;
m represents the number of equations;
H represents the covariance matrix; and the function is completed by the model-determined unknown parameters, as represented by vector ∅.
In order to estimate the conditional correlation of each pair, carry trade and asset returns, the paper makes use of the VAR-DCC-GARCH model. The estimation of the VAR-DCC GARCH model is divided into three stages. In the first stage, a vector autoregressive (VAR) model is estimated, as in Equation (1). The second stage uses the residuals obtained from Equation 1 in the first stage to input them into the univariate conditional variance model specified for each carry trade and asset return. To account for asset market asymmetry, we use the Glosten, Jagannathan, and Runkle (GJR) (1993) GARCH model, especially for the asset market returns. The GJR GARCH (1,1) model is represented as follows:
where
ω denotes the long-term conditional variance, and
α represents the lag coefficient.
is an indicator variable. It takes the value of 1 when
, and zero otherwise. Thus, the impact of
on
is
for negative shocks and only
for positive shocks.
The last stage in a DCC GARCH model consists of determining the time-variant conditional correlation matrix from the conditional variance expressed as the following:
where
is the diagonal matrix of conditional variances such as
= diag
.
Rt is a positive definite N × N correlation matrix and defined as follows:
where
a,
b > 0 and
.
is a scalar for constant conditional correlation in that
R =
if
a =
b = 0.
is expressed as follows:
and
.
The likelihood function of the DCC GARCH model is represented as follows:
3. Data
It is worth noting that the paper assesses the extent of volatility or risk spillover between each currency carry trade return (from rand/dollar and rand/yen positions) and asset market returns (equity and bond) in South Africa, looking particularly at the cross-transmission of shocks between the currency carry trade and the two asset markets. Moreover, the paper analyses the extent of the dynamic correlation or co-movement between each carry trade position and the two asset markets to infer the possibility of arbitrage opportunity in the carry trade market. Arbitrage opportunity in the two currency carry trade markets will imply that returns or profits are different in the two markets. Otherwise, returns will equalise in the two markets and the dynamic correlation between each currency carry trade and asset returns will be synchronised.
Carry trade payoffs for each currency pair
were obtained from the UIP relationship, as the difference between the change in the exchange rate and the interest rate differential, as follows:
where
represents the change in the rand/dollar and rand/yen exchange rates,
represents the periodic weekly short-term interest rate in South Africa, and
represents the short-term interest rate in the U.S. or Japan.
The 10-year government bond yield was used to represent the fixed income market, and the choice of using a benchmark 10-year government bond yield was based on the liquidity of this debt capital market instrument. Whilst it can be argued that speculative investors would opt to invest in assets with a short maturity to align to their investment strategy, the choice of a 10-year government bond was informed by its liquidity and the possibility for investors to close out positions at any time in order to cash out possible windfalls.
Equity returns in South Africa are computed from the JSE All-Share index. Returns for the fixed income market are calculated by the change in the bond yields, considering the negative relationship between the yield and bond prices. The data were collected from Bloomberg’s terminal and Thomson Reuters, with a weekly frequency for the period from January 2000 to December 2017. The sample data cover important financial and economic crises, such as the 2000 dot-com crisis, the 2008 global financial crises, and the 2009 European debt crisis. The currency carry trade pairs were used in this study, with a short position taken in the developed markets (the funding currencies were the yen and the dollar) and a long position taken in South Africa.
All data were tested for stationarity using the Augmented Dickey–Fuller test for unit root, and all series were stationary. The results of the stationarity test are presented in the appendix.
Table 1 hereunder presents the descriptive statistics for all the returns from the different asset classes, namely the equity market returns, the bond market returns, the dollar-funded carry trade returns, and the yen-funded carry trade returns.
The values of the means, which indicate the average weekly returns over the period under study, indicate that all the series had positive returns, with the JSE (
rJSE) yielding larger average returns than those from the carry trade (
rCT/dollar and
rCT/yen) and bond (
rBond) markets. As can be expected from the empirical literature (see
Ghysels et al. 2005;
Bali and Peng 2006;
Lundblad 2007), the mean and standard deviation values evidence the positive risk-return relationship. Whilst the bond market averages a weekly return of 0.0022 per cent, the associated standard deviation of 0.16 is substantially lower than the other returns series. The more pronounced standard deviations for the equity and currency carry trade returns indicate that there was much greater volatility in these markets than there was in the bond market, as can be expected. The equity and exchange markets are riskier than the bond market. The statistics reported in
Table 1 support the reality that equities are generally much riskier than bonds.
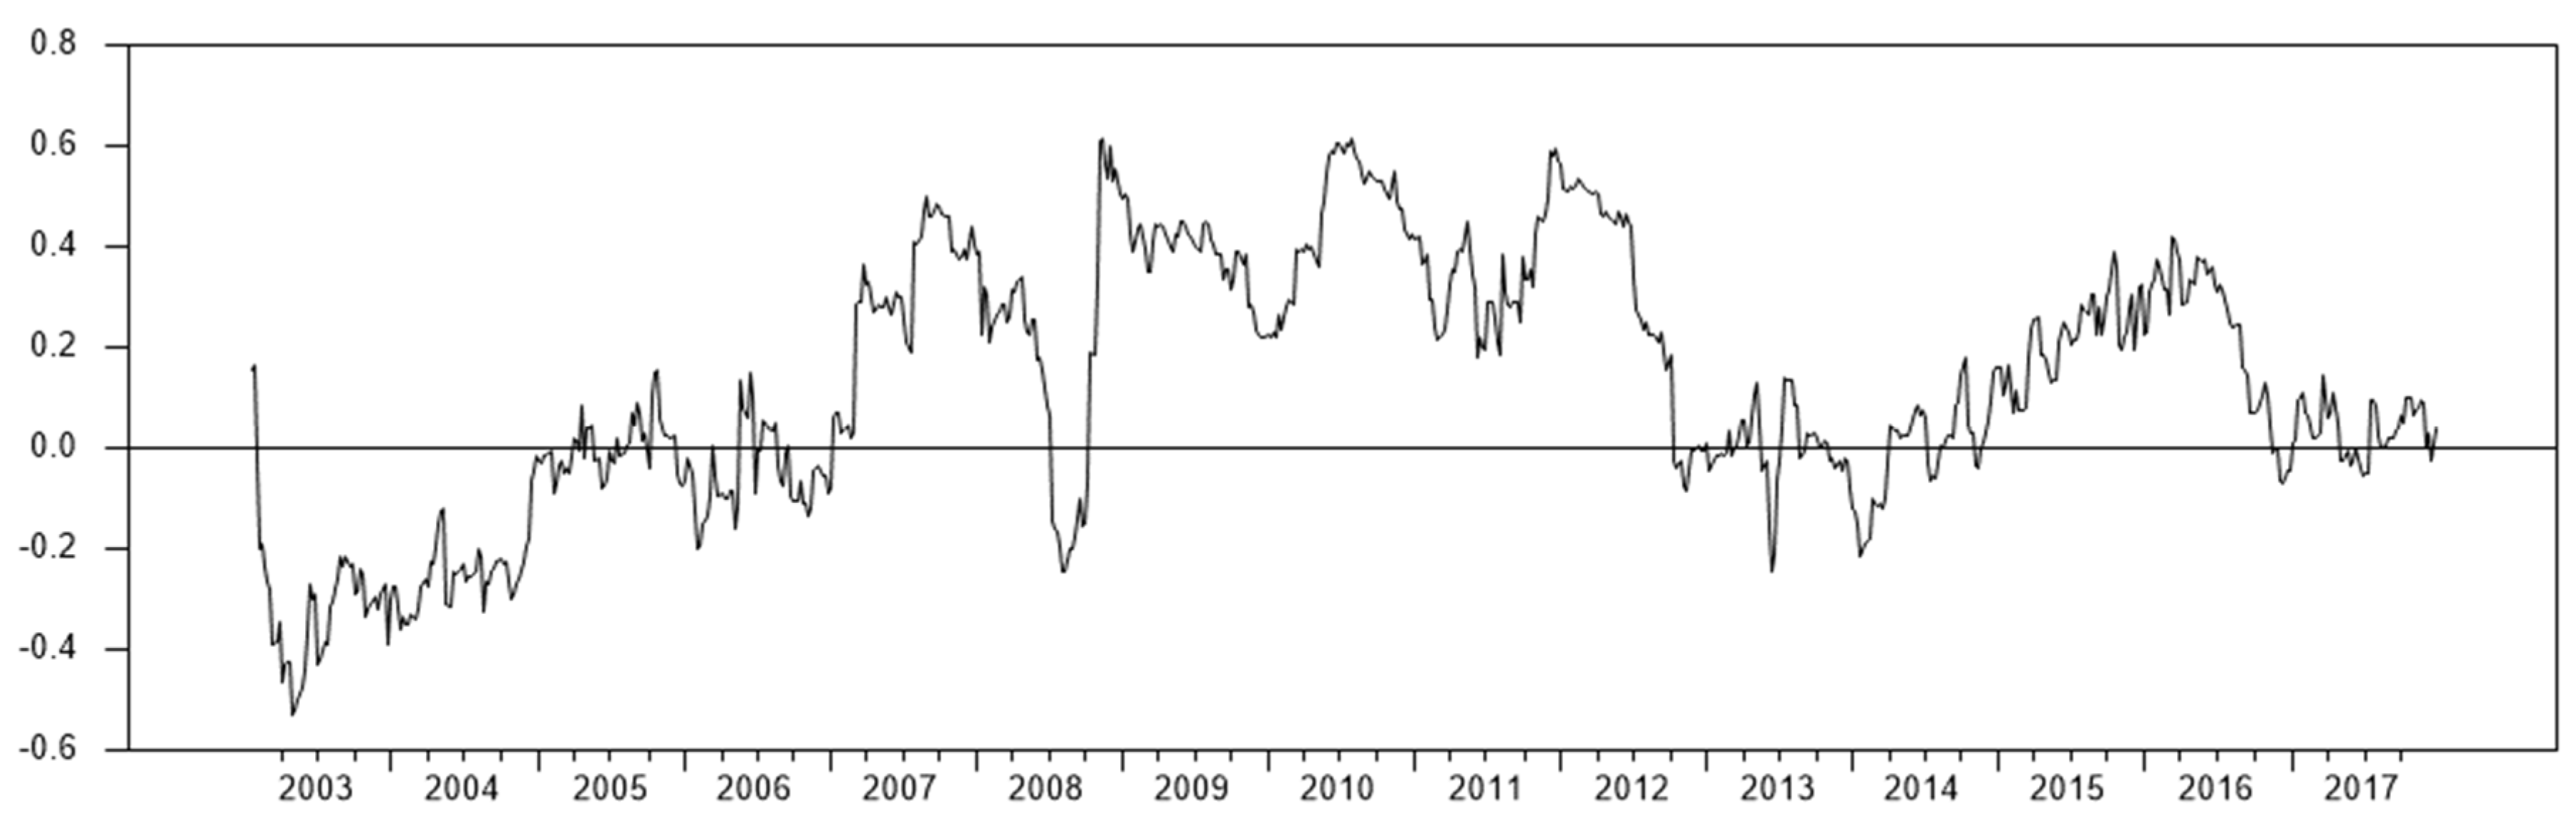
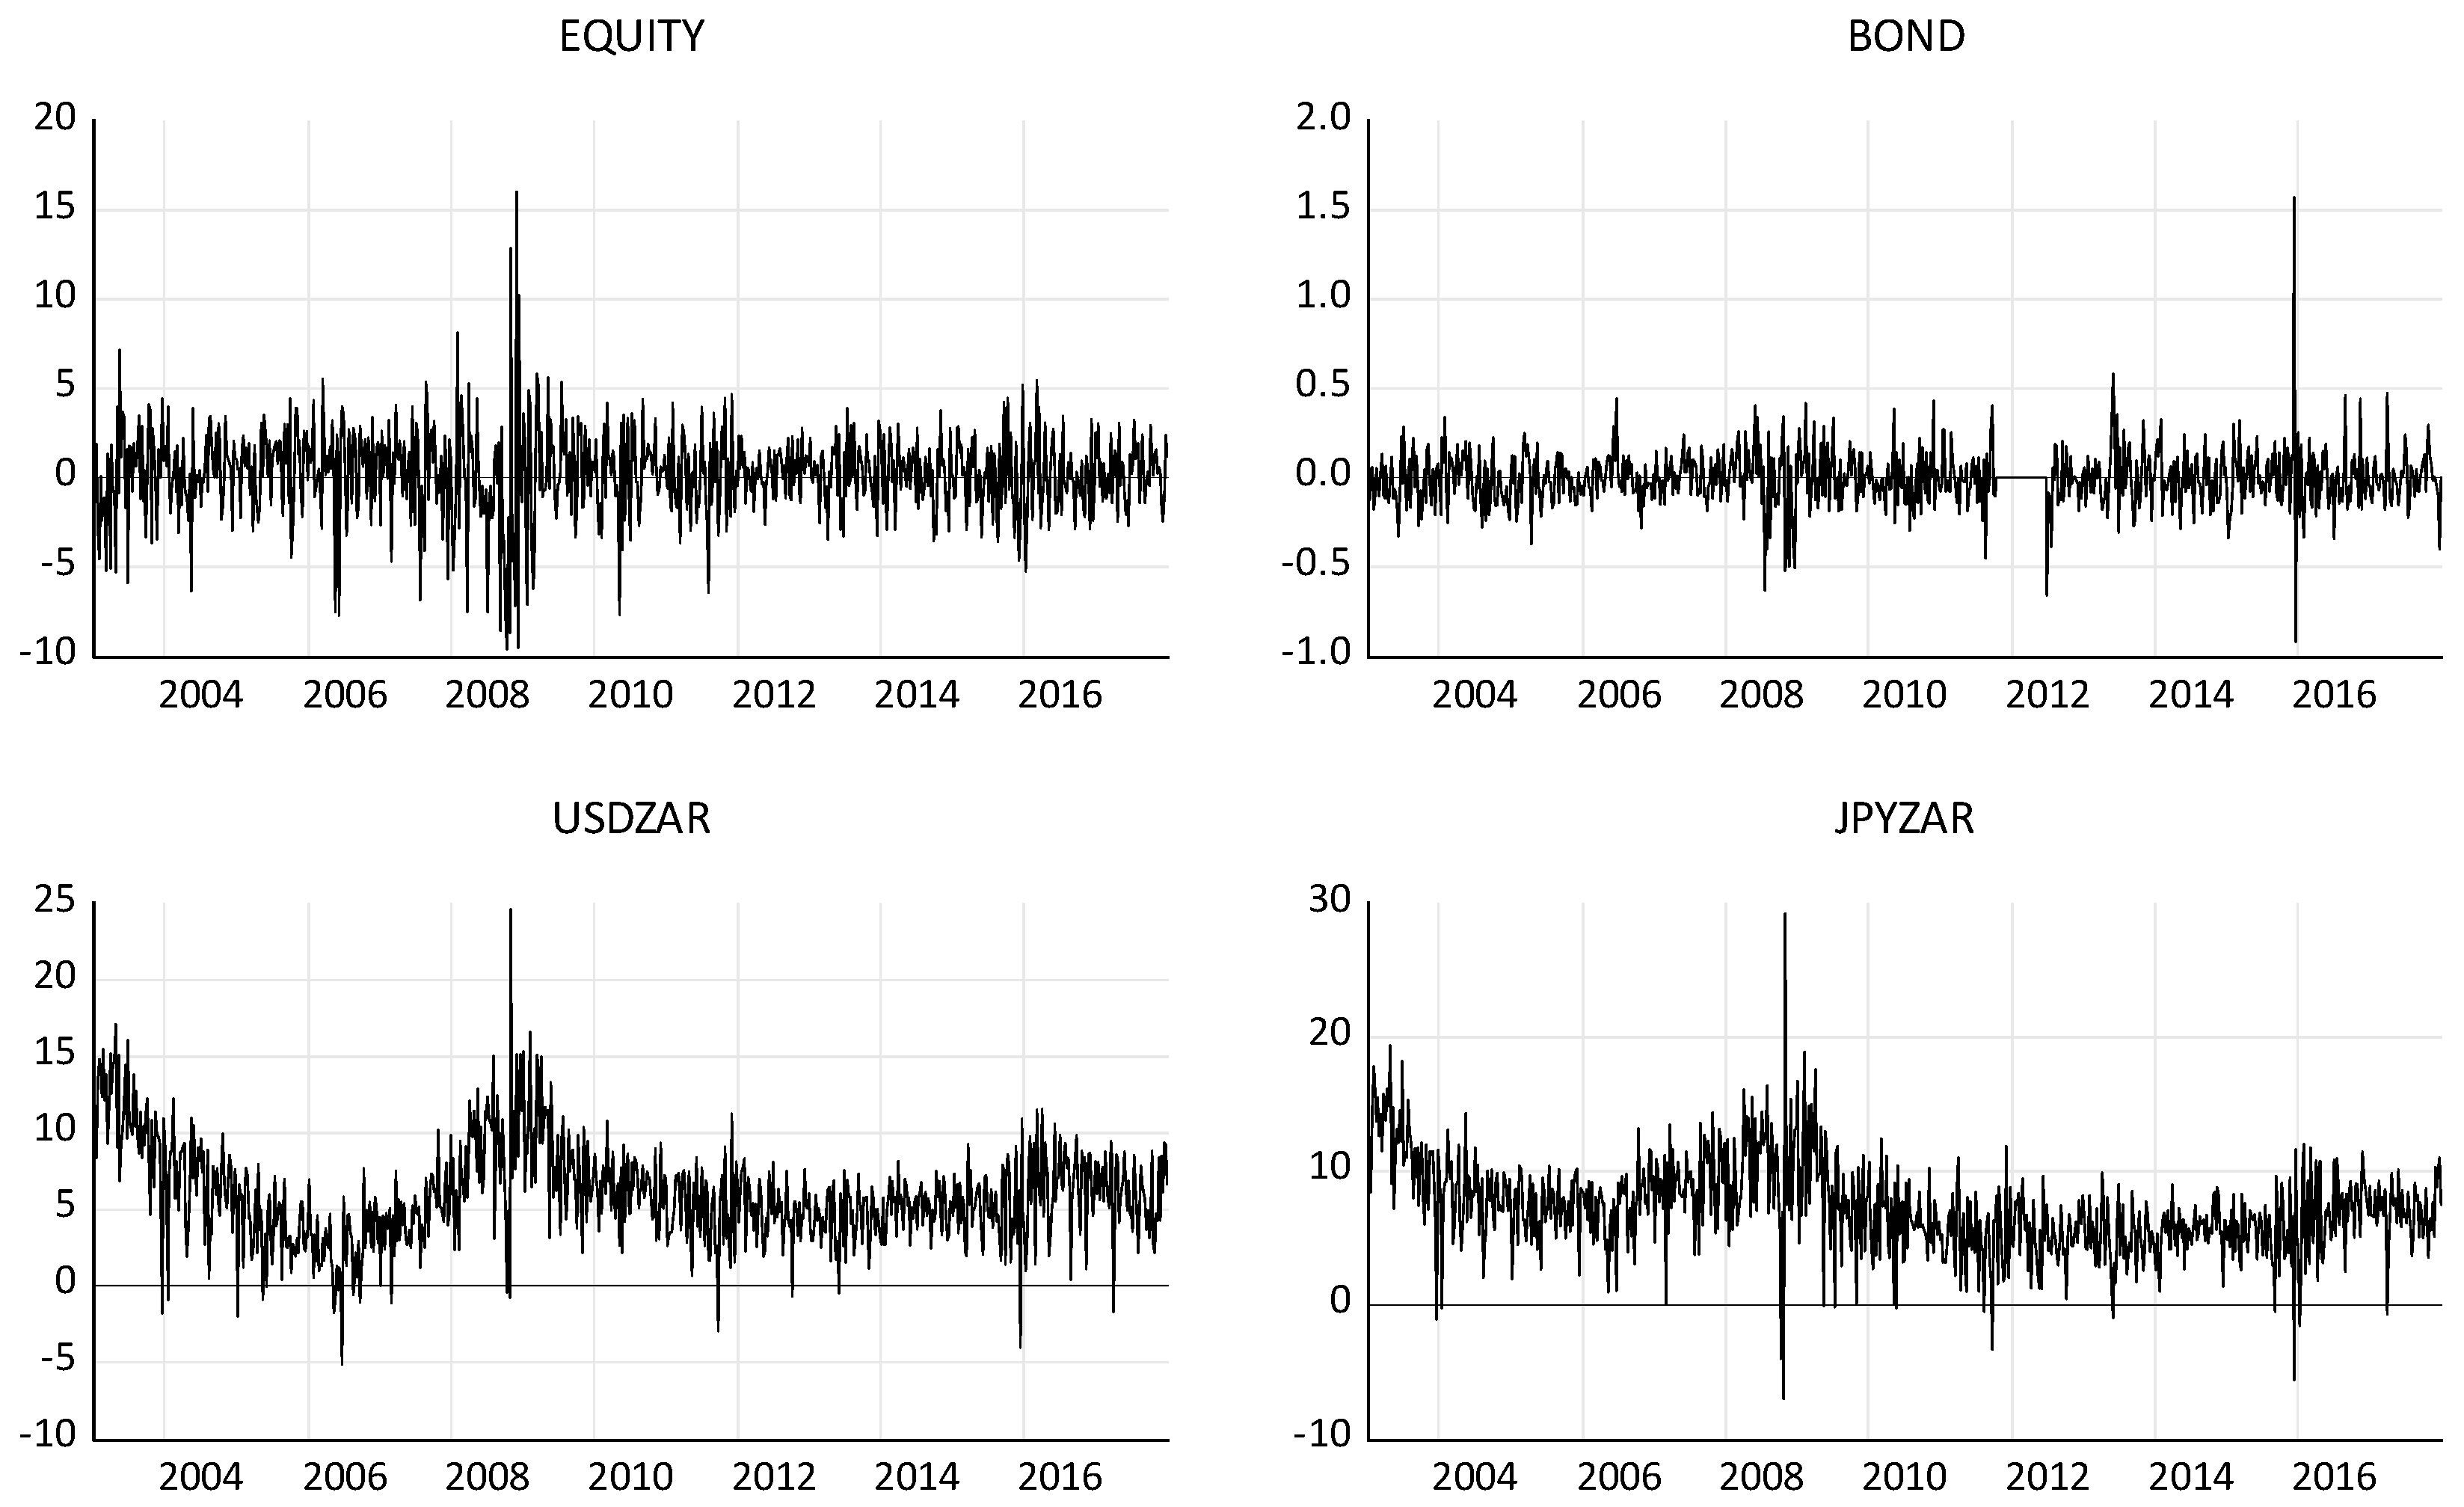
Figure 1 shows that all the series exhibit a great deal of volatility and a synchronised reaction to a number of global and local economic and financial crises. The key events were the 2008 global financial crisis, which is evident in the significant rate of fluctuations in all the returns series, and the December 2015 unanticipated cabinet reshuffle, which also amplified the volatility in the South African financial markets. Both of these events indicated a pronounced systemic risk, in line with the finding that contagion across financial markets is heightened during turbulent times (
Christiansen et al. 2011;
Bonga-Bonga 2018;
Bonga-Bonga and Hoveni 2013).
Another key insight from
Figure 1 is that the carry trade payoffs’ dynamics in the two strategies are greatly synchronised. This could suggest the evidence of the international equalisation of returns between similar financial instruments, triggered by arbitrage activities. Studies show that the integration of financial markets is reflected by the equalisation of the returns of similar financial assets. This is revealed by the co-movement of similar types of financial assets (see
Bonga-Bonga and Mabe 2020;
Bhaduri and Andrew 2009).
The correlations matrix reported in
Table 2 shows how fluctuations in the returns of equity, bond, and currency carry trade markets are correlated. This is a good initial check of possible volatility spillovers, as correlations, regardless of the direction, can either be a result of fluctuations in one market spilling over into another, or because fluctuations in both markets are influenced by common factors. Looking at the correlation coefficients, several interesting insights are uncovered. The first key insight is that all the returns series are positively correlated, providing support for further investigation into possible relationships between the markets. This can either be an indication that returns in both the South African equity and debt capital markets have a positive influence on returns in the currency carry trade market for speculators targeting the rand, or that currency carry traders’ positions influence the equity and bond markets through the speculators’ asset allocation strategies.
The second key insight from
Table 2 is that, relative to the equity market, there is a greater correlation between the bond market returns and the currency carry trade returns, which may be due to the fact that the two variables’ common driver is interest rates. It is important to note that bond prices are an inverse function of the interest rate or yields, while carry trade returns rely on interest rate differentials. Moreover, as stated above, this high correlation may be due to the fact that bond markets, rather than the equity markets, are the preferred investment targets for carry trade strategists due to its lower risk compared to the equity market. Besides the reason related to the high volatility of equity markets, the relatively lower correlation between equity and carry trade could also be due to the unpredictable dependency between the exchange rate and equity returns. For example,
Barr and Kantor (
2002) show that the impact of the rand value (exchange rate) on the JSE (equity market) is not as straightforward, due to hedging strategy-related reasons.
5. Conclusions
This paper assessed the extent of transmission of volatility shocks between the carry trade market returns, by distinguishing between the U.S. dollar- and yen-funded carry trade markets and asset markets, and the equity and bond markets, in South Africa. The rationale of the paper is that the carry trade strategy may involve the deployment of the borrowed funds into assets such as stocks, bonds, commodities, or real estate of the investment country. As such, it may be expected that the inherent risk related to carry trade may transmit to asset markets and vice versa. Moreover, the paper assessed the dynamic correlation between each of the carry trade market returns and the asset markets returns, namely the equity and bond market returns, in South Africa. The findings of the paper show a bivariate risk transmission between the equity market and the carry trade market, especially the U.S. dollar-funded carry trade market. Other studies support this finding; for example,
Boudreault et al. (
2014) show that systemic risk contagions between the carry trade and stock markets are caused by capital flows, which leads to the fluctuation in the foreign exchange market. Univariate risk transmission is found mainly for the case of the bond market. This outcome may be due to the fact that the bond market is a less risky market. Being such, it is difficult for the bond market to become the source of risk transmission compared to the equity market. Previous studies fail to differentiate the risk transmission of bond and equity markets to carry trade markets. This paper shows that the difference is due to the risk nature of each asset market with the equity market being riskier that the bond market.
With regard to the dynamic correlation between the carry trade and asset market returns in South Africa, the paper finds that the corelation between the asset market returns and each of the carry trade market returns increases during important global economic and financial crises. This finding is supported by
Fung et al. (
2013), who show that carry trade and stocks are more correlated when the market condition is volatile. The results of this paper are important for investors and policy makers alike. Investors need to monitor the movement between the two markets in order to know how to time their investment strategy during extreme market conditions. Policymakers in South Africa need to monitor the capital flow triggered by carry trade and set strategies to anticipate any reversal during volatile periods. For further studies, we suggest that other methods for risk transmission, such as network connectedness, be considered. Additionally, we suggest that asset markets be extended to other markets, such as real estate and commodity markets.


