The Impact of the Introduction of Uniform European Collective Action Clauses on European Government Bonds as a Regulatory Result of the European Sovereign Debt Crisis


Abstract
1. Introduction
2. Research Aims
3. Literature Review
4. Empirical Analysis
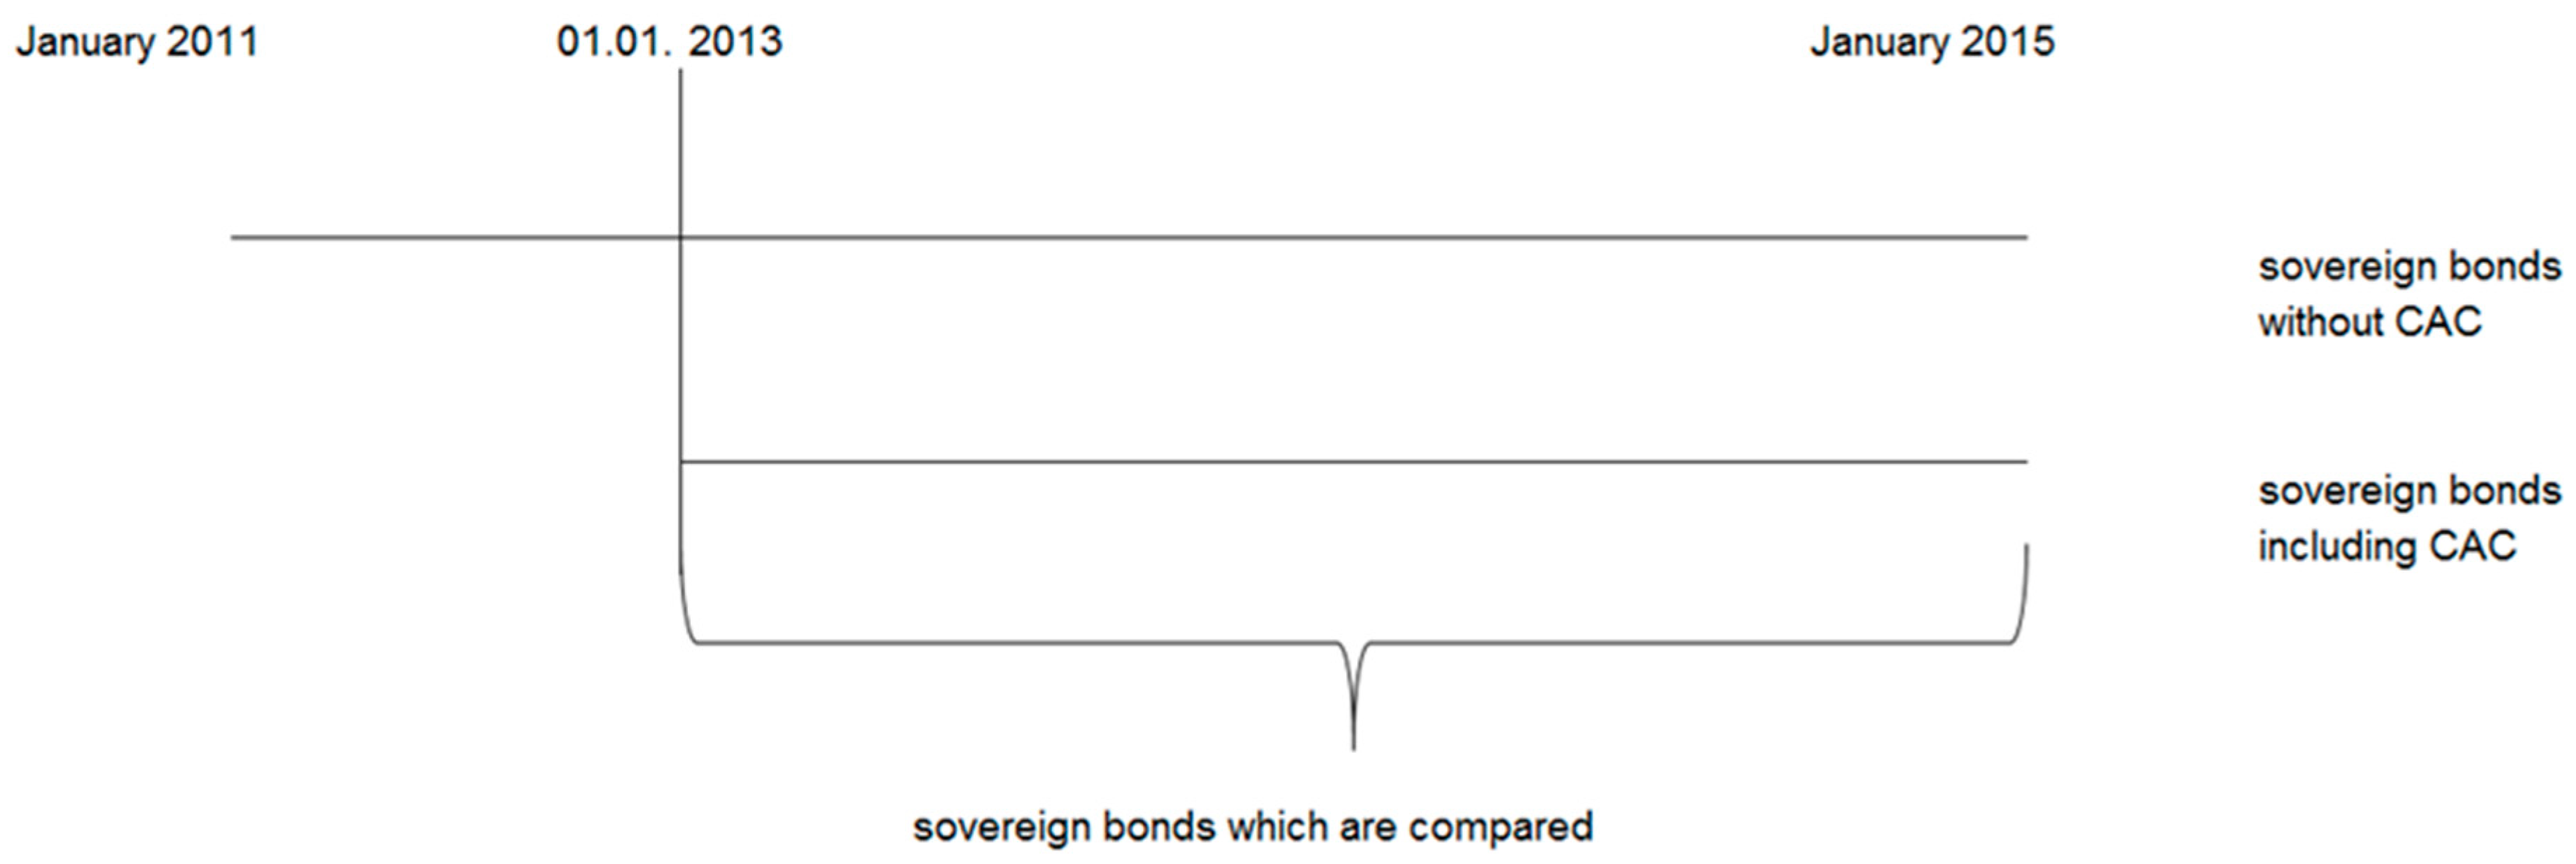
Data and Methodology
- H0 yields5year: there is no relationship between yields, CAC and ratingH1 yields5year: there is a relationship between yields, CAC and rating
- H0 yields10year: there is no relationship between yields, CAC and ratingH1 yields10year: there is a relationship between yields, CAC and rating
- 3.
- H0 CACpremium5years: there is no relationship between CAC premium, result and ratingH1 Cpremium5years: there is a relationship between CAC premium, result and rating
- 4.
- H0 CACpremium10years: there is no relationship between CAC premium, result and ratingH1 CACpremium10years: there is a relationship between CAC premium, result and rating
5. Statistical Results
5.1. CAC Premium
5.2. Descriptive Statistics
5.3. Regression Analysis
5.3.1. Two-Stage Least Squares Regression Analysis on Yields of Five- and Ten-Year Sovereign Bonds
5.3.2. CAC Premium, Test for Multicollinearity, and Regression Analysis
6. Empirical Results
7. Conclusions
Author Contributions
Funding
Conflicts of Interest
Appendix A. Synopsis Table

| Authors | Study | Methodology | Key Findings |
|---|---|---|---|
| Grossman and Van Huyck (1985) | Analyses a reputational equilibrium in a model that interprets sovereign debts as contingent claims that both finance investments and facilitate risk shifting. The paper develops an analysis of sovereign debt that interprets outcomes involving sovereign default as reflecting implicit understandings that a borrower may justifiably adjust its debt servicing obligations if the realized state of the world turns out to be unusually bad for the borrower. | Regression analysis | A key aspect of the analysis is that lenders differentiate excusable default, which is associated with implicitly understood contingencies, from unjustifiable repudiation. The factors that tend to produce a binding lending ceiling include a high time discount rate for the sovereign, low—risk aversion for the sovereign, and a low net return from the sovereign’s investments. The present paper derives the properties of a reputational equilibrium in a model in which sovereign debts serve to share risks to the mutual advantage of borrowers and lenders, as well as to finance investments |
| Eichengreen and Portes (1985) | They analyze the debt crisis of the 1930s to see what light this historical experience sheds on recent difficulties in international capital markets. | Comparing the performance of standard models of foreign borrowing models of debt capacity to the circumstances of the interwar years | They provide the first estimates of the realized rate of return on foreign loans floated between the wars, based on a sample of dollar and sterling bonds issued in the 1920s. |
| Bulow and Rogoff (1989) | Presents a model of the on-going bargaining process that determines repayment levels. | To develop a simple but more realistic model of sovereign default Simple OLS | The ability to credibly threaten more draconian penalties in the event of repudiation may be of no benefit to lenders. Also, unanticipated increases in world interest rates may actually help the borrowers by making lenders more impatient for a negotiated settlement. |
| Atkeson (1991) | To examine the constrained optimal pattern of capital flows between a lender and a borrower in an environment in which there are two impediments to forming contract | Simple OLS | The first impediment to contracting arises from the assumption that lenders cannot observe whether borrowers invest or consume borrowed funds. This assumption leads to a moral hazard problem in investment. The second impediment arises from the assumption that the borrower, as a sovereign nation, may choose to repudiate his debts. |
| Becker et al. (2003) | The study examines the pricing of bonds with and without CACs using data for both primary and secondary market yields | Simple OLS regressions; primary and secondary market data | No evidence is found that the presence of CACs has increased yields for either higher- or lower-rated issuers. |
| Richards and Gugiatti (2003a) | Investigated for a sample period from 1994–2003 how financial markets have priced the use and non-use of CACs in emerging market bonds. | Simple OLS | They find that the use of CACs in Euromarkets issues has not affected the pricing of yields on new bond issues. Moreover, they argue that even after debates of sovereign debt restructuring in 2002 there is no evidence found that CACs do have an economically or statistically significant impact on bond yields. They come to the conclusion that investors do still not focus on whether bonds do include CACs or not and thus might not believe that the inclusion of CACs does have an impact on the pricing of debt. |
| Richards and Gugiatti (2003b) | The study conducted an analysis in order to find evidence of the use of CACs in New York law bonds of sovereign issuers. | Simple OLS regression | With this analysis, the authors find further support for their previous evidence that CACs do not affect bond pricing. They indicate that it is difficult to recognize how CACs have been priced if at the same time investors are not aware of which bonds do contain CACs and which do not. |
| Eichengreen and Mody (2004) | Find more evidence with a study covering a comparison of launch spreads on emerging market bonds which are subject to English law and which do include CACs with launch spreads of bonds subject to United States law and contrary do not include CACs | Simple OLS regression | The study shows that CACs reduce borrowing costs for more creditworthy issuers. Less creditworthy issuers in contrast pay higher spreads when CACs are present in bond contracts. |
| Weinschelbaum and Wynne (2005) | Analyzed how CACs determine the governments’ fiscal incentives, government bond prices and default probabilities in environments with and without contingent debt and the presence of the International Monetary Fund. | Simple OLS | They found that CACs can increase significantly the cost of borrowing for sovereigns which could be seen as an indicator that yields rise due to the presence of CACs in bond contracts. |
| Haldane et al. (2005) | The paper develops a simple theoretical model to analyze recent proposals on restructuring of sovereign bonds. | Simple theoretical model | CACs inserted in bonds resolve the inefficiencies caused by intra-creditor coordination problems providing that all parties have complete information about each other’s preferences. This is no longer the case when the benefits from reaching a restructuring agreement are private information to the debtor and its creditors due to inefficiencies caused by the debtor-creditor bargaining problem. |
| Herman (2007) | To deal deftly with sovereign debt difficulties | Sovereign debt crises are and will continue to be difficult policy problems for the “international community”, reason is the sovereignty of the borrower. | |
| Bernoth and Erdogan (2012) | Study of the determinants of sovereign bond yield spreads across 10 EMU countries between Q1/1999 and Q1/2010. | Semiparametric time-varying coefficient model to identify to what extend an observed change in the yield spread is due to a shift in macroeconomic fundamentals or due to altering risk pricing. | In the beginning of EMU, the government debt level and the general investor’s risk aversion had a significant impact on interest differentials. In the subsequent years, financial markets paid less to the fiscal position of a country. By the end of 2006, financial markets paid again attention to the fiscal position of a country (especially Germany as a safe market). In 2007, the market reaction to fiscal loosening increased considerably. The altering in risk pricing over time confirms the need of time-varying coefficient models in this context. |
| Bradley and Gulati (2013a) | The study addressed the question on what would be the effect of including CACs in all Eurozone sovereign bonds. | Examining the historical relation between CACs and the yields on bonds written under New York and English law | The authors find that CACs are indeed associated with lower rates for sovereigns in the worst financial condition. |
| Poghosyan (2012) | Analysis of the determinants of sovereign bond yields in 22 advanced economies over the 1980–2010 period. | Panel co-integration techniques | Findings in the long-run show an increase in government bond yields. In the short run, sovereign bond yields deviate from the level determined by the long-run fundamentals, but about half of the deviation adjusts in one year. When considering the impact of the global financial crisis on sovereign borrowing costs in EU area countries, the estimations suggest that spreads against Germany in some EU periphery countries exceeded the level determined by fundamentals in the aftermath of the crisis, while some North European countries have benefited from “safe-haven” flows. |
| Ghosal and Thampanishvong (2013) | Question whether improving creditor coordination by strengthening CACs lead to efficiency gains in the functioning of sovereign bond markets. | Model featuring both debtor moral hazard and creditor coordination under incomplete information. | Once the impact of strengthening CACs on debtor’s incentives is taken into account, the authors demonstrate the robust possibility of a conflict between ex ante and interim efficiency. |
| Bradley and Gulati (2013a) | The paper assesses the likely effect of this proposal on the borrowing costs of Eurozone countries. | Second article about the likely effect CACs pose on the borrowing costs of sovereign debtors. | In this article, the authors found as well evidence that CACs leads to a lower cost of capital, especially for below-investment grade bonds. |
| Aguiar and Amador (2013) | The study explores key issues in the economics of sovereign debt. | A benchmark limited-commitment model | The model is used to discuss debt overhang, risk sharing, and capital flows in an environment of limited enforcement. They discuss recent progress on default and renegotiation; self-fulfilling debt crises; and incomplete markets and their quantitative implications. |
| Gelpern and Gulati (2013) | The investigation sheds light on why to promote CACs at all, and cast them in such a central role in the market reform initiative | Interviews with participants in the initiative and those affected by it, as well as observations at policy and academic meetings | The lesson on CACs so far is in the power of seemingly minor private law techniques to shape public markets and institutions, often in non-transparent ways—and in the way contracts are shaped by their public mission. |
| Antonakakis and Vergos (2013) | Examination of sovereign bond yield spread spill overs between Euro zone countries during a period covering the global financial crisis and the Euro zone debt crisis. | VAR-based spill over index approach of Diebold and Yilmaz (2012) and impulse response analysis | Bond yield spread shocks tend to increase future bond yield spreads and are related to news announcements and policy changes Bond yield spreads spill overs between Euro zone countries are highly intertwined. Bond yield spread shocks from the periphery have on average three times the destabilizing force on other countries than shocks coming from the core The within-effect of bond yield spread spill overs is of greater magnitude within the periphery than that within the core. The between-effect of bond yield spread spill overs suggests directional spill overs of greater magnitude from the periphery to the Euro zone core than vice versa. Joint shocks in the periphery and the core reveal decoupling effects between these two groups of countries Overall, the findings highlight the increased vulnerability of the Euro zone from the destabilizing shocks originating mostly from the Euro zone countries in the periphery and to a lesser extent from the Euro zone core. |
| Aristei and Martelli (2014) | Paper investigates the determinants of sovereign bond yield spreads in the Euro area and focusing on the impact of market expectations and behavioural factors. | Using monthly panel data for ten EU countries over the period 2000–2012, the analysis adopts a pooled mean-group approach to estimate non-stationary dynamic models of spreads determinants, allowing for country heterogeneities in short-run dynamics. | The behavioural indicators considered, proxies of consumer and market sentiment and expectations, strongly affect spreads behaviour, especially during the crisis. |
| Werner (2014) | In the paper it is argued that unconventional approaches should also be considered in sovereign debt management, in order to contribute to resolving the EU sovereign debt crisis. | Features of an ideal alternative funding tool are identified | It is found that the funding method can be implemented as part of enhanced public debt management by each nation’s debt management office. |
| Bardozzetti and Dottori (2014) | The study focused on the effect of the adoption of CACs on government bond yields. | Panel data approach and exploit secondary market data on sovereigns quoted in international markets from 2007 to 2010 | They find a U-shaped relation between the effect of CACs and bond yields and the ratings of the governments. Hence, CACs tend to lower yields for middle ratings. When moving to the extremes of ratings, this effect tends to become weaker. They argue that CACs are helpful for ordered restructuring, but also less valuable when the probability of default is very small, hence for less rated issuers, or the moral hazard risk is very high, which is the case for worst rated issuers. |
| Costantini et al. (2014) | Analysis of the determinants of sovereign bond yield spreads in nine economies of the EU Monetary Union. | Panel co-integration approach | Evidence for a level break in the co-integrating relationship is found. Fiscal imbalances are the main long-run drivers of sovereign spreads. Liquidity risks and cumulated inflation differentials have non-negligible weights. All conclusions are ultimately connected to whether or not the sample of countries is composed members of an Optimal Currency Area (OCA). Results are overall driven by countries not passing the OCA test and that investors closely monitor and severely punish the deterioration of expected debt positions of those economies exhibiting significant gaps in competitiveness. |
| Silvapulle et al. (2016) | The paper investigates the contagion effects in the daily bond yield spreads, relative to Germany, of five peripheral EU countries (Portugal, Italy, Ireland, Greece, and Spain) as a consequence of the Euro debt crisis. | Robust semiparametric copula method and the authors model both the means and volatilities of daily bond yield spreads in terms of potential determinants | The empirical results indicate that the German stock index return, the Euro Interbank Offered Rate, stock index returns of these countries, S&P 500 returns, VIX and sovereign debt ratings have had significant impacts on the bond yield spreads and/or volatilities, particularly in the post-crisis period. Moreover, evidence of financial contagion effect among the peripheral countries is found. |
| Allegret et al. (2017) | Analyze of the influence of the European sovereign debt crisis on banks’ equity returns for 15 countries. | Explicit multifactor model of equity returns extended with a sovereign risk factor. Smooth Transition Regression (STR) framework that allows for an endogenous definition of crisis periods and captures the changes in parameters associated with shift contagion. | The negative impact of the European sovereign debt crisis on banks’ equity returns has been mostly confined to EU banks. US banks appear to be unharmed by its direct impact and may have even benefited from it. Evidence of shift contagion is found across Europe. |
| Antonakakis et al. (2017) | Examination of the convergence patterns of Euro Area 17 countries’ sovereign bond yield spreads over the period 2002–2015. | Convergence algorithm | Empirical findings suggest rejection of full convergence across the EA17 countries’ bond yields spreads and the presence of a certain number of clubs. The transitional curves indicate that, despite short-run divergences, EU17 sovereign bond yield spreads tend to converge in the long-run, with the exception of those in Greece and Cyprus, indicating the strong attempts of most of the countries under investigation to adopt fiscal policies that eventually contribute to a convergence pattern. |
| Ratha et al. (2018) | Controlling for bond and issuer characteristics, bond spreads are expected to be equal across different legal jurisdictions, and differences are expected to disappear through arbitrage | Econometric model | Launch spreads of UK and US sovereign bonds do vary. The difference seems to be related to the perception that U.S. law offers stronger investor protection, and that the investor base for bonds issued under U.S. law is larger than that for bonds issued under U.K. law. The difference in spreads persists in the secondary market even after 180 days, perhaps because of the lack of liquidity, as investors tend to buy and hold these more attractive bonds on a longer-term basis. |
| Chamon et al. (2018) | The paper studies the effect of the jurisdiction choice on bond prices. Whether foreign-law bonds trade at a premium compared to domestic-law bonds is tested. | EU area 2006–2013 is used as a unique testing ground to control for currency risk, liquidity risk and term structure. | Foreign-law bonds indeed carry significantly lower yields in distress periods and this effect rises as the risk of sovereign default increases. The results indicate that in times of crisis governments can borrow at lower rates under foreign law. |
| Steffen et al. (2019) | The paper reviews the first five years of experience with CACs for European sovereign debt, focusing on legal and economic dimensions. | Event study | First, they present a chronology of legislative acts to incorporate CACs in European sovereign debt contracts alongside landmark lawsuits that have challenged their viability in the context of the Greek government debt restructuring of 2012. Secondly, they find that the introduction of CACs and related lawsuits had limited effects on sovereign bond pricing, both around the time of their announcement as well as in the time since. They conclude that the gradual and ex ante reform approach was less risky than relying on potential ex post action |
| Afonso and Tovar Jalles (2019) | To assess the determinants of sovereign bond yield spreads between 1999 and 2016, considering a non-conventional monetary policy measures in the Euro area. | Two-step approach: Confirm and estimate the determinants of sovereign bond yield spreads TVC models of each determinant and to analyze the temporal dynamics | Spreads are bid-ask spread, the VIX, fiscal and rating developments, REER, economic growth, QE measures implemented by ECB Covered Bond Purchase Programme contributed to reduce yield spread. Longer-term refinancing operations contributed to reduce yield spreads in most countries |
| Vácha et al. (2019) | The paper shows the comovement of bond yields in the EU before and during the EU sovereign debt crisis is frequency-dependent. | Frequency cohesion and wavelet coherence | The comovement is concentrated mainly at low frequencies. The comovement decreased during the crisis but remained high among countries with national currencies. Within the Eurozone a complex heterogeneity in the comovement that spans well beyond the traditional division between the core and the periphery is documented. Overall, the results provide more credibility to the Eurozone fragility hypothesis rather than to those who consider the fundamental factors to be the main driving force of the crisis. |
| Agiakloglou and Deliagiannakis (2020) | Sovereign risk evaluation for European Union countries. Investigation of the short run and long run relationship between government bond yields and their associated CDS considering the global financial crisis and the European debt crisis. Moreover, exploration of the interactions between changes in sovereign debt ratings and the corresponding credit premium. | Co-integration and Granger causality techniques Event study | The existence of economic integration between credits spreads on government bonds and their underlying CDS resulted in the existence of a long-run equilibrium. Evidence of co-integration between CDS and government bonds was not found for all countries. Most countries support bilateral causality. Findings in the relationship between CDS spreads and credit ratings is negative, but findings have low interpretation power |
| Keddad and Schalck (2020) | Spill overs from sovereign to domestic bank CDS spreads during the EU debt crisis for a set of 14 EU countries and 30 EU banks are investigated. | Markov-switching model with time-varying probabilities | Overall, the results suggest that sovereign CDS spreads can be considered good forewarning indicators for predicting the evolution of bank CDS spreads. They also find that the effects differ depending on the country and the financial institution. This result suggests that banks are heterogeneously exposed to sovereign credit risk within the same country. One argument relates to the size of these financial institutions and the domestic exposure to sovereign debt. |
Appendix B. CAC Premium
| Country | Yields with CAC | Yields without CAC | CAC Premium | Result | Rating |
|---|---|---|---|---|---|
| DE | −0.234 | −0.216 | −0.027 | negative | 1 |
| DE | −0.242 | −0.221 | −0.021 | negative | 1 |
| DE | −0.241 | −0.202 | −0.040 | negative | 1 |
| BE | −0.101 | −0.111 | 0.010 | positive | 2 |
| BE | −0.050 | −0.132 | 0.081 | positive | 2 |
| BE | −0.100 | −0.140 | 0.040 | positive | 2 |
| BE | −0.067 | −0.085 | 0.017 | positive | 2 |
| BE | −0.033 | −0.132 | 0.098 | positive | 2 |
| BE | −0.014 | −0.132 | 0.117 | positive | 2 |
| FI | −0.116 | −0.155 | 0.040 | positive | 2 |
| FR | −0.104 | −0.156 | 0.052 | positive | 2 |
| FR | −0.064 | −0.163 | 0.099 | positive | 2 |
| FR | −0.018 | −0.163 | 0.145 | positive | 2 |
| FR | 0.011 | −0.156 | 0.167 | positive | 2 |
| IT | −0.650 | −1.013 | 0.363 | positive | 4 |
| IT | 0.342 | 0.257 | 0.085 | positive | 4 |
| IT | 0.510 | −1.013 | 1.524 | positive | 4 |
| IT | 0.533 | 0.257 | 0.276 | positive | 4 |
| IT | 0.598 | 0.257 | 0.341 | positive | 4 |
| Country | Yields with CAC | Yields without CAC | CAC Premium | Result | Rating |
|---|---|---|---|---|---|
| DE | 0.039 | 0.054 | −0.015 | negative | 1 |
| DE | 0.014 | 0.069 | −0.055 | negative | 1 |
| DE | −0.038 | 0.086 | −0.125 | negative | 1 |
| BE | 0.300 | 0.101 | 0.199 | positive | 2 |
| BE | 0.384 | 0.101 | 0.284 | positive | 2 |
| BE | 0.456 | 0.101 | 0.356 | positive | 2 |
| FI | 0.215 | 0.180 | 0.034 | positive | 2 |
| FI | 0.291 | 0.180 | 0.111 | positive | 2 |
| FR | 0.294 | 0.246 | 0.048 | positive | 2 |
| FR | 0.356 | 0.198 | 0.158 | positive | 2 |
| FR | 0.449 | 0.198 | 0.251 | positive | 2 |
| FR | 0.444 | 0.246 | 0.198 | positive | 2 |
| NL | 0.242 | 0.151 | 0.091 | positive | 2 |
| NL | 0.301 | 0.151 | 0.150 | positive | 2 |
Appendix C. Descriptive Statistics Collective Action Clause
| Descriptive Statistic | Shapiro-Wilk Test | Outliers and Missing Data | |||
|---|---|---|---|---|---|
| Statistic | CAC Premium | Statistic | CAC Premium | Statistic | CAC Premium |
| Mean | 0.177403236 | W | 0.535130832 | Mean | 0.17740324 |
| Standard Error | 0.079359996 | p-value | 1.04494 × 10⁻⁶ | Stdev | 0.3459222 |
| Median | 0.08462813 | Alpha | 0.05 | outliers | 0 |
| Standard Deviation | 0.345922204 | normal | no | blank | 0 |
| Sample Variance | 0.119662171 | non-num | 0 | ||
| Kurtosis | 14.29445284 | 1 | − 0.59003347 | ||
| Skewness | 3.610926598 | 2 | −0.57275542 | ||
| Range | 1.563312338 | 3 | −0.62702932 | ||
| Maximum | 1.523812211 | 4 | −0.48389995 | ||
| Minimum | −0.03950013 | 5 | −0.27774637 | ||
| Sum | 3.370661486 | 6 | −0.39586455 | ||
| Count | 19 | 7 | −0.46248068 | ||
| AAD | 0.188939157 | 8 | −0.22867349 | ||
| MAD | 0.06720723 | 9 | −0.17352987 | ||
| IQR | 0.127724111 | 10 | −0.39837346 | ||
| 11 | −0.36213718 | ||||
| 12 | −0.22568384 | ||||
| 13 | −0.09270596 | ||||
| 14 | −0.02969248 | ||||
| 15 | 0.53716356 | ||||
| 16 | −0.26819645 | ||||
| 17 | 3.89223056 | ||||
| 18 | 0.28535066 | ||||
| 19 | 0.4740577 | ||||
| Descriptive Statistic | Shapiro-Wilk Test | Outliers and Missing Data | |||
|---|---|---|---|---|---|
| Statistic | CAC Premium | Statistic | CAC Premium | Statistic | CAC Premium |
| Mean | 0.120367186 | W | 0.9911594075 | Mean | 0.12036719 |
| Standard Error | 0.03603245 | p-value | 0.999875434 | Stdev | 0.13482108 |
| Median | 0.1307895 | Alpha | 0.05 | outliers | 0 |
| Standard Deviation | 0.134821083 | normal | yes | blank | 0 |
| Sample Variance | 0.018176724 | non-num | 0 | ||
| Kurtosis | −0.46625757 | 1 | −1.00290004 | ||
| Skewness | −0.10794586 | 2 | −1.30103565 | ||
| Range | 0.480248971 | 3 | −1.81668143 | ||
| Maximum | 0.3556892 | 4 | 0.58166655 | ||
| Minimum | −0.12455977 | 5 | 1.21165333 | ||
| Sum | 1.685140604 | 6 | 1.74543928 | ||
| Count | 14 | 7 | −0.63818193 | ||
| AAD | 0.107560585 | 8 | −0.06768441 | ||
| MAD | 0.089626096 | 9 | −0.53676461 | ||
| IQR | 0.160845969 | 10 | 0.2776236 | ||
| 11 | 0.97011915 | ||||
| 12 | 0.57582103 | ||||
| 13 | −0.22136884 | ||||
| 14 | 0.22229397 | ||||
| Descriptive Statistic. | Shapiro-Wilk Test | ||
|---|---|---|---|
| Statistic | Yield | Statistic | Yield |
| Mean | 0.205737 | W | 0.863732 |
| Standard Error | 0.065275 | p-value | 2.86 × 10⁻⁷ |
| Median | 0.077656 | Alpha | 0.05 |
| Mode | 1.722097 | normal | no |
| Standard Deviation | 0.598254 | ||
| Sample Variance | 0.357908 | ||
| Kurtosis | 2.379935 | ||
| Skewness | 0.952118 | ||
| Range | 3.578876 | ||
| Maximum | 2.035876 | ||
| Minimum | −1.543 | ||
| Sum | 17.28194 | ||
| Count | 84 | ||
| AAD | 0.404515 | ||
| MAD | 0.228432 | ||
| IQR | 0.470976 | ||
Appendix D. Two-Stage Linear Regression on Sovereign Bond Yields
Appendix D.1. Five-Year Sovereign Bonds
| Variable | Observations | Obs. with Missing Data | Obs. without Missing Data | Minimum | Maximum | Mean | Std. Deviation |
| Yield | 41 | 0 | 41 | −1.543 | 0.598 | −0.099 | 0.375 |
| CAC | 41 | 0 | 41 | 0.000 | 1.000 | 0.561 | 0.502 |
| Ratingdummy1 | 41 | 0 | 41 | 0.000 | 1.000 | 0.220 | 0.419 |
| Ratingdummy2 | 41 | 0 | 41 | 0.000 | 1.000 | 0.537 | 0.505 |
| Ratingdummy3 | 41 | 0 | 41 | 0.000 | 1.000 | 0.244 | 0.435 |
| Variable. | Observations | Obs. with Missing Data | Obs. without Missing Data | Minimum | Maximum | Mean | Std. Deviation |
| Z date CAC instr.var. | 41 | 0 | 41 | 0.000 | 1.000 | 0.439 | 0.502 |
| Z date CAC instr.var. | 41 | 0 | 41 | 0.000 | 1.000 | 0.439 | 0.502 |
| Z date CAC instr.var. | 41 | 0 | 41 | 0.000 | 1.000 | 0.439 | 0.502 |
| Z date CAC instr.var. | 41 | 0 | 41 | 0.000 | 1.000 | 0.439 | 0.502 |
| Statistic | Yield |
| Number of observations | 41 |
| Minimum | −1.543 |
| Maximum | 0.598 |
| 1st Quartile | −0.216 |
| Median | −0.111 |
| 3rd Quartile | −0.018 |
| Mean | −0.099 |
| Variance (n − 1) | 0.140 |
| Standard deviation (n) | 0.370 |
| Standard deviation (n − 1) | 0.375 |
| Standard error of the mean | 0.059 |
| Statistic | CAC | Ratingdummy1 | Ratingdummy2 | Ratingdummy3 |
| Tolerance | 0.897 | 0.000 | 0.000 | 0.000 |
| VIF | 1.115 |
| Statistic | Output |
| Observations: | 41.000 |
| Sum of weights | 41.000 |
| DF | 39.000 |
| R² | 0.185 |
| Adjusted R² | 0.164 |
| MSE | 0.117 |
| RMSE | 0.343 |
| MAPE | 122.383 |
| DW | 1.826 |
| Cp | 2.000 |
| AIC | −85.882 |
| SBC | −82.455 |
| PC | 0.899 |
| Source | DF | Sum of Squares | Mean Squares | F | Pr > F |
| Model | 1 | 1.039 | 1.039 | 8.851 | 0.005 |
| Error | 39 | 4.578 | 0.117 | ||
| Corrected total | 40 | 5.617 |
| Variables | CAC | Ratingdummy1 | Ratingdummy2 | Ratingdummy3 | Yield |
| CAC | 1.000 | −0.243 | −0.034 | 0.274 | 0.430 |
| Ratingdummy1 | −0.243 | 1.000 | −0.571 | −0.301 | −0.192 |
| Ratingsdummy2 | −0.034 | −0.571 | 1.000 | −0.611 | −0.181 |
| Ratingdummy3 | 0.274 | −0.301 | −0.611 | 1.000 | 0.395 |
| yield | 0.430 | −0.192 | −0.181 | 0.395 | 1.000 |
Appendix D.2. Ten-Year Sovereign Bonds
| Variable | Observations | Obs. with Missing Data | Obs. without Missing Data | Minimum | Maximum | Mean | Std. Deviation |
| Yield | 23 | 0 | 23 | −0.042 | 0.456 | 0.208 | 0.155 |
| CAC | 23 | 0 | 23 | 0.000 | 1.000 | 0.609 | 0.499 |
| Ratingdummy | 23 | 0 | 23 | 0.000 | 1.000 | 0.304 | 0.470 |
| Variable | Observations | Obs. with Missing Data | Obs. without Missing Data | Minimum | Maximum | Mean | Std. Deviation |
| Z date CAC instr.var. | 23 | 0 | 23 | 0.000 | 1.000 | 0.391 | 0.499 |
| Z date CAC instr.var. | 23 | 0 | 23 | 0.000 | 1.000 | 0.391 | 0.499 |
| Statistic | Yield |
| Number of observations | 23 |
| Minimum | −0.042 |
| Maximum | 0.456 |
| 1st Quartile | 0.078 |
| Median | 0.215 |
| 3rd Quartile | 0.301 |
| Mean | 0.208 |
| Variance (n − 1) | 0.024 |
| Standard deviation (n) | 0.151 |
| Standard deviation (n − 1) | 0.155 |
| Standard error of the mean | 0.032 |
| Statistic | CAC | Ratingdummy |
| Tolerance | 0.940 | 0.940 |
| VIF | 1.063 | 1.063 |
| Statistic | Yield |
| Observations | 23.000 |
| Sum of weights | 23.000 |
| DF | 21.000 |
| R² | 0.365 |
| Adjusted R² | 0.335 |
| MSE | 0.016 |
| RMSE | 0.126 |
| MAPE | 120.311 |
| DW | 0.510 |
| Cp | 2.000 |
| AIC | −93.388 |
| SBC | −91.177 |
| PC | 0.755 |
| Source | DF | Sum of Squares | Mean Squares | F | Pr > F |
| Model | 1 | 0.192 | 0.192 | 12.097 | 0.002 |
| Error | 21 | 0.333 | 0.016 | ||
| Corrected total | 22 | 0.525 |
| Variables | CAC | Ratingdummy | Yield |
| CAC | 1.000 | −0.244 | 0.605 |
| Ratingdummy | −0.244 | 1.000 | −0.798 |
| yield | 0.605 | −0.798 | 1.000 |
Appendix E. Multicollinearity and Linear Regression Analysis CAC Premium
Appendix E.1. Five-Year Sovereign Bonds
| Variable | Observations | Obs. with Missing Data | Obs. without Missing Data | Minimum | Maximum | Mean | Std. Deviation |
| CAC | 19 | 0 | 19 | −0.040 | 1.524 | 0.177 | 0.346 |
| Ratingdummy1 | 19 | 0 | 19 | 0.000 | 1.000 | 0.158 | 0.375 |
| Ratingdummy2 | 19 | 0 | 19 | 0.000 | 1.000 | 0.579 | 0.507 |
| Ratingdummy3 | 19 | 0 | 19 | 0.000 | 1.000 | 0.263 | 0.452 |
| Statistic | CAC Premium |
| Number of observations | 19 |
| Minimum | −0.040 |
| Maximum | 1.524 |
| 1st Quartile | 0.029 |
| Median | 0.085 |
| 3rd Quartile | 0.156 |
| Mean | 0.177 |
| Variance (n − 1) | 0.120 |
| Standard deviation (n) | 0.337 |
| Standard deviation (n − 1) | 0.346 |
| Standard error of the mean | 0.079 |
| Statistic | CAC Premium | Ratingdummy1 | Ratingdummy2 | Ratingdummy3 |
| R² | 0.378 | 1.000 | 1.000 | 1.000 |
| Tolerance | 0.622 | 0.000 | 0.000 | 0.000 |
| VIF | 1.607 |
| Variables | Result | Ratingdummy1 | Ratingdummy2 | Ratingdummy3 | CAC Premium |
| Result | 1 | −1.000 | 0.508 | 0.259 | 0.265 |
| Ratingdummy1 | −1.000 | 1 | −0.508 | −0.259 | −0.265 |
| Ratingsdummy2 | 0.508 | −0.508 | 1 | −0.701 | −0.343 |
| Ratingdummy3 | 0.259 | −0.259 | −0.701 | 1 | 0.604 |
| CAC premium | 0.265 | −0.265 | −0.343 | 0.604 | 1 |
| Statistic | CAC Premium |
| Observations: | 19 |
| Sum of weights | 19 |
| DF | 16 |
| R² | 0.378 |
| Adjusted R² | 0.300 |
| MSE | 0.084 |
| RMSE | 0.289 |
| MAPE | 120.876 |
| DW | 2.834 |
| Cp | 3.000 |
| AIC | −44.383 |
| SBC | −41.550 |
| PC | 0.855 |
| Source | DF | Sum of Squares | Mean Squares | F | Pr > F |
| Model | 2 | 0.814 | 0.407 | 4.859 | 0.022 |
| Error | 16 | 1.340 | 0.084 | ||
| Corrected total | 18 | 2.154 |
Appendix E.2. Ten-Year Sovereign Bonds
| Variable | Observations | Obs. with Missing Data | Obs. without Missing Data | Minimum | Maximum | Mean | Std. Deviation |
| CAC premium | 14 | 0 | 14 | −0.125 | 0.356 | 0.120 | 0.135 |
| Result | 14 | 0 | 14 | 0.000 | 1.000 | 0.786 | 0.426 |
| Ratingdummy1 | 14 | 0 | 14 | 0.000 | 1.000 | 0.241 | 0.426 |
| Ratingdummy2 | 14 | 0 | 14 | 0.000 | 1.000 | 0.786 | 0.426 |
| Statistic | CAC Premium |
| Number of observations | 14 |
| Minimum | −0.125 |
| Maximum | 0.356 |
| 1st Quartile | 0.038 |
| Median | 0.131 |
| 3rd Quartile | 0.199 |
| Mean | 0.120 |
| Variance (n − 1) | 0.018 |
| Standard deviation (n) | 0.130 |
| Standard deviation (n − 1) | 0.135 |
| Standard error of the mean | 0.036 |
| Statistic | CAC Premium | Ratingdummy1 | Ratingdummy2 |
| R² | 0.554 | 1.000 | 1.000 |
| Tolerance | 0.446 | 0.000 | 0.000 |
| VIF | 2.243 |
| Variables | Result | Ratingdummy1 | Ratingdummy2 | CAC Premium |
| Result | 1 | −1.000 | 1.000 | 0.744 |
| Ratingdummy1 | −1.000 | 1 | −1.000 | −0.744 |
| Ratingsdummy2 | 1.000 | −1.000 | 1 | 0.744 |
| CAC premium | 0.744 | −0.744 | 0.744 | 1 |
| Statistic | CAC Premium |
| Observations: | 14 |
| Sum of weights | 14 |
| DF | 12 |
| R² | 0.554 |
| Adjusted R² | 0.517 |
| MSE | 0.009 |
| RMSE | 0.094 |
| MAPE | 97.990 |
| DW | 1.694 |
| Cp | 2.000 |
| AIC | −64.452 |
| SBC | −63.174 |
| PC | 0.595 |
| Source | DF | Sum of Squares | Mean Squares | F | Pr > F |
| Model | 1 | 0.131 | 0.131 | 14.912 | 0.022 |
| Error | 12 | 0.105 | 0.009 | ||
| Corrected total | 13 | 0.236 |
References
- Afonso, António, and João Tovar Jalles. 2019. Quantitative easing and sovereign yield spreads: Euro-area time-varying evidence. Journal of International Financial Markets, Institutions and Money 58: 208–24. [Google Scholar] [CrossRef]
- Agiakloglou, Christos, and Emmanouil Deliagiannakis. 2020. Sovereign risk evaluation for European Union countries. Journal of International Money and Finance 103: 102117. [Google Scholar] [CrossRef]
- Aguiar, Mark, and Manuel Amador. 1938. Sovereign Debt: A Review (NBER Working Papers No. 19388). St. Louis: National Bureau of Economic Research, Inc. [Google Scholar]
- Aizenman, Joshua, Michael Hutchison, and Yothin Jinjarak. 2013. What is the risk of European sovereign debt defaults? Fiscal space, CDS spreads and market pricing of risk. Journal of International Money and Finance 34: 37–59. [Google Scholar] [CrossRef]
- Allegret, Jean-Pierre, Hélène Raymond, and Houda Rharrabti. 2017. The impact of the European sovereign debt crisis on banks stocks. Some evidence of shift contagion in Europe. Journal of Banking and Finance 2017: 24–37. [Google Scholar] [CrossRef]
- Antonakakis, Nikolaos, and Konstantinos Vergos. 2013. Sovereign bond yield spillovers in the Euro zone during the financial and debt crisis. Journal of International Financial Markets, Institutions and Money 26: 258–72. [Google Scholar] [CrossRef]
- Antonakakis, Nikolaos, Christina Christou, Juncal Cunado, and Rangan Gupta. 2017. Convergence patterns in sovereign bond yield spreads: Evidence from the Euro Area. Journal of International Financial Markets, Institutions and Money 49: 129–39. [Google Scholar] [CrossRef]
- Aristei, David, and Duccio Martelli. 2014. Sovereign bond yield spreads and market sentiment and expectations: Empirical evidence from Euro area countries. Journal of Economics and Business 76: 55–84. [Google Scholar] [CrossRef]
- Atkeson, Andrew. 1991. International Lending with moral hazard and risk of repudiation. Econometrica 59: 1069. [Google Scholar] [CrossRef]
- Bardozzetti, Alfredo, and Davide Dottori. 2014. Collective action clauses: How do they affect sovereign bond yields? Journal of International Economics 92: 286–303. [Google Scholar] [CrossRef]
- Bauer, Klaus-Albert. 2013. The Euro’s Area Collective Action Clauses—Some Questions and Answers. Institute for Law and Finance Series: Vol. 12. Collective Action Clauses and the Restructuring of Sovereign Debt. de Gruyter. Available online: http://www.degruyter.com/doi/book/10.1515/9783110314526 (accessed on 9 November 2020).
- Becker, Torbjörn, Anthony Richards, and Yunyong Thaicharoen. 2003. Bond restructuring and moral hazard: Are collective action clauses costly? Journal of International Economics 61: 127–61. [Google Scholar] [CrossRef]
- Beirne, John, and Marcel Fratzscher. 2013. The pricing of sovereign risk contagion during the European sovereign debt crisis. Journal of International Money and Finance 34: 60–82. [Google Scholar] [CrossRef]
- Bernoth, Kerstin, and Burcu Erdogan. 2012. Sovereign bond yield spreads: A time-varying coefficient approach. Journal of International Money and Finance 31: 639–56. [Google Scholar] [CrossRef]
- Bradley, Michael, and Mitu Gulati. 2013a. Collective Action Clauses for the Eurozone: An empirical analysis. SSRN Electronic Journal. [Google Scholar]
- Bradley, Michael, and Mitu Gulati. 2013b. Collective Action Clauses for the Eurozone. Review of Finance 18: 2045–102. [Google Scholar] [CrossRef]
- Brooks, Chris. 2017. Introductory Econometrics for Finance. Cambridge: Cambridge University Press. [Google Scholar]
- Buchheit, Lee, Mitu Gulati, and Ignacio Tirado. 2013. The problem of holdout creditors in Eurozone sovereign debt restructuring. SSRN Journal. [Google Scholar]
- Bulow, Jeremy, and Kenneth Rogoff. 1989. A constant recontracting model of sovereign debt. Journal of Political Economy 97: 155–78. [Google Scholar] [CrossRef]
- Chamon, Marcos, Julian Schumacher, and Christoph Trebesch. 2018. Foreign-law bonds: Can they reduce sovereign borrowing costs? Journal of International Economics 114: 164–79. [Google Scholar] [CrossRef]
- Chung, Kay, and Michael G. Papaioannou. 2020. Do enhanced Collective Action Clauses affect sovereign borrowing costs? IMF Working Paper 20: 1–44. [Google Scholar] [CrossRef]
- Costantini, Mauro, Matteo Fragetta, and Giovanni Melina. 2014. Determinants of sovereign bond yield spreads in the EMU: An optimal currency area perspective. European Economic Review 70: 337–49. [Google Scholar] [CrossRef]
- Diebold, Francis X., and Kamil Yilmaz. 2012. Better to give than to receive: Predictive directional measurement of volatility spillovers. International Journal of Forecasting 28: 57–66. [Google Scholar] [CrossRef]
- Dixon, Liz, and David Wall. 2000. Collective action problems and collective action clauses. Bank of England Financial Stability Review 6: 142–51. [Google Scholar]
- Dooley, Michael. 2000. Can Output Losses Following International Crises Be Avoided? NBER Working Paper 7531. St. Louis: National Bureau of Economic Research. [Google Scholar]
- Economic and Financial Committee. 2015a. Collective Action Clauses in Euro Area. Available online: https://europa.eu/efc/efc-sub-committee-eu-sovereign-debt-markets/collective-action-clauses-euro-area_en (accessed on 24 May 2015).
- Economic and Financial Committee. 2015b. Euro Area Model CAC 2012. Available online: https://europa.eu/efc/efc-sub-committee-eu-sovereign-debt-markets/collective-action-clauses-euro-area/euro-area-model-cac_en (accessed on 24 May 2015).
- Eichengreen, Barry. 2003. Restructuring sovereign debt. Journal of Economic Perspectives 17: 75–98. [Google Scholar]
- Eichengreen, Barry, and Ashoka Mody. 2004. Do Collective Action Clauses raise borrowing costs? The Economic Journal 114: 247–64. [Google Scholar] [CrossRef]
- Eichengreen, Barry, and Richard Portes. 1985. Debt and default in the 1930s: Cause and consequences. European Economic Review 30: 641–47. [Google Scholar]
- Europa.eu. 2015. Available online: https://europa.eu/efc/sites/default/files/docs/pages/final_-_cac_public_report.pdf (accessed on 24 May 2015).
- Schumacher, Julian, Christoph Tresbech, and Chuck Fang. 2020. Restructuring sovereign bonds: Hold outs, haircuts and effectiveness of CACs. ECB Working Paper No. 2366. Available online: https://ssrn.com/abstract=3519925 (accessed on 24 May 2015).
- Gelpern, Anna, and Mitu Gulati. 2013. The wonder-clause. Journal of Comparative Economics 41: 367–85. [Google Scholar] [CrossRef]
- Ghosal, Sayatan, and Kannika Thampanishvong. 2013. Does strengthening Collective Action Clauses (CACs) help? Journal of International Economics 89: 68–78. [Google Scholar] [CrossRef]
- Grossman, Herschel, and John B. Van Huyck. 1985. Sovereign Debt as a Contingent Claim: Excusable Default, Repudiation, and Reputation. St. Louis: National Bureau of Economic Research. [Google Scholar]
- Gugiatti, Michael, and Anthony J. Richards. 2004. The Use of Collective Action Clauses in New York Law Bonds of Sovereign Borrowers, Reserve Bank of Australia. Available online: https://heinonline.org/HOL/LandingPage?handle=hein.journals/geojintl35&div=33&id=&page= (accessed on 16 December 2020).
- Haldane, Andrew, Adrian Penalver, Victoria Saporta, and Hyun Song Shin. 2005. Analytics of sovereign debt restructuring. Journal of International Economics 65: 315–33. [Google Scholar] [CrossRef]
- Herman, Barry. 2007. Doing the right thing: Dealing with developing country sovereign debt. North Carolina Journal of International Law 32: 5. [Google Scholar]
- Keddad, Benjamin, and Christophe Schalck. 2020. Evaluating sovereign risk spillovers on domestic banks during the European debt crisis. Economic Modelling 88: 356–75. [Google Scholar] [CrossRef]
- Picarelli Osvaldo, Mattia, Erce Aitor, and Jiang Xu. 2019. The benefits of reducing holdout risk: Evidence from the Euro CAC Experiment, 2013–2018. Capital Markets Law Journal 14: 155–77. [Google Scholar] [CrossRef]
- Pitchford, Rohan, and Mark L. J. Wright. 2010. Holdouts in Sovereign Debt Restructuring: A Theory of Negotiation in a Weak Contractual Environment (NBER Working Papers No. 16632). St. Louis: National Bureau of Economic Research, Inc. [Google Scholar]
- Poghosyan, Trigan. 2012. Long-Run and Short-Run determinants of sovereign bond yields in advanced economies. IMF Working Papers 12: 1. [Google Scholar] [CrossRef]
- Portes, Richard. 2004. Resolution of Sovereign Debt Crises: The New Old Framework. CEPR Working Paper Number 4717. Available online: https://cepr.org/active/publications/discussion_papers/dp.php?dpno=4717 (accessed on 8 September 2015).
- Ratha, Dilip, Supriyo De, and Sergio Kurlat. 2018. Does Governing Law Affect Bond Spreads? Emerging Markets Review 6: 60–78. [Google Scholar] [CrossRef]
- Richards, Anthony J., and Michael Gugiatti. 2003a. The use of Collective Action Clauses in New York Law Bonds of sovereign borrowers. SSRN Electronic Journal. [Google Scholar]
- Richards, Anthony J., and Michael Gugiatti. 2003b. Do Collective Action Clauses influence bond yields? New evidence from emerging markets. International Finance 6: 415–47. [Google Scholar] [CrossRef]
- Ruppert, David. 2004. Statistics and Finance: An Introduction. Springer Texts in Statistics. Springer. Available online: http://www.loc.gov/catdir/enhancements/fy0818/2003063814-d.html (accessed on 19 October 2020).
- Sabel, David G. 2013. An Introduction to the Euro Area’s Model Collective Action Clause. In Institute for Law and Finance Series: Vol. 12. Collective Action Clauses and the Restructuring of Sovereign Debt. Berlin: de Gruyter, pp. 29–44. [Google Scholar]
- Steffen, Christoph Grosse, Sebastian Grund, and Julian Schumacher. 2019. Collective action clauses in the euro area: A law and economic analysis of the first five years. Capital Markets Law Journal 14: 134–54. [Google Scholar] [CrossRef]
- Silvapulle, Param, Jean Pierre Fenech, Alice Thomas, and Rob Brooks. 2016. Determinants of sovereign bond yield spreads and contagion in the peripheral EU countries. Economic Modelling 58: 83–92. [Google Scholar] [CrossRef]
- Stolper, Antonia E., and Sean Dougherty. 2019. Collective Action Clauses: How the Argentina litigation changed the sovereign debt markets. Capital Markets Law Journal 12: 239–52. [Google Scholar] [CrossRef]
- Tsatsaronis, Konstantinos. 1999. The effect of collection action clauses on sovereign bond yields. BIS Quarterly Review: International Financial Banking and Financial Market Development, 22–23. [Google Scholar]
- Vácha, Lukás, Filip Šmolík, and Jaromír Baxa. 2019. Comovement and disintegration of EU sovereign bond markets during the crisis. International Review of Economics & Finance 64: 541–56. [Google Scholar] [CrossRef]
- Wali Ullah, G. M., and Samiul Parvez Ahmed. 2014. A review of European sovereign debt crisis: Causes and consequences. International Journal of Business and Economics Research 3: 66. [Google Scholar]
- Weidemaier, Mark C., and Mitu Gulati. 2013. A people’s history of Collective Action Clauses. Virginia Journal of International Law 54: 52–56. [Google Scholar] [CrossRef][Green Version]
- Weinschelbaum, Federico, and José Wynne. 2005. Renegotiation, collective action clauses and sovereign debt markets. Journal of International Economics 67: 47–72. [Google Scholar] [CrossRef]
- Werner, Richard A. 2014. Enhanced debt management: Solving the Eurozone crisis by linking debt management with fiscal and monetary policy. Journal of International Money and Finance 49: 443–69. [Google Scholar] [CrossRef]
- Wiesmann, Martin. 2013. CACs and the restructuring of sovereign debt—How would markets react? In Institute for Law and Finance Series: Vol. 12. Collective Action Clauses and the Restructuring of Sovereign Debt. Edited by Klaus Albert Baue, Andreas Cahn and Patrick S. Kenadjian. Berlin: de Gruyter, pp. 1015–112. [Google Scholar]

| Bonds without CAC | Bonds including CAC |
|---|---|
| Issue date starting from 2011 | Issue date starting from 2013 |
| Bonds issued in Euro | Bonds issued in Euro |
| Coupon type: fixed | Coupon type: fixed |
| Rating from S&P | Rating from S&P |
| Variables | Observations | Mean | Standard Deviation | Standard Error |
|---|---|---|---|---|
| Yields | 84 | 0.206 | 0.598 | 0.065 |
| CAC premium 5-year bonds | 19 | 0.177 | 0.346 | 0.079 |
| CAC premium 10-year bonds | 14 | 0.12 | 0.135 | 0.036 |
| Variables | Confidence Level | Significance | R² | VIF | Standard Error |
|---|---|---|---|---|---|
| 5-year bonds | 95% | 0.5% < 5% | 18% | 1.12 | 0.059 |
| 10-year bonds | 95% | 0.2% < 5% | 37% | 1.06 | 0.032 |
| Variable | Confidence Level | Significance | R² | VIF | Standard Error |
|---|---|---|---|---|---|
| CAC premium 5-year bonds | 95% | 2.2% < 5% | 38% | 1.6 | 0.079 |
| CAC premium 10-year bonds | 95% | 0.2% < 5% | 55% | 2.24 | 0.036 |
| Hypothesis | Findings |
|---|---|
| H1:is there a relationship between the variables yields of five-year sovereign bonds, CAC, and rating? | there is a relationship between the variables yields of five-year sovereign bonds, CAC, and rating |
| H2:is there a relationship between the variables yields of ten-year sovereign bonds, CAC, and rating? | there is a relationship between the variables yields of ten-year sovereign bonds, CAC, and rating |
| H3:is there a relationship between CAC premium, result, and rating for five-year sovereign bonds? | there is a relationship between CAC premium, result, and rating for five-year sovereign bonds |
| H4:is there a relationship between CAC premium, result, and rating for ten-year sovereign bonds? | there is a relationship between CAC premium, result, and rating for ten-year sovereign bonds |
Publisher’s Note: MDPI stays neutral with regard to jurisdictional claims in published maps and institutional affiliations. |
© 2020 by the authors. Licensee MDPI, Basel, Switzerland. This article is an open access article distributed under the terms and conditions of the Creative Commons Attribution (CC BY) license (http://creativecommons.org/licenses/by/4.0/).
Share and Cite
Layher, N.; Samunderu, E. The Impact of the Introduction of Uniform European Collective Action Clauses on European Government Bonds as a Regulatory Result of the European Sovereign Debt Crisis. J. Risk Financial Manag. 2021, 14, 1. https://doi.org/10.3390/jrfm14010001
Layher N, Samunderu E. The Impact of the Introduction of Uniform European Collective Action Clauses on European Government Bonds as a Regulatory Result of the European Sovereign Debt Crisis. Journal of Risk and Financial Management. 2021; 14(1):1. https://doi.org/10.3390/jrfm14010001
Chicago/Turabian StyleLayher, Nicoletta, and Eyden Samunderu. 2021. "The Impact of the Introduction of Uniform European Collective Action Clauses on European Government Bonds as a Regulatory Result of the European Sovereign Debt Crisis" Journal of Risk and Financial Management 14, no. 1: 1. https://doi.org/10.3390/jrfm14010001
APA StyleLayher, N., & Samunderu, E. (2021). The Impact of the Introduction of Uniform European Collective Action Clauses on European Government Bonds as a Regulatory Result of the European Sovereign Debt Crisis. Journal of Risk and Financial Management, 14(1), 1. https://doi.org/10.3390/jrfm14010001