Abstract
This study aims to explore the relationship between corporate governance and financial performance of publicly listed family and non-family firms in the Japanese manufacturing industry. The study obtains data from Bloomberg over the period 2014–2018 and covers 1412 firms comprising of 861 non-family and 551 family firms. Our results show that family firms outperform non-family counterparts in terms of return on assets (ROA) and Tobin’s Q when a univariate analysis is invoked. On multivariate analysis, family firms show superior performance to non-family firms with Tobin’s Q. However, family ownership negates firm performance when ROA is taken into account. Regarding the impact of governance elements on Tobin’s Q, institutional shareholding appears to be a significant and positive factor for promoting the performance of both family and non-family firms. Furthermore, board size encourages the performance of non-family firms, while such influence is not observed for family firms. In terms of ROA, foreign ownership inspires the performance of both family and non-family firms. Moreover, government ownership stimulates the performance of family firms, while board independence significantly negates the same. Besides, we find that the performance of family firms run by the founder’s descendants is superior to that of family firms run by the founder. These findings have critical policy implications for family firms in Japan.
JEL Classification:
G32; M13
1. Introduction
In recent times, the performance difference between family and non-family firms has received a new impetus to study because many studies claim that family firms outperform the non-family firms (Anderson and Reeve 2003; Sharma 2004; Allouche et al. 2008; Saito 2008; Chu 2011; Hansen and Block 2020; Srivastava and Bhatia 2020), while some others do not document the existence of such a relationship (Filatotchev et al. 2005; McConaughy and Phillips 1999; Miller et al. 2007; Yoshikawa and Rasheed 2010). Prior studies also note that the performance difference between family and non-family firms arises due to the governance system and corporate cultures across countries (Allouche et al. 2008; Srivastava and Bhatia 2020).
Given the above inconclusive results, we study and compare the financial performance of family and non-family firms in Japan from the governance perspective to add value. We consider Japan as a case for two reasons. First, family firms constitute over 40% of the listed firms in Japan (Saito 2008), implying the importance of such firms on stock market development and economic growth. However, not many researchers have deep-dived to investigate the factors contributing to the performance difference between family and non-family firms in Japan. Furthermore, the limited empirical works on the performance of family firms in Japan offer mixed results. For example, Allouche et al. (2008) and Saito (2008) revealed that family firms perform better than non-family firms in Japan. Dazai et al. (2016) claimed that Japanese family firms outperform their counterparts, particularly after the economic bubble in 1991. However, Morikawa (2013) discovered that the annual productivity growth rate (one of the indicators of a firm’s performance) of non-family firms in Japan was about 2% higher than that of family firms. Saito (2008) noted that the performance of founder-run firms was worse than non-family firms, but the performance of family firms owned by the founder’s successors was better than the non-family firms. Moreover, Yoshikawa and Rasheed (2010) did not trace a significant relationship between family ownership and return on assets (ROA) in Japanese Over-The-Counter (“OTC”) market listed firms in the manufacturing industry. Since most of the studies on family firms in Japan were conducted a fairly long time before, updated evidence on the performance difference between Japanese family and non-family firms is instrumental for policy implications.
Secondly, the Japanese governance structure is found to be somewhat different from that of US-style governance. The distinct Japanese governance system, such as the Japanese integrated monitoring system practiced by main banks, life-time employment system, and cross-shareholdings which contributed to the post-World War II economic growth rates of Japan, were substantially changed after the “big bang financial and accounting reform in 1997” in favor of the US-style governance. Even though the impact of the reform program helped the increase of independent directors, encouraged foreign shareholding, and reduced shareholding by main banks, Japanese firms are still found to be characterized by the board of directors promoted from within the firms (Arikawa et al. 2017), relatively less numbers of independent directors (two or more as per Corporate Governance Code, 2015), insider CEOs, and a higher percentage of family ownership. Thus, it is essential to know whether the current financial setup impacts the performance of family firms in Japan. Clearly, do the governance mainsprings such as board structure and ownership patterns impact on the performance difference between Japanese family and non-family firms?
We explain the above question by studying all the manufacturing firms listed in Tokyo, Nagoya, and Osaka stock markets covering the period 2014–2018. We consider manufacturing firms because this sector accounts for nearly half of the total number of corporations existing in Japan while contributing approximately 20% of Japan’s GDP. The Japanese manufacturing industry is still very sizeable and significantly crucial to the Japanese economy. Furthermore, we exclude the financial and service sectors because they have a different asset structure from the manufacturing firms.
Our results show that family firms outperform the non-family counterparts on both accounting and market-based measures of firm performance, such as ROA and Tobin’s Q, when univariate analysis is invoked. On multivariate analysis, family ownership reduces firm performance, indexed by ROA, but promotes the same with Tobin’s Q. Among the governance elements, we find that institutional shareholding is a significant and positive factor for boosting the performance of both family and non-family firms. Moreover, board size inspires the performance of non-family firms, while such influence is not observed for family firms. In terms of ROA, foreign ownership stimulates the performance of both family and non-family firms. Furthermore, government ownership positively influences the performance of family firms, while board independence significantly negates the same. Besides, we find that the performance of family firms run by the founder’s descendants are superior to that of family firms run by the founder.
2. Hypotheses
2.1. Family Ownership and Firm Performance
Agency theory can be put into place to discuss the performance difference between family and non-family firms. Agency theory states that executives do not have an interest in the firm’s long-term performance (Jensen and Meckling 1976; Dalton et al. 1998), and they tend to make a decision based on their preferences, looking for short-term gain while ignoring shareholders’ interests (Kallmuenzer 2015). Thus, from the agency theory perspective, family firms tend to perform better than non-family firms because the involvement of family members in both ownership and management can minimize this particular conflict of interest between managers and owners. Moreover, family firms are likely to have longer investment horizons, resulting in higher investment efficiency (Muttakin et al. 2014), as they want to preserve firm value for successive generations (Achleitner et al. 2014; Hasso and Duncan 2013). Moreover, empirical works by Razzaque et al. (2020) and Muttakin et al. (2014) reveal that family ownership has a positive impact on the performance of Bangladeshi manufacturing firms. Herrera-Echeverri et al. (2016) concluded that the family’s involvement in the ownership and management often led to a more stable directorship for Columbian family firms. Blanco-Mazagatos et al. (2018) reported that family ownership has a positive influence on the performance of Spanish second- and later-generation firms. The more robust performance of family firms is also reported for companies in the S&P 500 (Anderson and Reeve 2003).
In the Japanese context, Chen et al. (2005) found evidence that supports the positive effect of family ownership on firm performance. Saito (2008) concluded that family control has a link to higher Tobin’s Q. Similarly, Chen and Yu (2017) contend that Japanese and Taiwanese firms run by founders are traded at a higher value in the stock market.
Notably, there could be a Type II agency problem (principal–principal conflict) in family firms because the interest of family members may not necessarily be in line with the interest of minority shareholders (Muttakin et al. 2014). Besides, family firms usually hire executives from close relatives ignoring outside talents, resulting in suboptimal financial performance (Anderson and Reeve 2003). Accordingly, some empirical studies found a negative link between family ownership and firm performance (Yoshikawa and Rasheed 2010, for Japan).
Nonetheless, we argue that founders or family members who own and control the firms have stronger motivation to create wealth for successors. Thus, they tend to adopt long-run views in their investment horizons, which discourage them from taking higher risks, leading to generate stable returns for shareholders. Furthermore, higher family ownership reduces agency costs by reducing managerial myopia, moral hazards, and the agency problem. On this basis, we formulate Hypothesis 1.
Hypothesis 1 (H1).
Family ownership encourages the performance of family firms.
2.2. Institutional Ownership and Firm Performance
Institutional ownership is considered to be a useful tool to reduce the Type II agency problem, where family firms may expropriate profits at the expense of minority shareholders. Dau et al. (2018) report that institutional ownership improves the ROA of family firms in India. A study on 134 listed firms in Kuwait reveals that institutional investors encourage firm performance, indexed by ROA and Tobin’s Q (Alfaraid et al. 2012). By contrast, Ahmad et al. (2019) found a significant negative relationship between institutional investors and ROA for non-financial firms in Pakistan. Charfeddine and Elmarzougui (2011) traced that institutional ownership has a significant negative impact on Tobin’s Q for French firms. However, Alnajjar (2015) found no substantial effect of institutional ownership on both ROA and Return on Equity (ROE) for firms in Jordan. Regarding the Japanese firms, Mizuno and Shimizu (2015) found that firms with a higher level of institutional ownership tended to perform better than firms having less or no institutional ownership. Moreover, Yasuhiro et al. (2016) and Arikawa et al. (2017) found a significant positive association between institutional ownership and Tobin’s Q. However, they did not see any relationship between institutional ownership and ROA.
We argue that institutional investors can mitigate much of the agency problem associated with family firms as they hold a significant equity stake in the firm (Charfeddine and Elmarzougui 2011). Institutional investors are seen to be more powerful than non-institutional investors in exercising voting rights and selling shares when management actions are not aligned with shareholders’ interests (Arikawa et al. 2017). Furthermore, institutional shareholders can protect the interest of minority shareholders and reduce the Type II agency problem by monitoring the firm’s management. Therefore, following previous empirical findings and agency theory, we take the following hypothesis.
Hypothesis 2 (H2).
Institutional ownership encourages the performance of family firms.
2.3. Government Ownership and Firm Performance
Few pieces of research have studied the impact of government ownership on firm performance. Fukuda et al. (2018) argued that the government, as a shareholder, can reduce companies’ financing costs. A study on Vietnamese firms from 2004–2012 provides evidence that an increase of government ownership in large firms improves firms’ ROA and ROE, while for middle and small firms, it hurts the same (Ngo et al. 2014). Similarly, a study on listed firms in Shanghai and Shenzhen Stock Exchange reveals a positive relationship between government shareholdings and firm performance (Sun et al. 2002). Ahmad et al. (2008) obtained similar positive results for the link between government ownership and firm performance, measured by both Tobin’s Q and ROA, in Malaysian firms.
In the case of Japan, Fukuda et al. (2018) noted that the effect of government ownership on firm performance varies depending on the state of the company, such as good, normal, or bad (performance is measured based on operating profit ratios in previous years). Their study revealed that a negative relationship runs between government ownership and Tobin’s Q for good and normal Japanese firms, while a positive association exists for the same for bad performing companies. Notably, unlike the private sector, the government neither pursues aggressive growth nor puts too much pressure on the management to improve their financial performance (Fukuda et al. 2018). With that being said, the higher the government’s shareholding inside the firm, the less well-performed the firm is. Thus, we take the following hypothesis.
Hypothesis 3 (H3).
Government ownership inhibits the performance of family firms.
2.4. Foreign Ownership and Firm Performance
Many studies have been conducted to examine the relationship between foreign ownership and the firms’ profitability. Firms with foreign ownerships are found to have better ROA than firms with higher domestic ownerships in Turkey (Aydin et al. 2007). A positive relationship between foreign ownership and profitability is also observed in a study of Tunisian firms (Moez et al. 2015). Likewise, a study on 663 non-financial listed firms on the Korea Stock Exchange from 2001 to 2017 revealed that foreign ownership enhances firms’ long-term growth rate, thus increasing firm value, indexed by Tobin’s Q (Choi and Park 2019). Moreover, foreign ownership can reduce agency costs because foreigners can use their expertise in monitoring management, thereby improving firms’ profitability (Choi and Park 2019).
As for Japanese firms, Fukuda et al. (2018) found a positive relationship between foreign shareholding and Tobin’s Q. Although Sueyoshi et al. (2010) found a similar result, they note that the influence of foreign shareholding on firm performance diminishes when the ratio of foreign shareholders increases to 19.49%. Yoshikawa and Rasheed (2010) considered the interaction effect of foreign ownership and ROE for the OTC market listed Japanese firms in the manufacturing industry and revealed that foreign investors influence family owners to improve firm performance. Hideaki et al. (2015) unearthed a significant positive association between foreign shareholding and Tobin’s Q for Japanese firms even after controlling the effect of various factors that may affect firm performance. By contrast, Kojima et al. (2017) found a negative relationship between foreign shareholdings and earnings quality.
We note that foreign investors can improve the performance of family firms in the following ways. First, foreign ownership does not just simply mean financial contribution but the transfer of knowledge, technology, innovations, and management expertise from foreign firms, which are essential to the growth of family firms. Second, foreign shareholders are often perceived as a catalyst for growth and change. If the domestic firm’s performance goes downhill, foreign firms can layout necessary efforts to adopt various strategies to improve the firm’s value. Third, foreign investors can play an essential role in disciplining managers of family firms, which are mostly recruited from family members without considering market talents.
However, foreign shareholders may easily ruin firm value if they leave firms during an economic slowdown. Another negative point is that foreigners may be biased in making investment decisions by choosing the firms based on their preferences, not by looking and carefully examining the firm’s performance. In that case, the higher stock returns or more top market-based indicators do not reflect the firm’s true performance. Instead, it only shows the investors’ biased preferences (Hideaki et al. 2015). Nonetheless, foreign investors are generally reported to have a positive effect on firm performance in previous literature. Thus, we take the following hypothesis.
Hypothesis 4 (H4).
Foreign ownership encourages the performance of family firms.
2.5. Board Size and Firm Performance
Extant literature shows inconclusive results for the link between board size and firm performance. Lorsch and Maclver (1989) point out that a larger board size hurts firm performance because it impedes faster decision-making. Besides, a large board size incurs higher coordination costs because of the arduous process of trying to reach a consensus amongst all board members. Empirical works also trace a significant negative relationship between large board size and firm performance in many countries (Eisenberg et al. 1998, for Finland; Mak and Kusnadi 2005, for Malaysia and Singapore; Naushad and Malik 2015, for Bangladesh; Aljifri and Moustafa 2007, for the United Arab Emirates). In the context of Japan, Hu and Izumida (2008) and Sueyoshi et al. (2010) found no significant relationship between board size and firm performance. Nonetheless, some scholars argue that a large board size can enhance board independence and diversity, thereby increasing firm performance (Ciftci et al. 2019, for Turkish firms; Jackling and Johl 2009, for Indian firms).
We argue that, for family firms, most of the board members are selected from family members who are expected to be free riders. Thus, the coordination problem arising from a larger board size would not be a severe issue for family firms. Instead, a larger board of directors could bring in more opinions from members of diverse backgrounds and enhance firm performance by improving strategic decision-making. Thus, we take the following hypothesis.
Hypothesis 5 (H5).
Board size encourages the performance of family firms.
2.6. Board Meeting and Firm Performance
A limited number of studies have been conducted so far to examine the relationship between board meetings and firm performance. Vafeas (1999) found a negative correlation between board meetings and firm value. He concluded that frequent board meetings can play an important role in enhancing firm performance because it helps to reduce the informational gap among the board members. Furthermore, Chou et al. (2013) traced a positive link between the frequency of board meetings and firm profitability for Taiwanese firms. They further noted that outside directors are less likely to attend board meetings for companies with a higher percentage of family ownership. However, a study on Columbian firms revealed no significant relationship between the number of board meetings and ROA or ROE (Gomez et al. 2017).
In the Japanese context, the board of directors in family firms usually consists of directors selected from their relatives or employees who have been with the company under the life-time employment scheme, implying that there is little to no fresh ideas and perspectives in the board. Therefore, for family firms, the traditional group thinking may dominate the entire discussion process, while innovation and breakthrough ideas would often be given away for conservatism. Nevertheless, the board meeting is considered to be an essential factor for promoting firm performance because frequent board meetings make everyone aligned about various issues faced by companies and resolve them smoothly and timely. Huse (2007) noted that a higher number of board meetings provide effective monitoring on the board and quickly reach a consensus in resolving corporate issues. On this basis, we take the following hypothesis.
Hypothesis 6 (H6).
Frequency in board meetings encourages the performance of family firms.
2.7. Board Independence and Firm Performance
Previous studies suggest that independent directors can improve a firm’s decision making by providing effective monitoring on the board (Jensen and Meckling 1976). Huson et al. (2001) revealed a positive relationship between independent directors and firm performance. Yasuhiro et al. (2016) found that boards dominated by insiders have a significant effect on low profitability and market valuation of Japanese firms. They noted that independent directors could guarantee and promote risk-taking action, thereby creating a significant positive impact on firm performance (both ROA and Tobin’s Q). Arikawa et al. (2017) unearthed that ROA and Tobin’s Q increase by 0.6% and 0.26%, respectively when outside directors increase by 29%. In addition, in examining 144 companies that appointed their first outside directors, Saito (2009) reported that the stock prices of these companies responded significantly positively, rising approximately 1.2% on average, and 1% at the median.
We note that family firms can receive valuable advice if they encourage more independent directors on the board. In Japan, many independent directors are found to be life-long employees who were hired to serve on the company’s board upon retirement. With such a long-term commitment, these independent directors are likely to direct the firm towards sustainable growth, not just for a short-term profit (Bauer et al. 2008). Therefore, we take the following hypothesis.
Hypothesis 7 (H7).
Board independence encourages the performance of family firms.
3. Research Methods
3.1. Definition of Family Firms
We classified a company as a family firm if it satisfied any of the five criteria: (a) run by a founder; (b) run by family members who hold important positions inside the company (such as Chairman, Vice Chairman, Chief Executive Officer); (c) controlled by family members who are on the top 10 shareholder list; (d) controlled by family members who account for 50% of the number of board members; and (e) owned by a privately held company. We adopted these criteria following previous studies on Japanese family firms (Yoshikawa and Rasheed 2010; Saito 2008; Morikawa 2013; Arikawa et al. 2017; Hideaki et al. 2018).
3.2. Sample Description
We applied the archival research method in which data was collected from various secondary sources. General and financial data were collected from OSIRIS (software version 213, a database managed by Bureau van Dijk, BvD). The search strategy was customized to look for all of the listed companies in the manufacturing industry in Japan. First of all, companies that were in operation in Japan were selected. Then, all companies in the manufacturing industry were chosen based on the North American Industry Classification System (NAICS). After the initial search, 1601 companies were identified as publicly listed Japanese companies in the manufacturing industry. Companies were grouped into 21 different sub-industry codes, depending on the nature of their business. These companies were then screened to see if they had sufficient data for analysis. We omitted 163 companies that lacked 5-year financial data and 26 companies that changed their industries during the study period 2014–2108. Accordingly, our sample firms reduced to 1412 publicly listed firms in the manufacturing industry, giving a sample size of 1412 × 5 = 7060 observations (n × T). We collected corporate governance data from Bloomberg. Table 1 lists out the number and percentage of family and non-family firms in each industry grouping.

Table 1.
Family and non-family manufacturing firms by North American Industry Classification System (NAICS) 2017 Code.
Table 1 reveals that family firms account for 39% of the manufacturing firms in Japan. The distribution in the number of family firms in the top five segments, such as computer and electronics (43%), chemicals (36%), machinery (40%), transportation equipment (32%), and food manufacturing (40%), is found to be relatively closer. For other segments, the distribution between family and non-family firms is found to be skewed. For example, ten firms out of twelve firms in furniture and related product manufacturing are found to be family firms. Likewise, only 10% of firms are seen to be family firms in petroleum and coal product manufacturing. Finally, the statistical data indicates that the presence of family firms in the Japanese manufacturing industry is strong, except for some variations. This also supports previous academic research that family ownership is an essential characteristic of Japanese firms.
3.3. Description of Variables
For dependent variables, we used both accounting (ROA) and market-based (Tobin’s Q) methods to measure firm performance. For test variables, we considered some ownership and board structure data available on Bloomberg. Moreover, we controlled several firm-specific variables to get robust estimates. Table 2 summarizes the list of variables together with their definitions and formulas.
Table 2.
List of variables.
3.4. Data Diagnosis
To ensure linearity and to avoid the outlier problem, we ran primary regression on the independent variables to obtain residuals and estimated values for dependent variables. We then plotted the residual and estimated values on the residual-versus-fitted graph to detect linearity. Then, we corrected the outlier problem by winsorizing data at 1% and 99% tails. After winsorizing, we had 7055 observations. Figure 1 confirms linearity after data winsorizing.
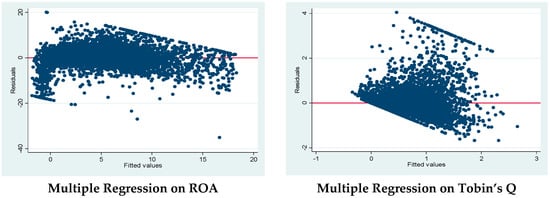
Figure 1.
Residual-versus-fitted plot after data winsorizing. Source: authors’ construction.
3.5. Econometric Model
We conducted a Hausman test to see whether the fixed effect or random effect model was suitable for regression. The test result yields a Chi-squared value of 391.42 with a 1% significance level and supports the use of the fixed-effect model. Accordingly, we ran the following fixed effect regression model.
where PERFORMANCE represents the dependent variables: ROA and Tobin’s Q. Variables such as SIZE, AGE, CFOP, and LEV are control variables defined in Table 2. Similarly, variables such as FAM, INS, GOV, FOR, BO-SIZE, BO_MEET, and BO_IND are the test variables defined in Table 2. We also include INS, GOV, and FOR as interaction with FAM to see their moderating effects on firm performance. Further, we square BO-SIZE and BO_MEET to see the non-linear relationship. β0 is the unknown intercept for each firm, and ε is the between-entity error.
PERFORMANCE = β0 + β1SIZE + β2AGE + β3CFOP + β4LEV + β5FAM + β6INS + β7GOV + β8FOR + β9BO_SIZE + β10BO_MEET + β11BO_IND + β12FAM*INS + β13FAM*GOV + β14FAM* FOR + β15BO_SIZESQ + β16BO_MEETSQ + ε
To ensure the consistency of our estimates, we also invoked the following random effect regression model.
where u is the between-entity error, and ε is the within-entity error. All other variables are the same as defined in Equation (1).
PERFORMANCE = β0 + β1SIZE + β2AGE + β3CFOP + β4LEV + β5FAM + β6INS + β7GOV + β8FOR + β9BO_SIZE + β10BO_MEET + β11 BO_IND + β12FAM*INS + β13FAM*GOV + β14FAM* FOR + β15BO_SIZESQ + β16BO_MEETSQ + u + ε
4. Results and Discussion
4.1. Descriptive Statistics
Table 3 and Table 4 provide descriptive statistics and mean comparison tests of the variables used in the study, respectively. As is observed in Table 3, family firms are found to perform better than the non-family firms in terms of Tobin’s Q and ROA. The mean values of family firms’ ROA (net income/total assets*100) and Tobin’s Q (market capitalization/total assets*100) are 5.092 and 0.774, respectively, as compared to 5.045 and 0.646 mean values of non-family firms, as shown in Table 3. Similarly, the median value of ROA (5.100) and Tobin’s Q (0.503) for family firms is higher than that of non-family firms, as shown in Table 4. However, the mean and median comparison tests (t-test and z-test) yield a significant difference between family and non-family firms in terms of Tobin’s Q, as shown in Table 4. The above results are consistent with previous literature, which points out that family firms tend to perform better than non-family firms (Chen et al. 2005; Saito 2008; Morikawa 2013; Dazai et al. 2016; Chen and Yu 2017).
Table 3.
Descriptive statistics.
Table 4.
Mean and median comparison between family and non-family firms.
Regarding the test variables, family firms have higher family ownership concentration than non-family firms because they are owned by founders or controlled by founding family members. On the other hand, family firms have a lower level of institution, government, and foreign ownership than non-family firms. The presence of institutional investors in family firms is around 15%, while it is about 17% in non-family firms. The government owns approximately a 1% share in family firms as opposed to nearly a 0.8% share in non-family firms. Besides, foreign owners tend to invest less in family firms with an average of a 2% equity stake compared to non-family firms with an average of a 3% share, as shown in Table 3.
As for board structure, family firms are found to have smaller board size, fewer board meetings, and fewer independent directors on the board than those of non-family firms. On average, board members in family firms consist of five persons, as compared to seven persons in non-family firms. For board meetings, family firms conduct about 7 sessions in a year, while it is 10 for their counterparts. For board independence, independent directors are found to be fewer in family firms with an average of 10 people against 15 people in non-family firms.
Concerning firm characteristics (control variables), non-family firms show higher market capitalization, a higher longevity level, better cash flow over operating revenue, and higher debt to equity ratio than family firms. The lower leverage ratio for family firms indicates fewer financial risks for them as compared to non-family firms. However, lower cash flow over operating revenue ratio for family firms suggests that they may encounter financial difficulties in expanding businesses. Overall, the univariate analysis presented in Table 3 and Table 4 indicates that there is a significant performance difference between Japanese family and non-family firms in terms of firm-specific characteristics, ownership structure, and board composition.
4.2. Correlation Matrix
Table 5 reports the results of the correlation between variables. The correlation coefficient between variables shows no multicollinearity problem except for BO_MEET with BO_SIZE (0.776), and GOV with FOR (0.761). While perfect multicollinearity is considered a serious problem, often signaling a logical error, imperfect multicollinearity (correlation coefficient nearly equals 1) may not be an error but just a feature or characteristic of data. Therefore, we do not drop these two variables for running the final regression.
Table 5.
Correlation matrix.
4.3. Regression Results
4.3.1. Family Ownership and Firm Performance
Table 6 reports the results of the fixed effect regression model for all firms, family firms, and non-family firms separately. In the case of all firms, Table 6 reveals that family ownership has a positive effect on Tobin’s Q at the 5% significance level. However, it shows a negative relationship with ROA. For family firms, family ownership tends to have a positive impact on Tobin’s Q, which is consistent with previous literature (Saito 2008, for Japan; Isakov and Weisskopf 2014, for Switzerland; Muttakin et al. 2015, for Bangladesh). However, we found that family ownership hurts ROA. Plausibly, this happens because family firms do not heavily focus on short-term profitability, which is reflected by ROA (Kapopoulos and Lazaretou 2007), to please third-party shareholders. Instead, they strive for long-term and sustainable growth, as opposed to non-family firms, to pass their wealth to future generations. It is worth noting that ROA and Tobin’s Q are different measures of firm performance. ROA is an accounting-based measure reflecting short-term performance, while Tobin’s Q is a market-based measure focusing on long-term growth. Thus, we may not always have consistent estimates. As for non-family firms, family ownership concentration does not exist, so no relationship is recorded. As a whole, we conclude that a significant positive connection runs between family ownership and firm performance, measured by Tobin’s Q (H1). For ROA, the hypothesis H1is rejected.
Table 6.
Fixed effect regression result.
4.3.2. Institutional Ownership and Firm Performance
We found a significant positive relationship between institutional ownership and firm performance, indexed by Tobin’s Q, for each group such as all firms, family firms, and non-family firms. This relationship becomes stronger and significant with ROA and Tobin’s Q when institutional ownership interacts with family ownership, implying that institutional shareholders can augment firm performance in family firms. There could be two possible explanations in this respect. First, family firms are likely to require more financial and technical knowledge from outside parties to manage the firms better. In that matter, institutional investors can advise and monitor family firms on various issues to foster performance in the short term (indicated by ROA). Non-family firms can take similar advantages from institutional investors to enhance profits temporarily. However, non-family firms are usually run and managed by managers coming from diverse backgrounds with strong business know-how. Thus, they are less likely to rely on advice from institutional shareholders to promote short-term profits. Instead, they seek consultation from institutional investors on strategic management, which has more impact on firms’ long-term performance (Tobin’s Q).
Second, institutional investors, such as banks and pension funds, demand more transparency in the board of management in disbursing funds. Unfortunately, family firms may not be perceived well by institutional investors to achieve the same level of transparency as non-family firms have. Thus, institutional investors can provide necessary advice and monitoring to the family firms to foster profits in the short term. As a whole, we found that a significant positive relationship exists between institutional ownership and firm performance, and family firms can enhance financial performance both in the short term and long term by increasing institutional ownership (H2).
4.3.3. Government Ownership and Firm Performance
We found that a significant and positive relationship runs between government ownership and performance of family firms, measured by ROA. For all firms, government ownership shows a positive impact on ROA, and a negative effect on Tobin’s Q, although none of them is significant. By contrast, a negative relationship is found to run between government ownership and firm performance in both measures of firm performance for non-family firms, but the effect is not significant. Notably, government ownership turns out to be negative for family firms when it interacts with family ownership, indicating that family firms can reap the benefits of government stakes up to a certain threshold level. In this tune, Fukuda et al. (2018) concluded that the effect of government ownership on firm performance varies depending on the state of the company. Good and normal companies are likely to possess a negative relationship between government ownership on firm performance, while bad companies have a positive association between the same (Fukuda et al. 2018). As the p-value of government ownership is found to be significant with ROA for family firms, we accept H3. However, we note that government ownership contributes to firm performance up to a certain threshold level.
4.3.4. Foreign Ownership and Firm Performance
We found a significant and positive connection between foreign ownership and the performance of family firms with ROA. A similar substantial and positive relationship was observed between foreign ownership and Tobin’s Q for non-family firms. This result is consistent with the findings of Yoshikawa and Rasheed (2010), Sueyoshi et al. (2010), and Fukuda et al. (2018), which reveal that foreign ownership improves Tobin’s Q for Japanese firms. Notably, we found that foreign ownership significantly enhances the performance of family firms (both ROA and Tobin’s Q) when it interacts with family ownership. This means that foreign investors, because of their expertise in overseas market operations, can monitor the company’s performance closely and provide necessary advice to improve the firm’s profit in the short term (ROA). Furthermore, family firms can take advantage of new knowledge, innovation, and management expertise brought by foreign shareholders to enhance profits in the long term (Tobin’s Q). In conclusion, there is evidence of a significant positive relationship between foreign ownership both for family and non-family firms (H4).
4.3.5. Board Size and Firm Performance
We did not find any significant relationship between board size and firm performance for family firms, although it has been significant and positive for non-family firms. The result corresponds to previous studies by Hu and Izumida (2008) and Sueyoshi et al. (2010) for Japan. Looking at the case of all firms, we found that a non-linear negative relationship exists between board size and firm performance, indicating that the increase in board members can hurt firm performance. However, we note that it depends on the complexity of companies’ structure, nature of the business, and economic goals. Finally, we do not accept H5 that a significant positive relationship exists between board size and performance of family firms (H5). However, H5 is accepted for non-family firms.
4.3.6. Board Meeting and Firm Performance
We did not find any significant relationship between board meetings and firm performance either for family or for non-family firms. This could lie in the fact that the board of directors in Japanese firms usually consists of directors selected from employees who have been with the company under the life-time employment scheme, implying that there are little to no fresh ideas and perspectives on the board. Therefore, the traditional group thinking may dominate the entire discussion process, while innovation and breakthrough ideas may be sacrificed against conservatism. Our result does not approve the findings by Huse (2007), which document that frequency of board meetings enhances firm performance by improving monitoring activities and resolving corporate issues. Moreover, we did not find that a non-linear relationship runs between the frequency of board meetings and firm performance. In conclusion, we reject H6 that a significant positive relationship runs between the number of board meetings and Tobin’s Q for family firms in Japan.
4.3.7. Board Independence and Firm Performance
As a whole, a negative relationship was traced between independent directors and firm performance. However, this negative effect was evidenced only with ROA for the case of family firms, and Tobin’s Q with non-family firms. This contradicts previous studies of Yasuhiro et al. (2016) and Arikawa et al. (2017) that report a positive relationship between independent directors and firm performance for Japanese firms. In our study, the average number of independent directors is 15.142 for non-family firms, and 10.941 for family firms. Possibly, too many independent directors may have a side effect on firm performance, as they kill time for communication and making decisions. Thus, the hypothesis (H7) is not approved. We also note that the optimal size of independent directors on the board is still a complicated matter, depending on various factors and firm characteristics, and requires further study.
As for control variables, factors such as firm size and cash flows from operating activities were found to be positively and significantly associated with Tobin’s Q of both family and non-family firms. By contrast, leverage tends to inhibit the performance of family and non-family firms in both the accounting-based (ROA) and market-based (Tobin’s Q) measures of firm performance. Table 7 summarizes our regression results for predefined hypotheses.
Table 7.
Summary of findings with hypotheses.
4.4. Robustness Test
Table 8 presents regression results from the random effect model after controlling for time and industry effects. The regression results on ROA and Tobin’s Q yield relatively consistent estimates with the regression results reported in the fixed-effect model. However, there are a few exceptions. For family firms, board independence that showed a significantly negative effect on ROA in the fixed-effect model disappears. Furthermore, foreign ownership appears to be a significant variable to improve the performance of all firms. In addition, institutional ownership, which showed no relationship with ROA in the fixed-effect model for family firms, turns out to be a significant and positive factor for the same.
Table 8.
Random effect regression results in controlling for time and industry effects.
4.5. Additional Analysis
To check the performance difference between different types of family firms, we did further analysis following the Saito (2008) approach. Accordingly, we separated the family firms into two groups: family firms run by founders and founding family members. The results are shown in Table 9. As Table 9 portrays, family firms run by the founder’s family members outperform the family firms run by founders concerning Tobin’s Q. This result is in line with the findings of Saito (2008). However, we found that family ownership reduces the performance of founder run family firms as far as the ROA is concerned, but Tobin’s Q does not evidence the same. By contrast, family ownership significantly improves the performance of family firms run by the founder’s descendants when Tobin’s Q is taken into account. However, such evidence is not pronounced with ROA. Similarly, factors such as institutional ownership and government shareholding encourage the performance of both types of family firms (founders and founders’ descendants).
Table 9.
Regression results for family firms run by founder and founding family members (fixed-effect model).
However, as opposed to the firms run by founders’ family members, foreign ownership is not found to be a significant factor for firms run by founders. This means that firms run by founders’ descendants can utilize foreign shareholdings to boost firm performance following Japan’s recent financial policy that encourages foreign ownership. Besides, we found that factors such as board independence and board meetings appear to be the significant factors for inhibiting the performance of firms run by founders’ descendants. In contrast, such evidence is not pronounced for family firms run by founders. Moreover, we did not find any significant performance differences between these two types of family firms for the remaining cases.
Finally, we note that family firms run by founding family members tend to perform better over the family firms run by founders. Furthermore, foreign ownership encourages the performance of firms run by the founders’ descendants. However, we note that further studies incorporating management strategies are required to reveal the performance difference between these two groups of family firms. Moreover, more studies with longer time and multiple angles are warranted to generalize our findings.
5. Conclusions
In this paper, we sought to compare the performance difference between family and non-family firms in the Japanese manufacturing industry from the perspective of corporate governance utilizing data of 1412 companies over the period 2014–2018. The sample size consisted of 861 non-family firms and 551 family firms. We investigated how the two mainsprings of corporate governance, namely ownership structure and board structure, influence the firm performance measured by ROA and Tobin’s Q.
Our univariate analysis indicated that both family and non-family firms differ significantly in terms of ownership structure, board structure, and firm performance. We found that family firms outperformed non-family firms in terms of the mean values of ROA and Tobin’s Q when the univariate analysis was invoked. Furthermore, the mean and median comparison tests (t-test and z-test) yield that family firms have higher performance than non-family firms with Tobin’s Q, in particular. We note that this may happen because family firms’ top priority is to seek sustainable growth as they want to pass their wealth to future generations, not on pleasing their shareholders in the short term (ROA).
For ownership structure, family firms are found to be less diversified than non-family firms, indicated by the lower percentage of the institution, government, and foreign shareholding, and less transparent in terms of having higher family ownership concentration. In terms of board structure, family firms have a small board size, fewer board meetings, and fewer independent directors on the board than non-family firms. The lower value of board-related characteristics does not necessarily indicate that the board of family firms is worse than that of non-family firms. It is likely due to the difference in size, the company’s organizational structure, and the complexity of the firm’s business.
Our multivariate analysis shows that family ownership has a significant positive impact on Tobin’s Q. However, family ownership negates firm performance when ROA is taken into account. We note that this may happen because the management of family firms is more interested in improving the long-term growth of the firm, not to increase the short-term gain to please their shareholders.
Regarding the effects of governance elements on firm performance, we found that institutional shareholding appears to be a significant and positive factor for promoting the performance of both family and non-family firms as far as Tobin’s Q is concerned. Moreover, board size encourages the performance of non-family firms, while such influence was not observed for family firms. In terms of ROA, foreign ownership inspires the performance of both family and non-family firms. However, the effect of foreign ownership was more noticeable for family firms, indicating that family firms can benefit more from foreign investors as they can bring in more radical changes to the firms. Furthermore, government ownership stimulates the performance of family firms up to a certain threshold level, while board independence significantly negates the same. Besides, we found that the performance of family firms run by the founder’s descendants is superior to that of family firms run by the founder. As a whole, the study confirms previous findings that family firms outperform non-family firms in the Japanese context using Tobin’s Q and ROA measures. Simultaneously, the study outlines some governance factors that are instrumental in improving firm performance and policymaking as well.
However, this study is not free from certain limitations. We only studied governance variables available with Bloomberg. The inclusion of more governance factors with a longer time may hurt our results. Moreover, we did not investigate the management strategies adopted by different types of family firms, which might have an impact on the performance difference between firms. Moreover, a study on the link between corporate social responsibility and performance of different types of family firms in Japan may add value to the literature of family firms.
Author Contributions
Data curation, L.T.; Funding acquisition, K.K.; Investigation, L.T.; Methodology, B.K.A.; Project administration, K.K.; Writing—original draft, B.K.A.; Writing—review & editing, K.K. All authors have read and agreed to the published version of the manuscript.
Funding
This research received no external funding.
Acknowledgments
This study is the outcome of JSPS Grant-in-Aid No. 18H00901, Type B, received from the Ministry of Education, Culture, Sports, Science and Technology, Japan for the financial year 2018–2020 to research “Governance and Performance of Family Firms and Non-Family Firms in Japan-A Comparative Study”.
Conflicts of Interest
The authors declare no conflict of interest.
References
- Achleitner, Ann-Kristin, Nina Günther, Christoph Kaserer, and Gianfranco Siciliano. 2014. Real Earnings Management and Accrual-based Earnings Management in Family Firms. European Accounting Review 23: 431–61. [Google Scholar] [CrossRef]
- Ahmad, Rubi, Huson Aliahmed, and Nazrul Razak. 2008. Government Ownership and Performance: An Analysis of Listed Companies in Malaysia. Corporate Ownership and Control 6: 434–42. [Google Scholar] [CrossRef]
- Ahmad, Maqbool, Nam Baek, Wan Dae, and Abbas Shah. 2019. The Impact of Institutional Ownership on Firm’s Performance Evidence from Pakistan. The Journal of Asian Studies 22: 27–48. [Google Scholar] [CrossRef]
- Alfaraid, Mishari, Faisal Alanezi, and Hesham Almujamed. 2012. The Influence of Institutional and Government Ownership on Firm Performance: Evidence from Kuwait. International Business Research 5: 192–200. [Google Scholar]
- Aljifri, Khaled, and Mohamed Moustafa. 2007. The Impact of Corporate Governance Mechanisms on the Performance of UAE Firms: An Empirical Analysis. Journal of Economic and Administrative Sciences 23: 71–93. [Google Scholar] [CrossRef]
- Allouche, Jose, Bruno Amann, Jacques Jaussaud, and Toshiki Kurashina. 2008. The Impact of Family Control on the Performance and Financial Characteristics of Family Versus Nonfamily Businesses in Japan: A Matched-pair Investigation. Family Business Review 21: 315–29. [Google Scholar] [CrossRef]
- Alnajjar, Dana. 2015. The Effect of Institutional Ownership on Firm Performance: Evidence from Jordanian Listed Firms. International Journal of Economics and Finance 7: 97–105. [Google Scholar] [CrossRef]
- Anderson, Ronald, and David Reeb. 2003. Founding-family ownership and firm performance: Evidence from the S&P 500. Journal of Finance 58: 1301–28. [Google Scholar]
- Arikawa, Yasuhiro, Inoue Kotaro, and Saito Takuji. 2017. Corporate Governance, Employment Laws, and Corporate Performance in Japan: An international perspective. Tokyo Institute of Technology 9: 1–34. [Google Scholar]
- Aydin, Nurhan, Mustafa Sayim, and Abdullah Yalama. 2007. Foreign Ownership and Firm Performance: Evidence from Turkey. International Research Journal of Finance and Economics 11: 102–110. [Google Scholar]
- Bauer, Rob, Bart Frijns, Roger Otten, and Alireza Tourani-Rad. 2008. The impact of corporate governance on corporate performance: Evidence from Japan. Pacific-Basin Finance Journal 16: 236–51. [Google Scholar] [CrossRef]
- Blanco-Mazagatos, Virginia, Esther Quevedo-Puente, and Juan Delgado-García. 2018. Human resource practices and organizational human capital in the family firm: The effect of generational stage. Journal of Business Research 84: 337–48. [Google Scholar] [CrossRef]
- Charfeddine, Lanouar, and Abdelaziz Elmarzougui. 2011. Institutional Ownership and Firm Performance: Evidence from France. The IUP Journal of Behavioral Finance 7: 36–46. [Google Scholar]
- Chen, L.-Wen, and Hsin-Yi Yu. 2017. Corporate governance, political involvement, and internationalization: An empirical investigation in Japan and Taiwan. Research in International Business and Finance 39: 640–55. [Google Scholar] [CrossRef]
- Chen, Zhilan, Yan-Leung Cheung, Aris Stouraitis, and Anita Wong. 2005. Ownership concentration, firm performance, and dividend policy in Hong Kong. Pacific-Basin Finance Journal 13: 431–49. [Google Scholar] [CrossRef]
- Choi, Young, and Kunsu Park. 2019. Foreign Ownership, Agency Costs, and Long-Term Firm Growth: Evidence from Korea. Journal of Sustainability 11: 1–17. [Google Scholar]
- Chou, Hsin-I., Huimin Chung, and Xiangkang Yin. 2013. Attendance of Board Meetings and Company Performance: Evidence from Taiwan. Journal of Banking and Finance 37: 4157–71. [Google Scholar] [CrossRef]
- Chu, Wenyi. 2011. Family ownership and firm performance: Influence of family management, family control, and firm size. Asia Pacific Journal of Management 28: 833–51. [Google Scholar] [CrossRef]
- Ciftci, IIhan, Ekrem Tatoglu, Geoffrey Wood, Mehmet Demirbag, and Selim Zaim. 2019. Corporate governance and firm performance in emerging markets: Evidence from Turkey. International Business Review 28: 90–103. [Google Scholar] [CrossRef]
- Dalton, Dan, Catherine Daily, Alan Ellstrand, and Jonathan Johnson. 1998. Meta-analytic reviews of board composition, leadership structure, and financial performance. Strategic Management Journal 19: 269–90. [Google Scholar] [CrossRef]
- Dau, Luis Alfanso, Saptarshi Purkayastha, and Kimberly Eddleston. 2018. Who does it best? Family and non-family owners and leaders navigating institutional development in emerging markets. Journal of Business Research. [Google Scholar] [CrossRef]
- Dazai, Hokuto, Takuji Saito, Zenichi Shishido, and Noriyuki Yanagawa. 2016. Japanese Corporate Governance from the Perspective of Family Firms. SSRN Electronic Journal. Available online: https://papers.ssrn.com/sol3/papers.cfm?abstract_id=2811069 (accessed on 11 January 2020).
- Eisenberg, Theodore, Stefan Sundgren, and Martin Wells. 1998. Larger board size and decreasing firm value in small firms. Journal of Financial Economics 48: 35–54. [Google Scholar] [CrossRef]
- Filatotchev, Igor, Yung-Chih Lien, and Jenifer Piesse. 2005. Corporate governance and performance in publicly listed, familycontrolled firms: Evidence from Taiwan. Asia Pacific Journal of Management 22: 257–83. [Google Scholar] [CrossRef]
- Fukuda, Shin-Ichi, Munehisa Kasuya, and Jouchi Nakajima. 2018. The role of corporate governance in Japanese unlisted companies. Japan and the World Economy 47: 27–39. [Google Scholar] [CrossRef]
- Gomez, Jorge, Diogenes Lagos, and Gonzalo Betancourt. 2017. Effect of the Board of Directors on Firm Performance. International Journal of Economic Research 14: 349–61. [Google Scholar]
- Hansen, Christopher, and Joern Block. 2020. Exploring the relation between family involvement and firms financial performance: A replication and extension analysis. Journal of Business Venturing Insights 13: 1–21. [Google Scholar] [CrossRef]
- Hasso, Tim, and Keith Duncan. 2013. Valuation of Family Firms: The Limitations of Accounting Information. Australian Accounting Review 23: 135–50. [Google Scholar] [CrossRef]
- Herrera-Echeverri, Hernan, Josse Geleilate, Sandra Gaitan-Riano, Jerry Haar, and Nidia Soto-Echeverry. 2016. Export behavior and board independence in Colombian family firms: The reverse causality relationship. Journal of Business Research 69: 2018–29. [Google Scholar] [CrossRef]
- Hideaki, Miyajima, Hoda Takaaki, and Ogawa Ryo. 2015. Does Ownership Really Matter? The Role of Foreign Investors in Corporate Governance in Japan. The Research Institute of Economy, Trade and Industry Discussion Paper Series 15: 1–41. [Google Scholar]
- Hideaki, Miyajima, Ryo Ogawa, and Takuji Saito. 2018. Changes in corporate governance and top executive turnover: The evidence from Japan. Journal of the Japanese and International Economies 47: 17–31. [Google Scholar]
- Hu, Yabei, and Shigemi Izumida. 2008. Ownership Concentration and Corporate Performance: A Causal Analysis with Japanese Panel Data. Corporate Governance 16: 342–58. [Google Scholar] [CrossRef]
- Huse, Morten. 2007. Boards, Governance and Value Creation: The Human Side of Corporate Governance. Cambridge: Cambridge University Press. [Google Scholar]
- Huson, Mark, Robert Parrino, and Laura Starks. 2001. Internal Monitoring Mechanisms and CEO Turnover: A Long-Term Perspective. The Journal of Finance 56: 2265–97. [Google Scholar] [CrossRef]
- Isakov, Dusan, and Jean-Philippe Weisskopf. 2014. Are Founding Families Special Block-holders?—An Investigation of Controlling Shareholder Influence on Firm Performance. Journal of Banking and Finance 41: 1–16. [Google Scholar] [CrossRef]
- Jackling, Beverley, and Shireenjit Johl. 2009. Board structure and firm performance: Evidence from India’s top companies. Corporate Governance: International Review 17: 492–509. [Google Scholar] [CrossRef]
- Jensen, Michael, and William Meckling. 1976. Theory of the firm: Managerial behavior, agency costs and ownership structure. Journal of Financial Economics 3: 305–60. [Google Scholar] [CrossRef]
- Kallmuenzer, Andreas. 2015. Agency Theory and the Family Business. In Theoretical Perspectives on Family Businesses. Edited by Mattias Nordqvist, Leif Melin, Matthias Waldkirch and Gershon Kumeto. Cheltenham: Edward Elgar Publishing, pp. 58–77. [Google Scholar]
- Kapopoulos, Panayotis, and Sophia Lazaretou. 2007. Corporate Ownership Structure and Firm Performance: Evidence from Greek firms. Corporate Governance: An International Review 15: 144–58. [Google Scholar] [CrossRef]
- Kojima, Koji, Bishnu Kumar Adhikary, and Ranjan Kumar Mitra. 2017. Does equity holding by main banks affect the earnings quality of client firms? Empirical Evidence from Japan. Journal of Multinational Financial Management 42–43: 56–73. [Google Scholar] [CrossRef]
- Lorsch, Jay, and Elizabeth Maclver. 1989. Pawns or Potentates: The Reality of America’s Corporate Boards. Boston: Harvard University Press. [Google Scholar]
- Mak, Yuen Teen, and Yuanto Kusnadi. 2005. Size really matters: Further evidence on the negative relationship between board size and firm value. Pacific-Basin Finance Journal 13: 301–18. [Google Scholar] [CrossRef]
- McConaughy, Daniel, and Michael Phillips. 1999. Founders versus descendants: The profitability, efficiency, growth characteristics and financing in large, public, founding-family-controlled firms. Family Business Review 12: 123–31. [Google Scholar] [CrossRef]
- Miller, Danny, Isabelle Le Breton-Miller, Richard Lester, and Albert Cannella. 2007. Are family firms really superior performers? Journal of Corporate Finance 13: 829–58. [Google Scholar] [CrossRef]
- Mizuno, Mitsuru, and Hajime Shimizu. 2015. The Influence of Institutional Investors on Corporate Governance and Firm Performance: Evidence from Japan. Kindai Management Review 3: 75–89. [Google Scholar]
- Moez, Dabboussi, Kouki Marouan, and Rajhi Mohammad Tahar. 2015. Does Foreign Ownership Influence Firm Profitability? Evidence from the Tunisian Context. International Journal of Economics and Finance 7: 159–67. [Google Scholar] [CrossRef]
- Morikawa, Masayuki. 2013. Productivity and survival of family firms in Japan. Journal of Economics and Business 70: 111–25. [Google Scholar] [CrossRef]
- Muttakin, Mohammad Badrul, Arifur Khan, and Nava Subramaniam. 2014. Family firms, Family generation and firm performance: Evidence from an emerging economy. Journal of Accounting in Emerging Economics 4: 197–219. [Google Scholar] [CrossRef]
- Muttakin, Mohammad Badrul, Reza Monem, Arifur Khan, and Nava Subramaniam. 2015. Family firms, firm performance and political connections: Evidence from Bangladesh. Journal of Contemporary Accounting and Economics 11: 215–30. [Google Scholar] [CrossRef]
- Naushad, Mohammad, and Syed Abdul Malik. 2015. Corporate governance and bank performance: A study of selected banks in GCC Region. Asian Social Science 11: 226–34. [Google Scholar] [CrossRef]
- Ngo, My Tram, Walter Nonneman, and Ann Jorisen. 2014. Government Ownership and Firm Performance: The Case of Vietnam. International Journal of Economics and Financial Issues 4: 628–50. [Google Scholar]
- Razzaque, Rushdi, Muhammad Jahangir Ali, and Paul Mather. 2020. Corporate governance reform and family firms: Evidence from an emerging economy. Pacific-Basin Finance Journal 59: 1–21. [Google Scholar] [CrossRef]
- Saito, Takuji. 2008. Family Firms and Firm Performance: Evidence from Japan. Waseda Institute for Advanced Study Discussion Paper 2007: 1–46. [Google Scholar] [CrossRef]
- Saito, Takuji. 2009. Why Outside Directors in Japan are not Prevalent. Research Institute of Economy Trade and Industry. Available online: https://www.rieti.go.jp/jp/projects/cgp/16.html (accessed on 11 January 2020).
- Sharma, Pramodita. 2004. An overview of the field of family business studies: Current status and directions for the future. Family Business Review 17: 1–36. [Google Scholar] [CrossRef]
- Srivastava, Aman, and Shikha Bhatia. 2020. Influence of family ownership and governance on performance: Evidence from India. Global Business Review, 1–19. [Google Scholar] [CrossRef]
- Sueyoshi, Toshiyuki, Mika Goto, and Yusuke Omi. 2010. Corporate governance and firm performance: Evidence from Japanese manufacturing industries after the lost decade. European Journal of Operational Research 203: 724–36. [Google Scholar] [CrossRef]
- Sun, Qian, Wilson Tong, and Jing Tong. 2002. How Does Government Ownership Affect Firm Performance? Evidence from China’s Privatization Experience. Journal of Business Finance and Accounting 29: 1–27. [Google Scholar] [CrossRef]
- Vafeas, Nikos. 1999. Board Meeting Frequency and Firm Performance. Journal of Financial Economics 53: 113–42. [Google Scholar] [CrossRef]
- Yasuhiro, Arikawa, Inoue Kotaro, and Saito Takuji. 2016. Corporate Governance, Employment Laws, and Corporate Performance in Japan: An International Perspective. Tokyo Institute of Technology Working Paper No. 2016-9. Tokyo: Tokyo Institute of Technology. [Google Scholar]
- Yoshikawa, Toru, and Abdul Rasheed. 2010. Family control and ownership monitoring in family-control firms in Japan. Journal of Management Studies 47: 274–95. [Google Scholar] [CrossRef]
© 2020 by the authors. Licensee MDPI, Basel, Switzerland. This article is an open access article distributed under the terms and conditions of the Creative Commons Attribution (CC BY) license (http://creativecommons.org/licenses/by/4.0/).