Determining Force behind Value Premium: The Case of Financial Leverage and Operating Leverage


Abstract
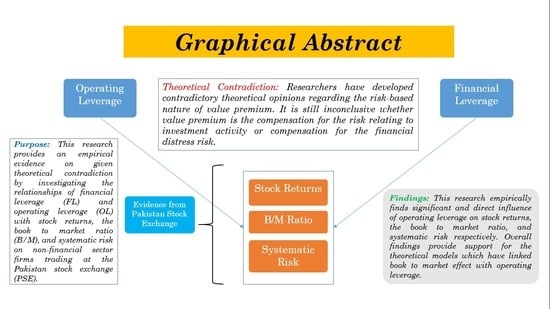
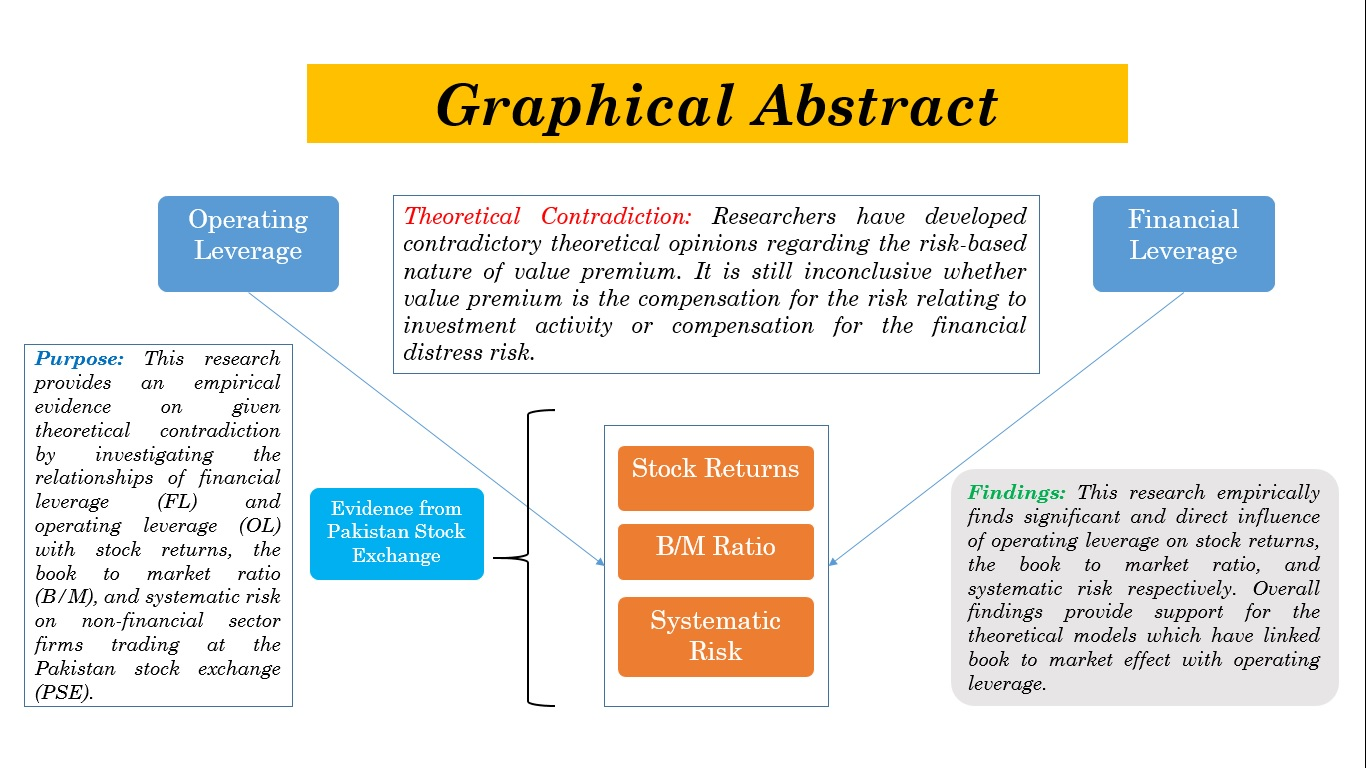
1. Introduction
2. Hypothesis Development
2.1. Operating Leverage and Value Premium
2.2. Financial Leverage and Value Premium
3. Research Method
3.1. Data
3.2. Variable Measurement
3.2.1. Stock Returns, Firm Size, and B/M Ratio
3.2.2. Degree of Operating Leverage and Degree of Financial Leverage
3.2.3. Systematic Risk (Beta)
3.2.4. Alternative Measures for Robustness
3.2.5. Control Variables
3.3. Empirical Design and Estimation Technique
3.3.1. Stock Return as Dependent Variable
- (i)
- In the first model, individual stock returns ( are regressed on operating leverage , financial leverage , market capitalization , systematic risk , sale growth (), price to earnings ratio (, and earning per share (). This model has been used to find significant factors affecting the returns on the firm’s stocks. Specifically, the purpose is to analyze the hypothesized relationship of stock returns with the DOL, DFL, and systematic risk.
- (ii)
- For the robustness, we also use second structure of this model in which alternative variables for stock returns are used. In this version of the model, average monthly stock returns are used as dependent variable and these average monthly stock returns are regressed on the same independent variables from the first structure which includes operating leverage , financial leverage , market capitalization , systematic risk , sale growth (), price to earnings ratio , and earning per share ().
- (iii)
- Then, in the third phase, alternative variables for DOL and DFL are used. In this structure, annual stock returns are regressed on the same independent variables but with alternative point-to-point measures of both leverages which are and
- (iv)
- In the last structure, a model is estimated using alternative proxies of both dependent and independent variables. Here, average of monthly stock returns are regressed on point-to-point measures of operating and financial leverages along with other independent variables.
3.3.2. Book to Market Ratio as Dependent Variable
3.3.3. Systematic Risk of Portfolios as a Dependent Variable
3.3.4. Estimation Techniques
4. Results and Discussion
4.1. Descriptive Analysis
4.2. Multivariate Regression Analysis
5. Conclusions
Author Contributions
Funding
Acknowledgments
Conflicts of Interest
References
- Berk, Jonathan B., Richard C. Green, and Vasant Naik. 1999. Optimal investment, growth options, and security returns. The Journal of Finance 54: 1553–607. [Google Scholar] [CrossRef]
- Bowman, Robert G. 1979. The theoretical relationship between systematic risk and financial (accounting) variables. The Journal of Finance 34: 617–30. [Google Scholar] [CrossRef]
- Campbell, John Y., Jens Hilscher, and Jan Szilagyi. 2008. In search of distress risk. The Journal of Finance 63: 2899–939. [Google Scholar] [CrossRef]
- Cao, Viet Nga. 2015. What explains the value premium? The case of adjustment costs, operating leverage and financial leverage. Journal of Banking & Finance 59: 350–66. [Google Scholar]
- Carlson, Murray, Adlai Fisher, and Ron Giammarino. 2004. Corporate Investment and Asset Price Dynamics: Implications for the Cross-section of Returns. The Journal of Finance 59: 2577–603. [Google Scholar] [CrossRef]
- Chen, Nai-fu, and Feng Zhang. 1998. Risk and Return of Value Stocks. The Journal of Business 71: 501–35. [Google Scholar] [CrossRef]
- Cooper, Ilan. 2006. Asset pricing implications of nonconvex adjustment costs and irreversibility of investment. The Journal of Finance 61: 139–70. [Google Scholar] [CrossRef]
- Daniel, Kent, and Sheridan Titman. 1997. Evidence on the characteristics of cross sectional variation in stock returns. The Journal of Finance 52: 1–33. [Google Scholar] [CrossRef]
- Darrat, Ali F., and Tarun K. Mukherjee. 1995. Inter-industry differences and the impact of operating and financial leverages on equity risk. Review of Financial Economics 4: 141–55. [Google Scholar] [CrossRef]
- Fama, Eugene F., and Kenneth R. French. 1992. The cross-section of expected stock returns. The Journal of Finance 47: 427–65. [Google Scholar] [CrossRef]
- Fama, Eugene F., and Kenneth R. French. 1993. Common risk factors in the returns on stocks and bonds. Journal of Financial Economics 33: 3–56. [Google Scholar] [CrossRef]
- Fama, Eugene F., and Kenneth R. French. 1995. Size and book-to-market factors in earnings and returns. The Journal of Finance 50: 131–55. [Google Scholar] [CrossRef]
- Fama, Eugene F., and Kenneth R. French. 1996. Multifactor explanations of asset pricing anomalies. The Journal of Finance 51: 55–84. [Google Scholar] [CrossRef]
- Fama, Eugene F., and Kenneth R. French. 2015. A five-factor asset pricing model. Journal of Financial Economics 116: 1–22. [Google Scholar] [CrossRef]
- Fama, Eugene F., and James D. MacBeth. 1973. Risk, return, and equilibrium: Empirical tests. The Journal of Political Economy 81: 607–36. [Google Scholar] [CrossRef]
- Fong, Wai Mun. 2012. Do expected business conditions explain the value premium? Journal of Financial Markets 15: 181–206. [Google Scholar] [CrossRef]
- García-Feijóo, Luis, and Randy D. Jorgensen. 2010. Can operating leverage be the cause of the value premium? Financial Management 39: 1127–54. [Google Scholar] [CrossRef]
- Gulen, Huseyin, Yuhang Xing, and Lu Zhang. 2011. Value versus Growth: Time-Varying Expected Stock Returns. Financial Management 40: 381–407. [Google Scholar] [CrossRef]
- Guthrie, Graeme. 2013. A value premium without operating leverage. Finance Research Letters 10: 1–11. [Google Scholar] [CrossRef]
- Hamada, Robert S. 1972. The effect of the firm’s capital structure on the systematic risk of common stocks. The Journal of Finance 27: 435–52. [Google Scholar] [CrossRef]
- Hassan, Arshad, and Muhammad Tariq Javed. 2011. Size and value premium in Pakistani equity market. African Journal of Business Management 5: 6747–55. [Google Scholar]
- Hausman, Jerry A. 1978. Specification tests in econometrics. Econometrica: Journal of the Econometric Society 1: 1251–71. [Google Scholar] [CrossRef]
- Ho, Yew Kee, Zhenyu Xu, and Chee Meng Yap. 2004. R&D investment and systematic risk. Accounting& Finance 44: 393–418. [Google Scholar]
- Hou, Kewei, Chen Xue, and Lu Zhang. 2015. Digesting anomalies: An investment approach. The Review of Financial Studies 28: 650–705. [Google Scholar] [CrossRef]
- Huffman, Lucy. 1983. Operating leverage, financial leverage, and equity risk. Journal of Banking & Finance 7: 197–212. [Google Scholar]
- Iqbal, Javed, and Robert Brooks. 2007. Alternative beta risk estimators and asset pricing tests in emerging markets: The case of Pakistan. Journal of Multinational Financial Management 17: 75–93. [Google Scholar] [CrossRef]
- Javid, Attiya Yasmin. 2009. Test of higher moment capital asset pricing model in case of Pakistani equity market. European Journal of Economics, Finance and Administrative Studies 15: 144–62. [Google Scholar]
- Javid, Attiya Y., and Eatzaz Ahmed. 2008. The Conditional Capital Asset Pricing Model: Evidence from Karachi Stock Exchange. Islamabad: Pakistan Institute of Development Economics, vol. 48. [Google Scholar]
- Khan, Faisal, Shahid Ali, and Arshad Hassan. 2012. Size, leverage and stocks returns: Evidence from Pakistan. International Journal of Academic Research 4: 24–33. [Google Scholar]
- Lakonishok, Josef, Andrei Shleifer, and Robert W. Vishny. 1994. Contrarian investment, extrapolation, and risk. The Journal of Finance 49: 1541–78. [Google Scholar] [CrossRef]
- Lev, Baruch. 1974. On the association between operating leverage and risk. Journal of Financial and Quantitative Analysis 9: 627–41. [Google Scholar] [CrossRef]
- Levin, Andrew, Chien-Fu Lin, and Chia-Shang James Chu. 2002. Unit root tests in panel data: Asymptotic and finite-sample properties. Journal of Econometrics 108: 1–24. [Google Scholar] [CrossRef]
- Li, Rong-Jen, and Glenn V. Henderson, Jr. 1991. Combined leverage and stock risk. Quarterly Journal of Business and Economics 30: 18–39. [Google Scholar]
- Light, Nathaniel, Denys Maslov, and Oleg Rytchkov. 2017. Aggregation of information about the cross section of stock returns: A latent variable approach. The Review of Financial Studies 30: 1339–81. [Google Scholar] [CrossRef]
- Ljungqvist, Alexander, and William J. Wilhelm, Jr. 2005. Does prospect theory explain IPO market behavior? The Journal of Finance 60: 1759–90. [Google Scholar] [CrossRef]
- Lord, Richard A. 1996. The impact of operating and financial risk on equity risk. Journal of Economics and Finance 20: 27–38. [Google Scholar] [CrossRef]
- Mandelker, Gershon N., and S. Ghon Rhee. 1984. The impact of the degrees of operating and financial leverage on systematic risk of common stock. Journal of Financial and Quantitative Analysis 19: 45–57. [Google Scholar] [CrossRef]
- McLean, R. David, and Jeffrey Pontiff. 2016. Does academic research destroy stock return predictability? The Journal of Finance 71: 5–32. [Google Scholar] [CrossRef]
- Melicher, Ronald W. 1974. Financial factors which influence beta variations within an homogeneous industry environment. Journal of Financial and Quantitative Analysis 9: 231–41. [Google Scholar] [CrossRef]
- Mirza, Nawazish, and Saima Shahid. 2008. Size and Value Premium in Karachi Stock Exchange. Lahore Journal of Economics 13: 1–26. [Google Scholar] [CrossRef]
- Modigliani, Franco, and Merton H. Miller. 1958. The cost of capital, corporation finance and the theory of investment. The American Economic Review 48: 261–97. [Google Scholar]
- Modigliani, Franco, and Merton H. Miller. 1963. Corporate income taxes and the cost of capital: A correction. The American Economic Review 53: 433–43. [Google Scholar]
- Novy-Marx, Robert. 2011. Operating Leverage. Review of Finance 15: 103–34. [Google Scholar] [CrossRef]
- Obreja, Iulian. 2013. Book-to-market equity, financial leverage, and the cross-section of stock returns. The Review of Financial Studies 26: 1146–89. [Google Scholar] [CrossRef]
- Ozdagli, Ali K. 2012. Financial leverage, corporate investment, and stock returns. The Review of Financial Studies 25: 1033–69. [Google Scholar] [CrossRef]
- Rubinstein, Mark E. 1973. A mean-variance synthesis of corporate financial theory. The Journal of Finance 28: 167–81. [Google Scholar] [CrossRef]
- Shah, Tanveer Ahmad, and Syed Muhammad Amir. 2017. The Value-Growth Indicators and Value Premium: Evidence from Pakistan Stock Exchange. South Asian Journal of Management Sciences (SAJMS), Iqra University 11: 124–39. [Google Scholar]
- Sharpe, William F. 1964. Capital asset prices: A theory of market equilibrium under conditions of risk. The Journal of Finance 19: 425–42. [Google Scholar]
- Wu, Mengyun, Muhammad Imran, Yanhua Feng, Linrong Zhang, and Muhammad Abbas. 2017. Review and validity of capital asset pricing model: Evidence from Pakistan stock exchange. International Research in Economics and Finance 1: 21. [Google Scholar] [CrossRef]
- Zhang, Lu. 2005. The value premium. The Journal of Finance 60: 67–103. [Google Scholar] [CrossRef]

| Variables | Mean | Median | Maximum | Minimum | Std. Deviation |
|---|---|---|---|---|---|
| R | 0.0475 | 0.0081 | 2.2892 | −1.9196 | 0.5926 |
| Beta (β) | 0.622 | 0.6389 | 6.0704 | −3.265 | 0.6812 |
| LnDOL | 0.8497 | 0.3934 | 8.8445 | −5.5825 | 2.0657 |
| LnDFL | −0.3958 | −0.3876 | 4.6303 | −63.9016 | 3.4128 |
| LnME | 20.7717 | 20.8678 | 26.533 | 14.691 | 2.3291 |
| LnB/M | −0.9966 | −1.1709 | 3.6497 | −4.372 | 1.5613 |
| LnSG | 0.4844 | 0.4837 | 2.8848 | −0.6931 | 0.2568 |
| LnEPS | 5.0667 | 5.0524 | 5.9245 | −2.9135 | 0.2963 |
| LnP/E | 7.3726 | 7.3716 | 9.6478 | 1.0629 | 0.2488 |
| Beta () | 0.9545 | 0.9649 | 1.3762 | −0.2007 | 0.1578 |
| LnDOLp | 1.6985 | 1.351 | 7.4606 | −1.406 | 1.7733 |
| LnDFLp | 0.3557 | −0.0199 | 3.3242 | −2.4058 | 1.2151 |
| LnMEp | 20.7194 | 20.6828 | 23.4024 | 16.5327 | 1.5443 |
| (i) | |||||||||
| R | BETA (β) | LNDOL | LNDFL | LNME | LNB/M | LNSG | LNEPS | LNP/E | |
| R | 1 | ||||||||
| BETA (β) | 0.0844 | 1 | |||||||
| LNDOL | −0.0226 | 0.0028 | 1 | ||||||
| LNDFL | 0.0123 | −0.0228 | −0.069 | 1 | |||||
| LNME | 0.122 | 0.2127 | −0.2552 | 0.1147 | 1 | ||||
| LNB/M | −0.2352 | −0.1003 | 0.3698 | −0.1096 | −0.7837 | 1 | |||
| LNSG | 0.0422 | 0.0551 | −0.1104 | −0.0138 | 0.0601 | −0.0372 | 1 | ||
| LNEPS | 0.0747 | 0.0776 | −0.1343 | 0.0188 | 0.2662 | −0.3072 | 0.1317 | 1 | |
| LNP/E | 0.0544 | 0.0294 | 0.0231 | −0.1055 | −0.0269 | −0.0097 | −0.0021 | 0.0041 | 1 |
| (ii) | |||||||||
| LNβp | LNDPLp | LNDFLp | LNMEp | ||||||
| 1 | |||||||||
| LNDOLp | −0.1010 | 1 | |||||||
| LNDFLp | −0.1237 | −0.0665 | 1 | ||||||
| LNMEp | 0.3503 | −0.4669 | −0.0317 | 1 | |||||
| Variables | LL Statistics | Probability |
|---|---|---|
| R | −7.89744 | 0.0000 |
| ΒETA (β) | −14.7809 | 0.0000 |
| LNDOL | −15.1770 | 0.0000 |
| LNDFL | −23.6754 | 0.0000 |
| LNME | −15.6739 | 0.0000 |
| LNB/M | −10.9962 | 0.0000 |
| LNSG | −10.0328 | 0.0000 |
| LNEPS | −3.87257 | 0.0001 |
| LNP/E | −21.8929 | 0.0000 |
| Beta () | −8.13816 | 0.0000 |
| LNDOLp | −4.56870 | 0.0000 |
| LNDFLp | −15.9684 | 0.0000 |
| LNMEp | −6.44407 | 0.0000 |
| Annual Stock Returns | Average Monthly Stock Returns | |||
|---|---|---|---|---|
| Intercept | −8.09 *** | −4.8 ** | −0.63 *** | −0.25 * |
| (−4.46) | (−2.01) | (−4.23) | (−1.77) | |
| ΒETA (β) | 0.09 * | 0.10 * | 0.005 | 0.008 ** |
| (1.66) | (1.68) | (1.30) | (2.53) | |
| LNDOL | 0.02 ** | 0.002 ** | ||
| (2.31) | (−2.09) | |||
| LNDFL | 0.006 | 0.0006 | ||
| (1.12) | (1.18) | |||
| LNDOL01 | 0.13 *** | 0.01 *** | ||
| (2.99) | (2.67) | |||
| LNDFL01 | −0.02 | −0.03 * | ||
| (−0.21) | (−1.90) | |||
| LNME | 0.37 *** | 0.18 * | 0.028 *** | 0.012 *** |
| (4.46) | (1.69) | (4.23) | (5.03) | |
| LNSG | 0.10 | −0.004 | 0.008 | 0.0005 |
| (1.3) | (−0.04) | (1.20) | (−0.008) | |
| LNEPS | 0.04 | 0.12 | 0.006 | 0.014 |
| (0.30) | (0.67) | (0.55) | (0.626) | |
| LNPE | 0.009 | 0.09 | 0.001 | 0.007 |
| (0.10) | (0.820) | (0.104) | (1.08) | |
| Adj-R square | 0.45 | 0.12 | 0.44 | 0.11 |
| Model 1: B/M Ratio | Model 2: B/M Ratio | |||
|---|---|---|---|---|
| Variable | Coefficient | t-Statistics | Coefficient | t-Statistics |
| Panel A: Panel least square results (Fixed effect) | ||||
| Intercept | −1.03 *** | −86.06 | 0.22 | 0.26 |
| LNDOL | 0.033 ** | 2.41 | ||
| LNDFL | −0.019 ** | −2.34 | ||
| LNDOL01 | 0.094 ** | 1.96 | ||
| LNDFL01 | −0.26 | −1.40 | ||
| Adj-R Square | 0.86 | 0.15 | ||
| Model 2: Beta () | ||||
|---|---|---|---|---|
| Variable | Coefficient | t-Statistics | Coefficient | t-Statistics |
| Panel A: Panel least square results (Random effect) | ||||
| Intercept | −1.60 *** | −3. 23 | −1.16 *** | −2.75 |
| 0.028 *** | 2.67 | |||
| −0.02 | −1.15 | |||
| 0.10 *** | 4.76 | 0.09 *** | 4.57 | |
| Adj-R Square | 0.16 | 0.16 | ||
© 2020 by the authors. Licensee MDPI, Basel, Switzerland. This article is an open access article distributed under the terms and conditions of the Creative Commons Attribution (CC BY) license (http://creativecommons.org/licenses/by/4.0/).
Share and Cite
Zia ul haq, H.M.; Shafiq, M.S.; Kashif, M.; Ameer, S. Determining Force behind Value Premium: The Case of Financial Leverage and Operating Leverage. J. Risk Financial Manag. 2020, 13, 196. https://doi.org/10.3390/jrfm13090196
Zia ul haq HM, Shafiq MS, Kashif M, Ameer S. Determining Force behind Value Premium: The Case of Financial Leverage and Operating Leverage. Journal of Risk and Financial Management. 2020; 13(9):196. https://doi.org/10.3390/jrfm13090196
Chicago/Turabian StyleZia ul haq, Hafiz Muhammad, Muhammad Sohail Shafiq, Muhammad Kashif, and Saba Ameer. 2020. "Determining Force behind Value Premium: The Case of Financial Leverage and Operating Leverage" Journal of Risk and Financial Management 13, no. 9: 196. https://doi.org/10.3390/jrfm13090196
APA StyleZia ul haq, H. M., Shafiq, M. S., Kashif, M., & Ameer, S. (2020). Determining Force behind Value Premium: The Case of Financial Leverage and Operating Leverage. Journal of Risk and Financial Management, 13(9), 196. https://doi.org/10.3390/jrfm13090196