Abstract
The economic results of a company are an important tool for many entities, e.g., for internal entities as well as for external entities. As the economic results of a company are often the only source of information that informs the company’s partners about the managerial activities of their company, it is necessary to present these economic results using real numbers. However, companies prefer to achieve better results by applying the principles of creative accounting, which leads to improved economic values being shown to be achieved during an accounting period. The purpose of this article is to apply models that have been developed to detect creative accounting, which occurs under conditions that help enterprises to adjust their financial statements and tax bases and involves using creative accounting techniques to become competitive or to be able to take advantage of deductions. These models were applied to the Slovak Republic’s agriculture, forestry, and fishing sector (sector A), which is highly affected by earnings manipulation. This article provides a numerical expression of companies, which were previously, with some probability level, involved in conducting financial statement manipulation. Subsequently, the results that were obtained have been displayed using receiver operating characteristic (ROC) curves. The outputs of the analysis show that a large proportion of the companies in this sector tend to use creative accounting, which is not only harmful for entrepreneurs and their business partners in sector A, but also for the Slovak Republic at large, as the Slovak government cannot determine whether the reported accounting results reflect a company’s real financial situation.
1. Introduction
Economic crime throughout the world, including in Slovakia, has become increasingly pervasive over the years. It was not previously common to pay much attention to the correctness of accounting, as for many years the assets and liabilities scores at the end of an accounting period needed to provide enough information for an external party to accurately consider the overall prosperity of an enterprise. As a result, accounting reports reflected the correct and true state of their enterprises. Over the years, when business owners began to use different types of financing for their activities that involved either using their own resources or raising funds from others, accountants have needed to cope with an influx of new funds and sources into their companies; the level of this influx did not always correspond to the financial needs of the company at that time (Ionescu 2019). Kovanicova (2002) describes the economic transactions from these new forms of financing as activities which are carried out in such a way so only satisfactory results can be found in the recipient company’s accounting results. Thus, a completely different financial picture is obtained from accounting, which is meant to be correct and in line with the company’s true financial conditions. Jones (2010) explains in her publication that any enterprise that does not meet the basic characteristics of true accounting uses creative accounting. However, because entrepreneurs did not want to commit illegal practices, it was necessary for them to obscure the techniques used by their accountants. Phenomena that were close to constituting creative accounting began to appear in many enterprises. Khattab (2012) understands creative accounting as the process of changing accounting numbers from their real form to a desired form that can be used to achieve benefits for the company and its management through using the Internet, by disclosing the creative accounting information, by selectively choosing between alternative accounting principles or by ignoring some of these principles. Hamada (2010) argued that creative accounting plays an important and effective role in the preparation of financial statements that have an impact on stock price maintenance, income recognition, or income smoothing. Any potential risks involving these impacts can be subsequently lost between the numbers in financial statements. Bhasin (2015) emphasizes that innovative aspects of creative accounting are performed through maneuvering with numbers, which implies that innovation is an essential part of creative accounting practices in accounting practices. Tassadaq and Malik (2015) critically analyzed the use of creative accounting in financial reporting. Their findings reveal a negatively correlated dependence between financial statements and creative accounting techniques, as these practices may decrease the value of the reported financial information. Additionally, the research of Akpanuko and Umoren (2018) evaluated the extent to which creativity in financial reporting has contributed to the financial distress of enterprises. It is evident that creative accounting, despite the fact that it may increase the number of enterprise defaults, is a resourceful tool for misleading the public, investors, and shareholders, and for reporting profits in a way which is most convenient for an enterprise.
Thus, the aim of this article is to review the use of creative accounting tools in the agriculture, forestry, and fisheries sector (sector A) in the Slovak Republic using models that reveal the use of these manipulation techniques. This sector has been financially undersized for several decades, has experienced low levels of employment, and unfortunately has also experienced various financial scandals and lasting problems involving tax fraud. The sector’s long-term problems culminated in the EU programming period 2014–2020 including enormous scandals involving decoupling, shifting financial sources within rural development programs, and corruption affairs in the agrosector (involving the Agricultural Paying Agency). It should be stated that a focus on agribusinesses in not rare, as this sector reports low earnings and an extreme level of accruals compared to other peers, which was confirmed in the research conducted by Trejo-Pech et al. (2008, 2016) and Pavlovic et al. (2019a). Moreover, a recent OECD report (OECD 2020) in the context of COVID-19 confirmed that it is necessary to focus on the agrosector. This context highlights that agrosystem reform is an urgent priority. The report notes the COVID-19 pandemic provides an opportunity to learn more about chokepoints and vulnerabilities, in order to identify necessary investments and reforms that would further strengthen the resilience of the sector towards a range of future shocks and challenges. This is why earnings management detection in this sector of the national economy is important, as it helps to reveal the managers who are more effective at conducting business. Creative accounting obstructs the lessons that need to be learned to understand how agribusinesses should adapt their business models quickly enough to avoid any risks.
The originality of this paper lies in the fact that the Beneish model (Beneish 1999) and the modified Jones model defined by Dechow et al. (1995) were used to reveal the accounting creativity when analyzing a critical sector which was floundering in scandals. To obtain the most relevant results, the period of 2015 to 2018 was chosen, which helped to verify whether the scandal-prone economic and financial development of the sector may have influenced enterprises to adjust their financial results. The data obtained from the application of the models were verified using ROC curves, which were used to determine the classification dependence of the model. Such a comparison of models helps to assess not only the correctness of individual models but shows the number of enterprises which manipulate or do not manipulate financial documents.
This research differs from other studies as it is primarily focused on the detection of earnings management in the Slovak Republic, where earnings management detection is still unexplored compared to other central European countries. The research includes models that have proven successful in detecting creative accounting worldwide. The main contribution and innovative attitude of the paper is the research from a new perspective where ROC curves are used to determine the ability of these models to capture and classify companies as a group of manipulative or non-manipulative enterprises.
The presented article is divided into the following chapters: the literature review portrays the most important studies and research published worldwide, especially in European countries. The Materials and Methods section focuses on the description and procedures of the detection of possible delays in accounting based on analytical models. The Results and Discussion section contains important findings, results, model comparisons and further analysis using ROC curves. The discussion compares the findings of other Slovak studies that address the issue. The conclusion briefly sums up our findings.
2. Literature Review
In this section, the genesis of earnings models and reasons for creative accounting are shown, and studies focused on creative accounting in agriculture are portrayed. Then, current studies in the research field are described, especially those that cover the recent incentive of creative accounting on the developed markets in comparison to the solved issue in emerging markets.
Strakova (2020) comprehensively sums up models related to the detection of creative accounting. The study divides the models into three approaches: accrual-based earnings management, real earnings management and a combined model of earnings management (Figure 1).
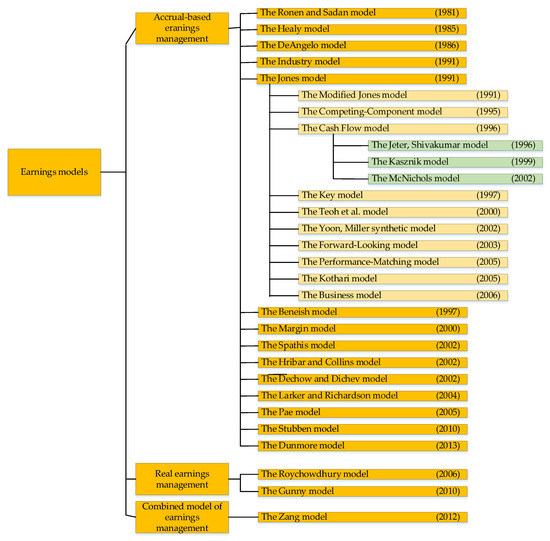
Figure 1.
Models of earnings management. Source: Strakova (2020).
Kovalova and Frajtova Michalikova (2020) emphasize and evaluate two individual ways in which creative accounting can be identified. The chosen methods for detecting fraud are the CFEBT method (method analyzing cash flows and earnings before taxes) and the Beneish model. Their study shows that methods of creative accounting are used to delay impending corporation bankruptcy. Svabova et al. (2020b) also focuses on business failure prediction by creating new models. These models are based on the combination of two methods, discriminant analysis and logistic regression. Strakova and Michalkova (2020) add that another reason for bankruptcy is that it enables companies to achieve predetermined earnings values and thus project a positive financial situation within the business to the external environment. Poradova and Siekelova (2020) argue that the factors of earnings management are divided into two groups. The first group is formed of factors resulting from state earnings and second group of factors from enterprises. Jurickova and Gregova (2020) mark significant reasons for earnings manipulation, including attracting new investors. The connection between earnings management and investors is confirmed by Qiu and Teng (2014). Their study shows the existence of earnings management in China’s agricultural enterprises because of internal demand for earnings management, which not only results in investors losses, but also disrupts the capital market. Krastev et al. (2020) warn not only against the disruption of the capital market but also business corruption caused by creative accounting. Pavlovic et al. (2018) indicate that the reasons for earnings management should be found in factors like cultural and political factors or the religious attitude or age of board members, not in the gender differences based on Serbian agriculture enterprises. Pavlovic et al. (2019a) detect earnings management practices by the performance-adjusted Jones model, which is the most appropriate for Serbian agriculture enterprises. Pavlovic et al. (2019b) indicate that there is no dependency on the age of the board of directors in relation to earnings management practices (financial performance) and no evidence of the influence of the chairman’s age on earnings management practices (profitability). Savov et al. (2017) evaluate dependencies in agribusiness earnings. The findings determine ownership as a significant factor connected to profit management. On the contrary, Susanto et al. (2019) show that managerial ownership, the size of the board of directors, director independence, audit quality, and firm size do not statistically influence earnings management and that tax aggressiveness, institutional ownership and leverage do influence earnings management. Trejo-Pech et al. (2016) implement the discretionary expenses model. They find evidence of accrual-based earnings management and find no evidence of real earnings management in agribusinesses. The results show that managers might be managing earnings through specific accruals, doubtful accounts, receivable provisions and special items.
Assenso-Okofo et al. (2020) indicate that the connection among chief executive managers’ compensation and the management of earnings shifts may have caused the world financial crisis. Bouaziz et al. (2020) examine the influence of the attributes of an executive director on the manipulation of discretionary accruals in France. Saona et al. (2020) also study the attributes of the chief officer and the addition of capital structure and their effect on opportunistic managerial behavior exemplified in earnings manipulation in Spain. La Rosa et al. (2020) analyze the status of earnings management in intervening in the connection between capital structure and the cost of equity. The study of Lin et al. (2020) supports the significant position of the motives of earnings management incentives for related party transactions. Cai et al. (2020) highlight that morals, faith and proxies for risk do incentivize an enterprise to remove accrual earnings management and change to earnings management. Agustia et al. (2020) indicate that no connections exist among earnings manipulation and the default of enterprises. However, enterprises that apply either one of two fundamental business strategies—cost leadership and cost differentiation—considerably decrease the probability of default. Cunningham et al. (2020) find that comment letters are not a robust way in which to raise the enterprise to shift the course of earnings management. Andreicovici et al. (2020) investigate whether enterprises strategically enable markable layoffs by ex-ante decreasing earnings management. Liu (2020) reveals the result of claiming an engagement business partner to accept audit reports on real and accrual-based earnings management in the United Kingdom. Premti and Smith (2020) point out that enterprises used to have positive discretionary accruals both prior to and also after the (initial public offering) IPO. Kim et al. (2020) examine the relationships among the range of real earnings management strategies and the cost of debt capital in the global environment. Maglio et al. (2020) aim at explaining the dependency of earnings management and gender diversity among executives as an estimator of the corporate social performance of small and medium-sized enterprises. Yamaguchi (2020) studies earnings management to obtain the average profitability of the industry in Japanese enterprises. Al-Okaily et al. (2020) find that earnings management is not significant in family businesses, while also investigating the higher predisposition for earnings management in enterprises with a financial connection. Ater and Hansen (2020) assess the range of business earnings manipulation strategies prior to private debt issuance. El Diri et al. (2020) detect the discrepancies among markets of high and low concentration in applying accrual and real earnings management.
3. Materials and Methods
The data used to calculate the Beneish model and the modified Jones model were obtained from the European AMADEUS database, which contains the financial information of more than 21 million European companies, of which almost 10 million are from Central and Eastern Europe. The AMADEUS database includes 292,013 enterprises in Slovakia, of which 8659 enterprises belong to the agriculture, forestry and fishing sector. The years that will be analyzed for the given sector are the years 2015, 2016, 2017 and 2018. It follows that the number of enterprises will decrease and thus, after selecting the above years, the total number of 3720 enterprises could be analyzed. Subsequently, the criteria that each company must meet in the reference period are set out. The required criteria are as follows (Table 1).

Table 1.
Selection criteria of analyzed enterprises.
The set criteria were met by 46 companies in the monitored sector.
Some generally known and world-recognized models were used to reveal the detection of profit management in selected companies in the Slovak Republic—the Beneish model and the modified Jones model. The Beneish model is a mathematical model introduced by Professor Messod Daniel Beneish of the University of Indiana (1999). The model includes eight variables and it can be used to identify the probability of data manipulation based on financial statements.
The main definitional relationship is based on the following equation:
where
| M | Beneish manipulation score |
| DSRI | Days’ sales in a receivable index |
| GMI | Gross margin index |
| AQI | Asset quality index |
| SGI | Sales growth index |
| DEPI | Depreciation index |
| SGAI | Sales and general and administrative expenses index |
| LVGI | Leverage index |
| TATA | Total accruals to total assets |
The model demonstrates that if the value of M is greater than −2.22, this indicates a high probability of financial statements manipulation and vice versa—if the value of M is less than −2.22, the probability of the manipulation of financial statements is low (Beneish 1999).
The selected model consists of eight parameters. In order to construct this formula, the following values had to be selected in the AMADEUS database (values for 2015, 2016, 2017, 2018): sales, long-term tangible assets, total assets, receivables, net profit, gross profit, cash flow, depreciation, non-current liabilities, current assets, and current liabilities.
Their descriptive statistics are summarized in Table 2.
Table 2.
Descriptive statistics of variables entering the earnings management models.
An important indicator was also value added (VA, Table 3), which is absent in the AMADEUS database. Therefore, the data available on the website of the Statistical Office of the Slovak Republic were used, where the given value is in the form of a coefficient. The individual coefficients are listed in the following table:
Table 3.
Value added in individual years.
Based on the above values, the added values for the monitored companies were calculated and thus the complete set of data needed to calculate the Beneish M-score was achieved.
Subsequently, the individual parameters were calculated, which must be determined in order to achieve the final M-score for individual companies.
The second model used to detect creative accounting is the modified Jones model. According to Valaskova et al. (2020), this model is the best, i.e., the most suitable, for detecting companies in the conditions of the Slovak Republic. Based on the improvement of the Jones model, Dechow et al. (1995) decided to modify the model, particularly the variable change in sales (ΔREV), which was replaced by a change in receivables (ΔREC). The authors found that if the model was created using revenues, an error rate occurred, so they decided to change the variable to reduce the lack of earnings management detection. The first stage remains unchanged—the change occurs in the second stage, where the non-discretionary accrual is expressed:
where
| NDAit | non-discretionary accrual in a year t; |
| TAit | total accrual in a year t; |
| Ait-1 | total assets in a year t-1; |
| ΔREVit | annual change in revenues in a year t; |
| ΔRECit | annual change in receivables in a year t; |
| PPEit | long-term tangible assets in a year t; |
| α0, α1, α2 | coefficients; |
| εit | prediction error. |
The opinions of the authors are controversial. Everyone has a different opinion on whether the proposed modification is an improvement for a given model.
Jeter and Shivakumar (1999) believe that it is unrealistic for all changes in receivables to be related to the application of earnings management. This is because if an enterprise achieves a change in revenue based on a supplier credit, it is not automatically an earnings management practice.
In this section, we will follow Formula (10), thanks to which it can be determined whether or not a company tried to manipulate their financial statements.
The following data are required for this model: total assets; annual change in sales; annual change in receivables; annual change in long-term tangible assets.
Based on the abovementioned data, which are necessary for the calculation of discretionary accruals (DA), it is possible to compare enterprises and mainly to identify and then classify them into one of two groups. The first group includes those companies where a high probability of manipulation with financial statements is indicated (hereinafter manipulative enterprises) and the second group determines the companies where the probability of the manipulation of financial statements is low (hereinafter non-manipulative enterprises).
4. Results
Obtaining all the necessary data, the Beneish M-score could be calculated for all companies in an observed horizon of three years. All values, which were calculated using the indicators of the given formula, were inserted into Equation (10), which determines the individual M-scores for individual enterprises for individual years (Table 4).
Table 4.
Value added in individual years.
In individual years, the development of enterprises manipulating or not manipulating financial statements changed minimally. In 2016, three companies were identified which did not manipulate financial statements, representing 6.5% of the total number of analyzed companies. The remaining 43 companies (93.5%) manipulated their financial statements. In the following year (2017), only two enterprises were included in the group of non-manipulative enterprises, 4% of enterprises, out of the total number of 46 analyzed enterprises in the given year. The remaining 96%, i.e., 44 companies, manipulated their financial statements. In 2018, the number of non-manipulative enterprises increased, as six enterprises did not manipulate their financial statements (13%) out of all monitored enterprises in the given year. The remaining 40 companies, i.e., 87%, manipulated their financial statements.
From the results obtained using the Beneish model, it can be seen that a large proportion of companies, almost 85% of the industry, tends to manipulate their financial statements.
In the case of the modified Jones model, it is advantageous to determine the deviation that divides the companies in terms of earnings manipulation. It is a very good tool, e.g., for auditors who, based on the chosen deviation, can identify more precisely those business entities which manipulated their financial reports and sought to enrich them to their advantage. The modified Jones model is based on the calculation of total accruals which are calculated as
where
- annual change in receivables accounts;
- annual change in inventories;
- annual change in payable accounts;
- depreciation.
The calculation of total accruals is then used to estimate discretionary accruals, which may help reveal potential profit manipulation. If the value of the estimated discretionary accrual is close to zero, the probability of the manipulation of earnings is low. The deviation was set at ± 0.005 (based on an expert estimate) from zero; this range is considered as a limit not too different from zero, which indicates the enterprises that do not manipulate their earnings. Based on this deviation, it is possible to determine how many companies are involved in earnings management practices. In 2016, five companies did not manipulate their financial statements, which represents 11%. The remaining 41 companies, i.e., 89%, manipulated their financial statements. In the following year (2017), there was a decrease in the number of enterprises that did not manipulate their financial statements by 40%, i.e., only two enterprises did not manage their financial reports, representing 4% of the total number of analyzed enterprises. However, an increase in manipulative companies was revealed, of 7%, which—in a given year—represented 96% of the total number of monitored enterprises. In 2018, the number of companies that did not manipulate their financial statements increased to three companies. There was a smaller drop in the development of enterprises with manipulating practices; 7% of companies did not manipulate their financial statements and the remaining 93% of companies managed their reports (Table 5).
Table 5.
Discretionary accruals for selected agricultural enterprises.
From the calculations, it can be seen that even the modified Jones model reveals a large number of companies that have manipulated their financial statements. Thus, companies tried to attract the attention of investors, or tried to cover up their mismanagement over the years and adjust their statements to such an extent that there was no suspicion that the company would not be able to pay their debts.
In order to be able to evaluate the relevance of the calculations of the Beneish M-score model, the modified Jones model was also used to determine the degree of manipulation. The models are verified using ROC curves, which can reveal the calculated values that set the classification dependence of the model. This statement was also confirmed by Valaskova et al. (2017) in their study, where the authors used ROC curves to capture the ability of predictive models to distinguish between prosperous and non-prosperous financial situations. In this work, the knowledge gained from this article is used to depict and compare models that capture the manipulation of financial statements.
The ROC curves are portrayed and calculated using the SPSS program. Firstly, the values, which were calculated using the Beneish model and the modified Jones model, are defined as those that represent manipulation, and those that do not represent manipulation. The values that indicate manipulation are marked as one (positive), those enterprises where manipulation was not revealed as zero. The principle of ROC curves is based on the fact one model is determined by zero and one values (Beneish model) and the other model uses the achieved score (modified Jones model).
By the application of these two models in the database of Slovak companies operating in sector A—agriculture, forestry and fishing—it is possible to compare the achieved classification of the company with real data and thus verify the predictive ability of the models. The evaluation of the classification and prediction ability of the observed models is performed using the ROC curves, which show the relationship between sensitivity and specificity. This is the relationship between true positivity and false positivity, which are given by the confusion matrix (Table 6).
Table 6.
Confusion matrix.
The confusion matrix classifies enterprises as manipulative and non-manipulative and takes into account the following four situations:
True Positives (TP)—this is a positive match, i.e., how many companies were correctly classified as companies manipulating financial statements;
False Positives (FP)—this indicates how many companies were incorrectly classified as manipulative (type I error);
False Negatives (FN)—the results of false negatives determine the number of manipulative companies that were incorrectly classified as non-manipulative (type II error);
True Negatives (TN)—this is a negative match, i.e., how many non-manipulative companies were correctly classified as non-manipulative.
It is necessary to consider the following:
the overall accuracy of the model, which is defined as the ratio of correctly classified entities to all entities:
sensitivity, which is given by the ratio of true positive cases to all positive cases:
specificity, determined by the ratio of correctly identified negative cases to all negative cases:
According to Klepac and Hampel (2016), based on the calculated values of sensitivity and specificity, the ROC curve can be constructed and then the accuracy of the classification of the investigated models can be evaluated using the area under the ROC curve (AUC) as follows:
- values from 0.6 to 0.75—acceptable classification ability;
- values from 0.75 to 0.92—good classification ability;
- values from 0.92 to 0.97—very good classification ability;
- values from 0.97 to 1.0—perfect classification ability.
After the analysis of all graphs and AUC curves, the best prediction can be observed using a comparison of the Beneish M-score and the modified Jones model (Table 7).
Table 7.
Confusion matrix in the analyzed period.
The table shows that, in 2018, it was possible to identify 37 enterprises that used manipulation practices (80.43%) and no enterprises that did not manipulate their financial statements, despite the fact that there are six of them in the database (19.57%). In the case of 2017, 42 companies (91.30%) were correctly identified and, again, no companies that did not manipulate their financial statements. The remaining four enterprises (8.70%) were classified incorrectly. To complete the comparison, in 2016, there were 39 companies where the manipulation of financial statements (84.78%) was detected, while one company (2.17%) appears as a company that did not manipulate its financial statements. Six enterprises (13.05%) were incorrectly classified.
The resulting calculation of all of the necessary indicators of the prediction accuracy of the models is summarized in Table 8.
Table 8.
Classification of parameters.
Based on these results, it can be seen that almost 97% of Slovak enterprises operating in sector A—agriculture, forestry and fishing—were correctly classified in 2017. This is also confirmed by the calculated sensitivity of the model. The calculated values in 2017 also reached the level of perfect classification dependence, while, for the remaining years, the values reached an acceptable classification dependence. The results of our calculations and comparisons of the models are graphically represented using ROC curves, which show the ability of individual models to distinguish between manipulation and non-manipulation of the company’s financial statements (Figure 2, Figure 3 and Figure 4). We use these curves to verify the correctness of the modified Jones model.
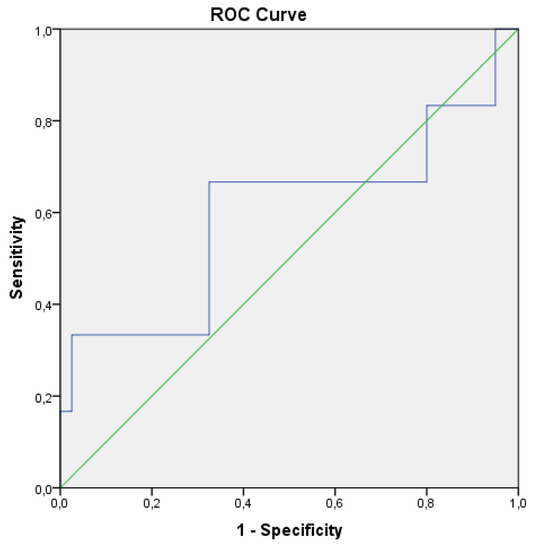
Figure 2.
ROC curve in 2018 comparing the Jones and Beneish models. Source: own research.
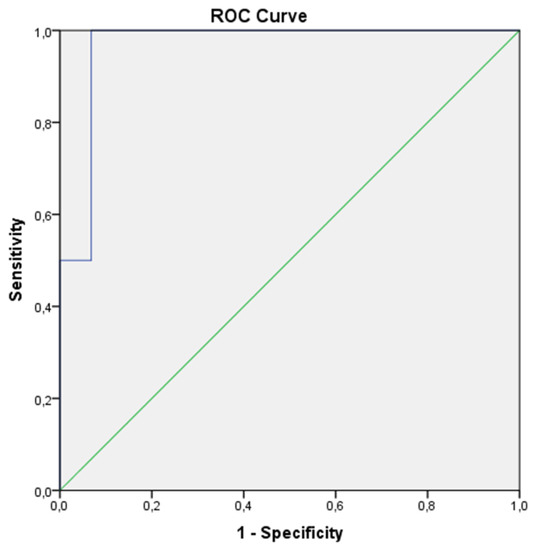
Figure 3.
ROC curve in 2017 comparing the Jones and Beneish models. Source: own research.
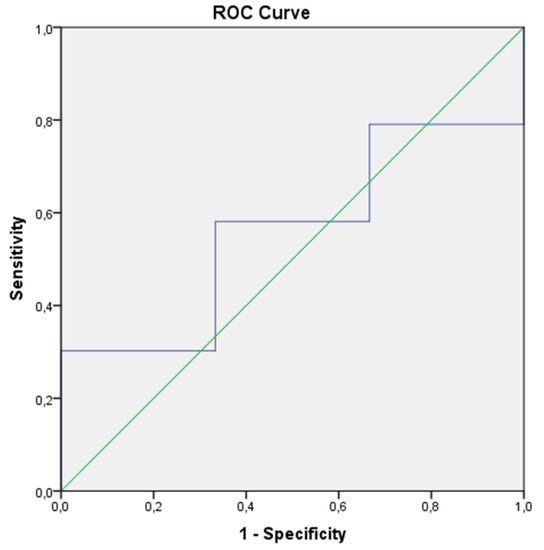
Figure 4.
ROC curve in 2016 comparing the Jones and Beneish models. Source: own research.
The models used consist of various parameters that help indicate enterprises that do manipulate their financial statements. Determining whether or not an enterprise manipulates their financial statements is the task of creative accounting models that detect and determine whether to classify a controlled entity into a group of entities that manipulate their financial statements or into a group of entities where there is no evidence of the manipulation of financial statements. These models use data from financial statements and thus allow for the comparison of a company with other business entities within the whole industry.
The models used in this article portray an annual time horizon that allows for the monitoring of the situation and the changes in a company in terms of earnings manipulation. The detection models used for these calculations are models that are recognized worldwide, and which help reveal the use of creative accounting in financial reports. It was expected that the information value of the models was high, as the focus was on agricultural enterprises that were accused of fraudulent behavior in previous years.
5. Discussion
The results are discussed in relation to current Slovak studies connected to the issues of creative accounting and earnings management.
Strakova and Adamko (2019) apply international earnings management models in the Slovak environment. They use the Jones model, modified Jones model, the Jeter and Shivakumar model, the Kasznik model, the Key model, the Teoh, Welch and Wong model and the Kothari model. These models are run in a reporting period of three years: 2015–2017. An overview of earnings management models in Slovak conditions is presented in Table 9. The results of their study show that the most suitable model for companies in the Slovak Republic is the model of the authors, Teoh et al. (1998).
Table 9.
The overview of fulfilled criteria of earnings management models in Slovak conditions.
Siekelova et al. (2019) detect the factors that impact profit in small and medium-sized Slovak enterprises. To analyze the earnings, earnings after tax were used. They confirm significant dependencies between profit and the sector in which an enterprise operates, between profit and total assets, profit and average collection time, profit and the costs of capital and profit and the classification of enterprises (micro, small and medium-sized). No dependency is identified between the profit indicator earnings after taxes (EAT) and the region where the enterprise operates. Valaskova et al. (2020) uncover surprising facts based on their time series analysis. The year 2013 was determined as a change point in business profit manipulation in Slovak, Czech, Polish and Hungarian enterprises for an analyzed 9-year period. The profit was represented by earnings before interest, taxes, depreciation and amortization (EBITDA). This confirms that these countries still have very narrow and close relations. The authors also studied the factors affecting business profit. Business dynamism has no significant impact on the development of EBITDA and gross domestic product, unemployment rate, inflation rate, average monthly gross wage, and the ease of doing business index in all countries of the Visegrad group. Kovalova et al. (2019) use the Beneish M-score for small and medium-sized enterprise for a 4-year period to disclose regularity in creative accounting. The overall results show that there is only one year confirmed (2015) in which the manipulation of financial statements is indicated, with significant creative accounting interventions. Svabova et al. (2020a), based on the Beneish model, use discriminant analysis in order to form a model to identify fraudulent companies. The study creates real data on Slovak companies that were convicted of misleading financial reporting in connection with tax fraud in the years 2009–2018. Their model correctly identifies 86.4% of fraudulent Slovak companies and reaches an 84.1% overall classification ability. Chutka and Kramarova (2020) sum up the calculation and usage options of P/E (price/earnings) models. Their study compares the P/E ratio model to the moving average of 24 situations. P/E earnings models based on a selected company represent a 58.33% success rate in profit-making investment.
The basic requirement for the use of accounting statements for business management, control, reporting and other purposes is that they accurately and truthfully present the financial reality (Krajniak 2019). Information obtained from accounting is still one of the main sources of information about a company for most interest groups. It is therefore logical that each interest group will expect different values to meet its own goals. Thus, it is important to specify the limits in the accounting legislation by considering the application of various accounting techniques and procedures that entities use to represent these objectives. The motivation for these goals, as well as the necessary values, is usually found in the approach to business evaluation. Searching in this direction is the most convenient expression of corporate evaluation in the form of improving mathematical apparatuses, the decomposition of indicators and later applications on the basis of numbers that are not entirely reliable, which may not always bring the desired exact result.
6. Conclusions
The purpose of this article was to identify manipulated financial statements, i.e., whether it is possible to recognize them. The answer to this question would greatly simplify the situation not only for users of financial statements, but also and especially for auditors, who are independent and professionally qualified persons whose task is to increase the confidence of users of financial statements. The practical application of the Beneish model and the modified Jones model in the selected economic sector revealed that the use of basic mathematic–statistical operations help calculate and find out whether a company manipulates its financial statements or not.
The models revealed that many of the analyzed enterprises tend to manipulate their financial statements, which does not shed a positive light on companies and entrepreneurs operating in sector A. Despite the calculations, it should be noted that these models are quite theoretical, which may mean that their credibility is not 100%. It should be also said that the data obtained and applied in this article are from the AMADEUS database, which captures the complete financial statements of companies. These data should be reliable and accurate, but the most ideal data would only be obtained by visiting the companies concerned and addressing the staff working with the financial and accounting data. Nevertheless, the application of data from the AMADEUS database confirms the unfair practices in the sector of agriculture by various agricultural subsidies.
Creative accounting is a very widespread concept that has led to the bad image of accountants and financiers in the financial and accounting world. The work carried out by auditors has once again become more difficult, as creative accounting practices are so meticulous that even excellent auditors sometimes fail to overlook the traps that are placed.
The existence of models that reveal the manipulation of financial statements is therefore extremely important. Unfortunately, a number of these models is created for the accounting system of the United States of America, which is directly affected by Generally accepted accounting principles. However, considering the conditions of Slovak accounting standards, the models revealing the manipulation of financial statements are on a rather theoretical level and so the perfect accuracy of the results cannot be guaranteed. On the other hand, these models can be used as a suitable tool for auditors to identify the risky areas quickly and easily and to find out how to develop future steps and procedures, evaluate audit risk and set the level of significance.
As these models achieve a very high percentage of success in detecting earning management in enterprises, it should be noted that these models were applied to only one sector of a country. This can be described as a limitation that will be eliminated by extending the application of these models to more sectors, thus revealing—to a greater extent—the number of companies characterized by the use of creative accounting.
The models used in this paper are recognized worldwide, but each country has specific elements that make it unique, as is the case for the accounting principles and standards used in a country. Therefore, the models we used in this article may have slightly different results when applied in another country.
However, as creative accounting is a problem across the world and not only in the United States of America, where the well-known models were formed, it is important to develop similar models in the conditions of the Slovak business environment as well, and thus to detect and eliminate the participants of unfair practices that improve their financial statements and financial health—which is a crucial factor of business competitiveness (Stefko et al. 2019)—in order help enterprises get a competitive position on the market, optimize their tax base and thus contribute to a decrease in public finance. However, this casts a shadow over the Slovak business environment and competitiveness within the sectoral or national environments.
Creative accounting can certainly be fought. Tighter sanctions for using this method or adopting stricter standards could help. Unfortunately, this form of manipulation of financial statements is not discussed sufficiently in our region. Therefore, creative accounting is on the rise in the Slovak Republic. The measures to defeat this phenomenon are often applied too late. Thus, it would be more appropriate to introduce measures to eliminate this unfair form of financial reporting more often and not as a consequence of situations when creative accounting reaches enormous proportions.
Author Contributions
Conceptualization, R.B. and K.V. methodology, P.D.; software, P.D.; validation, K.V.; formal analysis, R.B.; investigation, R.B. and P.D.; resources, K.V.; data curation, P.D.; writing—original draft preparation, R.B., K.V. and P.D.; writing—review and editing, K.V. and P.D.; visualization, R.B.; supervision, R.B.; project administration, K.V.; funding acquisition, P.D. All authors have read and agreed to the published version of the manuscript.
Funding
This research was financially supported by the Slovak Research and Development Agency—grant no. APVV-17-0546: Variant Comprehensive Model of Earnings Management in Conditions of the Slovak Republic as an Essential Instrument of Market Uncertainty Reduction and VEGA 1/0121/20: Research of transfer pricing system as a tool to measure the performance of national and multinational companies in the context of earnings management in conditions of the Slovak Republic and V4 countries.
Conflicts of Interest
The authors declare no conflict of interest.
References
- Agustia, Dian, Nur Pratama Abdi Muhammad, and Yani Permatasari. 2020. Earnings management, business strategy, and bankruptcy risk: Evidence from Indonesia. Heliyon 6: e03317. [Google Scholar] [CrossRef] [PubMed]
- Akpanuko, Essien Ekerette, and Ntiedo John Umoren. 2018. The influence of creative accounting on the credibility of accounting reports. Journal of Financial Reporting and Accounting 16: 292–310. [Google Scholar] [CrossRef]
- Al-Okaily, Jihad, Nourhene BenYoussef, and Salim Chahine. 2020. Economic bonding, corporate governance and earnings management: Evidence from UK publicly traded family firms. International Journal of Auditing 24: 185–204. [Google Scholar] [CrossRef]
- Andreicovici, Ionela, Nava Cohen, Silvia Ferramosca, and Alessandro Ghio. 2020. Two wrongs make a ‘Right’? Exploring the ethical calculus of earnings management before large labor dismissals. Journal of Business Ethics 2020: 1–27. [Google Scholar] [CrossRef]
- Assenso-Okofo, Oheneba, Jahangir Ali, and Kamran Ahmed. 2020. The effects of global financial crisis on the relationship between CEO compensation and earnings management. International Journal of Accounting & Information Management 28: 389–408. [Google Scholar]
- Ater, Brandon, and Thomas Bowe Hansen. 2020. Earnings management prior to private debt issuance. Accounting Research Journal 33: 269285. [Google Scholar] [CrossRef]
- Beneish, Messod D. 1999. The detection of earnings manipulation. Financial Analysts Journal 55: 24–36. [Google Scholar] [CrossRef]
- Bhasin, Madan Lal. 2015. Creative accounting practices in the Indian corporate sector: An empirical study. International Journal of Management Sciences and Business Research 4: 10. [Google Scholar]
- Bouaziz, Dhouha, Bassem Salhi, and Anis Jarboui. 2020. CEO characteristics and earnings management: Empirical evidence from France. Journal of Financial Reporting and Accounting 18: 77–110. [Google Scholar] [CrossRef]
- Cai, Guilong, Wenfei Li, and Zhenyang Tang. 2020. Religion and the method of earnings management: Evidence from China. Journal of Business Ethics 161: 71–90. [Google Scholar] [CrossRef]
- Chutka, Jan, and Katarina Kramarova. 2020. Usage of P/E earning models as a tool for valuation of shares in condition of global market. SHS Web of Conferences 74: 01007. [Google Scholar] [CrossRef]
- Cunningham, Lauren M., Bret A. Johnson, Scott E. Johnson, and Ling Lei Lisic. 2020. The switch-up: An examination of changes in earnings management after receiving sec comment letters. Contemporary Accounting Research 37: 917–44. [Google Scholar] [CrossRef]
- Dechow, Patricia M., Richard G. Sloan, and Amy P. Sweeney. 1995. Detecting earnings management. The Accounting Review 70: 193–225. [Google Scholar]
- El Diri, Malek, Costas Lambrinoudakis, and Mohammad Alhadab. 2020. Corporate governance and earnings management in concentrated markets. Journal of Business Research 108: 291–306. [Google Scholar] [CrossRef]
- Hamada, R. 2010. Role of Audit Committees in Limiting Creative Accounting Practices (Field Study). Damascus University Journal of Economic and Legal Sciences 26: 2. [Google Scholar]
- Ionescu, Luminița. 2019. Big Data, Blockchain, and Artificial Intelligence in Cloud-based Accounting Information Systems. Analysis and Metaphysics 18: 44–49. [Google Scholar]
- Jeter, Debra. C., and Lakshmanan Shivakumar. 1999. Cross-sectional estimation of abnormal accruals using quarterly and annual data: Effectiveness in detecting event-specific earnings management. Accounting and Business Research 29: 299–319. [Google Scholar] [CrossRef]
- Jones, Michael J. 2010. Creative Accounting, Fraud and International Accounting Scandals. Hoboken: John Wiley & Sons. [Google Scholar]
- Jurickova, Veronika, and Elena Gregova. 2020. Earnings of startups in different stages of development. Paper presented at International Scientific Conference on Hradec Economic Days (HED), Hradec Kralove, Czech Republic, April 2–3. [Google Scholar]
- Khattab, M.S.Y. 2012. Proposed framework for activating the role of corporate governance in limiting the use of some creative accounting methods. Journal of Public Management 52: 2. [Google Scholar]
- Kim, Ji Hye, Sang Ho Lee, and Yong Keun Yoo. 2020. Real earnings management and the cost of debt capital: International evidence. Asia-Pacific Journal of Accounting & Economics 27: 151–72. [Google Scholar]
- Klepac, Vaclav, and David Hampel. 2016. Prediction of bankruptcy with SVM classifiers among retail business companies in EU. Acta Universitatis Agriculturae et Silviculturae Mendelianae Brunensis 64: 627–34. [Google Scholar] [CrossRef]
- Kovalova, Erika, and Katarina Frajtova Michalikova. 2020. The creative accounting in determining the bankruptcy of Business Corporation. SHS Web of Conferences 74: 01017. [Google Scholar] [CrossRef]
- Kovalova, Erika, Katarina Kramarova, and Stanislav Zabojnik. 2019. Detection of earnings manipulation using Beneish M-Score model. Paper presented at 34th International-Business-Information-Management-Association (IBIMA) Conference, Madrid, Spain, November 13–14. [Google Scholar]
- Kovanicova, Dana. 2002. The Current Crisis in the Accounting and Auditing Profession (Not Just in the US): The Result of a Systemic Error or just an Accidental Failure of a Group of People? Praha: Association of Accountants. [Google Scholar]
- Krajnak, Michal. 2019. Do Selected Tax Advantages Affect Tax Revenue from the Personal Income Tax? Journal of Competitiveness 11: 73–88. [Google Scholar] [CrossRef]
- Krastev, Vladislav, Blagovesta Koyundzhiyska-Davidkova, and Irina Atanasova. 2020. The impact of the corruption on the sustainable development of the businesses in South-West Bulgaria. SHS Web of Conferences 74: 06015. [Google Scholar] [CrossRef]
- La Rosa, Fabio, Francesca Bernini, and Roberto Verona. 2020. Ownership structure and the cost of equity in the European context: The mediating effect of earnings management. Meditari Accountancy Research 28: 485–514. [Google Scholar] [CrossRef]
- Lin, Ruey-Ching, Chihua Li, Hong-Da Wang, and Yan-Jie Yang. 2020. The regulation change in consolidation rules and the incentives for earnings management activities via related party transactions. Asia-Pacific Journal of Accounting & Economics 2020: 1–21. [Google Scholar]
- Liu, Min. 2020. Real and accrual-based earnings management in the pre-and post-engagement partner signature requirement periods in the United Kingdom. Review of Quantitative Finance and Accounting 54: 1133–61. [Google Scholar] [CrossRef]
- Maglio, Roberto, Andrea Rey, Francesco Agliata, and Rosa Lombardi. 2020. Connecting earnings management and corporate social responsibility: A renewed perspective. Corporate Social Responsibility and Environmental Management 27: 1108–16. [Google Scholar] [CrossRef]
- OECD. 2020. COVID-19 and the Food and Agriculture Sector: Issues and Policy Responses. Available online: https://www.oecd.org/coronavirus/policy-responses/covid-19-and-the-food-and-agriculture-sector-issues-and-policy-responses-a23f764b/ (accessed on 25 October 2020).
- Pavlovic, Vladan, Goranka Knezevic, and Radica Bojicic. 2018. Board gender diversity and earnings management in agricultural sector - Does it have any influence? Custos e Agronegocio On Line 14: 340–63. [Google Scholar]
- Pavlovic, Vladan, Goranka Knezevic, and Radica Bojicic. 2019a. Does board of director’s age impact earnings management in agriculture? Case of Serbian agricultural sector. Custos e Agronegocio On Line 15: 254–72. [Google Scholar]
- Pavlovic, Vladan, Goranka Knezevic, and Radica Bojicic. 2019b. Does board of director’s age diversity affect financial performance in agricultural sector? Evidence from an emerging country. Custos e Agronegocio On Line 15: 313–40. [Google Scholar]
- Poradova, Monika, and Anna Siekelova. 2020. Analysis of factors with impact on earnings and their management in commercial companies. Paper presented at International Scientific Conference on Hradec Economic Days (HED), Hradec Kralove, Czech Republic, April 2–3. [Google Scholar]
- Premti, Arjan, and Garrett Smith. 2020. Earnings management in the pre-IPO process: Biases and predictors. Research in International Business and Finance 52: 101120. [Google Scholar] [CrossRef]
- Qiu, Dongfang, and Fei Teng. 2014. Research on existence of earnings management in China’s agricultural listed companies. Journal of Grey System 26: 95. [Google Scholar]
- Saona, Paolo, Laura Muro, and Maria Alvarado. 2020. How do the ownership structure and board of directors’ features impact earnings management? The Spanish case. Journal of International Financial Management & Accounting 31: 98–133. [Google Scholar]
- Savov, Radovan, Juraj Cheben, Drahoslav Lancaric, and Roman Serences. 2017. MBNQA approach in quality management supporting sustainable business performance in agribusiness. Amfiteatru Economic 19: 10–27. [Google Scholar]
- Siekelova, Anna, Maria Kovacova, Peter Adamko, and Vojtech Stehel. 2019. Profit management as an instrument for SMEs developing: The case for Slovakia. Marketing and Management of Innovations 3: 285–96. [Google Scholar] [CrossRef]
- Stefko, Robert, Sylvia Jencova, Petra Vasanicova, and Eva Litavcova. 2019. An Evaluation of Financial Health in the Electrical Engineering Industry. Journal of Competitiveness 11: 144–60. [Google Scholar] [CrossRef]
- Strakova, Lenka, and Lucia Michalkova. 2020. Verification of earnings management in Slovak Enterprises using Teoh, Welch and Wong model. Paper presented at International Scientific Conference on Hradec Economic Days (HED), Hradec Kralove, Czech Republic, April 2–3. [Google Scholar]
- Strakova, Lenka, and Peter Adamko. 2019. Application of earnings management models in the Slovak republic. Paper presented at 34th International-Business-Information-Management-Association (IBIMA) Conference, Madrid, Spain, November 13–14. [Google Scholar]
- Strakova, Lenka. 2020. Earnings management in global background. SHS Web of Conferences 74: 01032. [Google Scholar] [CrossRef]
- Susanto, Yulius Kurnia, Kashan Pirzada, and Sheryl Adrianne. 2019. Is tax aggressiveness an indicator of earnings management? Polish Journal of Management Studies 20: 516–27. [Google Scholar]
- Svabova, Lucia, Katarina Kramarova, Jan Chutka, and Lenka Strakova. 2020a. Detecting earnings manipulation and fraudulent financial reporting in Slovakia. Oeconomia Copernicana 11: 485–508. [Google Scholar] [CrossRef]
- Svabova, Lucia, Lucia Michalkova, Marek Durica, and Elvira Nica. 2020b. Business failure prediction for Slovak small and medium-sized companies. Sustainability 12: 4572. [Google Scholar] [CrossRef]
- Tassadaq, Fizza, and Qaisar Ali Malik. 2015. Creative accounting and financial reporting: Model development and empirical testing. International Journal of Economics and Financial Issues 5: 544–51. [Google Scholar]
- Teoh, Siew Hong, Ivo Welch I., and T. J. Wong. 1998. Earnings management and the long-run market performance of initial public offerings. The Journal of Finance 53: 1935–74. [Google Scholar] [CrossRef]
- Trejo-Pech, Carlos J. O., Richard N. Weldon, and Lisa A. House. 2008. Earnings, accruals, cash flows, and EBITDA for agribusiness firms. Agricultural Finance Review 68: 301–19. [Google Scholar] [CrossRef]
- Trejo-Pech, Carlos J. O., Richard N. Weldon, and Michael A. Gunderson. 2016. Earnings management through specific accruals and discretionary expenses: Evidence from US agribusiness firms. Canadian Journal of Agricultural Economics/Revue Canadienne d’Agroeconomie 64: 89–118. [Google Scholar] [CrossRef]
- Valaskova, Katarina, Beata Gavurova, Pavol Durana, and Maria Kovacova. 2020. Alter Ego only four times? The case study of business profits in the Visegrad Group. E&M Economics and Management 23: 101–19. [Google Scholar]
- Valaskova, Katarina, Lucia Svabova, and Marek Durica. 2017. Verification of prediction models in conditions of the Slovak agricultural resort. Economics, Management, Innovation 9: 30–38. [Google Scholar]
- Yamaguchi, Tomoyasu. 2020. Earnings management to achieve industry-average profitability in Japan. Asia-Pacific Journal of Accounting & Economics 2020: 1–30. [Google Scholar]


Publisher’s Note: MDPI stays neutral with regard to jurisdictional claims in published maps and institutional affiliations. |
© 2020 by the authors. Licensee MDPI, Basel, Switzerland. This article is an open access article distributed under the terms and conditions of the Creative Commons Attribution (CC BY) license (http://creativecommons.org/licenses/by/4.0/).