Article

The Dali Model in Risk-Management Practice: The Case of Financial Services Firms

1
Department of Construction & Property Management, University of Malta, MSD 2080 Msida, Malta
2
Department of Insurance, Faculty of Economics, Management and Accountancy, University of Malta, MSD 2080 Msida, Malta
3
Department of Economics, Faculty of Economics and Administrative Sciences, Ardahan University I.I.B.F, 75000 Ardahan Merkez/Ardahan, Turkey
*
Author to whom correspondence should be addressed.
J. Risk Financial Manag. 2019, 12(4), 169; https://doi.org/10.3390/jrfm12040169
Submission received: 3 October 2019 / Revised: 27 October 2019 / Accepted: 5 November 2019 / Published: 7 November 2019
(This article belongs to the Special Issue Mechanisms and Models of Risk Management)

Abstract

:
Originality/value—this model contributed to the vast literature on models of change and risk management within organisations, but was not validated empirically for reliability of the factors, and on financial services providers within small jurisdictions. Therefore, the significance and importance of such a study lies firstly on the premise that testing on small countries can be deemed as small laboratories for more complex politics, regulations and policies of larger countries and secondly, the importance of financial services as essential for prosperity in a country’s economy. This model will provide an empirically tested proactive model in a specific environment for managing organisational risks to arrive at their objectives with minimal setbacks.

1. Introduction

In general, organisational problems that call for large-scale change happen under hard or unexpected circumstances that require a rapid recourse to action. However, in such cases protocols for operational standards in a crisis are set in motion only when the department or organisation concerned is under extreme strain. In this paper the authors sustain that in many instances a department is under strain long before anyone in the organisation acknowledges it, thus causing an undesired impact on staff and other resources, making it difficult for any change to happen in response to what is required. The reasons for this could be many, ranging from bureaucracy to a ‘laissez faire’ attitude, to authorities demanding expectations that are beyond the department’s capacity to achieve the desired output.
Changes in the environment can cause a threat to any significant entity, which affects the complex delivery of a service. For instance, the impact of the 2011 London riots, Europe’s cold temperature spikes and its impact on civilians, the Libya Crisis as affected by Malta in 2011, and irregular migrant arrivals in Spain in 2018, as each scenario is conditioned by sudden external change that cuts through several strategic areas requiring a rapid response similar to those used in pandemic situations and extreme crisis calls.
In her book, Dalli Gonzi (2019), presented 8 factors to assist an organisation in recognising that a response to identify the strain and to be equipped to cope with change is what current management practice should aim towards. In supporting operational environments, she examines and discusses how the 8 elements support the system by providing (a) a just-in-time response; (b) identifying the strain under which the organisation is subject to; (c) and the tangible outputs to operations. To build her model, otherwise referred to as the Dali model, she used case studies, books, publications, journals, online material including online interviews and their transcripts and literature, together with interviews, and surveys that she carried out separately. The basis and the buildup of this tool are elaborated on in the literature review section below (Dalli Gonzi 2019).
This model contributed to the already vast literature on models of change and risk management within organisations (see literature review below), but was not validated empirically, and on financial services providers within small jurisdictions. Therefore, the significance and importance of such a study lies firstly on the premise that testing on small countries, similar to what has been carried out in the past by various authors of the likes of (King 1993; Briguglio 1995; Baldacchino 2006; Bezzina and Grima 2012; Bezzina et al. 2014), can be deemed small laboratories for more complex politics, regulations and policies of larger countries and secondly, the importance of financial services as essential for prosperity in a country’s economy.
Therefore, this study will provide us with an empirically tested proactive model (in a specific environment, i.e., financial firms within small jurisdictions) for managing organisational risks to arrive at their objectives with minimal setbacks.
In this study we refer to small jurisdictions as countries with fewer than 3 million inhabitants. In this case, the European Union (EU) states of Latvia, Lithuania, Estonia, Slovenia, Cyprus, Malta and Luxembourg are selected. Moreover, we refer to banks (credit institutions), investment services firms, insurance firms and financial institutions as financial services organisations (Kruf et al. 2019).

2. Aim of the Study

With this study, the authors’ aim is to carry out an empirical test on financial services organisations within EU small jurisdictions in order to determine the validity of the factors of the Dali model previously developed by Dalli Gonzi (2019) using qualitative validating methods. Moreover, the authors aim to determine whether, within these organisations, there is a relationship between better understanding and management of risk.
In doing this the authors also examine whether the responses by participants to this model varies as a function of their organization’s demographic characteristics. The resultant findings are critically discussed and practical recommendations aimed at ensuring that the true values and qualities of this model emerge.

3. Literature Review

We face growth in complexity, scale and the nature of change. We are currently in a time zone best described as a serious threat to the basic structures of fundamental values or norms of a social system, which under time pressure and highly uncertain circumstances necessitates critical decisions (Rosenthal et al. 1989). The crisis can be defined as the organisation’s lack of ability to respond to a heightened situation. Heightened turbulence causes management teams to focus inwards, responding with tactics that include cutting costs and re-organising. However, these are strategies that happen in a crisis frame of mind. Key authors in change management literature sustain that when decision-making time is characterised by limited time, ambiguity and uncertainty and when the need to learn is at its peak, the institutional capacity/ability may be disapprovingly low. An organisation may undergo (a) mixed change, (b) separate change (c) changes in parts that work together without the need for a long chain of command (Lester et al. 2002) (d) diverse expertise, (Leonard and Howitt 2010). (e) shift from normal tactics (f) acting in one’s own self-interest, (g) forgetting to adhere to normal practice behaviour (h) failing to make use of underutilised resources, (Joyce 1999) or (i) unclear situational awareness (Lagadec 2009). Departing from well-known change management models in the literature that include Lewin’s change-management model; the McKinsey 7-S model; Kotter’s change-management theory; nudge theory; the ADKAR (Awareness, Desire, Knowledge, ability, reinforcement) model; Bridges’ transition model; and the Kübler–Ross five-stage model, The DALI model proposes that, first and foremost, any model requires a real-time response, that is, response which will function only when the organisational team can push past a false sense of complacency, to initiate a well-timed strategy which happens when a ‘red flag’ situation is admittedly accepted by the top management. In addition, the book published by Dalli Gonzi in 2019 recognizes that a gap exists between the aforementioned models for change and the response to ‘red flag’ management scenarios that are only serviced by pandemic protocols, emergency response protocols and business continuity management (example: ISO 22301). Business continuity management is a recognised certification through institutions such as the National Institute for Business Continuity Management, Disaster Recovery Institute, The Business Continuity Institute, Business continuity management Institute and the Business Resilience Certification Consortium International (British Standards Institution 2012). The adoption of business continuity management in certain parts of the economy is actively promoted by government policy in the UK with the Civil Contingencies Act (2004) introducing business continuity arrangements for all frontline responders such as emergency services.
If a situation is changing rapidly one needs to see what the delivery of a service actually means; (i) what the ‘real-time’ response is; (ii) what methodical way of response is suitable to meet the requirements of the organisation as the event unfolds; and (iii) what are the minimum standard of operations that can be delivered at the time of response. In this case it is crucial for the organisation to undergo the strategic fit with its environment, termed positioning (Johnson et al. 2008). It is essential for the organisation to take note of the resources and competence to explore the strategic capacity of the organisation. These tie in with the importance of viewing citizens as customers, the ultimate goal for public service. Public managers and leaders require a methodology to guide them through change if they are to be supported. The DALI model as compared to other change-management models ensures that the response provided through the model itself meets the expected needs of the citizens as end users of the organization, should public managers choose to undertake the response approach.

3.1. Basis for Tool Development

With a diverse range of demographic and economic pressures, resources required to deliver services are not as effective as the demands being placed on the service providers. A slow response to any external change is not acceptable or financially tolerable because of a reliance on undesirable and burdensome rules, regulations, and the overload of paperwork. A method to overcome the stagnation in decision-making circles is to (a) break down traditional top-down approaches; (b) verbally address stagnation in staff circles; (c) set limits on the possible project outcomes that are possible from the organisation; (d) set new barriers for innovation; (e) address difficulties in the organisational capacity to change; (f) network with a diverse range of stakeholders; (g) be aware of the reliance on elected politicians to provide resources for investment; (h) address the difficulty for professionals to make change; and (i) overcome hierarchical management structures (Dalli Gonzi 2019). The DALI model is is built upon (1) a content analysis of literature in change management and pandemic management; (2) case studies that included Malta’s response to the Libya crisis, a Maltese hospital’s response to a flu outbreak crisis, and a fire rescue emergency reform in Scotland. A second stage included a thematic analysis of data collated from the three case studies; (3) the Libya case study was used to collate quantitative analysis through an online survey, workshops and focus groups with 10 themes. Supporting the initial set of thematic elements were key knowledge contributors in the field of business continuity management (CMI Institute 2012), emergency-response management (Cabinet Office 2011), and pandemic management. Common to all areas was the setting of expectations for crisis response services so a consistent and evidence-based practice was set in place (Carnall 2007). Emergency management plans described above were generally active when critical situations were reached, and protocol required the activation of such plans. However, the threshold between crisis and an arising unexpected circumstance left a gap in planning which included the ability of an organisation to identify a red flag situation and to activate the eight areas for response. Similarly, in recent work by Hilorme et al. (2019a, 2019b) the crisis conditions determine the need for development of areas of adaptation, with the aim to improve management and meet citizen demands which, as the authors maintain, is impossible without the use of adaptive mechanisms. Acknowledging recent work by Drobyazko et al. (2019a) in blockchain and how this technology is advancing will bring about significant change, yet still requires the number and diversity of participants to work together for such technology to bring benefits. The involvement of the community is what makes a model successfully able to implement. In line with this, the first five themes extracted through content analysis (response, resource, structure, network, data output) are able to function as they support the already existing operational environments with the scope to fill the gaps when a crisis hits, as a community is held together through the bonding agents that are pre-existent to any structure. Additionally the new emergent areas from case studies in response to suddenly experienced crisis (second part of the research), focus on operational recovery (process improvement, training, policy feedback) and can be aligned to what is termed as ‘business reduction (recovery strategy)’ in the typology of basic strategies, directions and types of changes is proposed in accordance with business development strategies (Drobyazko et al. 2019b).

3.2. 8 Thematic Elements

The theoretical framework developed from the literature constitutes 5 factors; mainly the resource capacity within which an organisation is expected to operate; the organisational structure to facilitate response; the operating environment characterised by elements of complexity; maintaining service continuity; and ‘business as usual’. A tool for analysis NVIVOTM (QSR International, Doncaster, Australia) was used for data management. The theoretical framework was then followed by collating case characterisation from three case studies to explore further each element. A combination of approaches to collect data was utilised: semi-structured interviews, policy documents and reports. The in-depth nature of the interview process across different policy areas provided an indication that for increased operational efficiency to begin, challenges to the structural capacity of the organisations needs to be addressed. Nodes emerging from literature themes collected and grouped using NVIVOTM:
  • Crisis
  • Front-line service
  • Intense environment
  • Organisational structure
  • Public service resources
  • Resilience
The thematic elements were supported by key areas discussed in the literature centred around: areas of timely response (Boin 2004); broadening resource capacity (Cohen and Brand 1993); specialist expertise (Joyce 1999); structural planning and formation for command and control (Deloitte 2009); networking structures (Levy and Lovegrove 2009) and output services (Public Service Commission 2011; Carnall 2007).
Timely response was built upon an indication that organisational impact, which has serious implications on capacity, response and timing, happens at a limit, which is not necessarily ‘catastrophic’. Recognition of that point of impact is deemed necessary if any resources or specialist expertise is to be brought in. With that recognition ability in place, having a model for decision-making avoids the element of surprise presenting itself as a threat to response teams (Hosseini and Izadkhah 2010). Following a recognised critical point, dealing with the provision would mean; (i) postponing a decision; (ii) waiting for new data or information, or (iii) following through with uncertainty about a possible outcome. The resource allocation and capacity distribution thematic elements are built upon the required strategic decision for outward distribution of people resources at a time of urgent need and through network channels made available to access resources. This is based upon an understanding that specialisation is always necessary, as rotas become unsuitable for loads that result from drastic changes in capacity. This theme was built upon an understanding that critical to response is the knowledge of by-processes in place for rapid deployment together with the prioritization of those processes. Authors argue for a process in place for supplies to be moved from supplier to end-user along a multiple layer of stakeholders (Boin et al. 2010). In addition, defining the limitations of the selected processes and identifying which day-to-day operations require additional support is necessary for continuity. The objective behind the theme structural formation was the facilitation of a structure to cope with the critical response needed. The proximity of hubs and networks helped overall response strategies. Key leaders bringing in specialist knowledge of departmental capacity they had, could be discussed on the spot and in real-time. Networks proved to be a better form of governance than hierarchy, especially in conditions of uncertainty and complexity. Self-organising networks is a concept which has been developed by Johnson and Scholes (2002). Studies show that network teams converge very early on towards a decision whilst hierarchical teams take more time due to decision-taking by a single leader (Schraagen et al. 2010). This, together with the design and formation of a central unit of strategic thinking, ensures the exchange of practices, staff, resources and management thinking. The nature of scale and proximity of each management layer meant networks work faster and communicate effectively. Working as a response unit means defining boundaries and communicating strategy as effectively and simply as possible, with a predisposition to work with others. Predisposition meaning tendencies to work with key players prior to building up working relations.
Meeting public expectations is critical to any response strategy. As Dalli Gonzi (2019) shows in data collated for case study design, the thematic element called output standard service is essential to response. When objectives change, decision-makers need to bridge between what is happening at strategy level and what is happening at the scene. This means that policies need to be made adaptable to the situation at hand to meet requirements. In this case, attaining a standard for service means having key policies in place to ensure the required changes can happen, thus establishing a feedback loop between strategy and reality as a solution to bridging the gap. ‘Failure to answer people’, is the performance indicator, which should be overcome if the organisational impact has serious implications for capacity, response and timing but is not yet termed ‘catastrophic’. Tomkins (1987) sustains that one must establish what an effective service is during a period of radical change before establishing its strategic objectives and goals. Thinking strategically requires incorporating the expected output that a service can reach, particularly during the organisational impact.
The fifth thematic element which is network and supporting structures is preparatory work for a co-ordinated approach to any response strategy. The movement of resources through pre-established networks and supporting agencies while working closely with strategic partners including unions, government, local authorities, private enterprise and the workforce is the major scope. As discussed in multiple guiding documents in the field of pandemic studies and business continuity management (McConnall and Drennan 2006), a multidisciplinary group comprising ethics, medical, legal, public health, emergency management is required. Liability protection is employed to establish indicators following on regional and state levels to assist in monitoring when crisis occurs. The UK (National Health Service 2008) ensures that when faced with disruptive challenges, resilience principles are applied to maintain operational delivery. Pre-established roles for co-ordination with international agencies is critical to speed up transactions. This together with a central system for response enables networking to proceed faster, which works better when nodes and hubs are simplified by size.

3.3. Emergent Themes: Process Improvement, Training, Policy Feedback

Throughout the course of the data collection three thematic elements were extracted from the data (Dalli Gonzi 2019) and included: (i) training—the ability to integrate training mechanisms as part of an on-going resource provision for preparedness; (ii) policy feedback—integrating policy and guidelines into a crisis standard guideline of response; (iii) process improvement—integrating performance and output feedback mechanisms directly into front-line response to show that needs are being met.
The sixth thematic element policy feedback showed that it was critical for leaders to know what was happening at all times and to document all changes being made. It was also necessary to formulate related policy changes with the necessary feedback. Temporary guidance issued was feeding straight into policy. As part of the ongoing document collating exercise, all events were recorded, and any changes were fed back into standard operating procedures. As part of the change-over strategy, service operational guidance (CFRA 2012) was designed to provide robust yet flexible guidance. Feedback was fed directly to top strategic levels, constantly updated, allowed for gathering risk information, and presented results straight to the minister without the need for added bureaucracy.
The seventh thematic element titled training procedures, research showed that there was clear indication that in order to access appropriate resources for improved capacity management, trained personnel were needed. In most cases the requirement was specialist trained personnel. Managing resource demands could be possible only if the required training to facilitate rapid deployment of staff. Training as part of a response strategy means staff is aware and directly involved in on-the-spot training programs when needed. Data collated showed that in some cases, personnel when required could not be rapidly called in since they required specialisation. So highly specialised roles could not be taken over by employees from other departments (Dalli Gonzi 2019). During a rapid response strategy training is dependent on the time available for the required training to occur.
In formulating process improvement as the eighth thematic element, data collected (Dalli Gonzi 2019) showed that response teams required ‘fast-track processes’ or ‘continuity procedures’ which would be designed specifically to enhance processes between service output at front-line and policy-making. A ‘fast track process’ would ensure that it was possible to override specific protocols in times of rapid response. In this case, running processes in parallel was key to a successful strategy. Changes reported at the front line had to be directly fed into top management with a resulting change in policy to be followed through. Setting up a temporary structure was noted to improve processes or access routes for continuity of service without disruption. The scale and nature of this temporary structure would depend on the organisational function and leading roles.
In a recent paper discussing high-tech industries, authors Makedon et al. (2019) sustain that the specific features of the organization, management and management of high-tech industries (amongst a list of features) are: the complex nature of the company’s activity, the domination of the process of technology change over stationary production and the consequent need for a regular update of core production assets; branched internal and inter-industry cooperation caused by the complexity of high-tech products and specialization companies; a high degree of uncertainty (entropy) in the management of state of the art development, which requires the use of predictive technology estimates for the future when making decisions.

4. Methodology

4.1. The Research Instrument

To carry out the empirical testing of the model a self-administered questionnaire was purposely designed by the authors. In the process, we discussed with consultants and experts in the field. The introduction page outlined the objectives of the study, while the 10 sections that followed contained statements/questions with closed-ended statements, the first section with 4 questions containing the possibility to answer any of 2 questions, related to demographics of the participants’ firms. Such information could not have revealed the identity of firm or respondent and we informed the respondents that such data would be presented in aggregate form and that confidentiality was guaranteed. The next 8 sections held 40 statements reacting to the following themes explained in the literature above:
  • Connection to the system;
  • Resource allocation and capacity;
  • Governance and structural formation;
  • Service output (standards);
  • Network team;
  • Process improvement;
  • Policy feedback;
  • Training.
Each theme of the Dali model (which consisted of 40 statements in total) was explained by 5 statements drawn from the literature above which emanated from the Dalli Gonzi (2019) book, where participants were asked to respond to a seven-point Likert scale ranging from “strongly disagree” (coded as “1”) to “strongly agree” (coded as “7”).
The 10th section related to the participants’ reaction to the statement on the level of success of their company in understanding and managing risk. Here again participants were asked to respond to a seven-point Likert scale ranging from “strongly disagree” (coded as “7”) to “strongly agree” (coded as “1”).
Statements Q7, Q8, Q9, Q10, Q12, Q13, Q15, Q16, Q17, Q18 and Q19, were not in the same direction as others, meaning that if participants answered ‘strongly agree’, this would mean an ‘unsatisfactory result’ contrary to the other results which would mean ‘satisfactory results’. Therefore, for these statements, before analysing further, the answers were revised as follows: 1 was changed to 7, 2 was changed to 6, 3 was changed to 5 and vice versa.

4.2. Research Questions

The questionnaire responses were used to investigate the following research questions empirically:
RQ1:
Are the factors (themes) and statements provided by Dalli Gonzi (2019) in the Dali model empirically valid and reliable when used for financial services firms of small EU jurisdictions?
RQ2:
Is there a relationship between the Dali model on financial services firms of small EU jurisdictions and better understanding and management of their risk?
RQ3:
Does this relationship change as an effect of different demographics?

4.3. Sampling Procedure

The authors targeted the whole population of banks (credit institutions), investment services firms, insurance firms and financial institutions. At a confidence level of 95%, a worst-case true sample proportion of 5% (for categorical data), the minimum sample size required with these pre-set criteria was 384 (Lenth 2012). We used social network systems such as Linked-In and Facebook and email to invite prospective participants to respond to our survey via a web-link or QR code available on the social media or contained in the e-mail. The participants had the option to opt out if they felt they should not participate in the survey. Between January 2019 and August 2019, we received 2343 completed surveys—which met the minimum sample size requirement of 384 (Lenth 2012).

4.4. Sample Characteristics

Of the participants, 16.5% worked in credit institutions (banks) and 83.5% worked in other institutions. 30.3% of the firms in which participants worked had 200 and above employees and 69.7% of these had 199 and below employees. Moreover, of these firms 32.2% had 10 and more employees working in, and 67.8% had 9 and under employees working in, internal controls—(i.e., legal, risk management, internal audit, compliance). Also 81.8% of these firms were in the EU and 18.2% in other continents.

4.5. Data Analysis Procedures
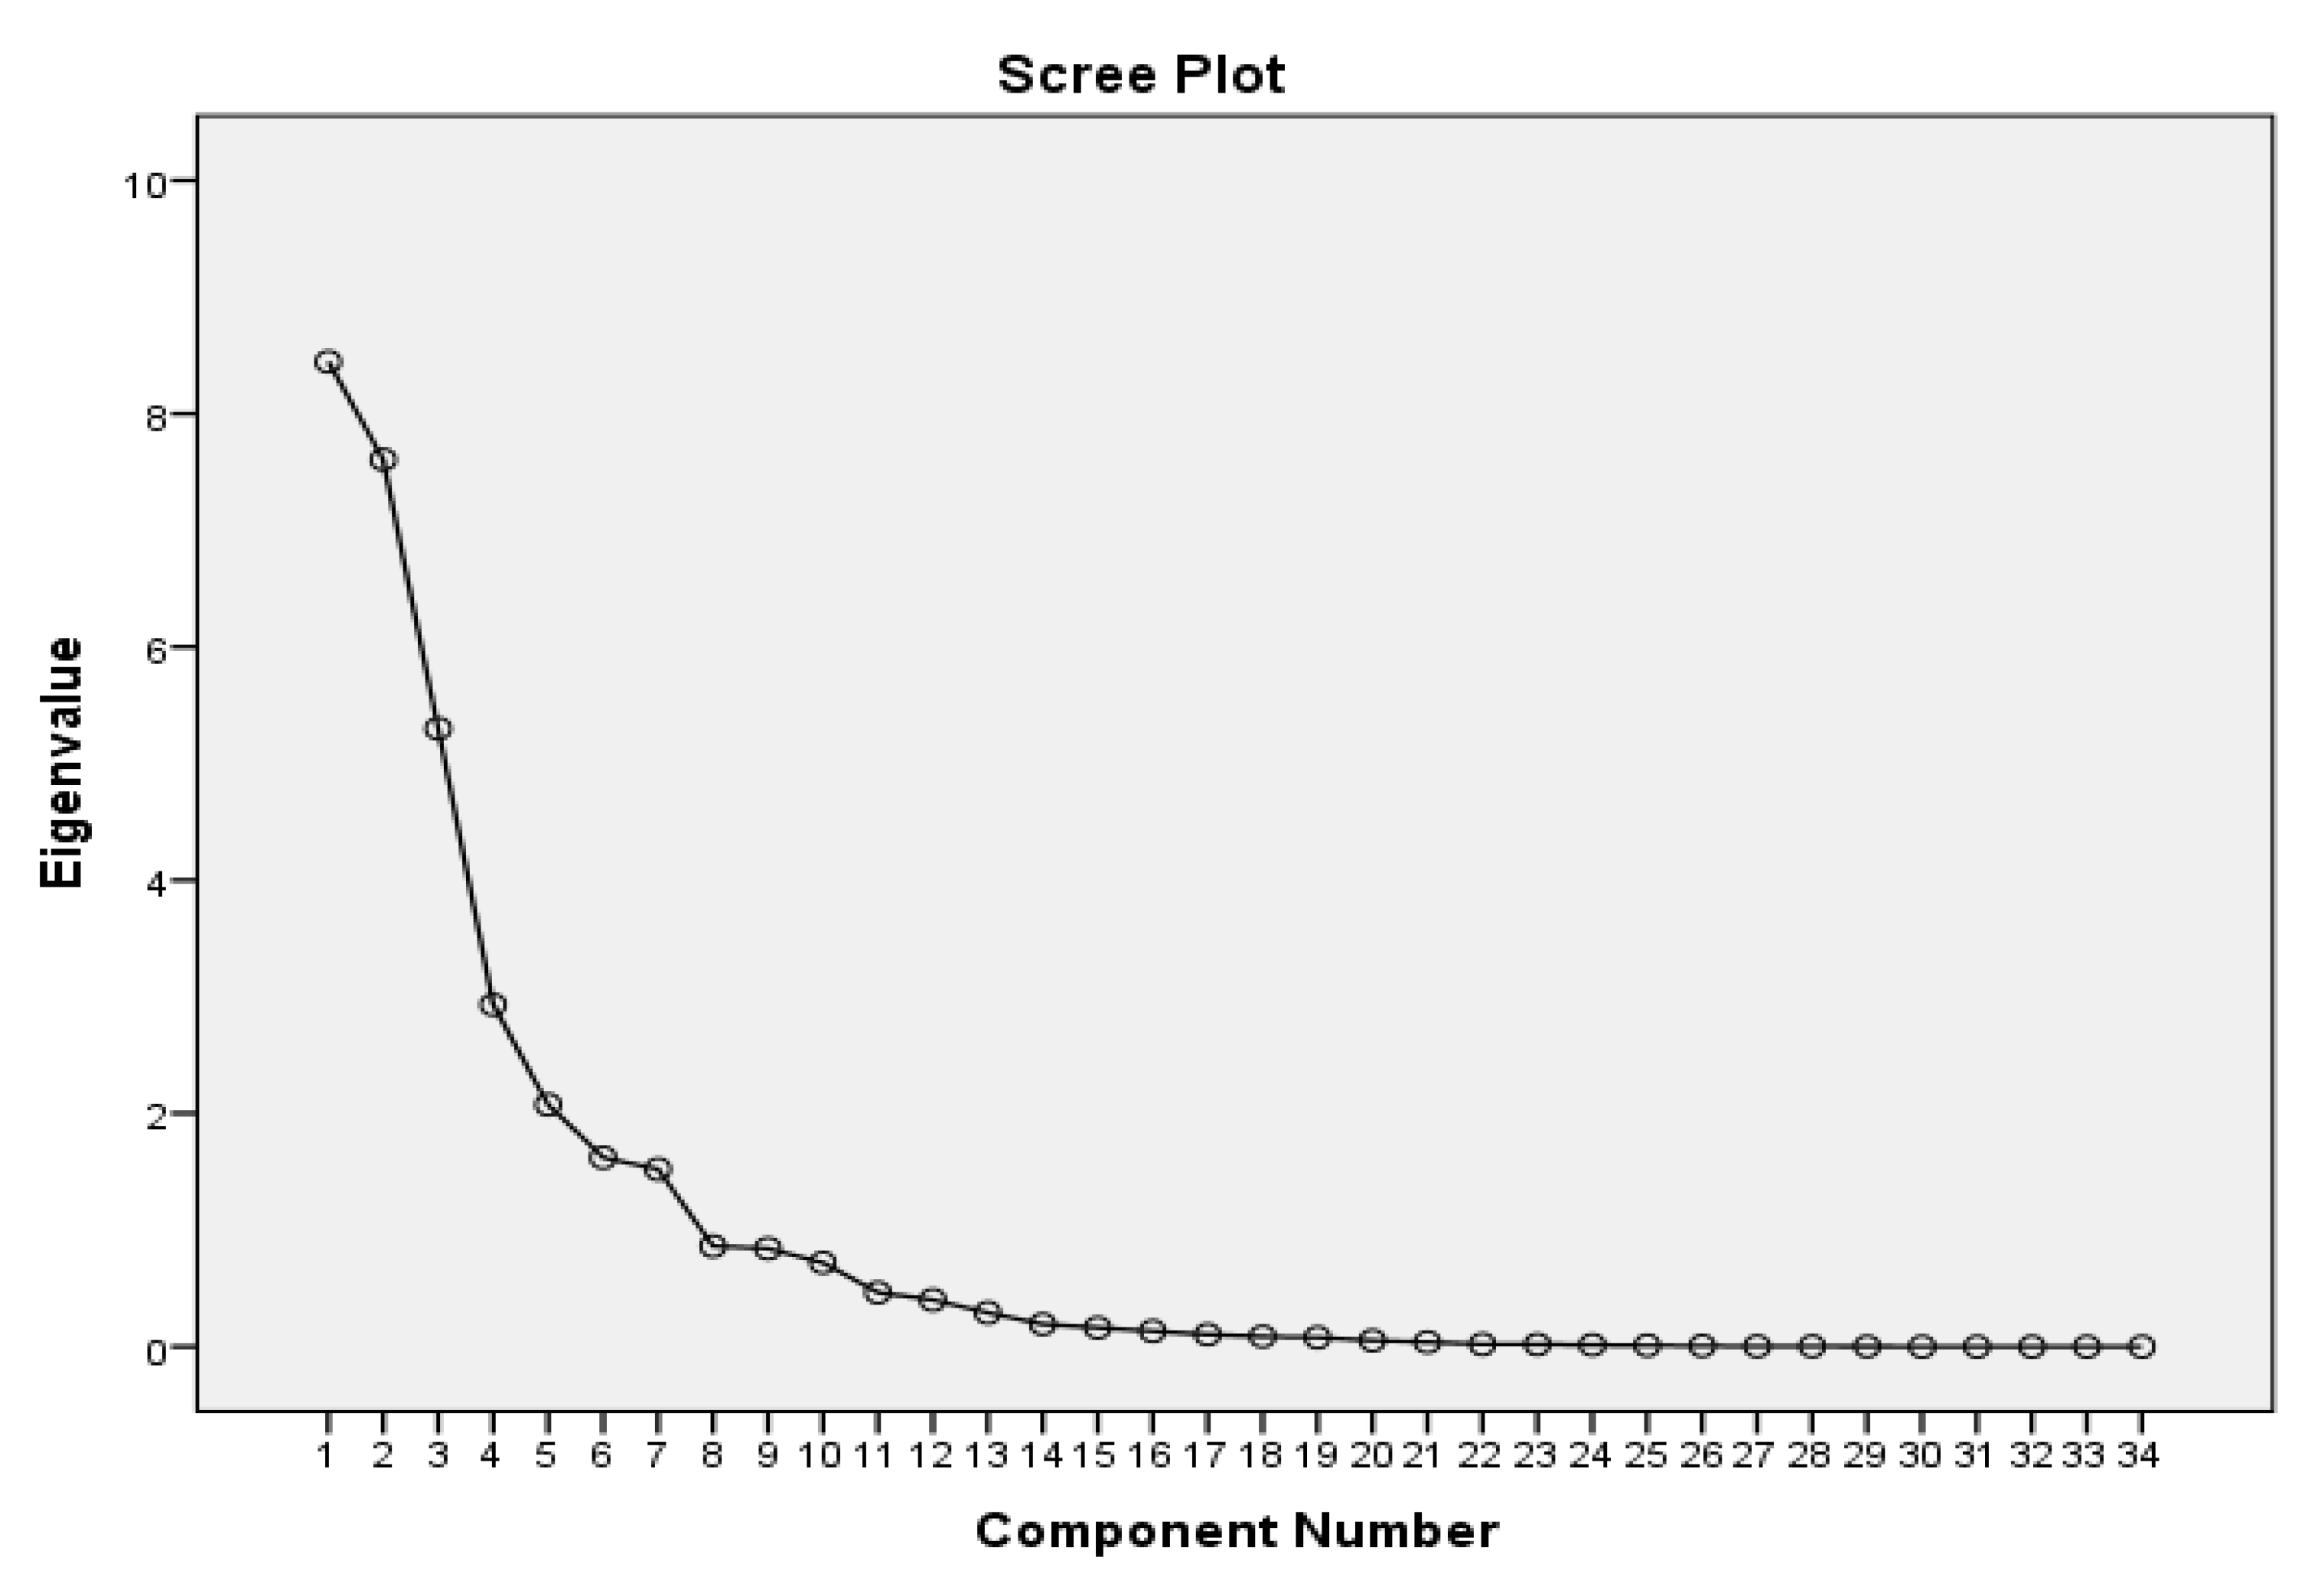
The respondents’ data was inputted into SPSS (Version 20) and subjected to statistical analysis, specifically ‘exploratory factor analysis’, which is a method of testing the theoretical understanding of the Dali model posed in the 1st research question (RQ1) variables, in this case the Dali model factors, and does not have an a priori fixed number of factors. The final number of factors is determined by the data and the authors’ interpretation of them.
Since the items used the ordinal scale of measurement, we used the median (Md) as measure of central tendency and the inter-quartile range (IQR) as measure of spread. Where a group of items could be grouped into a construct (or theme), we assessed the internal consistency reliability of the measures via Cronbach’s alpha. After the items were combined into a single Likert scale, we computed the mean (M) as a measure of central tendency and the standard deviation (SD) as a measure of spread.
Exploratory factor analysis, via principal components extraction with direct oblimin and with Kaiser normalization, was assessed by computing the Cronbach’s alpha coefficients.
The Kaiser–Meyer–Olkin (KMO) statistic, which is a measure of sampling adequacy for the appropriateness of applying factor analysis, fell within the acceptable range (above 0.6), with a value of 0.63.
This further supported continuance of factor analysis and so the analysis proceeded. Factor analysis loaded the best of 4 factors and 34 statements. Some statements were omitted (i.e., statements Q12—‘Resource allocation and capacity: Temporary operational guidance should be designed for the use of such resources’, Q14—‘Resource allocation and capacity: Additional resource stocks are available on demand’, Q25—‘Network team: There is a network of supporting stakeholders to assist in a time of crisis’, Q29—‘Network team: Working with external providers is easy’, Q30—‘Process Improvement: We know what is happening at front-line service delivery’ and Q34—‘Process Improvement: Data collected at front-line operations is processed and used for improving operations’). This was both because they explain little variance and because they fell under factors which were defined by one or two variables, making them unstable and generally unreliable (Tabachnick and Fideli 2001). The factors were interpreted or omitted cautiously with scientific utility. Therefore, variables that give a low level of association with several factors at the same time are neglected in the analysis.
Principal component analysis (PCA) was conducted on the remaining 34 items with direct oblimin and with Kaiser normalization and four components had eigenvalues greater than Kaiser’s criterion of one and in combination the factors explained 71.4% of the variance.
The Dali model of financial services firms using factor analysis was reduced to four factors and 34 statements. Table 1 shows which statements are grouped under each of the four factors. The pattern of items loading onto factors after rotation was clear and interpretable. Factor 1, which has now been termed “Network and Policy Feedback”, explained 24.83% of the variance and comprised 11 items. Factor 2, which has now been termed “Service and Process Improvement” explained 22.37% of the total variance and comprised 11 items. Factor 3, which has now been termed “Resource and Governance” explained 15.58% of the total variance and comprised 7 items and Factor 4, which has now been termed “Connection to the system” explained 8.62% of the total variance and comprised 5 items (Hair et al. 1998). This finding is confirmed further when looking at the scree plot shown as Figure 1, where the plot starts to come closer and go flatter after component number 4, meaning that the explanation of variance is not so significant after component 4 and would load better on another factor.
Cronbach’s alpha revealed that the measures of the factors were internally consistent with scale reliability (Cronbach’s α = 0.76)—Table 2.
The Cronbach’s alpha coefficients of this scale were between 0.84–0.98. Therefore, we can conclude that this scale is reliable as part of our statistical analysis.
We then computed the Dali Model measure from these 4 factors and 34 statements and carried out multiple linear regression to determine how the Dali Model measure varies with: (1) (Q45) the company’s ability to identify the appropriate risks and effectively manage them in order to reach objectives (2) (Q1) the type of financial services firms, (3) (Q2) the number of employees, (4) (Q3) the number of personnel in Internal Controls (i.e., legal, risk management, internal audit, compliance), and (5) (Q4) whether the financial services firm is in the EU or not.

5. Findings

The computed Dali model measure shows a mean of 5.53 (standard deviation (SD) = 0.388). All the factors (1, 2, 3, 4) produced means that were close to the computed Dali model—Table 3.
The multiple regression analysis [F 5,2337 = 449.88, p < 0.01] and the variables explained 49% of the variability in the Dali model (Table 4).
The computed one-way analysis of variance (ANOVA) was used to show that there are statistically significant differences between the means of the independent (unrelated) groups (p < 0.01)—Table 5.
The regression coefficients in Table 6 yield some interesting findings. Firstly, financial services firms who are better able to identify the appropriate risks and effectively manage them to reach objectives (Q45) score higher in their Dali model score (β = 0.051, t = 3.46, p < 0.01). The Dali model results are also lower for credit institutions than for other firms (Q1) (β = −0.59, t = −27.14, p < 0.01) and for firms with larger number of employees (Q2) (β = −0.293, t = −8.55, p < 0.01). Therefore, if you are not credit institutions and have less than 200 employees the Dali model score is higher. However, if the number of employees in internal controls (Q3) (i.e., legal, risk management, internal audit, compliance) is 10 and larger and the financial services firm operates in the European Union, then the Dali Model score is higher (Q4) (β = 0.47, t = 14.24, p < 0.01; and β = 0.34, t = 20.18, p < 0.01, respectively).
The Dali model of financial services firms using factor analysis was reduced to four factors and 34 statements. Factor 1, was termed “Network and Policy Feedback”, explained 24.83% of the variance and comprised 11 items. Factor 2, was termed “Service and Process Improvement” explained 22.37% of the total variance and comprised 11 items. Factor 3, was termed “Resource and Governance” explained 15.58% of the total variance and comprised of seven items. Factor 4, was termed “Connection to the system” explained 8.62% of the total variance and comprised five items. The higher the Dali model, the better are the financial services firms able to identify the appropriate risks and effectively manage them to reach objectives. The development of these factors is critical for organisations to recognise the response required to identify their strain and to be equipped to cope with change.
The qualitative result obtained in the book, as compared to the quantitative result prioritizes and answers four research areas. Firstly, the trigger for fast response should happen through any close network or communicative means, through participative means or through organizational preparedness components. This is also termed as ‘Timing’ (Dalli Gonzi 2019). The second qualitative result titled ‘Reform’ is aligned with Factor 2 which sustains ‘service and process improvement’. This result advocates the approach that for any response to change to happen, a time of tension will require two processes to run in parallel which is the current service provision alongside the ‘reform period’. The third qualitative result termed ‘Productivity’ (Dalli Gonzi 2019) highlights that firms require continuity of service and support, affirming that the design of a tool is what is required to fit within the field of strategic management. When compared to Factor 3 outlined above, ‘governance’ which signifies the ‘formation’ of stakeholders, expertise, manpower and so on, together with ‘resource’ availability suggests a hierarchical setting is what facilities response. The final result, Factor 4 (above), when aligned with the qualitative result termed ‘Preparedness’ (Dalli Gonzi 2019) fares comparingly well since ‘connection to the system’ and ‘preparedness’ both direct towards the ability of the firm to recognize how far their ‘red flag’ situation has developed and what can be done in real-time response. This particular study was carried out for financial firms, and would further strengthen the validity of the four factors to undertake the same study for another industry (for example: construction firms) as discussed below. It is relevant to understand the results of this study in the light of other recent studies.
Interestingly, in recent work by Hilorme et al. (2019a) on the introduction of energy-saving technologies into enterprise, results demonstrated that the lack of cooperation and coordination of activities, and the low level of interaction in companies led to a decrease in the quality of the information signal in communication channels, as support for decision making. In research carried out by Drobyazko et al. (2019b) on the security of organizational changes via operational integration, it was proved that the methodological approaches to changes in the work of companies should be based on the principles of consistency, complexity and functionality. The authors here discuss the implementation of such principles through the following types of change: (1) unplanned change (a reaction of the enterprise to any events and trends that may be threatening or, conversely, provide unexpected new opportunities); (2) planned change (willingness to react at the right time for favorable opportunities or problems in accordance with the goal of the most complete use or maximum leveling of the impact); (3) imposed change (changes that occur under the influence and on the initiative of the management of the enterprise in order to adequately respond to urgent situations or events); and (4) integration change (increasing the “internal” and reducing the “external” integration activities, which will lead to an increase in the level of functional interaction).

6. Limitations of the Study and Further Studies

This present test was carried out on a specific population and environment between January 2019 and August 2019, and received 2343 completed surveys—which met the minimum sample size requirement of 384. However, this does not mean that we can generalize this model for other variations in industry, time and geographical areas. In addition, the empirical result does not invalidate or validate the qualitative findings of Dalli Gonzi (2019), but simply confirms that in small jurisdictions it is better to use the 4-theme contrasts found in this present study. Further studies need to be carried out to verify this model in using different demographic characteristics such as geographical locations, time and industries.

7. Discussion and Significance of Findings

The results have significant implications for the use of the Dali model and more broadly for risk management and internal controls within financial services firms. Firstly, the regression estimates suggest that the Dali model score is closely associated with a firm’s ability to identify and manage risks. Hence, this provides empirical support to the use of the Dali framework in order to assist businesses as part of their risk-management and compliance activities. The quantitative yet intuitive nature of the model means that financial services operators may utilize this model is yet another tool in order to track their risk preparedness and responsiveness over time, by computing and observing their scores. Secondly, credit institutions appear to perform worse when it comes to their ability to identify and manage risks relative to other financial services institutions. This underscores the need for such institutions to strengthen and enhance their risk-management functions, perhaps beyond the scope of existing regulations, since they are currently lagging behind other types of organizations within the industry. Once again, the Dali model may assist in this regard by providing a simple yet objective metric with which to assess their progress within this field over time. Similarly, larger firms on average score worse on the Dali metric relative to smaller firms, suggesting that smaller organizations are better able to mobilize resources in order to identify and successfully tackle risks as they emerge, with larger firms potentially hampered by inertia and/or lack of coordination. Thus, it is imperative that larger firms become nimbler in terms of their risk-management processes and functions, and maximize coordination across functions while also potentially benefitting from economies of scale in this regard. Predictably, the results also suggest that the size of the compliance team within a financial services firm is positively-related with risk preparedness as captured by the Dali score, which suggests that firms must seek to invest more in this important business function. Finally, our results also indicate that financial services firms based in the EU generally score better on the Dali model, which may in part reflect EU directives and regulations in this regard.

8. Conclusions

The Dali model is explained in this paper together with its use as a tool for financial institutions and credit firms to be able to identify the appropriate risks and effectively manage them to reach their company objectives. Four out of the eight thematic elements were termed as follows: ‘Network and Policy Feedback’, ‘Service and Process Improvement’, ‘Resource and Governance’ and ‘Connection to the system’. The development of these factors is critical for organisations in recognising the response required to identify their strain and to be equipped to cope with change. Building upon lessons learned from emergency and pandemic management, the call for action is for organisations to have the capacity to manage situations of risk. The consequence of failing to respond would be to come under multiple pressures without the pre-determined support structures for a rapid counter strategy.

Author Contributions

For research articles with several authors, a short paragraph specifying their individual contributions must be provided. All Authors contributed equally to the paper.

Funding

This research received no external funding.

Conflicts of Interest

The authors declare no conflict of interest.

References

  1. Baldacchino, Godfrey. 2006. Managing the Hinterland Beyond: Two Ideal-Type Strategies of Economic Development for Small Island Territories. Asia Pacific Viewpoint 47: 45–60. [Google Scholar] [CrossRef]
  2. Bezzina, Frank, and Simon Grima. 2012. Exploring factors affecting the proper use of derivatives: An empirical study with active users and controllers of derivatives. Managerial Finance 38: 414–34. [Google Scholar] [CrossRef]
  3. Bezzina, Frank, Simon Grima, and Mamo Josephine. 2014. Risk Management practices adopted by financial firms in Malta. Managerial Finance 40: 587–612. [Google Scholar] [CrossRef]
  4. Boin, Arjen. 2004. Lessons from crisis research. International Studies Review 6: 165–94. [Google Scholar] [CrossRef]
  5. Boin, Arjen, Chris Ansell, and Keller Ann. 2010. Managing transboundary crises: Identifying the building blocks of an effective response system. Journal of Contingencies and Crisis Management 18: 195–207. [Google Scholar]
  6. Briguglio, Lino. 1995. Small island developing states and their economic vulnerabilities. World Development 23: 1615–32. [Google Scholar] [CrossRef]
  7. British Standards Institution (BSI). 2012. Talking Business Continuity. Available online: http://www.talkingbusinesscontinuity.com/starting/what-is-business-continuity-management.aspx (accessed on 21 January 2019).
  8. Cabinet Office. 2011. Business Continuity. Available online: http://www.cabinetoffice.gov (accessed on 15 January 2018).
  9. Carnall, Colin. 2007. Managing Change in Organisations, 5th ed. Harlow: Pearson Education. [Google Scholar]
  10. CFRA. 2012. Fire and Rescue Services Operational Guidance: Operational Risk Information, Scottish Government, Sub-Group on Fire Reform. Available online: http://www.legistlation.gov.uk/ukpga/2004/30/contents (accessed on 27 July 2019).
  11. Civil Contingencies Act. 2004. Contingency Planning. Retrieved from July. Available online: https://www.legislation.gov.uk/ssi/2005/494/contents/made (accessed on 29 September 2019).
  12. Cohen, Steven, and Ronald Brand. 1993. Total Quality Management in Government: A Practical Guide for the Real World. San Francisco: Jossey-Bass Public Administration. [Google Scholar]
  13. CMI Institute. 2012. Business Continuity Management Survey. Available online: http://www.thebci.org (accessed on 25 June 2019).
  14. Dalli Gonzi, Rebecca. 2019. Change and Continuity Management in the Public Sector: The DALI Model for Effective Decision Making. Bingley: Emerald Publishing Limited. [Google Scholar]
  15. Deloitte. 2009. New Shapes and Sizes: Re-Shaping Public Sector Organisations for an Age of Austerity. Available online: http://www.improvementsservice.org.uk/ (accessed on 20 July 2019).
  16. Drobyazko, Svetlana, Vyacheslav Makedon, Dmytro Zhuravlov, Yurii Buglak, and Valentyna Stetsenko. 2019a. Ethical, Technological and Patent Aspects of Technology Blockchain Distribution. Journal of Legal, Ethical and Regulatory Issues. 22. Available online: https://www.abacademies.org/articles/ethical-technological-and-patent-aspects-of-technology-blockchain-distribution-8434.html (accessed on 26 October 2019).
  17. Drobyazko, Svetlana, Olena Potyshniak, Natalia Radionova, Serhii Paranytsia, and Yuliia Nehoda. 2019b. Security of organizational changes via operational integration: Ensuring methodology. Journal of Security and Sustainability 9: 91–105. [Google Scholar] [CrossRef]
  18. Hair, Joseph, Rolph Anderson, Ronald Tatham, and William Black. 1998. Multivariate Data Analysis, 5th ed. Upper Saddle River: Prentice-Hall. [Google Scholar]
  19. Hilorme, Tetiana, Ruslana Shurpenkova, Oksana Kundrya-Vysotska, Oksana Sarakhman, and Olena Lyzunova. 2019a. Model of Energy Saving Forecasting in Entrepreneurship. Journal of Entrepreneurship Education. 22. Available online: https://www.abacademies.org/articles/model-of-energy-saving-forecasting-in-entrepreneurship-7994.html (accessed on 25 October 2019).
  20. Hilorme, Tetiana, Oksana Zamazii, Olena Judina, Rita Korolenko, and Yulia Melnikova. 2019b. Formation of risk mitigating strategies for the implementation of projects of energy saving technologies. Academy of Strategic Management Journal. 18. Available online: https://www.abacademies.org/articles/Formation-of-risk-mitigating-strategies-for-the-implementation-of-projects-1939-6104-18-3-364.pdf (accessed on 25 October 2019).
  21. Hosseini, Mahmood, and Izadkhah Yasamin. 2010. Training emergency managers for earthquake response: Challenges and opportunities. Disaster prevention and Management 19: 185–98. [Google Scholar] [CrossRef]
  22. Johnson, Gerry, and Scholes Kevan. 2002. Exploring Corporate Strategy, 6th ed. Harlow: Financial Times/Prentice Hall. [Google Scholar]
  23. Johnson, Gerry, Scholes Kevan, and Whittington Richard. 2008. Corporate Strategy, 8th ed. Upper Saddle River: Prentice Hall. [Google Scholar]
  24. Joyce, Paul. 1999. Strategic Management for the Public Services. Maidenhead: Open University Press. [Google Scholar]
  25. King, R. 1993. The geographical fascination of islands. In The Development Process in Small Island States. Edited by Douglas G. Lockhart, David Drakakis-Smith and J. Schembri. London: Routledge, pp. 13–37. [Google Scholar]
  26. Kruf, Jack, Simon Grima, Murat Kizilkaya, Jonathan Spiteri, Wouter Slob, and John O’Dea. 2019. PRIMO FORTETM Framework for Good Governance in Public, Private and Civic Organisations: An Analysis on Small EU States. European Research Studies Journal XXII: 2019. [Google Scholar]
  27. Lagadec, Patrick. 2009. The Megacrisis Unknown Territory—In Search of Conceptual and Strategic Breakthroughs. In Special Issue: Mega-Crises in the 21st Century, In Magazine for National Safety & Security and Crisis Management; The Hague: Ministry of the Interior & Kingdom Relations. [Google Scholar]
  28. Lenth, Russ. 2012. Java Applets for Power and Sample Size. Computer Software. Available online: www.stat.uiowa.edu/Brlenth/Power (accessed on 22 September 2019).
  29. Leonard, Hermann, and Arnold Howitt. 2010. Leading in Crises: Observations on the Political and Decision-Making Dimensions of Response. Boston: Harvard Business School. [Google Scholar]
  30. Lester, Richard, Piore Michael, and Kamal Malek. 2002. Interpretive Management: What general managers can learn from design. In Managing Innovation and Change, 2nd ed. Edited by J. Henry and D. Mayle. London: Sage, pp. 32–44. [Google Scholar]
  31. Levy, Alistair, and Nick Lovegrove. 2009. Reforming the public sector in a crisis. McKinsey Quarterly 3: 39–45. [Google Scholar]
  32. Makedon, Vyacheslav, Svetlana Drobyazko, Hanna Shevtsova, Olha Maslosh, and Maryna Kasatkina. 2019. Providing Security for the Development of High-technology Organizations. Journal of Security and Sustainability Issues 8: 759–74. [Google Scholar] [CrossRef]
  33. McConnall, Allan, and Lynn Drennan. 2006. Risk and Crisis Management in the Public Sector. Oxon: Routledge. [Google Scholar]
  34. National Health Service (NHS). 2008. Resilience and Business Continuity Management Guidance. Interim Strategic National Guidance for NHS Organisations; London: Emergency Prepardeness Division.
  35. Public Service Commission. 2011. Better Public Services; New Zealand: Department of Internal Affairs.
  36. Rosenthal, Uriel, Michael T. Charles, and Paul’T. Hart, eds. 1989. Coping with Crises: The Management of Disasters, Riots and Terrorism. Springfield: Charles C. Thomas. [Google Scholar]
  37. Schraagen, Jan Maarten, Mirjam Huis in ‘T. Veld, and Lisette De Koning. 2010. Information sharing during crisis management in hierarchical vs. network teams. Journal of Contingencies and Crisis Management 18: 117–27. [Google Scholar] [CrossRef]
  38. Tabachnick, Barbara, and Fideli Linda. 2001. Using Multivariate Statistics, 4th ed. Boston: Ally and Bacon. [Google Scholar]
  39. Tomkins, Cyril. 1987. Achieving Economy, Efficiency and Effectiveness in the Public Sector. London: Kogan Page. [Google Scholar]
Figure 1. Scree Plot. Source: Authors’ Compilation.
Jrfm 12 00169 g001
Table 1. Factors a.
Table 1. Factors a.
Factors
1234
Q5 Connection to the system: I can connect with the change my department is experiencing 0.979
Q6 Connection to the system: We are aware of the impact of change on our department 0.859
Q7 Connection to the system: We are currently experiencing a crisis 0.801
Q8 Connection to the system: The crisis requires a re-thinking of our organisation 0.903
Q9 Connection to the system: The crisis requires new operational guidelines for the department to cope 0.890
Q10 Resource allocation and capacity: Resources are being used at maximum capacity 0.550
Q11 Resource allocation and capacity: Fast-track additional resources can be easily mobilised 0.588
Q13 Resource allocation and capacity: Staff coping capacity is at a maximum −0.512
Q15 Governance and structural formation: Current governance set-up is not functioning well 0.890
Q16 Governance and structural formation: A temporary team is required to be set up to respond to the crisis0.794
Q17 Governance and structural formation: A new team leader is needed 0.633
Q18 Governance and structural formation: Current responsibility roles are not defined well enough 0.952
Q19 Governance and structural formation: Management is not effectively carrying out decisions 0.903
Q20 Service output (Standards): We know what is expected of our customer service strategy 0.906
Q21 Service output (Standards): We easily identify the vital (critical) needs of our customers 0.929
Q22 Service output (Standards): We know what dissatisfies our customer 0.906
Q23 Service output (Standards): We carry out operations improvement to ensure any mistakes are mitigated 0.933
Q24 Service output (Standards): We have a consistent service output standard 0.836
Q26 Network team: When a response is required from all stakeholders a centralised system communicates all information two-way−0.785
Q27 Network team: Business continuity management exists for the organisation−0.812
Q28 Network team: Strong communication exchange exists in all networks, two-way−0.807
Q31 Process improvement: When a crisis occurs, top management are immediately informed of any changes to operational processes 0.654
Q32 Process improvement: The department can handle normal day to day operations alongside a crisis, efficiently 0.656
Q33 Process improvement: Data collected at front-line operations is communicated to top management immediately 0.652
Q35 Policy feedback: All changes to processes are directly fed into departmental policy during a crisis−0.918
Q36Policy feedback: A specialised group of advisors handle the processof policy preparation A specialised group of advisors handle the process of policy preparation−0.784
Q37 Policy feedback: When policy-makers are not experiencing the situation as is, someone in the department gets directly involved to take over−0.916
Q38 Policy feedback: A leader is visible and accountable to any changes during a crisis−0.921
Q39 Policy feedback: A leader is contactable for policy feedback and improvement during the entire changeover−0.923
Q40 Training: Specialists handle crisis situations0.802
Q41 Training: There is a rapid deployment for staff training when crisis happens 0.840
Q42 Training: Training is an integral part of any business continuity plan 0.808
Q43 Training: Training needs are always identified before any response strategy 0.870
Q44 Training: Resources from other departments are easily deployed when staff requirements fall short0.758
Extraction method principal component analysis. Rotation method oblimin with Kaiser normalisation. a Rotation convergence in 5 iterations.
Table 2. Cronbach’s alpha values (n = 2343).
FactorItemMeanStandard DeviationCronbach’s Alpha
1115.060.950.84
2116.780.470.94
376.110.560.93
454.131.000.84
Table 3. Dali model.
NMeanStd. Deviation
Factor 123435.06690.95351
Factor 223436.78580.47750
Factor 323436.11250.56321
Factor 423434.13841.00186
DaliModel23435.52590.38855
Valid N (listwise)2343
Table 4. Model summary.
ModelRR SquareAdjusted R SquareStd. Error of the Estimate
10.700 a0.4900.4890.27766
a Predictors: (Constant), Q4 Continent in which the Financial Services Firm Operates, Q45 Identifying and Managing Risk: The company is able to identify the appropriate risks and effectively manage them to reach objectives, Q3 Number of Personnel in Internal Controls, Legal) (Risk Management, Internal Audit, Compliance), Q1 Type of Financial Services Firms, Q2 Number of Employees.
Table 5. Analysis of variance (ANOVA) a.
ModelSum of SquaresdfMean SquareFSig.
1Regression173.414534.683449.8760.000 b
Residual180.16923370.077
Total353.5832342
a Dependent variable: DaliModel. b Predictors: (Constant), Q4 Continent in which the Financial Services Firm Operates, Q45 Identifying and Managing Risk: The company is able to identify the appropriate risks and effectively manage them to reach objectives, Q3 Number of Personnel in Internal Controls, Legal) (Risk Management, Internal Audit, Compliance), Q1 Type of Financial Services Firms, Q2 Number of Employees.
Table 6. Coefficients a.
ModelUnstandardized CoefficientsStandardized CoefficientstSig.
BStd. ErrorBeta
(Constant)5.8790.051 114.6940.000
Q45 Identifying and Managing Risk: The company is able to identify the appropriate risks and effectively manage them to reach objectives0.0160.0050.0513.4610.001
Q1 Type of Financial Services Firms−0.5840.022−0.558−27.1370.000
Q2 Number of Employees−0.2480.029−0.293−8.5500.000
Q3 Number of Personnel in Internal Controls (Legal Risk Management, Internal Audit, Compliance)0.3900.0270.46914.2400.000
Q4 Continent in which the Financial Services Firm Operates0.3420.0170.33920.1810.000
a Dependent variable: Dali model.

