Abstract
Separation of ownership and control plays a significant role in determining the agency cost, and there are many consequences of this agency problem. The control-enhancing mechanisms enhance control of controlling shareholders who expropriate small shareholders. Controlling shareholders are different in different countries; majorly, family firms are controlling firms in Pakistani context. The use of control-enhancing mechanism is rampant in emerging economies, and even some developed countries, related research especially in Pakistan requires evidence. This study exhibits a pooled cross-sectional analysis of listed companies in Pakistan between 2005 and 2016. In this research, we have examined the influence of control-enhancing mechanisms on firms’ earnings management and which mechanism (pyramid control, multiple control chains, and cross-holding control) is significantly influencing the earnings management of firms. We have analyzed both types of earnings manipulation techniques (accrual and real earning management). Our results explicate that the pyramid control and multiple control chain mechanisms are significantly positively related to the accruals earning management and real earnings management, unveiling that firms with these controls manipulate earnings with discretionary accruals as well as with real activity manipulation. Real activity manipulation enhances firms to overproduce the inventory (decreasing the unit price) and to reduce the discretionary expenses (increasing the reported earnings).
JEL Classification:
G30; G32; M41; M49
1. Introduction
Earnings management is an essential phenomenon in literature these days. Many studies are focusing on this phenomena in different perspectives (Roychowdhury 2006; Cohen and Zarowin 2010; Banko et al. 2013; Li and Liao 2014; Li et al. 2011; Mindzak and Zeng 2018). The ownership concentration is also studied expansively in the literature (La Porta et al. 1999; Claessens et al. 2000). Notably, the effect of ownership concentration on earnings management activities of firms is not comprehensively studied, and the literature still needs understanding in this particular area. Some of the studies have focused on this area recently (Brown et al. 2017; Bao and Lewellyn 2017; He and Kyaw 2018).
The concentration of ownership is widespread in economies where there is inadequate legal protection of the rights of minority shareholders. In these economies, disagreement between managers and shareholders minimizes when management gains control (La Porta et al. 1998). Though, the largest shareholders’ control over firms’ management intensifies the conflict of interest between majority and minority shareholder (Gedajlovic and Shapiro 2002). The sentiment of Berle and Means (1932) of widely dispersed ownership in corporations is not predominant in developing and developed countries (Claessens et al. 2000; and Holderness et al. 1999). Indeed, an essential number of firms are controlled by large shareholders in many countries, including developed ones.
The first empirical research on ultimate control is conducted by La Porta et al. (1999), they investigated the chain of ownership in firms which have voting rights more than their cash flow rights. The findings insinuated that the largest shareholder benefits from the separation of ownership and control rights in firms. Another study of Claessens et al. (2000) conducted the same research in East Asian countries incorporating Thailand, Taiwan, Singapore, Philippines, Malaysia, South Korea, Japan, Indonesia, and Hong Kong. This study investigated the ultimate ownership of 2980 listed firms in these countries. The findings inferred that there are plenty of discrepancies in the ownership of these countries and the spread between ownership and control rights is very high, sanctioning the control of the significant percentage of stock market capitalization in the hands of a small number of families. Moreover, the literature explained that ingrained controlling shareholders exploit the rights of minority shareholders significantly (La Porta et al. 1999; Kaul et al. 2000; Fan and Wong 2002; Claessens and Fan 2002; Ducassy and Guyot 2017). The concentrated ownership of countries with the weak legal system is negatively associated with the interests of minority shareholders (La Porta et al. 2000). In these countries, minority shareholders bear the risk of being expropriated by large shareholders who gain voting rights over cash flow rights (La Porta et al. 1999).
The fundamental motivation of this study is the ownership structure and concentrated family control of Pakistani firms. The ownership structure of Pakistani firms is distinctive, and it is immensely concentrated because a large number of firms are allied with business groups. A wide-ranging review of the literature reveals that empirical work in the context of Pakistan has focused on different aspects like family business groups and their tunneling activities in Pakistan (Ikram et al. 2005), ownership concentration in business groups and their earnings management activities (Bhutta et al. 2016), effect of ownership structure on financial distress of firms (Uddin et al. 2017), dividend payout policy (Ahmed and Javid 2010), capital structure of firms (Butt and Hasan 2009); corporate social responsibility of firms (Malik et al. 2017) and firm performance (Ahmed and Javid 2008). However, to the best of knowledge, the control-enhancing mechanisms (pyramid structure, multiple control chains, and cross holdings) and its impact on real and accrual earnings management has not been in focus in Pakistan before.
In recent decades, emerging markets are reconstructing and developing economically at a higher pace. Despite these developments, academic research has suspected the reported earnings of firms and their financial information published publicly (Wang and Yung 2011; Li et al. 2011). Accordingly, earnings management is a recent concern of regulatory organizations all over the world. Chen et al. (2007) have emphasized that earnings management activities in firms can threat corporate partnerships and foreign investment foreseen in the firm. Klein (2002); Peasnell et al. (2005) have outlined in their studies that firms’ corporate governance mechanism and its quality determine variations in earnings management activities in the firm. This research is underpinned on the agency theory which suggests that the managers and shareholders have conflicting goals because they have separated the ownership and control rights among them (Ball 2013). Because of the divergence in their interests, it is pretty evident that managers will use their discretion to make earnings seem near the target level so that they can achieve self-interested objectives and benefits of control (Jiraporn et al. 2008). To achieve the targeted earnings, managers use different techniques such as real earnings management and accruals earnings management. The accruals earnings management includes the change in accounting methods used for estimating different accounts like depreciation methods, and real earning management includes the delay in reporting the real activity transactions of the firm like research and development expenditure.
Firstly, this paper analyzes the proportion of different ownership types (family ownership, state ownership, managerial ownership, foreign ownership, institutional ownership, widely held firms) firms have in Pakistan. Secondly, this paper analyzes the number of firms who are using these control-enhancing mechanisms which are maneuvers that provide controlling shareholders the control rights above their cash-flow rights. Voting rights and cash flow rights are being used to measure the control and ownership of firms. We calculate voting rights and cash flow rights as explained in this scenario. For example, there are two firms, firm A and firm B. The A family holds 20% shares of firm A and firm A holds 15% shares of firm B, the cash flow right of family in firm B is 3% (the product of two percentages), and voting right is 15% (which is the weakest link in the chain of control). Thirdly, this paper analyzes the impact of control-enhancing mechanisms on accruals and real earnings management activities of firms.
We define the firm as held through a pyramid structure when the firm is owned through another firm which is not entirely held by the largest shareholder. We define the firm as a cross-holding firm when Firm A directly or indirectly controls its shares. We define the firm as held via multiple control chains when the ultimate owner controls the firm through two or three different firms to increase its voting rights. Additionally, the Jones model (1991), the Dechow et al. (1995), and Kothari et al. (2005) model are used to measure accruals earnings management because these models are predominant in capturing earning management in prior studies. Following Cohen et al. (2008), We measure real earning management by using the model of (Roychowdhury 2006).
The findings suggest that the most common control-enhancing mechanism in Pakistan is pyramidal control. A minimal number of firms opt other mechanisms as multiple control chains and cross holdings as a control-enhancing mechanism in Pakistan. The effect of pyramid structure on real earnings management and accruals earnings management was analyzed separately. The findings suggest that the pyramidal structure motivates the firms to engage in real earnings management and accrual earnings management activities in Pakistan.
The sections of the paper are organized as follows: The second sections describe the literature review on ownership concentration, ultimate control of firms, control-enhancing mechanisms, and earnings management activities of firms. The third sections provide the methodology opted for this paper. The fourth sections explain the empirical results and implications of this study. The last sections describe the conclusion and ideas for future research.
2. The Literature Review and Hypothesis Development
Manifold studies have analyzed the ownership concentration and control-enhancing mechanisms firms use to gain control rights in excess of ownership rights, i.e., (La Porta et al. 1998, 1999; Shleifer and Vishny 1986; Claessens et al. 2000; Faccio and Lang 2002). La Porta et al. (1998) found that averagely 46% of ownership is owned by the three largest shareholders (median 45%) in the world. La Porta et al. (1999) have explained that only 36% of the largest firms in wealthy economies of the world are widely held, and these countries have substantial shareholder protection rights. In developing economies, very few of the companies are widely held; hence developing countries with weak shareholder protection rights have largely concentrated ownership in firms. Most of the firms have a controlling shareholder, e.g., a family, a business group or state (La Porta et al. 1999). In many countries, a person or a family associated with a group of other businesses controls the majority of shares of the firm, which is referred to as business groups. The literature has described different mechanisms, which firms use to enhance their control, such as pyramid structures, multiple control chains, and cross-holding firms. Ample literature has suggested that pyramid among other control-enhancing mechanisms is prevailing all over the world.
In the context of Pakistan, the following studies have studied the ownership structure of firms and their impact on different performance and efficiency variables of firms. Uddin et al. (2017) have studied the impact of ownership structure on firms’ financial distress, Iqbal et al. (2014) has studied the family business groups of Pakistan and their tunneling activities, Bhutta et al. (2016) have studied the ownership concentration, client importance, and earnings management in Pakistan. Very little literature exists on the control-enhancing mechanisms (pyramid, cross holding, and multiple control chain structure) and its impact specifically on earnings management (accrual and real earnings management) in Pakistan.
The literature on earnings management indicates that earnings management is caused by agency problems. The conflict of managers and shareholders (Type-I agency problem) predicts that accounting earnings are managed by managers to dodge external shareholders about the performance of firms. Particularly, managers are involved in earnings management when their compensation is aligned with the performance of firms and when firms want to avoid the violation of debt covenant contracts (Evans and Sridhar 1996; Hayn 1995; Dye and Verrecchia 1995; and Watts and Zimmerman 1986).
Klein (2002) has defined earnings management as “the practice of distorting the true financial performance of the company.” Healy and Wahlen (1999) explained that earnings management happens when managers use their discretion to either affect transactions based on accounting values or misinform the stockholders about the actual financial performance of a firm through shaping transactions in financial reports. This shaping of transactions in financial reports leads to earnings management. Many researchers have been focusing on the research on earnings management in the firms with complex ownership structure (Kim and Yi 2006; Jungeun et al. 2012; and Beuselinck and Deloof 2014). Byun et al. (2013) explained the motivations for these business groups to manage earnings, which comprises the divergence in control and cash flow rights within the pyramid group, group level control issues as well as firm-level considerations, industry structure of the group, and the presence of banks in a business group. These motivations explain that business groups have more opportunities and tools to manage their earnings with a minimum chance of being detected due to their complex nature. In Pakistan, most of the firms belong to business groups owned by families.
According to literature, the use of control-enhancing mechanisms and concentration in voting rights are related with earnings management in two distinct ways. Firstly, as explained by entrenchment theory, the controlling shareholders have motivations to be involved in opportunistic earnings management to enjoy the private benefits by using pyramid control. The large shareholders extract private benefits (type-II agency problem) by enhancing their control in firms with small fractions of equity ownership. In this way, the quality of reported information is declined to cover the impacts of expropriated wealth and losses caused by extracting private benefits. Secondly, the alignment theory explains that concentration of ownership motivates the owners and managers to focus on long term investment horizon and less focused on short term and immediate profits. Hence, as the separation of ownership and control decreases, the conflict between managers and owners declines, so firms’ practice of earnings management decreases due to more and better results expected by owners (Jung and Kwon 2002).
Leuz et al. (2003); Kim and Yi (2006) demonstrated the phenomena where the protection of investors is weak and reduced, companies with undue separation of ownership and control practices earnings management for sure. Generally, the controlling family controls each affiliate via a pyramidal structure or reciprocal share agreement. The important decisions among affiliates come from the controlling family rather than from professional management (Jungeun et al. 2012). Sarkar et al. (2013) have examined the effect of the complexity of ownership structure on earnings management and pronounced that firms affiliated with ownership groups (pyramidal groups) have a U-shaped relationship with earnings management activities. Additionally, some studies have studied the cross-holding mechanisms for enhancing the control (Yakura and Guo 2009) and explained the impact of cross-holding structure in Chinese firms. They suggested some drawbacks of cross-holding mechanisms as (i) over-inflation of capital; (ii) cross shareholding create problems in corporate governance like helplessness of shareholders to monitor the company’s management, which fosters the control of insiders; and (iii) it also leaves negative impact on the capital market. These drawbacks of cross-holding structure foster the manipulation of share prices in the market which can dodge external investors. Hence, the cross-holding structure (because of enhanced insider control) can also motivate investors to get involved in both types of earnings management.
Li and Liao (2014) and Li et al. (2011) explained that emerging markets are more apt to earnings management in firms than developed markets. Chang (2003) specified that families and ultimate shareholders hold more shares of firms with assuring returns and profits based on the inside information of intragroup transfer to affiliates. Bebchuck et al. (2000) have revealed that owners with controlling power extract personal benefits and encourage opportunistic behavior at the expense of minority shareholders (Type II agency problem). The excessive separation of ownership and control diminishes the pressure from the financial market about maximizing the firms’ value, and managers are less attentive to the results (Klassen 1997). Briamonte et al. (2017) have recently studied the relationship of pyramidal ownership with earnings management in Italy. The principal findings of this study refer to the higher probability of adopting earnings management behavior in pyramidal ownership firms than non-pyramid firms. Bhaumik and Gregoriou (2010); Chen et al. (2011) and Aharony et al. (2010) have emphasized that managers often use accruals earnings management to maximize managerial compensation, and they use real earnings management to attract more capital at low cost and confiscate benefit from the minority shareholders.
Type I and Type II agency problems both lead to earnings management, but the purposes and technique to be used are different. In Type I agency problems, managers use discretionary accruals to manage earnings to get rid of the violation of debt covenants and maximize the compensation. In type II agency problems, the controlling shareholders use real earnings management to usurp minority shareholders’ rights and to magnetize outside shareholders at low cost of capital. When firms use pyramid control, the cash flow and control rights will be highly deviated, and controlling shareholders can make risky decisions. For example, the decrease in the share price of an affiliate may not have high impact on controlling shareholders, but it will have impact on the affiliated firm’s cash flows (Malan et al. 2012).
Mindzak and Zeng (2018) have studied the relationship of pyramid owned firms with real and accrual-based earnings management in Canada. They have reported that firms with higher separation of ownership and control are positively associated with real earnings management. Additionally, intra-group transactions, except internal financing, lead to more accrual and real earnings management.
Based on the above discussions we hypothesize:
Hypothesis 1a.
Pyramid structure has a positive impact on real earnings management activities of firms in Pakistan.
Hypothesis 1b.
Multiple control chains structure has a positive impact on real earnings management activities of firms in Pakistan.
Hypothesis 1c.
Cross-holding structure has a positive impact on real earnings management activities of firms in Pakistan.
Hypothesis 2a.
Pyramid ownership has a positive impact on accrual earnings management activities of firms in Pakistan.
Hypothesis 2b.
Multiple control chains structure has a positive impact on accrual earnings management activities of firms in Pakistan.
Hypothesis 2c.
Cross-holding structure has a positive impact on accruals earnings management activities of firms in Pakistan.
3. Data and Research Methods
3.1. Sample Selection and Data Sources
The preliminary sample of this paper contains all firms listed on the Pakistan Stock Exchange (PSX) from the analysis period of 2005 to 2016. Additionally, financial firms are not included in the sample because of different regulations, industrial settings, and risk. Firms must be listed for one year to be included in the sample each year. The firms which are delisted in any part of the period are excluded. Firms which have missing data on ownership structure, control-enhancing mechanisms, and earnings management are also excluded from the sample. The sample extracted consists of 3624 firm-year observations for the data of ownership concentration and control-enhancing mechanisms. This data is extracted from the balance sheet analysis published by the State Bank of Pakistan. The data on ownership types and their pattern of shareholding determine the control-enhancing mechanism they are using, so these data are collected from the annual reports of the firms. Annual reports are the most reliable source to collect data and information about firms. Table 1 explains the classification of firms which are part of analysis in this study.

Table 1.
Industry classification of firms.
3.2. Measurement of Variables
3.2.1. Ownership Types
- Family ownership (FAMO)
In Pakistan, family ownership is widespread in firms; we include family ownership in our study as a dummy variable, which equals to one if the family has 20 or more percentage of ownership and is the largest shareholder of the firm having a family member as a representative on board, otherwise zero.
- Foreign ownership (FORO)
Foreign ownership is quite uncommon in Pakistan because there is a small number of foreign firms working in Pakistan, but they are part of ownership concentration through holdings in different company shares. We measure foreign ownership as dummy variable equals to 1 if a foreign investor or foreign firm is holding 10% or more in the shares of the firm, otherwise zero.
- Institutional ownership (INSO)
Institutional ownership usually defined as ownership by institutions, we used a dummy variable equal to 1 if 5 or more percentage of the firm’s shares are owned by institutions (mutual funds, pension funds, insurance companies, investment firms, endowments, privately held firms, or any other firm providing services of managing funds on behalf of others), otherwise zero. Prior studies suggested that shares held by fund companies are a better proxy to measure institutional ownership (Guo and Ma 2015).
- Widely held (WIDO)
There are several firms which are widely held in Pakistan; we include widely held firm in our study to analyze the percentage of firms widely held in the country. We measure widely held firms as a dummy variable equal to 1 if firms’ shares are widely held at the control threshold which is 20%, otherwise zero.
- State-owned (STAO)
In Pakistan, there are a number of firms whose shares are held by the government of Pakistan, we include state ownership in our study which is calculated as a dummy variable, which is equal to 1 if 20 or more percentage of the firm’s shares is held by government or any government-owned institute or agency, otherwise zero.
- Managerial ownership (MANO)
Managerial ownership is quite prevailing in Pakistan; we include managerial ownership as a dummy variable equal to 1 if the CEO, board chairman, or vice-chairman, or managers hold 20 or more percentage of shares in the company, zero otherwise.
3.2.2. Calculation of Cash Flow Right and Control Right
Cash flow rights define corporate ownership, and voting rights define corporate control in the firms. We measure cash flow and control right of the firms by scrutinizing all the shareholders who control more than 5% of the votes. In most of the firms, business entities, financial institutions, and families are the majority shareholders of the firms. We trace their owners, owners of their owner, by studying the pattern of shareholdings of the firms and the footnotes of financial statements. The ownership and control structure in Pakistan is very complex and linked enormously; Figure 1 depicts the example of a family owned businesses and its ownership and control links with its associated companies and subsidiaries.
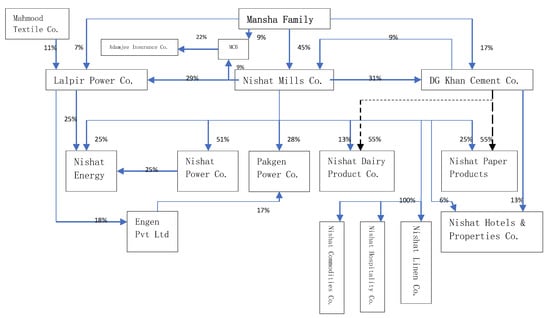
Figure 1.
The example of complex ownership and control chain structure of a family in Pakistan.
- Pyramidal structure (PYO)
The pyramid structure is defined as when an ultimate owner (family, business organization, financial institute) controls a firm (A) indirectly by holding the shares of the firm (B), that owner does not entirely control. For instance, if a family owns firm A by 15%, firm A owns firm B by 20%, then family controls firm B indirectly through Pyramid structure at a 10% threshold. If we calculate the cash flow rights and voting rights of this family in firm B, then cash flow rights are the product of both percentages (0.15 × 0.20 = 0.03 or 3%), and voting rights are calculated as the weakest link in the chain (15%). The family has 3% cash flow rights, and 15% of voting rights in firm B, this discrepancy between ownership and control affects the firms’ objectives. Though, at a threshold of 20%, we would define firm B as a widely held firm which is controlled directly by firm A without any pyramid structure. Appendix A Figure A1 represents the typical pyramid structure in Pakistan.
- Multiple control chains structure (MCH)
Multiple control chain structure is defined as when a firm is controlled through multiple channels or links; each link includes at least 5% of the voting rights. For instance, in the pyramid structure example, assume that firm B is also directly controlled by family by 12%. Now the firm B is controlled through two links; one is the direct ownership link (12%), another is the indirect ownership via firm A (15%). Now the cash flow rights and control rights of the family in firm B are 15% (3% indirect 12% direct) and 27% (15% indirect 12% direct) respectively. Additionally, multiple control chains structure can also exist without pyramid situation. For instance, firm X controls firm Y by 10% and firm Z by 100%, firm Z controls 15% of firm Y. Now in this chain, firm Z is entirely controlled by firm X, and there is no pyramid holding. However, firm Y is controlled through two chains of firm X and firm Z having voting rights of 25% (0.10 0.15% × 1 = 0.25 or 25%). Now this situation fulfills all three conditions of multiple control chain structure. (1) There is an ultimate controlling owner of firm Y at 20% threshold, (2) firm Y is controlled through multiple links. (3) All links involved are more than 5% of control rights.
- Cross-holding structure (CHO)
The cross-holding structure of a firm is defined as when a firm directly or indirectly holds its stocks by at least 20% level. For instance, when firm A owns 20% stake in firm B, and firm B owns a 20% stake in firm A, then firm A is controlled through a cross-holding structure at 20% threshold.
3.2.3. Measurement of Earnings Management
Earnings management is generally captured in two dimensions. One is accruals earnings management, and another is real earnings management. Accruals earning management is when firms use discretionary power in selecting different accounting methods (such as depreciation) to manipulate earnings. The real earnings management in which firms make real transactions to delay in recording the significant expenses to report higher earnings or the delay in recording the revenue to report lower earnings, it depends on the purpose of managers who either want earnings to be overestimated or underestimated. We have included both dimensions of earnings management in our study to analyze the impact of ownership concentration and control-enhancing mechanisms on accruals and real earnings management activities of firms.
Accruals Earnings Management (AEM)
Discretionary accruals are managed by managers of the firm to manipulate earnings positively or negatively. It depends on the managers who either want to overstate or understate the earnings. Usually, overstatement occurs when they want to raise prices of shares, deceive the shareholders for a better picture of firms, and to make up the perception of investors to issue new shares in the future. Understatement occurs when they want to avoid regulatory costs. So, following (Jiambalvo et al. 2002; Warfield et al. 1995; and Becker et al. 1998), we capture understatement and overstatement by taking the absolute value of discretionary accruals. For calculation of discretionary accruals, we need aggregate accruals first. So, following (Klein 2002; Xie et al. 2003; Huang et al. 2007; Jaggi and Leung 2007), we measure aggregate accruals of the firm by cash flow approach as follows:
where is total accruals of the firm i in year t, is the earning before extraordinary or abnormal items for the firm i in year t, is the cash flow from the operation of the firm i in year t. Hribar and Collins (2002) have explained that the cash flow approach of calculation total accruals is better than other methods.
Now we take total accrual as the dependent variable in the Jones model (1991), which explains the non-discretionary accruals. We take the absolute value of residual as the first proxy of discretionary accruals to measure accruals earnings management. The Jones model (1991) is as follows:
where, is total accruals of firm i in year t, is the total assets of firm i in year t − 1, is the change in sales of the firm i in year t, is the amount of property plant and equipment of the firm i in year t, and is the residual of the firm which defines the discretionary accruals.
We have used the second proxy of accruals earnings management by using the modified Jones model given by Dechow et al. (1995), which is the modified version of the Jones model. We describe the model as follows:
where, is the total accruals of firm, is the total assets of the firm in year t − 1, is the change in revenues of firm, is the change in accounts receivable of the firm, is the amount of property plant and equipment of the firm, is the discretionary accruals of the firm, and it is used in this study to predict accruals earnings management.
We have used third proxy of calculating accruals earnings management by using the model of Kothari et al. (2005), which is as follows:
where, there is only one variable added in the modified Jones model, which is the return on assets of the firm in year t − 1. We use the absolute of residual as a proxy of accruals earnings management. Kothari et al. (2005) shows the discretionary accruals estimated by Jones and the modified Jones model may include rigorous estimation error in discretionary accruals as these models ignore the impact of earning performance. So, we have used all three famous measures on accruals earnings management in our study. To model the effect of controlling mechanisms on accruals earnings management we have used multiple regression analyses controlling the year and industry effects, as follows:
Measurement of Real Earnings Management
Cohen and Zarowin (2010) have explained that real earning management is the intentional act of managers that distract firms from standard practices. Several real earnings management measures are used in the previous literature as abnormal loss or gain from the sale of assets (Gunny 2009), abnormal research and development expenditure (Zang 2012; Roychowdhury 2006; Gunny 2009) and unexpected cash flow from operations (Roychowdhury 2006). We followed (Cohen et al. 2008; Roychowdhury 2006) and used the proxy of real earnings management through cutting expenses on discretion by overproduction. Firms produce more than the required units to reduce per unit cost and to increase their earnings. Firms also reduce their expenses like research and development expenditure to increase the earnings in the short term, but cutting research and development expenditure will harm the firm in the long term (Cohen et al. 2008).
where, is the sum of the cost of goods sold in the current year and change in inventory from previous to current year, is the total assets of the firm in year t − 1, is the net sales of the firm in the current year, is the change in net sales from the previous to current year, is the lag of change in sales. The residual of this model represents the abnormal production cost which is used as a proxy of real earnings management in this study.
We have used the second proxy of earnings management through discretionary expenses. Following the model used by Sun and Rath (2010) we estimated the model as follows:
where is the discretionary expenses which are calculated as other operating expenses which includes R&D expenses, selling, general and administrative expenses, advertising expenses, and other general expenses. All other variables are explained previously. We have used the residual of this model as a proxy of real earnings management which represents the abnormal discretionary expenses of the firm. We also multiplied by abnormal discretionary expenses by −1, in order to capture the amount reduced in discretionary expenses to increase the earnings.
We have used third proxy of real earnings management as the sum of overproduction and discretionary expenses (the above two proxies) to get the total real earnings management implied by the firm. To employ the effect of controlling mechanisms on real earnings management we have used multivariate regression analysis controlling year and industry effects as follows:
Control variables are the factors analyzed by prior studies to be related with earnings management (Rangan 1998; Shivakumar 2000; Roychowdhury 2006; Ball and Shivakumar 2008; Cohen and Zarowin 2010; Choi et al. 2011; Banko et al. 2013; Wongsunwai 2013; Achleitner and Braun 2014). Following them, we have used the firms’ age, firms’ loss, growth in sales, size of firm, leverage, return on asset, and cash flow from operation as a control variable in this study. Age of firm (AGE) is measured as the number of years the firm has operated from its year of incorporation till present, the firms’ loss is a dummy variable equal to one if the firms’ net income is negative, otherwise zero. Growth in sales (sales growth) is measured as the change in sales of the firm, size of firm (SIZE) is calculated as log of total assets of the firm, leverage (LEV) is measured as the sum of the current and long-term liabilities deflated by total assets of the firm, return on assets (ROA) is measured as the ratio of net income to total assets of the firm, cash flow from operations (CFO) is measured as the log of cash flow from operations. Appendix A Table A1 represents the measurement of main variables used in the study.
4. Empirical Results and Discussion
Table 2 presents the descriptive statistics of the variables used in this study. ABSDAMJ, ABSDAK, ABSDAJ are discretionary accruals which are measures of accruals earnings management using the modified Jones, Kothari and Jones models respectively. ABSOVP, DISEXP, and TREM are overproduction, discretionary expenses, and total real earnings management, which are measures of real earnings management. The mean values show that on average firms have higher accruals earnings management than real earnings management. The mean value of PYO 0.3470 shows that on average 43% of firms in Pakistan are using pyramidal ownership to intensify their control in firms. The mean value of MCH (0.1026) shows that 10.26% of firms are using multiple control chains to improve their control and 0.0943 shows that 9.4% of firms are using cross-holdings ownership to enhance control. Mostly, the firms in Pakistan are owned through pyramid structures, and this is aligned with the result of other studies in developing markets (Claessens et al. 2000; Lemmon and Lins 2003). Age, firm loss, sales growth, size, leverage, CFO, and ROA are used as control variables in this study.
Table 2.
Descriptive statistics.
Table 3 shows the correlation coefficient of the variables used in the study. The proxies used for accruals earnings management and the real earnings management are related to each other, but we have used them in separate models, so it is not a problematic value for the model. With all other variables, there is no significant correlation coefficient, so there is no multicollinearity in the model. We have also reported variance inflation factors of the models in the tables. The table also indicates that pyramidal ownership of firms is positively and significantly associated with the size of the firm, noting that large firms do more pyramiding than small firms. Pyramidal ownership is also significantly positively associated with the cash flow of the firm, indicating that pyramid owner firms have more cash flows available in hand than non-pyramidal firms. The total real earnings management and pyramidal ownership are positively and significantly associated with each other, depicting that pyramid owned firms do total real earnings management.
Table 3.
Correlation analysis.
Table 4 represents the proportion of firms in Pakistan who have a particular type of ownership structure. It also shows the proportion of firms using control-enhancing mechanisms. In Pakistan, almost 80% of the firms have family ownership 15.2% of firms are owned through foreign ownership, Institutions are holding around 43.2% of firms, only 3.2% of the firms are widely held, state and managers holding 3.3% of firms own 3.9% of the firms. The most common control-enhancing mechanism is pyramidal structure, which is 43.7%, multiple control chains and cross-holding mechanisms are being used by 10.2% and 9.4% of the firms in Pakistan respectively.
Table 4.
Ownership and control-enhancing mechanism proportions in Pakistan.
4.1. Control-Enhancing Mechanisms and Accruals Earnings Management
Table 5 shows the empirical results of accruals earnings management by the modified Jones model (1991), Jones model (1991) and Kothari et al. (2005) model respectively. The coefficients of PYO and MCH are positive and statistically significant in relationship with accruals earning management. It is aligned with the notion that firms with pyramid ownership structure and firms which are controlled through multiple channels engage in accruals earnings management than other firms which are not following these mechanisms to enhance control. However, the cross-holding structure is not significantly affecting the accruals earnings management proxies, which represents that firms with cross-holding mechanisms do not involve in earnings management through discretionary models. Additionally, the size of the firm is negatively and significantly related to accruals earnings management representing that larger firms are less involved in earnings management through discretionary accruals. According to Wang (2006); Chan et al. (2014) and Achleitner and Braun (2014) the larger firms face administrative costs and try not to engage in accruals earnings management activities. Firms with higher leverage, high cash flows from operations and a higher return on the asset are positively and significantly associated with accruals earnings management, meaning that these firms do earnings management through discretionary accruals. Firms’ age, sales growth, and loss of firms are insignificant in relationship with accruals earnings management in Pakistan, representing that these variables are not statistically significant with accruals earnings management. All the proxies of earnings management have similar results and we have used these proxies to check robustness of the results.
Table 5.
Results for accruals earnings management models (modified Jones model 1995; Jones model 1991; Kothari et al. 2005).
4.2. Control-Enhancing Mechanisms and Real Earnings Management
Table 6 shows the results of real earnings management through the overproduction model, discretionary expenses model, and total real earning management measures following the model of Roychowdhury (2006). The coefficient of PYO and MCH are positive and significant in all models, which means that firms with pyramid control and multiple channel control opt earnings management through overproduction and discretionary expenses. Overproduction concept explains that firms produce more of their units and increase the level of inventory in firms so that they can reduce the per unit cost of production; reduction in per unit cost causes an increase in the level of earnings in firms. These activities are considered as earning manipulation because the increased level of earnings can unusually benefit the firms like, increase in their share price, cheap access to external finance, meeting, or beating the earning forecast, etc. The discretionary expenses concept describes that firms reduce their discretionary expenses to increase their earnings abnormally (Anagnostopoulou and Tsekrekos 2017). Past research has also found an artificial increase in sales can also be used as an earning management technique in firms (Cohen and Zarowin 2010; Cohen et al. 2008; Roychowdhury 2006). The decrease in discretionary expenses has a positive and conflicting impact on the cash flow of firms, which is why the abnormal cash flows are not used as a proxy to measure earning management in previous research (Anagnostopoulou and Tsekrekos 2017). However, cross-holding structure is insignificant in affecting real earnings management through overproduction and discretionary expenses, so as in total real earnings management.
Table 6.
Results for real earnings management models (Roychowdhury 2006).
Additionally, the age of the firm is also positively and significantly associated with overproduction, discretionary expenses, and total REM model, indicating that older firms tend to produce more than the required level of inventory and increase or decrease the level of discretionary expenses in firms to manage earnings. Sales growth is negatively and statistically significantly associated with overproduction and discretionary expenses model in firms at 1 percent level of significance, which means that higher change in sales manages more real earnings (Mindzak and Zeng 2018). The coefficient of the size of the firm is negatively and significantly related with overproduction, at 5 percent level of significance representing that larger firms are less involved in real earnings management through overproduction of inventory. According to Watts and Zimmerman (1986); Wang (2006); Chan et al. (2014) and Achleitner and Braun (2014) the larger firms face administrative costs and try not to engage in real earnings management activities. The coefficient of leverage is positively and significantly related with the overproduction model and total REM model at 1 percent level of significance, indicating that firms with higher leverage are doing overproduction to manipulate their earnings so that they can avoid debt covenant violations. This result is consistent with Kim et al. (2011); Jaggi and Lee (2002). Firms with higher leverage have different motivations to engage in real earning management like, firms tend to secure the perception of outside capital providers (investors or debtors) so that they can secure the findings for future (Rodríguez-Pérez and van Hemmen 2010), to decrease the perceived risk so that they can improve their reserve bargaining Sun and Rath (2010).
Return on assets is negatively and significantly associated with overproduction, discretionary expenses, and total REM model which means that real earning management is undertaken even in the presence of performance measures (Anagnostopoulou and Tsekrekos 2017). Other control variables carry over the loss, and cash flow from operations are not statistically significant in the relationship with real earning management through overproduction and discretionary expenses, so as in total REM.
5. Conclusions
This study examines the relationship between control-enhancing mechanisms, notably the pyramid and earnings management activities of firms. Pyramid ownership is analyzed with both techniques of earning management: Accrual-based earnings management and real earnings management. We find that the firms affiliated with pyramid group are engaged in accruals earnings management and real earnings management than firms which are not affiliated with any pyramidal or another group. We further find that multiple control chains groups are also engaged in real earnings management. Cross-holding firms are very few in Pakistan so we could not find a significant impact of cross-holding structure on earning management of firms. In conclusion, this study provides the empirical findings that pyramidal ownership is importantly related to accrual-based and real-based earnings management of firms in Pakistan.
These findings are only applying to the listed firms on the Pakistan Stock Exchange, and researchers should be cautious when applying the inferences on other countries data. These findings are helpful for policy advisers, policymakers, firms’ owners, stockholders, and academicians. The findings of this paper are aligned with the findings of Asian and East Asian studies (La Porta et al. 1998, 1999; Shleifer and Vishny 1986; Claessens et al. 2000; Faccio and Lang 2002; Bhutta et al. 2016). These studies revealed that firms become involved in pyramidal groups to expropriate the benefits of minority stockholders and build their empires by throwing the risk on the shoulders of minority stockholders. Future researchers can analyze the impact of pyramid structure on tunneling activities, investment efficiency, and innovation activities of firms in Pakistan or other countries.
Author Contributions
All the authors have contributed equally to the paper.
Funding
The research received no external funding.
Conflicts of Interest
The authors declare no conflict of interest.
Appendix A

Figure A1.
Typical pyramid structure in Pakistan.
Table A1.
Variable measurements.
Table A1.
Variable measurements.
| Variable Name (Notation) | Variable Definition |
|---|---|
| Family ownership (FAMO) | A dummy variable, which equals to one if the family has 20 or more percentage of ownership and is the largest shareholder of the firm having a family member as a representative on board, otherwise zero. This proxy has been used by Bhaumik and Gregoriou (2010); Bodnaruk et al. (2017). |
| Foreign ownership (FORO) | A dummy variable equals to 1 if a foreign investor or foreign firm is holding 10% or more in the shares of the firm, otherwise zero. |
| Institutional ownership (INSO) | A dummy variable equals to 1 if 5 or more percentage of firm’s shares are owned by institutions (mutual funds, pension funds, insurance companies, investment firms, endowments, privately held firms or any other firm providing services of managing funds on behalf of others), otherwise zero. This proxy has been used in Bodnaruk et al. (2017) and (Guo and Ma 2015). |
| Widely-held ownership (WIDO) | A dummy variable equals one if firms’ shares are widely held at the control threshold which is 20%, otherwise zero. |
| State ownership (STAO) | A dummy variable, which is equal to 1 if 20 or more percentage of shares of the firm is held by government or any government-owned institute or agency, otherwise zero. |
| Managerial ownership (MANO) | A dummy variable equals to one if CEO, board chairman, or vice-chairman, or managers hold 20 or more percentage of shares in the company, zero otherwise. |
| The pyramid control mechanism (PYO) | A dummy variable equals one if a firm is owned through a pyramid structure, Otherwise 0. |
| Multiple control chain mechanism (MCH) | A dummy variable equals one if a firm is owned through a multiple control chain structure, Otherwise 0. |
| Cross-holding mechanism (CHO) | A dummy variable equals one if a firm is owned through a cross-holding structure, Otherwise 0. |
ACCRUALS EARNINGS MANAGEMENT:
| ABSDAJ: The absolute value of the residual taken from the Jones (1991) model. ABSDAMJ: The absolute value of residual taken from the modified Jones model (1995). ABSDAK: The absolute value of the residual taken from the Kothari et al. (2005) model. |
REAL EARNINGS MANAGEMENT:
| ABSOVP: The absolute value of the residual taken from the Roychowdhury (2006) model. DISEXP: The absolute value of the residual taken from the Roychowdhury (2006) model. TREM: The aggregate sum of both residuals (OP and DISEXP). |
References
- Achleitner, Ann-Kristin, and Reiner Braun. 2014. Entrepreneurial Finance: EinÜberblick. In Handbuch Entrepreneurship. Berlin: Springer, pp. 1–20. [Google Scholar]
- Aharony, Joseph, Wang Jiwei, and Yuan Hongqi. 2010. Tunneling as an incentive for earnings management during the IPO process in China. Journal of Accounting and Public Policy 29: 1–26. [Google Scholar] [CrossRef]
- Ahmed, Hafeez, and Attiya Yasmin Javid. 2008. Dynamics and determinants of dividend policy in Pakistan (evidence from Karachi stock exchange non-financial listed firms). International Research Journal of Finance and Economics 25: 148–71. [Google Scholar]
- Ahmad, Hafeez, and Attiya Javid. 2010. The ownership structure and dividend pay-out policy in Pakistan (evidence from Karachi stock exchange 100 index). International Journal of Business Management and Economic Research 1: 58–69. [Google Scholar]
- Anagnostopoulou, Seraina, and Tsekrekos Andrianos. 2017. The effect of financial leverage on real and accrual-based earnings management. Accounting and Business Research 47: 191–36. [Google Scholar] [CrossRef]
- Ball, Ray. 2013. Accounting informs investors and earnings management is rife: Two questionable beliefs. Accounting Horizons 27: 847–53. [Google Scholar] [CrossRef]
- Ball, Ray, and Lakshmanan Shivakumar. 2008. Earnings Quality at Initial Public Offerings. Journal of Accounting and Economics 45: 324–49. [Google Scholar] [CrossRef]
- Banko, John, Melissa Frye, Weishen Wang, and Ann Marie Whyte. 2013. Earnings Management and Annual General Meetings: The Role of Managerial Entrenchment. The Financial Review 48: 259–82. [Google Scholar] [CrossRef]
- Bao, Shuji Rosey, and Krista Lewellyn. 2017. Ownership structure and earnings management in emerging markets—An institutionalized agency perspective. International Business Review 26: 828–38. [Google Scholar] [CrossRef]
- Bebchuck, Lucian Arye, Reinier Kraakman, and George Triantis. 2000. Stock Pyramids, Cross-Ownership, and Dual Class Equity. In Concentrated Corporate Ownership. Edited by Randall K. Mork. Chicago: University of Chicago Press. [Google Scholar]
- Becker, Connie L., Mark L DeFond, James Jiambalvo, and K. R. Subramanyam. 1998. The effect of audit quality on earnings management. Contemporary Accounting Research 15: 1–24. [Google Scholar] [CrossRef]
- Berle, Adolf, and Gardiner Means. 1932. Private Property and the Modern Corporation. New York: Mac-Millan. [Google Scholar]
- Beuselinck, Christof, and Marc Deloof. 2014. Earnings management in business groups: Tax incentives or expropriation concealment? The International Journal of Accounting 49: 27–52. [Google Scholar] [CrossRef]
- Bhaumik, Sumon Kumar, and Andros Gregoriou. 2010. ‘Family’ ownership, tunneling and earnings management: A review of the literature. Journal of Economic Surveys 24: 705–30. [Google Scholar] [CrossRef]
- Bhutta, Aamir, Johan Knif, and Muhammad Fayyaz Sheikh. 2016. Ownership Concentration, Client Importance, and Earnings Management: Evidence from Pakistani Business Groups. SSRN Electronic Journal. [Google Scholar] [CrossRef]
- Bodnaruk, Andriy, Massimo Massa, and Vijay Yadav. 2017. Family ownership, country governance, and foreign portfolio investment. Journal of Empirical Finance 41: 96–115. [Google Scholar] [CrossRef]
- Briamonte, Massimiliano Farina, Felice Addeo, Fabio Fiano, and Marco Sorrentino. 2017. The Effect of Pyramidal Structures on Earnings Management: Evidence from Italian Listed Companies. Corporate Ownership & Control 14: 64–73. [Google Scholar]
- Brown, Kareen, Changling Chen, and Duane Kennedy. 2017. Target ownership plans and earnings management. Advances in Accounting 36: 87–101. [Google Scholar] [CrossRef]
- Butt, Safdar, and Arshad Hasan. 2009. Impact of ownership structure and corporate governance on the capital structure of Pakistani listed companies. International Journal of Business & Management 4: 8. [Google Scholar]
- Byun, Hae-Young, Sunhwa Choi, Lee-Seok Hwang, and Robert G. Kim. 2013. Business group affiliation, ownership structure, and the cost of debt. Journal of Corporate Finance 23: 311–31. [Google Scholar] [CrossRef]
- Chan, Lilian H., Kevin CW Chen, Tai Yuan Chen, and Yangxin Yu. 2014. Substitution between real and accruals-based earnings management after voluntary adoption of compensation clawback provisions. The Accounting Review 90: 147–74. [Google Scholar] [CrossRef]
- Chang, Sea Jin. 2003. Ownership structure, expropriation, and performance of group-affiliated companies in Korea. Academy of Management Journal 46: 238–53. [Google Scholar]
- Chen, Xia, Jarrad Harford, and Kai Li. 2007. Monitoring: Which institutions matter? Journal of financial Economics 86: 279–305. [Google Scholar] [CrossRef]
- Chen, Charles J.P., Zengquan Li, Xijia Su, and Zheng Sun. 2011. Rent-seeking incentives, corporate political connections, and the control structure of private firms: Chinese evidence. Journal of Corporate Finance 17: 229–43. [Google Scholar] [CrossRef]
- Choi, Suk Bong, Soo Hee Lee, and Christopher Williams. 2011. Ownership and firm innovation in a transition economy: Evidence from China. Research Policy 40: 441–52. [Google Scholar] [CrossRef]
- Claessens, Stijn, and Joseph PH Fan. 2002. Corporate governance in Asia: A survey. International Review of Finance 3: 71–103. [Google Scholar] [CrossRef]
- Claessens, Stijn, Simeon Djankov, and Larry HP Lang. 2000. The separation of ownership and control in East Asian corporations. Journal of Financial Economics 58: 81–112. [Google Scholar] [CrossRef]
- Cohen, Daniel A., and Paul Zarowin. 2010. Accrual-Based and Real Earnings Management Activities Around Seasoned Equity Offerings. Journal of Accounting and Economics 50: 2–19. [Google Scholar] [CrossRef]
- Cohen, Daniel A., Aiyesha Dey, and Thomas Z. Lys. 2008. Real and accrual-based earnings management in the pre-and post-Sarbanes-Oxley periods. The Accounting Review 83: 757–87. [Google Scholar] [CrossRef]
- Dechow, Patricia M., Richard G. Sloan, and Amy P. Sweeney. 1995. Detecting earnings management. Accounting Review 70: 193–225. [Google Scholar]
- Ducassy, Isabelle, and Alexis Guyot. 2017. Complex ownership structures, corporate governance, and firm performance: The French context. Research in International Business and Finance 39: 291–306. [Google Scholar] [CrossRef]
- Dye, Ronald A., and Robert E. Verrecchia. 1995. Discretion vs. uniformity: Choices under GAAP. The Accounting Review 70: 389–415. [Google Scholar]
- Evans, John H., and Sri S. Sridhar. 1996. Multiple control systems, accrual accounting, and earnings management. Journal of Accounting Research 34: 45–65. [Google Scholar]
- Faccio, Mara, and Larry HP Lang. 2002. The ultimate ownership of Western European corporations. Journal of Financial Economics 65: 365–95. [Google Scholar] [CrossRef]
- Fan, Joseph PH, and Tak Jun Wong. 2002. Corporate ownership structure and the informativeness of accounting earnings in East Asia. Journal of Accounting and Economics 33: 401–25. [Google Scholar] [CrossRef]
- Gedajlovic, Eric, and Daniel M. Shapiro. 2002. Ownership structure and firm profitability in Japan. Academy of Management Journal 45: 565. [Google Scholar]
- Gunny, Katherine A. 2009. The relation between earnings management using real activities manipulation and future performance: Evidence from meeting earnings benchmarks. Contemporary Accounting Research 27: 855–88. [Google Scholar] [CrossRef]
- Guo, Fei, and Shiguang Ma. 2015. Ownership Characteristics and Earnings Management in China. Chinese Economy 48: 372–95. [Google Scholar] [CrossRef]
- Hayn, Carla. 1995. The information content of losses. Journal of Accounting and Economics 20: 125–53. [Google Scholar] [CrossRef]
- He, Wei, and NyoNyo A. Kyaw. 2018. Ownership structure and investment decisions of Chinese SOEs. Research in International Business and Finance 43: 48–57. [Google Scholar] [CrossRef]
- Healy, Paul M., and James M. Wahlen. 1999. A review of the earnings management literature and its implications for standard setting. Accounting Horizons 13: 365–83. [Google Scholar] [CrossRef]
- Holderness, Clifford G., Randall S. Kroszner, and Dennis P. Sheehan. 1999. Were the good old days that good? Changes in managerial stock ownership since the great depression. The Journal of Finance 54: 435–69. [Google Scholar] [CrossRef]
- Hribar, Paul, and Daniel W. Collins. 2002. Errors in estimating accruals: Implications for empirical research. Journal of Accounting Research 40: 105–34. [Google Scholar] [CrossRef]
- Huang, Hua-Wei, Suchismita Mishra, and Kanan Raghunandan. 2007. Types of nonaudit fees and financial reporting quality. Auditing: A Journal of Practice & Theory 26: 133–45. [Google Scholar]
- Ikram, Atif, Syed Ali, and Asjad Naqvi. 2005. Family Business Groups and Tunneling Framework: Application and Evidence from Pakistan. Lahore: Centre for Management and Research Lahore University of Management Sciences. [Google Scholar]
- Iqbal, Nadeem, Naveed Ahmad, and Hamad Naqvi. 2014. Corporate social responsibility and its possible impact on a firm’s financial performance in the banking sector of Pakistan. Arabian Journal of Business and Management Review 3: 150–55. [Google Scholar]
- Jaggi, Bikki, and Picheng Lee. 2002. Earnings management response to debt covenant violations and debt restructuring. Journal of Accounting, Auditing & Finance 17: 295–324. [Google Scholar]
- Jaggi, Bikki, and Sidney Leung. 2007. Impact of family dominance on monitoring of earnings management by audit committees: Evidence from Hong Kong. Journal of International Accounting, Auditing and Taxation 16: 27–50. [Google Scholar] [CrossRef]
- Javid, Attiya Y., and Eatzaz Ahmed. 2008. The Conditional Capital Asset Pricing Model: Evidence from Karachi Stock Exchange. No. 2008: 48. Islamabad: Pakistan Institute of Development Economics. [Google Scholar]
- Jiambalvo, James, Shivaram Rajgopal, and Mohan Venkatachalam. 2002. Institutional ownership and the extent to which stock prices reflect future earnings. Contemporary Accounting Research 19: 117–45. [Google Scholar] [CrossRef]
- Jiraporn, Pornsit, Gary A. Miller, Soon Suk Yoon, and Young S. Kim. 2008. Is earnings management opportunistic or beneficial? An agency theory perspective. International Review of Financial Analysis 17: 622–34. [Google Scholar] [CrossRef]
- Jones, Jennifer J. 1991. Earnings management during import relief investigations. Journal of Accounting Research 29: 193–28. [Google Scholar] [CrossRef]
- Jung, Kooyul, and Soo Young Kwon. 2002. Ownership structure and earnings informativeness: Evidence from Korea. The International Journal of Accounting 37: 301–25. [Google Scholar] [CrossRef]
- Jungeun, Cho, Goh Jaimin, and Lee Jaehong. 2012. Chaebol firms’ real and accrual-based earnings management in the pre-and post-Asian financial crisis periods. Journal of Modern Accounting and Auditing 8: 915. [Google Scholar]
- Kaul, Aditya, Vikas Mehrotra, and Randall Morck. 2000. Demand curves for stocks do slope down: New evidence from an index weights adjustment. The Journal of Finance 55: 893–912. [Google Scholar] [CrossRef]
- Kim, Jeong-Bon, and Cheong H. Yi. 2006. Ownership structure, business group affiliation, listing status, and earnings management: Evidence from Korea. Contemporary Accounting Research 23: 427–64. [Google Scholar] [CrossRef]
- Kim, Jeong-Bon, Dan A. Simunic, Michael T. Stein, and Cheong H. Yi. 2011. Voluntary audits and the cost of debt capital for privately held firms: Korean evidence. Contemporary Accounting Research 28: 585–615. [Google Scholar] [CrossRef]
- Klassen, Kenneth J. 1997. The impact of inside ownership concentration on the trade-off between financial and tax reporting. Accounting Review 72: 455–74. [Google Scholar]
- Klein, April. 2002. Audit committee, the board of director characteristics, and earnings management. Journal of Accounting and Economics 33: 375–400. [Google Scholar] [CrossRef]
- Kothari, Sagar P., Andrew J. Leone, and Charles E. Wasley. 2005. Performance Matched Discretionary Accrual Measures. Journal of Accounting and Economics 39: 163–97. [Google Scholar] [CrossRef]
- La Porta, Rafael, Florencio Lopez-de-Silanes, Andrei Shleifer, and Robert W. Vishny. 1998. Law and finance. Journal of Political Economy 106: 1113–55. [Google Scholar] [CrossRef]
- La Porta, Rafael, Florencio Lopez-de-Silanes, Andrei Shleifer, and Robert W. Vishny. 1999. Corporate ownership around the world. The Journal of Finance 54: 471–517. [Google Scholar] [CrossRef]
- La Porta, Rafael, Florencio Lopez-de-Silanes, Andrei Shleifer, and Robert W. Vishny. 2000. Investor Protection and Corporate Governance. Journal of Financial Economics 58: 3–27. [Google Scholar] [CrossRef]
- Lemmon, Michael L., and Karl V. Lins. 2003. Ownership structure, corporate governance, and firm value: Evidence from the East Asian financial crisis. The Journal of Finance 58: 1445–68. [Google Scholar] [CrossRef]
- Leuz, Christian, Dhananjay Nanda, and Peter D. Wysocki. 2003. Earnings management and investor protection: an international comparison. Journal of Financial Economics 69: 505–27. [Google Scholar] [CrossRef]
- Li, Kuei-Fu, and Yi-Ping Liao. 2014. Directors’ and officers’ liability insurance and investment efficiency: Evidence from Taiwan. Pacific-Basin Finance Journal 29: 18–34. [Google Scholar] [CrossRef]
- Li, Shaomin, David D. Selover, and Michael Stein. 2011. “Keep silent and make money”: Institutional patterns of earnings management in China. Journal of Asian Economics 22: 369–82. [Google Scholar] [CrossRef]
- Malan, Irfah Najihah Binti Basir, Norhana Binti Salamudin, and Noryati Binti Ahmad. 2012. The impact of pyramid structure towards corporate value among Malaysian firms. International Journal of Management and Business Studies 2: 18–24. [Google Scholar]
- Malik, Hilal Ahmed, Syed Muhammad Ahsan, and Jan Shair Khan. 2017. Impact of ownership structure on corporate social responsibility evidence from Pakistan. International Journal of Scientific & Engineering Research 8: 1938–52. [Google Scholar]
- Mindzak, Justin, and Tao Zeng. 2018. The impact of pyramid ownership on earnings management. Asian Review of Accounting 26: 208–24. [Google Scholar] [CrossRef]
- Peasnell, Ken V., Peter F. Pope, and Steven Young. 2005. Board Monitoring and Earnings Management: Do Outside Directors Influence Abnormal Accruals? Journal of Business Finance & Accounting 32: 1311–46. [Google Scholar]
- Rangan, Srinivasan. 1998. Earnings management and the performance of seasoned equity offerings. Journal of Financial Economics 50: 101–22. [Google Scholar] [CrossRef]
- Rodríguez-Pérez, Gonzalo, and Stefan van Hemmen. 2010. Debt, diversification and earnings management. Journal of Accounting and Public Policy 29: 138–59. [Google Scholar] [CrossRef]
- Roychowdhury, Sugata. 2006. Earnings management through real activities manipulation. Journal of Accounting and Economics 42: 335–70. [Google Scholar] [CrossRef]
- Sarkar, Jayati, Subrata Sarkar, and Kaustav Sen. 2013. Insider Control, Group Affiliation and Earnings Management in Emerging Economies: Evidence from India. SSRN Electronic Journal. [Google Scholar] [CrossRef]
- Shivakumar, Lakshmanan. 2000. Do Firms Mislead Investors by Overstating Earnings before Seasoned Equity Offerings? Journal of Accounting and Economics 29: 339–71. [Google Scholar] [CrossRef]
- Shleifer, Andrei, and Robert W. Vishny. 1986. Large shareholders and corporate control. Journal of Political Economy 94: 461–88. [Google Scholar] [CrossRef]
- Sun, Lan, and Subhrendu Rath. 2010. Earnings management research: a review of contemporary research methods. Global Review of accounting and Finance 1: 121–35. [Google Scholar]
- Uddin, Shahab, Muhammad Arshad Khan, and Attiya Yasmin Javid. 2017. The effects of ownership structure on the likelihood of financial distress: Empirical evidence. Corporate Governance: The International Journal of Business in Society 17: 589–612. [Google Scholar]
- Wang, Dechun. 2006. Founding family ownership and earnings quality. Journal of Accounting Research 44: 619–56. [Google Scholar] [CrossRef]
- Wang, Liu, and Kenneth Yung. 2011. Do state enterprises manage earnings more than privately owned firms? The case of China. Journal of Business Finance & Accounting 38: 794–812. [Google Scholar]
- Warfield, Terry D., John J. Wild, and Kenneth L. Wild. 1995. Managerial ownership, accounting choices, and informativeness of earnings. Journal of Accounting and Economics 20: 61–91. [Google Scholar] [CrossRef]
- Watts, Ross L., and Jerold L. Zimmerman. 1986. Positive Accounting Theory. Englewood Cliffs: Prentice-Hall. [Google Scholar]
- Wongsunwai, Wan. 2013. The effect of external monitoring on accrual-based and real earnings management: evidence from venture-backed initial public offerings. Contemporary Accounting Research 30: 296–24. [Google Scholar] [CrossRef]
- Xie, Biao, Wallace N. Davidson, III, and Peter J. Dadalt. 2003. Earnings management and corporate governance: the role of the board and the audit committee. Journal of Corporate Finance 9: 295–316. [Google Scholar] [CrossRef]
- Yakura, Shinksuke, and Li Guo. 2009. The Cross Holding of Company Shares: A Preliminary Legal Study of Japan and China. Frontiers of Law in China 4: 507–22. [Google Scholar] [CrossRef]
- Zang, Amy Y. 2012. Evidence on the Trade-Off between Real Activities Manipulation and Accrual-Based Earnings Management. The Accounting Review 87: 675–703. [Google Scholar] [CrossRef]
© 2019 by the authors. Licensee MDPI, Basel, Switzerland. This article is an open access article distributed under the terms and conditions of the Creative Commons Attribution (CC BY) license (http://creativecommons.org/licenses/by/4.0/).