Article

Bank Competition, Foreign Bank Entry, and Risk-Taking Behavior: Cross Country Evidence

by
Sichong Chen
1,
Muhammad Imran Nazir
1,*,
Shujahat Haider Hashmi
2 and
Ruqia Shaikh
3
1
School of Finance, Zhongnan University of Economics and Law, Wuhan 430073, China
2
School of Economics, Huazhong University of Science and Technology, Wuhan 430073, China
3
School of Accounting, Zhongnan University of Economics and Law, Wuhan 430073, China
*
Author to whom correspondence should be addressed.
J. Risk Financial Manag. 2019, 12(3), 106; https://doi.org/10.3390/jrfm12030106
Submission received: 14 May 2019 / Revised: 9 June 2019 / Accepted: 14 June 2019 / Published: 26 June 2019
(This article belongs to the Special Issue Commercial Banking)

Abstract

:
This unique study examines the interactive role of bank competition and foreign bank entry in explaining the risk-taking of banks over the globe. We used cross-country data for the banking sector from 2000 to 2016. Using the pooled regression model and Two-stage Least Squares model (2SLS with Generalized Method of Moments GMM), we document that foreign bank entry decreases the risk-taking behavior of the banks to a certain level and exhibits an inverted U-shaped relation with financial stability. Furthermore, the joint effect of bank competition and foreign bank entry brings financial fragility because host banks tend to make risky investments due to undue competition induced by foreign bank entry. We support the competition–fragility hypothesis when foreign bank entry goes beyond a certain threshold. Our results also suggest that restrictions on bank activities and capital regulation stringency reduce the level of the risk factor. We also applied various robustness tests, which further confirm our mainstream results. Our findings have policy implications for foreign investors and regulatory authorities.

1. Introduction

International banks operate in foreign economies through local conglomerates and cross-border lending. They offer opportunities to stimulate economic growth as they bring in capital, proficiency, liquidity, and new innovative technologies, which can encourage higher competition and improved distribution of resources (Fischer 2015). International banks also have a role of risk sharing, which suggests that they help host economies stabilize their credit supply through an economic slump and that they shift funds back to the home economy when the circumstances gets worse. The role of risk sharing can also render domestic economies to greater instability from time to time, and as a result of the global financial crisis (GFC), researchers and policymakers have articulated concerns that credit policies pursued by lending economies can have adverse spillovers on emerging economies’ position of financial stability (Rey 2013). With the formulation and implementation of financial liberalization and deregulation policies, different emerging economies have undergone substantial reforms in their banking sector since the 1990s, considered by the higher existence of foreign banks.
The transfer of bank capital across the border raises interesting questions about the central role played by foreign banks; particularly, permitting participation would introduce higher financial stability into the domestic banking market. The answer to this vital question is not only crucial for policymakers to better understand the benefits of financial globalization but also ensures better policy implications for regulatory authorities to maximize their rewards from the opening of their banking sector (Wu et al. 2017). Nowadays, the leading holding companies are organizations whose operations are distributed across the globe. Generally, such types of banks are headquartered in one of the leading developed economies, but they have extensive networks of branches by which they work abroad. The accomplishments of cross-border banking groups can generate trade-offs between benefits, with greater efficiency by better diversification and costs connected with financial instability. International diversification is also an indication of country-wise risks in a bank’s portfolio (Fang et al. 2014).
The existence of foreign banks might be beneficial for the host countries’ financial market in different ways. Firstly, foreign banks’ entry tends to lessen the cost of financial intermediation and enhance its quality. Secondly, it enhances access to different financial services for firms and households. Thirdly, it increases the economic and financial performance of borrowers. All of these benefits result from an increase in the competition, technology, product innovation, and speeding up of internal restructuring (Kraft 2004). Foreign banks might have greater access to capital from abroad; they have more stable funding sources and patterns of lending than other banks. They also hold a geographically differentiated credit portfolio and would not be as affected during periods of pressure in domestic financial markets. Additionally, the international banks that are differentiated might easily captivate shocks occurring in domestic banking markets and might have a more stable source of funds. The extent of these benefits, therefore, depends on the features of the domestic market and the foreign banks themselves. In some situations, the benefits are enormous, whereas, in others, there are only marginal benefits (Polovina and Peasnell 2015).
The globalization in the banking industry has brought an incredible increase in foreign investment, generally due to a reduction in entry barriers and the lesser cost of financial intermediation. The positive effects of foreign investment include human resource development through improved higher education (Baskaran and Muchie 2008; East Asian Bureau of Economic Research and China Center for International Economic Exchanges 2016), higher remunerations in the industry (Vijaya and Kaltani 2015), and stronger corporate governance practices accruing to better performance and financial stability (Spong and Sullivan 2007; Kim et al. 2010; Peng 2017). Foreign banks’ entry in the banking industry across the globe is usually related to better performance and financial stability in the banking industry. The foreign banks’ existence is supposed to increase the relative cost benefit in terms of production and the processing of information (Okuda and Rungsomboon 2006; Saif-Alyousfi et al. 2017). The positive association between financial stability and the existence of foreign banks in the banking industry is observed from more or less the level of the competitive environment (Yeyati and Micco 2007; Jeon et al. 2011). The banking sector serves as the primary channel by which financial fragility might be transferred to the other sectors in the economy by distracting the interbank lending market, by decreasing the credit availability, and by providing a better payment mechanism. The fear is that an increased level of bank competition might add to the financial system’s fragility, which may cause regulators to concentrate on the strategic policies that preserve financial stability in the financial sector. Foreign banks’ entry also brings advantage at the macro-economic level, particularly in enhancing profitability and also financial stability. Moreover, the existence of foreign banks heightens the growth rate and also the GDP of the host economies due to the new innovative plans and proficient distribution of resources (Shen et al. 2009; Wu et al. 2012; Ukaegbu and Oino 2014).
We used a balanced panel of 95 cross countries (developed and developing) over the period from 2000 to 2016 to examine the interactive role of bank competition and foreign banks entry on the risk-taking behavior across countries (Appendix B). We used different indicators to measure the risk-taking behavior (Z-score and non-performing loans to gross loans (NPG) ratio) and also the role of bank competition measured by H-statistics, which is a nonstructural element derived from the model (Bikker et al. 2012). Applying the pooled regression and two-stage least squares (2SLS) with generalized methods of moments (GMM) and using property rights and financial freedom as the instrumental variables, this study reveals that foreign banks’ entry mitigates risk-taking behavior to a certain level and exhibits a bell-shaped relation with financial stability. The results also indicates that the interactive effect of the level of competition and foreign banks’ entry deteriorates the financial stability of the banking sector across the globe. Our robustness tests further confirms these findings. Our results also suggest that some measures of bank regulations, such as restriction on bank activities and capital regulation stringency, reduces the level of the risk factor and enhances financial stability.
This study adds to the existing literature from different perspectives. Firstly, this is one of only a few cross-country studies that emphasizes banking sectors, in which the banking industries serve as the vital source of lending due to undeveloped financial markets. Secondly, to the best of our knowledge, this is the first study that investigates not only the interactive role of foreign bank entry and competition but also analyzes the inverted U-shaped effect of foreign banks’ entry on risk-taking behavior. Thirdly, the sample of this study covers a period that comprehends the game-changing experience of the 2008 to 2009 global financial recession. Whereas the previous empirical studies have recognized the lending behavior of multinational financial institutions during the financial crisis, the existing literature emphasizes the effect of foreign banks’ entry on domestic banks’ performance and cost efficiency (De Haas and Van Lelyveld 2014; Dekle and Lee 2015). However, our research accounts for risk-taking behavior (Z-score), which is the inverse proxy for a banks’ probability of failure. The higher value of the Z-score implies the lower level of risk and greater financial stability across the globe. Fourthly, we also included the NPG ratio as an alternative measure of financial stability and to check the robustness of results. By emphasizing the different behavior of banking sectors under different economic situations, we provide new evidence on the ongoing discussions concerning the risk-taking aspects of globalization of the bank industry. This study provides valuable insight into the ambiguous relationship between foreign banks’ entry and risk-taking behavior by considering the interactive effect with bank competition, which has not been taken into account in previous studies. Finally, our analysis advances the empirical literature by applying the pooled regression model and dynamic panel estimation method to a wide range of economies as well as 2SLS with GMM estimations, which gives more rigorous handling for potential endogeneity problems.
The remainder of this paper is organized as follows: Section 2 explains the literature review related to bank completion, foreign banks’ entry, and risk-taking behavior. Section 3 explains the data set, model specification, and econometric strategy. Section 4 describes the pooled regression, 2SLS estimation results, and robustness results, and Section 5 gives the conclusion and policy recommendations.

2. Literature Review

It is well recognized that foreign investors are inclined to be dynamically involved in monitoring and disciplining imbedded managers in emerging financial markets to overcome their informational disadvantage. Some studies propose a positive association between foreign ownership and domestic banks’ operational efficiency. Levine (1997) summarized the advantage of the existence of foreign banks, including stimulation of the progress of a bank supervisory and legal structure, increased country’s access to the international capital, adoption of new banking skills and technologies, and upgrading of the quality and availability of financial services. They also found that foreign banks’ entry is beneficial to the operations of domestic banks (Claessens et al. 2001; Unite and Sullivan 2003; Ukaegbu and Oino 2014). Choi and Hasan (2005) also explained that the level of foreign banks’ entry has a positive influence on the bank’s risk and return.
Most empirical work has focused on aspects, such as the bank’s operational cost, spread of net interest, level of the bank’s profit, and credit growth (Claessens et al. 2001; Haber 2004; Gormley 2010; Claessens and Van Horen 2011, 2015). Claessens and Van Horen (2011) found that increased foreign banks’ entry is related to the lesser profitability and higher overhead costs of the domestic banks. Gormley (2010) revealed the market-wide increase in the volume of bank loans of the host banks after the entry of foreign banks. Therefore, the extent and nature of the foreign banks’ entry influence the other bank’s risk-taking behavior, but the moderating role of bank competition has not been examined. Some empirical studies suggest that foreign banks’ entry might reduce the local banks’ risk factor and enhance financial stability by stimulating a spillover of new innovative ideas and better expertise from foreign banks to local banks, encouraging local banks to invest in new technology as well as human capital and enhance their proficiency in the long run (Edison et al. 2002; Lensink and Hermes 2004; Hassan et al. 2012; Kouretas and Tsoumas 2016).
The traditional theory reveals that the entry of foreign bank strengthens the level of competition in the banking industry, which enhances the allocative and productive proficiency of the hosts’ banking industry (Vives 2011). There are also various challenging forces that might offset the beneficial influence of foreign banks’ entry and expand the risk-taking behavior of local banks to disturb financial stability. Local banks might be undesirably affected by the shift of clients after the foreign banks’ entry. On the one side, the entry of foreign banks might concentrate their credit and other services on well-informed customers, depriving the domestic banks of this market position and leaving only opaque organizations (Sengupta 2007; Ukaegbu and Oino 2014). Beck et al. (2018) argued that foreign banks’ entry affects the availability of credit for small or opaque organizations. They suggest that larger firms may get benefits from the existence of a foreign bank(s), but small firms are not affected. On the other side, investors might transfer their savings out of domestic banks into foreign banks due to the better service quality and international status, causing the domestic banks to incur more costs to attract more traditional investors or alternative investors with different sources of funding. The consistently higher overheads of liabilities may lead the domestic banks to raise their lending costs, which might cause an adverse selection problem (Kleymenova et al. 2016). Therefore, domestic banks’ fragility might escalate with the presence of foreign banks. This effect is perhaps more insightful in less developed economies, due to the limited flexibility of the domestic banks to amend their portfolio and diversify the risk factor, than banks in developed economies (Saleh 2015).
Competition might increase as foreign banks establish their business in domestic banking markets. The traditional theory reveals that a higher value of the franchise would limit the incentive to take undue risk (Claessens and Laeven 2004; Jeon et al. 2011). Therefore, if the entry of a foreign bank is related to higher competition levels, it can raise the franchise value due to the lower profitability, thus reducing the banking risk (Jiménez et al. 2013; Claessens and Van Horen 2014). Thus, the relationship between the franchise value and banks’ risk-taking behavior needs to be further examined. The high franchise value permits banks to borrow more, and then higher leverage might offset the lesser incentive of risk-taking. The competition–stability view proposes that the level of competition might strengthen financial stability since more penetrating competition would lower the interest rate and lessen the borrower’s default probability. If this effect offsets the competition–fragility influence, ceteris paribus, then domestic banks are expected to be related to greater financial stability when there is an increase in foreign bank(s) entry (Boyd and De Nicolo 2005). Claessens and Laeven (2004) applied the H-statistics model of banking sectors, based on the reduced-form revenue equation, and reported that entry is more competitive in banking sectors with a more significant presence of foreign bank(s). However, they explain that the lesser limitations on foreign bank(s) entry and fewer constraints on banking activities enhanced the level of competition. However, Yeyati and Micco (2007) proposed that the entry of a foreign bank would decrease the level of banking competition, along with a positive relationship between the foreign bank(s) entry and financial stability.
The competition–fragility hypothesis explains that higher level of competition between banks leads to an increased fragility. This point of view is also known as the ‘charter value’ view of the financial market, theoretically modelled by (Marcus 1984; Chan et al. 1986; Keeley 1990; Beck 2008). They comprehend banks when managing the risk of a portfolio. Beck (2008) revealed that banks have more incentives to take excessive risks in a more competitive environment, where there is more pressure on profits. Hence, the result is more fragile.
Furthermore, banks receive less information from their borrowers in a higher competitive environment, which decreases their incentives to monitor the borrowers. Vives (2011) explained that higher competition decreases financial stability through intensification of the coordination problem of investors and raising the incentives to take more risk and raise failure probabilities. In order to recover from financial fatalities, financial firms are more likely to finance riskier projects. Therefore, risk-taking behavior will weaken the financial stability of financial firms (Keeley 1990; Allen and Gale 2005).
Domestic banks might follow their foreign competitors in offering new innovative ideas and services to protect their market shares, which might enhance their overhead expenses and lead to higher risks if foreign banks own advantages on all of these services. Foreign banks’ entry might constrain domestic banks to raise investment in high-end technologies and also employee training. Therefore, increased expenditure is transferred to higher overheads expenses, but the benefits take some time to emerge. Subsequent losses are likely to occur, at least in the short run. Although, the supply of new services, together with the training of employees and investment on new technology, might raise a domestic bank’s efficiency and support their financial stability in the long run (Sufian and Habibullah 2010; Xu 2011). The existing empirical literature gives very limited empirical results on the interactive role of bank competition and foreign banks’ entry on risk-taking behavior across the globe. Unite and Sullivan (2003) and Modén et al. (2008) found that the increase of foreign bank entries leads to an increase in the loan loss provision by domestic banks, whereas this relationship has not been observed in another study (Claessens et al. 2001). Degryse et al. (2012) observed that the entry of foreign banks undermines the trustworthiness of domestic banks. Therefore, Agoraki et al. (2011) and Bessler and Kurmann (2014) explained the mixed results, stating that the increased foreign bank presence is related with either a low or high risk factor, which ultimately influences the financial stability across the banking sector. However, the limited evidence has motivated this research to fill the gap in the empirical literature by examining the interactive role of bank competition and foreign bank entry on risk-taking behavior across the globe.

3. Data and Methodology

The objective of our research was to examine the effect of foreign bank entry on risk-taking behavior with the moderating role of bank competition across countries. The research sample was the banking industry in a cross-country analysis of 95 countries (developed and developing) from 2000 to 2016. To classify the countries, we used the categories of the World Bank classification. Data about the risk-taking indicators, foreign bank entry, bank-specific variables, industry-specific variables, and macro-economic variables were taken from the Global Financial Development Database, International Monetary fund, World Development Indicators, and Bank Focus. Finally, the period of the analysis, 2000–2016, revealed the data availability of some of the explanatory variables. Appendix A explains all the names of the countries that were used in this research.
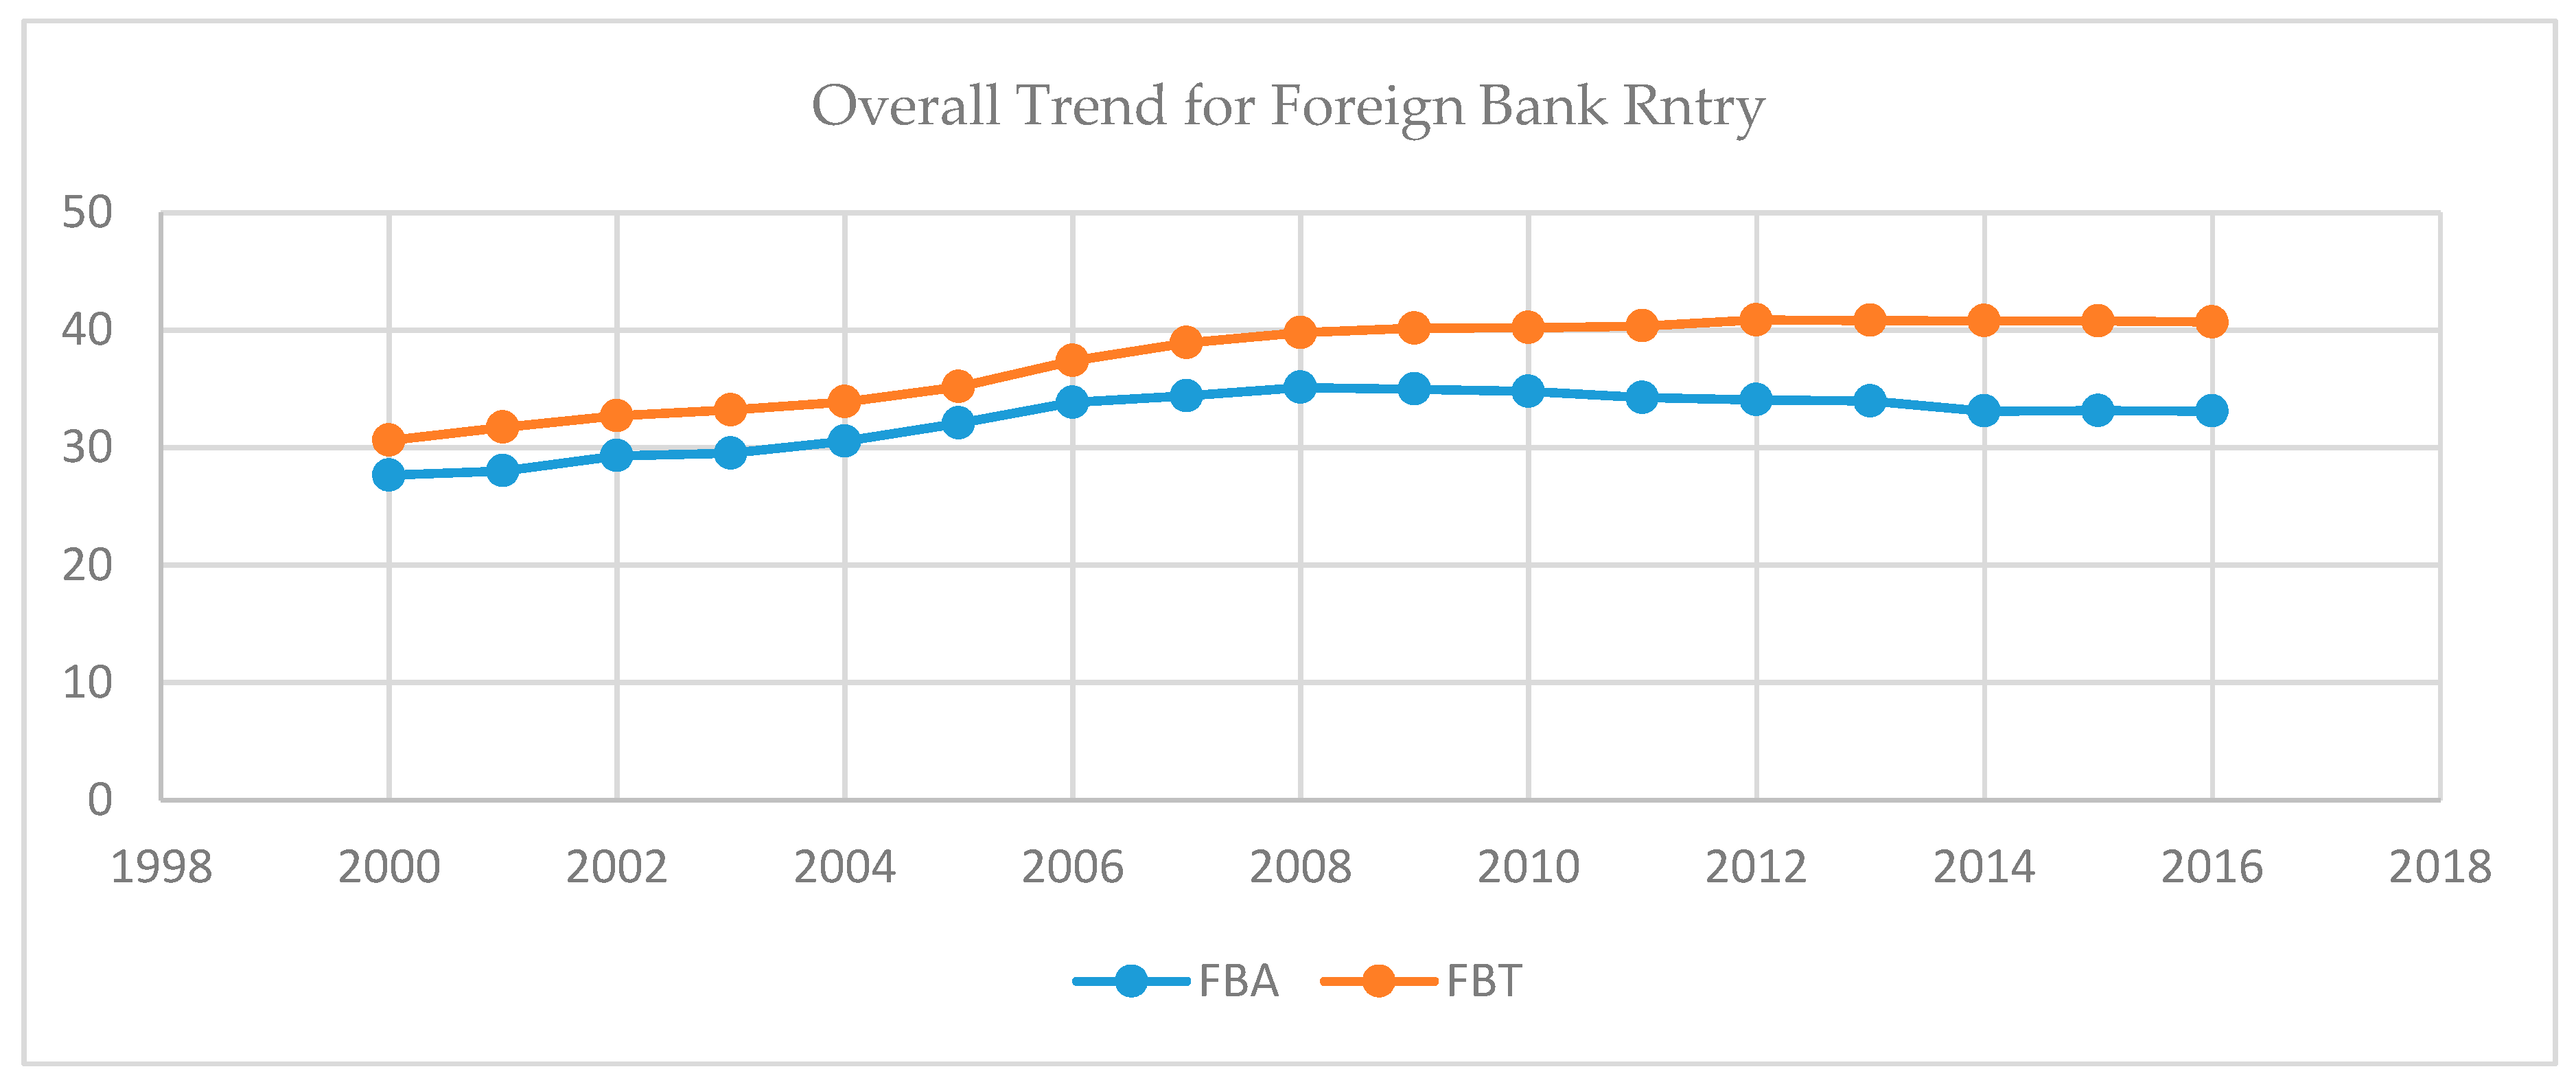
The number of foreign bank assets has increased over time, which is also shown in Figure 1. All of these movements exhibit that the relative importance of foreign banks has increased extensively, from an average of 30.62% in 2000 to 40.69% in 2016. 
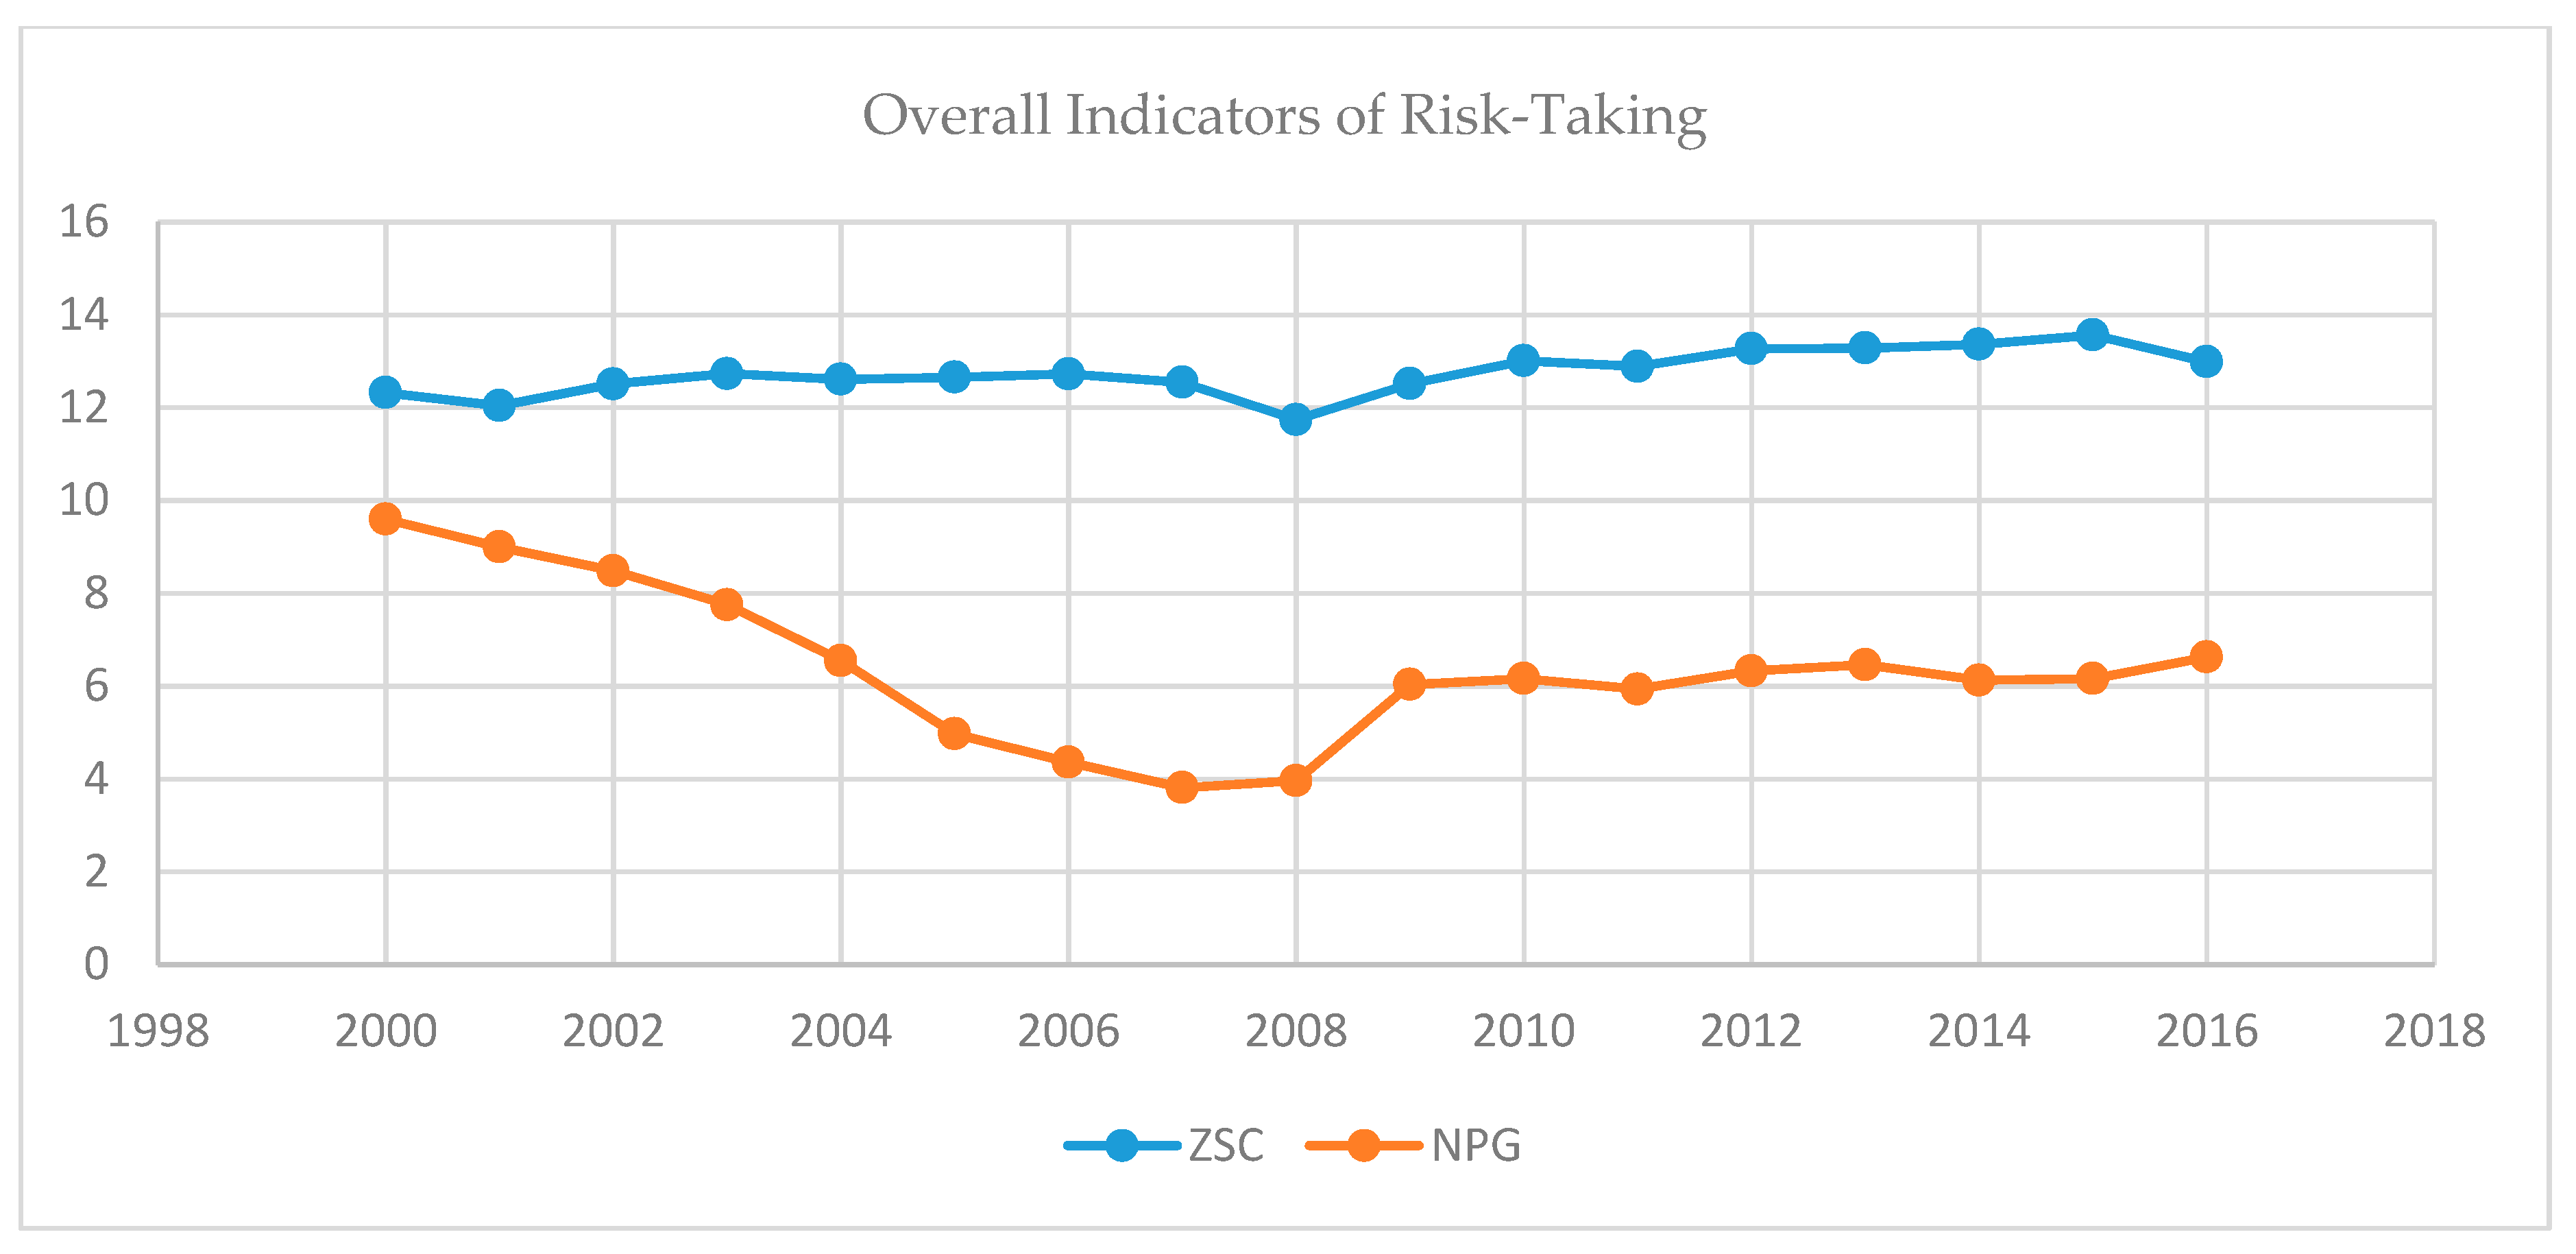
Figure 2 shows the indicators of financial stability; the first one is the Z-score and the other one is the NPG ratio. A higher value of the Z-score indicates a lower level of risk and improved financial stability. Both of the graphs show that the global financial crisis (GFC) episode played a crucial role in financial stability across the globe.

3.1. Explanation of Variables

3.1.1. Measuring Foreign Bank Entry

We have measured foreign bank entry in two different ways. The first measure of foreign bank entry was related to the number of banks. For each host country, we determined the number of foreign-owned banks and divided this by the total number of banks in a particular country. The second measure of foreign bank entry was based on the bank’s assets. For each host country, we determined the sum of foreign assets of foreign-owned banks and divided this by the total amount of bank assets in a country. These two measures are usually acknowledged as useful measures of foreign bank entry (Jeon et al. 2011; Molyneux et al. 2013; Yin et al. 2015).

3.1.2. Measuring Risk-Taking Behavior

We employed two different proxies to measure the risk-taking behavior across countries. These measures also indicates the stability position of the banks. The first one was the Z-score, which revealed the probability of banks’ insolvency risk based on the amount of cushion the bank has to guard against the shocks to earnings. This Z-score was calculated as Z = ((ROA + E/A)/σ (ROA)), where the ROA is the return on the assets, E/A is the equity to asset ratio, and σ (ROA) is a measure of the standard deviation of the rate of return. A higher score indicates that the banks incur less risk and are more stable due to its inverse relationship with the probability of a bank’s insolvency [48]. The second proxy was the NPL ratio (the ratio of non-performing loans to gross loans) to measure the banking risk. This risk is banking risk, and it results in an increased proportion of non-performing loans in the portfolio of the bank loan. The higher ratio shows a bank’s greater inclination to keep a riskier loan portfolio, which also affects the bank’s financial position (Allen et al. 2014; Luo et al. 2016; Baselga-Pascual et al. 2018).

3.1.3. Measuring the Bank Competition

To measure the bank competition, we used the H-statistics model, which is based on the econometric methodology of (Panzar and Rosse 1987). The Panzar and Rosse model is the first method issued on the new theory of industrial organization applied to the banks. This model attained the measurements of market power, as well the different competition conditions in the financial sector, by reviewing the influence of variations in the production elements prices over the revenues. This approach is based on the fact that the different banks employ different strategies based upon the prices, in response to variations in the input price of the market structure in which they function. This technique examines the transmission of changes in the input prices to bank revenue. It is generally used as a measure of competition, which is based on the new industrial organization empirical literature and based on the available bank-level data designating the level of bank competition. Additionally, it offers a quantitative assessment of the competitive condition of the market under market equilibrium and this technique has been applied by a number of empirical studies (Claessens and Laeven 2004; Yeyati and Micco 2007; Bikker et al. 2012; Apergis et al. 2016). The explanation of this model (H-statistics) is also very clear, which takes a value from −∞ to +1, where a higher value of this model indicates greater competition in the financial market and vice versa. The method of Moch (2013) was followed in measuring the Panzar–Rosse H-statistics for each year, by the following reduced-form revenue equation, as indicated in Equation (1):
L n T R E i = α 0 + β 1 L n P 1 i +   β 2 L n P 2 i + β 3 L n P 3 i + δ 1 L n Y 1 i + δ 2 L n Y 2 i + δ 3 L n Y 3 i + ε i .
The dependent variable (TRE) is the total revenue over the total assets. According to the intermediation approach, we assumed that the banks use three different inputs, which are (I) deposits, (II) labor, and (III) capital. LnP1 is the average cost of funds, LnP2 is the average cost of labor, and LnP3 is the average cost of capital. All of these input prices are followed by the explanatory variables, which reveal differences in the structure of cost, size, and risk. In the above equation, the right-hand side is a set of bank-specific variables that replicate differences in capitalization (Y1), liquidity (Y2), and product mix (Y3), and were used to allow for bank heterogeneity. All of these variables are the ratio of equity to total assets, the ratio of loans to total assets, and the ratio of other income to total assets, respectively, and these ratios are also expected to affect the bank revenue function form. The Panzar–Rosse H-statistics model is based on the reduced form revenue equation, by available bank-level data, variables to examine the market power for the product of price setting. The H-statistics is measured as a sum of the elasticity’s of a bank’s total revenue and input prices (intermediation approach), measured as HSC = β1 + β2 + β3. A higher value shows that changes in inputs’ prices increase revenue and market competition. In the situation of perfect competition, this value is equal to one; that is, the proportionate increase in the input price and total revenue is the same. In the monopoly condition, this value is zero or negative, which shows that an increase in input prices lowers the total bank revenue. In the monopolistic competition environment, the value of H-statistics is between zero and one. The following regression equation was used to examine whether the Panzar–Rose H statistics fulfilled the long-term equilibrium condition, as the presence of a disequilibrium condition might undermine the value of the H-statistic (Bikker and Haaf 2002; Moch 2013):
L n ( 1 + R O A i ) = α 0 + β 1 L n P 1 i + β 2 L n P 2 i + β 3 L n P 3 i + δ 1 L n Y 1 i + δ 2 L n Y 2 i + δ 3 L n Y 3 i + ε i ,
where ROA is the bank’s return on assets, in the condition of long-term equilibrium, β1 + β2+ β3 = 0; it implies that input prices do not influence the banks’ return on assets.

3.1.4. Control Variable

This study also employed different control variables that we drew from the empirical literature on bank competition, foreign bank entry, and the behavior of risk-taking (Beck et al. 2006; Agoraki et al. 2011; Karolyi and Taboada 2015). These control variables consisted of bank-specific variables, industry-specific variables, and macroeconomic variables. This study also considered country level governance and development, which have been shown to influence the risk-taking position across the globe. In terms of the bank-specific control variables, we used the five-bank concentration level (BC5) as a proxy for the big five banks in terms of the total assets and bank deposit to GDP ratio (BDG) to capture the effect of deposits and return on assets to capture the profitability of the banks (Houston et al. 2012; Karolyi and Taboada 2015).
In terms of the country level controls, we employed both industry level and macro-economic variables. The governance index is the average of six governance elements: Control of corruption, political stability, regulatory quality, voice and accountability, government effectiveness, and the rule of law. The value ranges from −2.5 to +2.5, with a higher value showing a greater governance index of a particular country, which also influences the financial stability. Additionally, to capture the extent of financial intermediation and stock market development, we employed the ratio of claims on the private sector to GDP for financial development (PCD) and the ratio of stock market capitalization to the GDP. Furthermore, to capture the effect of the stock market return, we employed the annual growth rate of the stock market index. As for macroeconomic variables, we employed the GDP growth rate as a proxy for deviations in economic activity and the inflation rate (INF) as a proxy for monetary instability, as inflation could influence risk-taking behavior. We also employed the current account and savings account to GDP (%) to examine the overall financial position of a particular county (Beck et al. 2006; Agoraki et al. 2011; Karolyi and Taboada 2015).
Moreover, there are other regulation factors in the regulatory and supervisory environments in each country that may affect risk-taking behavior. We used four banking regulation indices from the World Bank Database on “Bank Regulation and Supervision” (Barth et al. 2001, 2013). These bank regulations are explained in Appendix A. Restrictions on bank activities explain the extent to which banks face regulatory limitations on their activities. A higher score suggests that more regulations are placed on the scope of a banks’ business operations; the index of capital regulatory stringency indicates more stringent regulation on banks of overall capital; the supervisory power index reveals the extent to which the country’s supervisory agency has the influential authority to undertake actions and enhance the stability position; and the private monitoring index shows the degree to which banks are mandatorily required to release authentic information to the public (Karolyi and Taboada 2015).

3.2. Empirical Methodology

To examine the relationship between bank competition, foreign bank entry, and banking risk behavior across countries, two main concerns were considered before selecting a suitable econometric strategy. The first was the probable persistence of risk-taking behavior (Agoraki et al. 2011). The second as the potential endogeneity of risk-taking behavior (stability position) with foreign banks’ entry and bank-specific and other variables (Delis et al. 2012). Therefore, because of these two reasons, we employed pooled regression models and dynamic panel models using the 2SLS approach with robust standard errors. Generally, we provided estimations of the general dynamic regression model:
R i s k i j t = α 0 + α 1 F O R E i t + α 2 C O M P i t + α 3 B A N K i t + α 4 B R E G i t + α 5 I N D U S T R Y i t + α 6 M A C R O i t + v i t + u i t .
In the above equation, RISK denotes the risk-taking behavior for bank i, in the j country at time t. It measures the Z-score and also checks the robustness of the alternative proxy, which is the NPL (ratio of non-performing loans to total loans). FORE denotes the foreign bank entry, which measures the two different proxies (foreign bank assets to total assets and the number of foreign banks to the total banks in a particular country). COMP shows the level of bank competition. It measures the Panzar–Rosse H-statistics model. The BREG shows different bank regulations, which also influences risk-taking behavior and enhances the stability position across the globe. BANK, INDUSTRY, and MACRO show the vectors of bank-specific (bank concentration, bank deposits, and return on assets), industry-specific (financial development, stock market development, governance index, stock market return), and macro-specific control variables (GDP growth, inflation, current and saving account to GDP%). The level of bank competition might also influence risk-taking behavior in the increased number of foreign banks over the period (Simpasa 2013; Wu et al. 2017). Therefore, we extended our dynamic model by including an interactive term of the foreign bank entry and level of competition using the above equation. This allowed us to examine the role of the level of competition in influencing the financial stability in the presence of foreign banks’ entry for a cross country environment:
R I S K i j t = α 0 + α 1 F O R E i t + α 2 C O M P i t + α 3 C O M P i t F O R E i t + α 3 B A N K i t + α 4 B R E G i t + α 4 I N D U S T R Y i t + α 5 M A C R O i t + v i t + u i t .
In the above model, the dependent and independent variables are the same as those used for Equation (3), except the interaction term of competition and foreign bank entry ( C O M P i t F O R E i t ) , and were used to examine the interactive role of competition and foreign bank entry on risk-taking behavior across the globe.

3.3. Empirical Results and Discussion

The objective of this study was to understand the influence of foreign bank entry on banking risk behavior and also the moderating effect of bank competition across the globe. Table 1 shows the results of the descriptive statistics of the variables, which shows the level of bank competition, foreign bank entry, and country-specific data to understand the situation of bank characteristics and macro-economic conditions across the globe. Generally, the Z-score shows a bank’s distance from insolvency. It means that a higher value of the Z-score implies greater financial stability. The average Z-score of all the banks was 12.67, and the standard deviation was 7.93. The Z-scores ranged between 1.11 and 39.34. These values show that the banks are, on average, financially stable. The average value of the non-performing loans to the gross loans was 6.37, with a standard deviation of 6.28. Berger et al. (2009) revealed that high capitalization might be used as a risk management plan to reduce credit risk and insolvency risk. Concerning foreign bank entry in terms of a total bank’s assets, the average value of FBA was 32.47, and its standard deviation as 32.04, explaining a substantial heterogeneity for the existence of foreign banks across the globe. Regarding the number of foreign banks, FBT was found to be comparatively less diverse; the mean value was 37.53 and the standard deviation was 26.43. The average value of foreign bank entry in our sample was mainly influenced by some countries that own a large number of local banks but have a comparatively modest existence of foreign contestants. Concerning the competition level as measured by the Panzar–Rosse H-statistics (HSC), the average value was 0.5126, and its standards deviation was 0.2241, which ranged from 0.0200 to 0.9700. It explains the average monopolistic competition in the banking market across the countries.
Table 2 exhibits the correlation matrix between the main variables. The correlation between the Z-score and foreign bank entry measures was negative and statistically significant. It shows that the financial position of the banks is more stable in the existence of foreign bank’s entry due to the risk factor being mitigated. The bank-specific variables and the other variables were not highly correlated with each other, showing that there is no problem of multicollinearity between the variables. Generally, foreign banks consider host countries’ economic conditions as options to seize more of the market share, by a different set of available opportunities; the correlation between the existence of foreign banks and the GDP growth rate was found to be negative (Althammer and Haselmann 2011).
Table 3 and Table 4 report the estimation results for different empirical models. Each model uses different dependent and independent variables, i.e., the NPG ratio and Z-score, respectively, and also different indicators of foreign bank entry, namely the FBA and FBT. A negative relationship was found between the foreign bank entry and the indicators of risk-taking in all the models. The first indicator of the foreign bank entry was the FBT; the results showed that a one unit increase in the entry of foreign banks decreases the risk factor by −0.0730 and −0.3010, and also enhances the stability position across the globe. The coefficient of HSC (bank competition) on the NPG ratio was negative and significant, and it was positive and significant on the Z-score. The result also denoted that the competition level (HSC) decreased bank risk in all models. It means that a higher level of bank competition means more lending opportunities, decreasing the profits, eroding the market power, and resulting in a deterioration of excessive bank risk-taking. These results are in line with the empirical work of previous studies (Berger et al. 2009; Rokhim and Susanto 2013). Therefore, a higher Z-score reflects the financial stability to a certain level and lesser risk-taking. It means that in general, the higher existence of foreign banks leads to the riskiness of domestic banks. The level of bank competition plays a vital role between the relation of foreign banks’ entry and financial stability. The entry of foreign banks enhances the financial stability position and mitigates the risk factor. These results propose that an increased level of bank competition is compassionate for the financial stability across the globe, which is also consistent with the work of Boyd and De Nicolo (2005).
Table 5 and Table 6 shows the result regarding the interactive role of bank competition and the foreign bank entry term, it had positive influence on financial stability; it means that this relationship enhances the risk factor and deteriorates the stability position. The results show that the level of competition is related to the riskier loans portfolios. The results are consistent across the different proxies of foreign bank entry and the interactive term for the foreign bank entry and level of competition (Wu et al. 2017). Our main argument is that even the market power in banking results in riskier loan portfolios. The Z-score is an inverse indicator for such overall risk. The higher value of the Z-score might come from either the higher earnings or more capital, and designates more financial stability, whereas higher inconsistency in earnings lowers the value of the Z-score and then increases the overall bank risk, which ultimately reduces the stability position across the globe. The results also lend support to the competition–fragility view that an increase in the level of competition is likely to reduce the franchise value of firms and encourage banks to increase their overall risk experience, which also influences the stability position. When financial institutions admire a higher franchise value that is derived from their level of competition, they are likely to command higher lending rates, thereby enhancing the riskiness of their loan portfolios (Boyd and De Nicolo 2005). Our results indicate that the interactive role of bank competition and foreign bank entry increases risk behavior and fragility. An excessive level of foreign bank entry in a less controlled environment brings more financial fragility to the local banking industry. Therefore, some researchers predict that a less competitive and more concentrated financial environment brings more stability because the higher level of profits provide a cushion against fragility and mitigate excessive risk taking behavior (Marcus 1984; Chan et al. 1986; Keeley 1990). On the other hand, when an excessive level of foreign bank entry stimulates the competitive environment of the banking industry, local banks are forced to take excessive risk and invest in risky asset portfolios due to the reduced level of profit and incentives (Beck 2008). Moreover, excessive competition induced by foreign bank entry pressures the local banks to reduce their incentives of proper loan screening, leading to a higher risk of fragility, as happened during the financial crisis of 2007 to 2008 (Šević 2002; Allen and Gale 2005; Boot and Greenbaum 2010). Thus, these models suggest that an excessive level of foreign bank entry, as occurred in the USA in the 1970s and 1980s and other developing countries, due to deregulation and a less restrictive environment may cause more fragility (Beck et al. 2005). The competition–fragility view is also further confirmed by our robustness tests, which identified an inverted U-shaped relation between foreign bank entry and financial stability. Our findings indicate that foreign bank entry initially improves the financial stability, but after a certain threshold, the entry induces fragility in the banking sector due to the excessive level of risk-taking behavior (Beck 2008).
We also found some impressive results about the stability position (banking risk) for other control variables. The coefficient of the five-bank asset concentration was negative and significant, which means that the big five bank asset ratio is also helpful for the stability position. The bank deposit to GDP (%) was positively related to the financial stability of the banks, and the results were statistically significant when using the alternative proxy for the robustness. The country-level governance index measures also exert a negative and significant effect on (Z-score) financial stability. Financial institutions located in countries where the authorities are accountable to investors enjoy a more level stability and also a mitigated risk factor. The return on assets was found to have a positive and significant effect on the (Z-score) financial stability. It also implies that a more concentrated system also influences the risk level. It suggests that a more concentrated system is inappropriate for banking systems across the globe. This concentrated system means that the banking industry only relies on some large banks. If there is a default case in one of the central banks, the whole system would have substantial effects. Moreover, the coefficient of the GDP growth rate was positive and significant in all the models, suggesting that less risk is incurred by banks when the economy is booming, and also the relationship with inflation was significant but negative. The results show the risk-taking channel of monetary policy; banks undertake more risk when banks adopt an expansionary monetary policy. These findings are consistent with the previous work of Anginer and Demirguc-Kunt (2014) and Wu et al. (2017).

4. Robustness Checks

To ensure the accuracy of the pooled regression models and dynamic estimation models, and to validate the findings of the interactive role of competition and foreign bank entry on risk-taking behavior across the globe, Table 7 and Table 8 show some robustness checks on our main models. We ran our regressions using the alternative proxy of foreign bank entry with the other control variables. We also included the interactive dummy variable for developed countries to examine the effect of foreign bank entry on risk-taking behavior across countries. We also included the quadratic (squared) term in our regression models to examine the non-linear relationship between foreign bank entry and different indicators of risk-taking. The robustness checks confirmed the previous results. The robustness tests also confirmed that foreign bank entry decreases the level of risk and ultimately enhances financial stability to a certain level. The results also indicated that the interactive effect of the level of competition and foreign bank entry weakens the financial stability of the banking sector across countries. These results are more prevalent in emerging economies in which undeveloped financial systems depend heavily on banks to channel financial capitals into expansion projects, combined with the fact that the financial sector plays a vital role in boosting proficiency and economic development.

5. Conclusions

Foreign bank entry brings both benefits and challenges to host economies. The recent instability in financial markets might make policymakers hesitant to relax liberalization policies on the activities and entry of foreign banks across the globe. This study examined the role of foreign bank entry and competition in the risk-taking behavior of banks across the globe. Our sample consisted of commercial banks from 95 countries (developed and developing countries) over the period of 2000 to 2016. This study used different indicators to measure risk-taking behavior (Z-score and NPG ratio) and the role of bank competition as measured by H-statistics, which is a nonstructural model. After applying the pooled regression and 2SLS with GMM and using the property rights and financial freedom as the instrumental variables, our results showed that the entry of foreign banks enhances the financial stability position and mitigates the risk factor to a certain level and the level of bank competition plays an extensive role between foreign bank entry and risk-taking behavior. This study revealed that foreign banks have an inverted U-shaped relation with risk-taking behavior; this implies that foreign bank entry decreases the level of risk-taking behavior before to a certain extent and then brings financial fragility to the host country because of excessive competition, which may cause local banks to undertake risky investments. Thus, our findings support the competition–fragility hypothesis, which was also confirmed by the interactive role of the competition level and foreign bank entry. The findings of our study also suggest that some measures of bank regulation significantly reduce risk-taking behavior across countries. In particular, we found that restriction on bank activities and capital regulation stringency reduces the level of risk. This result was the same as those of the robustness tests.
The results of this research have important policy implications for bank managers, regulators, and policy-makers. There are both pessimistic and optimistic sides for the existence of foreign banks across countries. Despite providing a steady source of credit in host economies, the entry of foreign banks might lead to an enhancement of domestic banks’ risk, proposing a reasonable trade-off between the susceptibility of credit quality in domestic banks and the stability of credit quantity from foreign banks. Therefore, when planning optimal policies of financial liberalization, policymakers need to be attentive to the possible detrimental influence of foreign banks’ eminence on the financial stability in host countries. Moreover, financial authorities must also be conscious that the business expansion of local banks might enhance their risk, therefore influencing the stability of domestic banks disparagingly. After all, this research proposes that the adaptation of a Basel III framework by countries enhances the risk management capability and brings restraints to the market, and would be favorable for the region to enhance the financial stability.
In addition, this study reveals that the entry of foreign banks is an overall blessing in underdeveloped markets to a reasonable level, although it has the potential for risk. Given the probable harms brought by banking instability during the global financial crisis (GFC), the other direction for further study is to examine the foreign bank penetration on risk-taking behavior, bank efficiency, and, in particular, how to achieve the optimal level of performance when foreign ownership and different banking regulations are taken into consideration. All of these extensions will remain a priority for researchers in future.

Author Contributions

All the authors have contributed equally to the paper.

Funding

This research received no external funding.

Conflicts of Interest

The authors declare no conflict of interest.

Appendix A

Table A1. Definition of variables, data sources, and acronyms.
VariablesAcronymsDefinition
Foreign Bank EntryFBTThe number of foreign banks to the total banks (%).
FBAForeign bank assets to the total bank assets (%). This proxy has been used by Molyneux et al. (2013) and Yin et al. (2015). Source: WB, GFDD
Z-scoreZSCIt captures the probability of the defaulting of a country’s commercial banking system. This proxy has been used by Wu et al. (2017) Source: GFDD, WB
Non-performing loans to gross loansNPGThis is the ratio of non-performing loans to the total gross loans; This proxy has taken from Allen et al. (2014), Source: GFDD, WB
Restriction on Bank ActivitiesRBAThe index of restriction on bank activities. The higher score suggests that more regulations on the scope of the bank’s business operation. The data obtained from (Barth et al. 2013)
Capital regulation StringencyCREThe index of capital regulatory stringency. The index ranges from 2 to 12, with a higher score indicating more stringent regulation on banks’ overall capital. The data obtained from (Barth et al. 2013)
Supervisory Power indexSPIThe index of supervisory power. The score ranges from 0 to 14; the higher score suggests that when the supervisory agencies are authorized more oversight power. The data obtained from (Dong et al. 2011; Barth et al. 2013)
Private monitoring PMOThe index of the private monitor strength. The index ranges from0 to 12, and the higher value denotes a more private monitoring force. The data obtained from (Dong et al. 2011; Barth et al. 2013)
Bank ConcentrationBC5This is the large five banks ratio in terms of total assets to the total assets of the banking industry. This proxy has been used by Karolyi and Taboada (2015), Source: WB, GFDD
Bank DepositsBDGBDG is the bank deposit to GDP (%). This proxy has been used by Houston et al. (2012) and Karolyi and Taboada (2015), Source: World Bank Global Financial development database
Return on AssetsROAThe bank’s net income to the total assets. This proxy has taken from (Houston et al. 2012), Source: GFDD, WB
Financial DevelopmentPCDPrivate credit by deposits money banks to GDP (%). This proxy has been used by (Luo et al. 2016). Source: Global market information database
Stock market developmentSMCSMC is the stock market capitalization to GDP (%). This proxy has been used by (Luo et al. 2016), Source: Global market information database
Governance indexWGIThe average of six governance elements. Each of the indices arrays from −2.5 to 2.5, with the higher values showing better governance. This proxy has been used by (Luo et al. 2016). Source: GFDD, WB
Stock market returnSMRThe stock market return is the growth rate of an annual stock market index. This proxy has been used by (Karolyi and Taboada 2015), Source: World Bank Global Financial development database.
GDP growthGDPAnnual GDP growth rate, This proxy has taken from (Noman et al. 2018). Source: IMF
InflationINFInflation rate (annual % change of Average consumer price index). This proxy has taken from (Noman et al. 2018). Source: IMF
Current account/GDP %CAGThe current account divided by GDP (%). This proxy has taken from (Houston et al. 2012), Source: IMF
Saving/GDP %GSGThe gross savings of both the public and the private sectors divided by GDP (%). This proxy has taken from (Karolyi and Taboada 2015), Source: IMF
PopulationPOPLog population (millions). Source: IMF
Financial FreedomFIFThis index that takes value from 0–100 showings the level of regulatory restrictions on the financial freedom of the firms. This variable is used as the instrumental variables and has been used by (Noman et al. 2018), Source: HFD
Property RightsPRRThis index takes a value from 0–100, showing the level to which the laws protect private property right. This variable is used as the instrumental variables and has been used by (Noman et al. 2018), Source: HFD
Note: IMF shows the International Monetary Fund, GFDD is the Global Financial Development Database, WBI is the World Development Indicators. HFD is the Heritage Foundation database.

Appendix B

Table A2. List of countries.
Sr. NoCountryRegionClassification
1AlgeriaMiddle East and North AfricaUpper middle income
2Antigua and BarbudaLatin America and CaribbeanHigh income
3ArgentinaLatin America and CaribbeanHigh income
4ArmeniaEurope and Central AsiaUpper middle income
5AustraliaEast Asia and PacificHigh income
6AustriaEurope and Central AsiaHigh income
7AzerbaijanEurope and Central AsiaUpper middle income
8BahrainMiddle East and North AfricaHigh income
9BangladeshSouth AsiaLower middle income
10BelgiumEurope and Central AsiaHigh income
11BeninSub-Saharan AfricaLow income
12Bosnia and HerzegovinaEurope and Central AsiaUpper middle income
13BrazilLatin America and CaribbeanUpper middle income
14BulgariaEurope and Central AsiaUpper middle income
15CanadaNorth AmericaHigh income
16ChileLatin America and CaribbeanHigh income
17ChinaEast Asia and PacificUpper middle income
18ColombiaLatin America and CaribbeanUpper middle income
19CroatiaEurope and Central AsiaHigh income
20CyprusEurope and Central AsiaHigh income
21Czech RepublicEurope and Central AsiaHigh income
22DenmarkEurope and Central AsiaHigh income
23Dominican RepublicLatin America and CaribbeanUpper middle income
24EcuadorLatin America and CaribbeanUpper middle income
25Egypt, Arab Rep.Middle East and North AfricaLower middle income
26El SalvadorLatin America and CaribbeanLower middle income
27EstoniaEurope and Central AsiaHigh income
28FinlandEurope and Central AsiaHigh income
29FranceEurope and Central AsiaHigh income
30GermanyEurope and Central AsiaHigh income
31GhanaSub-Saharan AfricaLower middle income
32GreeceEurope and Central AsiaHigh income
33GuatemalaLatin America and CaribbeanUpper middle income
34Hong Kong SAR, ChinaEast Asia and PacificHigh income
35HungaryEurope and Central AsiaHigh income
36IcelandEurope and Central AsiaHigh income
37IndiaSouth AsiaLower middle income
38IndonesiaEast Asia and PacificLower middle income
39IrelandEurope and Central AsiaHigh income
40IsraelMiddle East and North AfricaHigh income
41ItalyEurope and Central AsiaHigh income
42JapanEast Asia and PacificHigh income
43JordanMiddle East and North AfricaUpper middle income
44KazakhstanEurope and Central AsiaUpper middle income
45KenyaSub-Saharan AfricaLower middle income
46KuwaitMiddle East and North AfricaHigh income
47LebanonMiddle East and North AfricaUpper middle income
48LithuaniaEurope and Central AsiaHigh income
49LuxembourgEurope and Central AsiaHigh income
50MalaysiaEast Asia and PacificUpper middle income
51MaltaMiddle East and North AfricaHigh income
52MauritiusSub-Saharan AfricaUpper middle income
53MexicoLatin America and CaribbeanUpper middle income
54MoldovaEurope and Central AsiaLower middle income
55MoroccoMiddle East and North AfricaLower middle income
56MozambiqueSub-Saharan AfricaLow income
57NamibiaSub-Saharan AfricaUpper middle income
58NetherlandsEurope and Central AsiaHigh income
59New ZealandEast Asia and PacificHigh income
60NicaraguaLatin America and CaribbeanLower middle income
61NigeriaSub-Saharan AfricaLow income
62NorwayEurope and Central AsiaHigh income
63OmanMiddle East and North AfricaHigh income
64PakistanSouth AsiaLower middle income
65PeruLatin America and CaribbeanUpper middle income
66PhilippinesEast Asia and PacificLower middle income
67PolandEurope and Central AsiaHigh income
68PortugalEurope and Central AsiaHigh income
69QatarMiddle East and North AfricaHigh income
70RomaniaEurope and Central AsiaUpper middle income
71Russian FederationEurope and Central AsiaUpper middle income
72Saudi ArabiaMiddle East and North AfricaHigh income
73SerbiaEurope and Central AsiaUpper middle income
74SingaporeEast Asia and PacificHigh income
75Slovak RepublicEurope and Central AsiaHigh income
76SloveniaEurope and Central AsiaHigh income
77South AfricaSub-Saharan AfricaUpper middle income
78SpainEurope and Central AsiaHigh income
79Sri LankaSouth AsiaLower middle income
80SwedenEurope and Central AsiaHigh income
81SwitzerlandEurope and Central AsiaHigh income
82Taiwan, ChinaEast Asia and PacificHigh income
83ThailandEast Asia and PacificUpper middle income
84Trinidad and TobagoLatin America and CaribbeanHigh income
85TunisiaMiddle East and North AfricaLower middle income
86TurkeyEurope and Central AsiaUpper middle income
87UgandaSub-Saharan AfricaLow income
88UkraineEurope and Central AsiaLower middle income
89United Arab EmiratesEurope and Central AsiaLower middle income
90United KingdomEurope and Central AsiaHigh income
91United StatesNorth AmericaHigh income
92UruguayLatin America and CaribbeanHigh income
93Venezuela, RBLatin America and CaribbeanUpper middle income
94VietnamEast Asia and PacificLower middle income
95ZambiaSub-Saharan AfricaLower middle income
Source. International Monetary Fund.

References

  1. Agoraki, Maria-Eleni K., Manthos D. Delis, and Fotios Pasiouras. 2011. Regulations, competition and bank risk-taking in transition countries. Journal of Financial Stability 7: 38–48. [Google Scholar] [CrossRef] [Green Version]
  2. Allen, Franklin, and Douglas Gale. 2005. Competition and Financial Stability. Journal of Money, Credit, and Banking 36: 453–80. [Google Scholar] [CrossRef]
  3. Allen, Franklin, Elena Carletti, and Douglas Gale. 2014. Money, financial stability and efficiency. Journal of Economic Theory 149: 100–27. [Google Scholar] [CrossRef]
  4. Althammer, Wilhelm, and Rainer Haselmann. 2011. Explaining foreign bank entrance in emerging markets. Journal of Comparative Economics 39: 486–98. [Google Scholar] [CrossRef]
  5. Anginer, Deniz, and Asli Demirguc-Kunt. 2014. Has the global banking system become more fragile over time? Journal of Financial Stability 13: 202–13. [Google Scholar] [CrossRef]
  6. Apergis, Nicholas, Irene Fafaliou, and Michael L. Polemis. 2016. New evidence on assessing the level of competition in the European Union banking sector: A panel data approach. International Business Review 25: 395–407. [Google Scholar] [CrossRef]
  7. Barth, James R., Gerard Caprio, and Ross Levine. 2001. The Regulation and Supervision of Banks Around the World. Forum American Bar Association, (April). Available online: www.worldbank.org/research/projectslbank_regulation.htm (accessed on 13 May 2019).
  8. Barth, James R., Chen Lin, Yue Ma, Jesús Seade, and Frank M. Song. 2013. Do bank regulation, supervision and monitoring enhance or impede bank efficiency? Journal of Banking and Finance 37: 2879–92. [Google Scholar] [CrossRef]
  9. Baselga-Pascual, Laura, Olga del Orden-Olasagasti, and Antonio Trujillo-Ponce. 2018. Toward a more resilient financial system: Should banks be diversified? Sustainability (Switzerland) 10: 1903. [Google Scholar] [CrossRef]
  10. Baskaran, Angathevar, and Mammo Muchie. 2008. Foreign Direct Investment and Internationalization of RandD: The Case of BRICS Economics. Development, Innovation and International Political Economy Research. p. 36. Available online: https://eprints.mdx.ac.uk/4200/1/Baskaran_-_Mammo_DIIPER_Working_paper_2008-7.pdf (accessed on 3 May 2019).
  11. Beck, Thorsten. 2008. Bank Competition And Financial Stability: Friends or Foes? Washington, DC: The World Bank. [Google Scholar] [CrossRef]
  12. Beck, Thorsten, Asli Demirgüç-Kunt, and Ross Levin. 2005. Bank Concentration and Fragility: Impact and Mechanics. NBER Working Paper Series; Chicago: University of Chicago Press, Available online: http://www.nber.org/papers/w11500 (accessed on 9 May 2019).
  13. Beck, Thorsten, Aslı Demirgüç-Kunt, and Ross Levine. 2006. Bank supervision and corruption in lending. Journal of Monetary Economics 53: 2131–63. [Google Scholar] [CrossRef]
  14. Beck, Thorsten, Hans Degryse, Ralph De Haas, and Neeltje Van Horen. 2018. When arm’s length is too far: Relationship banking over the credit cycle. Journal of Financial Economics 127: 174–96. [Google Scholar] [CrossRef]
  15. Berger, Allen N., Leora F. Klapper, and Rima Turk-Ariss. 2009. Bank competition and financial stability. Journal of Financial Services Research 35: 99–118. [Google Scholar] [CrossRef]
  16. Bessler, Wolfgang, and Philipp Kurmann. 2014. Bank risk factors and changing risk exposures: Capital market evidence before and during the financial crisis. Journal of Financial Stability 13: 151–66. [Google Scholar] [CrossRef]
  17. Bikker, Jacob A., and Katharina Haaf. 2002. Measures of Competition and Concentration in the BankingIndustry: A Review of the Literature. Economic and Financial Modelling 9: 53–98. [Google Scholar]
  18. Bikker, Jacob A., Sherrill Shaffer, and Laura Spierdijk. 2012. Assessing competition with the panzar-rosse model: The role of scale, costs, and equilibrium. Review of Economics and Statistics 94: 1025–44. [Google Scholar] [CrossRef]
  19. Boot, Arnoud, and Stuart Greenbaum. 2010. Bank regulation, reputation and rents: theory and policy implications. In Capital Markets and Financial Intermediation. Cambridge: Cambridge University Press, pp. 262–85. [Google Scholar] [CrossRef]
  20. Boyd, John H., and Gianni De Nicolo. 2005. The Theory of Bank Risk Taking Revisited. Journal of Finance 60: 1329–43. [Google Scholar] [CrossRef]
  21. Chan, Yuk-Shee, Stuart I. Greenbaum, and Anjan V. Thakor. 1986. Information reusability, competition and bank asset quality. Journal of Banking and Finance 10: 243–53. [Google Scholar] [CrossRef]
  22. Choi, Sungho, and Iftekhar Hasan. 2005. Ownership, governance, and bank performance: Korean experience. Financial Markets, Institutions and Instruments 14: 215–42. [Google Scholar] [CrossRef]
  23. Claessens, Stijn, and Luc Laeven. 2004. What Drives Bank Competition? Some International Evidence. Journal of Money, Credit, and Banking 36: 563–83. [Google Scholar] [CrossRef]
  24. Claessens, Stijn, and Neeltje Van Horen. 2011. Foreign Banks: Trends, Impact and Financial Stability. Washington, DC: International Monetary Fund. [Google Scholar] [CrossRef]
  25. Claessens, Stijn, and Neeltje Van Horen. 2014. Foreign banks: Trends and impact. Journal of Money, Credit and Banking 46: 295–326. [Google Scholar] [CrossRef]
  26. Claessens, Stijn, and Neeltje Van Horen. 2015. The Impact of the Global Financial Crisis on Banking Globalization. IMF Economic Review 63: 868–918. [Google Scholar] [CrossRef]
  27. Claessens, Stijn, Aslι Demirgüç-Kunt, and Harry Huizinga. 2001. How does foreign entry affect domestic banking markets? Journal of Banking and Finance 25: 891–911. [Google Scholar] [CrossRef]
  28. De Haas, Ralph, and Iman Van Lelyveld. 2014. Multinational banks and the global financial crisis: Weathering the perfect storm? Journal of Money, Credit and Banking 46: 333–64. [Google Scholar] [CrossRef]
  29. Degryse, Hans, Olena Havrylchyk, Emilia Jurzyk, and Sylwester Kozak. 2012. Foreign bank entry, credit allocation and lending rates in emerging markets: Empirical evidence from Poland. Journal of Banking and Finance 36: 2949–59. [Google Scholar] [CrossRef]
  30. Dekle, Robert, and Mihye Lee. 2015. Do foreign bank affiliates cut their lending more than the domestic banks in a financial crisis? Journal of International Money and Finance 50: 16–32. [Google Scholar] [CrossRef]
  31. Delis, Manthos D., Kien C. Tran, and Efthymios G. Tsionas. 2012. Quantifying and explaining parameter heterogeneity in the capital regulation-bank risk nexus. Journal of Financial Stability 8: 57–68. [Google Scholar] [CrossRef] [Green Version]
  32. Dong, Hui, Frank M. Song, and Libin Tao. 2011. Regulatory Arbitrage: Evidence from Bank Cross-Border MandAs. SSRN Electronic Journal. [Google Scholar] [CrossRef]
  33. East Asian Bureau of Economic Research, and China Center for International Economic Exchanges. 2016. Investment, human capital and labour movement. In Partnership for Change. ANU Press: pp. 109–36. Available online: http://www.jstor.org/stable/j.ctt1rqc94n.12 (accessed on 3 May 2019).
  34. Edison, Hali J., Ross Levine, Luca Ricci, and Torsten Sløk. 2002. International financial integration and economic growth. Journal of International Money and Finance 21: 749–76. [Google Scholar] [CrossRef]
  35. Fang, Yiwei, Iftekhar Hasan, and Katherin Marton. 2014. Institutional development and bank stability: Evidence from transition countries. Journal of Banking and Finance 39: 160–76. [Google Scholar] [CrossRef]
  36. Fischer, Stanley. 2015. The Federal Reserve and the Global Economy. IMF Economic Review 63: 8–21. [Google Scholar] [CrossRef]
  37. Gormley, Todd A. 2010. The impact of foreign bank entry in emerging markets: Evidence from India. Journal of Financial Intermediation 19: 26–51. [Google Scholar] [CrossRef] [Green Version]
  38. Haber, Stephen. 2004. Comment on “How Foreign Participation and Market Concentration Impact Bank Spreads: Evidence from Latin America” by Maria Soledad Martinez Peria and Ashoka Mody. Journal of Money, Credit and Banking 36: 539–42. [Google Scholar] [CrossRef]
  39. Hassan, M. Kabir, Benito Sanchez, Geoffrey M. Ngene, and Ali Ashraf. 2012. Financial Liberalization and Foreign Bank Entry on the Domestic Banking Performance in MENA Countries. African Development Review 24: 195–207. [Google Scholar] [CrossRef]
  40. Houston, Joel F., Chen Lin, and Yue Ma. 2012. Regulatory Arbitrage and International Bank Flows. Journal of Finance 67: 1845–95. [Google Scholar] [CrossRef]
  41. Jeon, Bang Nam, María Pía Olivero, and Ji Wu. 2011. Do foreign banks increase competition? Evidence from emerging Asian and Latin American banking markets. Journal of Banking and Finance 35: 856–75. [Google Scholar] [CrossRef]
  42. Jiménez, Gabriel, Jose A. Lopez, and Jesús Saurina. 2013. How does competition affect bank risk-taking? Journal of Financial Stability 9: 185–95. [Google Scholar] [CrossRef]
  43. Karolyi, G. Andrew, and Alvaro G. Taboada. 2015. Regulatory Arbitrage and Cross-Border Bank Acquisitions. Journal of Finance 70: 2395–450. [Google Scholar] [CrossRef]
  44. Keeley, Michael C. 1990. Deposit insurance, risk, and market power in banking. American Economic Review 80: 1183–200. [Google Scholar]
  45. Kim, In Joon, Jiyeon Eppler-Kim, Wi Saeng Kim, and Suk Joon Byun. 2010. Foreign investors and corporate governance in Korea. Pacific Basin Finance Journal 18: 390–402. [Google Scholar] [CrossRef]
  46. Kleymenova, Anya, Andrew K. Rose, and Tomasz Wieladek. 2016. Does Government Intervention Affect Banking Globalization? Journal of the Japanese and International Economies 40: 43–58. [Google Scholar] [CrossRef]
  47. Kouretas, Georgios P., and Chris Tsoumas. 2016. Foreign bank presence and business regulations. Journal of Financial Stability 24: 104–16. [Google Scholar] [CrossRef]
  48. Kraft, Evan. 2004. Foreign Banks in Croatia: Reasons for Entry, Performance and Impacts. Journal of Emerging Market Finance 3: 153–74. [Google Scholar] [CrossRef]
  49. Lensink, Robert, and Niels Hermes. 2004. The short-term effects of foreign bank entry on domestic bank behavior: Does economic development matter? Journal of Banking and Finance 28: 553–68. [Google Scholar] [CrossRef]
  50. Levine, Ross. 1997. American Economic Association Financial Development and Economic Growth: Views and Agenda Financial Development and Economic Growth: Views and Agenda. Source Journal of Economic Literature Journal of Economic Literature 35: 688–726. [Google Scholar]
  51. Luo, Yun, Sailesh Tanna, and Glauco De Vita. 2016. Financial openness, risk and bank efficiency: Cross-country evidence. Journal of Financial Stability 24: 132–48. [Google Scholar] [CrossRef]
  52. Marcus, Alan J. 1984. Deregulation and bank financial policy. Journal of Banking and Finance 8: 557–65. [Google Scholar] [CrossRef]
  53. Moch, Nils. 2013. Competition in fragmented markets: New evidence from the German banking industry in the light of the subprime crisis. Journal of Banking and Finance 37: 2908–19. [Google Scholar] [CrossRef]
  54. Modén, Karl-Markus, Pehr-Johan Norbäck, and Lars Persson. 2008. Efficiency and ownership structure: The case of Poland. World Economy 31: 437–60. [Google Scholar] [CrossRef]
  55. Molyneux, Philip, Linh H. Nguyen, and Ru Xie. 2013. Foreign bank entry in South East Asia. International Review of Financial Analysis 30: 26–35. [Google Scholar] [CrossRef]
  56. Noman, Abu Hanifa Md, Chan Sok Gee, and Che Ruhana Isa. 2018. Does bank regulation matter on the relationship between competition and financial stability? Evidence from Southeast Asian countries. Pacific Basin Finance Journal 48: 144–61. [Google Scholar] [CrossRef]
  57. Okuda, Hidenobu, and Suvadee Rungsomboon. 2006. Comparative cost study of foreign and Thai domestic banks in 1990–2002: Its policy implications for a desirable banking industry structure. Journal of Asian Economics 17: 714–37. [Google Scholar] [CrossRef]
  58. Panzar, John C., and James N. Rosse. 1987. Testing for “Monopoly” Equilibrium. Journal of Industrial Economics 35: 443–56. [Google Scholar] [CrossRef]
  59. Peng, Xu. 2017. Foreign Institutional Ownership and Risk Taking. REIT Discussion Paper Series; Tokyo: Research Institute of Economy, Trade and Industry, pp. 1–33. [Google Scholar]
  60. Polovina, Nereida, and Ken Peasnell. 2015. The effect of foreign management and board membership on the performance of foreign acquired turkish banks. International Journal of Managerial Finance 11: 359–87. [Google Scholar] [CrossRef]
  61. Rey, Hélène. 2013. Dilemma not Trilemma: The Global Financial Cycle and Monetary Policy Independence. Cambridge: National Bureau of Economic Research. [Google Scholar] [CrossRef]
  62. Rokhim, Rofikoh, and Anindya Pradipta Susanto. 2013. The increase of foreign ownership and its impact on the performance, competition and risk in the Indonesian banking industry. Asian Journal of Business and Accounting 6: 139–55. [Google Scholar] [CrossRef]
  63. Saif-Alyousfi, Abdulazeez Y. H., Asish Saha, and Rohani Md-Rus. 2017. Profitability of Saudi Commercial Banks: A comparative evaluation between domestic and foreign banks using CAMEL parameters. International Journal of Economics and Financial Issues 7: 477–84. [Google Scholar]
  64. Saleh, Mohamad Sofuan Mohamad. 2015. The impact of foreign banks entry on domestic banks’ profitability in a transition economy. Paper presented at 2nd International Conference on Management and Muamalah, Selangor, Malaysia, November 16–17; pp. 300–10. [Google Scholar]
  65. Sengupta, Rajdeep. 2007. Foreign entry and bank competition. Journal of Financial Economics 84: 502–28. [Google Scholar] [CrossRef]
  66. Šević, Zeljko. 2002. Comparing Financial Systems. Franklin Allen and Douglas Gale, The MIT Press, Cambridge, MA. International Journal of Finance and Economics 6: 269–70. [Google Scholar] [CrossRef]
  67. Shen, Chung-Hua, Chin-Hwa Lu, and Meng-Wen Wu. 2009. Impact of foreign bank entry on the performance of chinese banks. China and World Economy 17: 102–21. [Google Scholar] [CrossRef]
  68. Simpasa, Anthony M. 2013. Increased foreign bank presence, privatisation and competition in the Zambian banking sector. Managerial Finance 39: 787–808. [Google Scholar] [CrossRef]
  69. Spong, Kenneth, and Richard J. Sullivan. 2007. Corporate Governance and Bank Performance. In Corporate Governance in Banking: A Global Perspective. Cheltenham: Edward Elgar Publishing. [Google Scholar] [CrossRef]
  70. Sufian, Fadzlan, and Muzafar Shah Habibullah. 2010. Does Foreign Banks Entry Fosters Bank Efficiency? Empirical Evidence from Malaysia. Inzinerine Ekonomika-Engineering Economics 21: 464–74. [Google Scholar]
  71. Ukaegbu, Ben, and Isaiah Oino. 2014. The impact of foreign bank entry on domestic banking in a developing country the Kenyan perspective. Banks and Bank Systems 9: 28–35. [Google Scholar]
  72. Unite, Angelo A., and Michael J. Sullivan. 2003. The effect of foreign entry and ownership structure on the Philippine domestic banking market. Journal of Banking and Finance 27: 2323–45. [Google Scholar] [CrossRef]
  73. Vijaya, Ramya M., and Linda Kaltani. 2015. Foreign direct investment and wages:a bargaining power approach. Journal of World-Systems Research 13: 83–95. [Google Scholar] [CrossRef]
  74. Vives, Xavier. 2011. Competition policy in banking. Oxford Review of Economic Policy 27: 479–97. [Google Scholar] [CrossRef]
  75. Wu, Ji, Bang Nam Jeon, and Alina C. Luca. 2012. Foreign Bank Penetration, Resource Allocation and Economic Growth: Evidence from Emerging Economies. Journal of Economic Integration 25: 167–93. [Google Scholar] [CrossRef]
  76. Wu, Ji, Minghua Chen, Bang Nam Jeon, and Rui Wang. 2017. Does foreign bank penetration affect the risk of domestic banks? Evidence from emerging economies. Journal of Financial Stability 31: 45–61. [Google Scholar] [CrossRef]
  77. Xu, Ying. 2011. Towards a more accurate measure of foreign bank entry and its impact on domestic banking performance: The case of China. Journal of Banking and Finance 35: 886–901. [Google Scholar] [CrossRef]
  78. Yeyati, Eduardo Levy, and Alejandro Micco. 2007. Concentration and foreign penetration in Latin American banking sectors: Impact on competition and risk. Journal of Banking and Finance 31: 1633–47. [Google Scholar] [CrossRef]
  79. Yin, Yingkai, Yahua Zhang, Xiaotian Tina Zhang, and Fang Hu. 2015. Does Foreign Bank Entry Make Chinese Banks Stronger? Global Economic Review 44: 269–85. [Google Scholar] [CrossRef]
Figure 1. Overall trend of foreign bank entry across the globe. From 2000 to 2016, the banking system in different countries experienced essential transformations. The number of foreign banks and their assets has increased with time, which is also shown in Figure 1 and Figure 2. All of these different trends mean that the relative importance of the foreign banks increased extensively, from some foreign banks of an average of 30.62% in 2000 to 40.69% in 2016 (Figure 2): Source: Author’s calculation, World Bank Global Financial development database.
Jrfm 12 00106 g001
Figure 2. Overall level of financial stability across the globe. Across the globe the banking system is different experienced from 2000 to 2016. Both of the indicators are the risk-taking behavior (Z-score and non-performing loans to gross loans ) Source: Author’s calculation, World Bank, (GFDD).
Jrfm 12 00106 g002
Table 1. Descriptive statistics.
VariableMeanStd. Dev.MinMax
ZSC12.67557.93521.110039.3400
NPG6.37286.28660.250031.0000
FBA32.473132.04500.000099.0000
FBT37.536226.43380.000095.0000
HSC0.51260.22410.02000.9700
RBA6.98531.71572.700012.0000
CRE5.81941.29392.83009.0000
SPI10.78642.03955.980014.0000
PMO7.93981.29953.770011.0000
BC578.531316.192036.2700100.0000
BDG61.932051.65428.9300331.3700
SMR10.081726.6708−44.1500111.3400
ROA1.18971.2278−3.48005.4400
SMC53.769157.78250.3300356.5500
LGDP25.43101.828520.985630.0289
LINF4.46640.27563.47294.9822
LGPC9.18121.33896.131711.4467
WGI0.34680.8578−1.16671.8667
CAG−0.57789.0118−26.247031.0675
GSG23.731410.02844.047756.2200
PCD60.032540.13176.6940169.5500
Note: Std. Dev is the standard deviation; Min and Max shows the minimum and maximum value of all variables, respectively; ZSC shows a bank’s Z-score; NPG is the ratio of non-performing loans to total gross loans; FBA is the foreign bank assets to total bank assets; FBT is the total number of foreign banks to total banks; RBA is the restriction on bank activities; CRE is the capital regulation; SPI is the supervisory power index; PMO is the private monitoring; BC5 is the five-bank asset concentration; BDG is the bank deposit to GDP (%); SMR is the stock market return; ROA is the return on assets; SMC shows the stock market capitalization to GDP (%); GDP is the log of GDP; LINF is the log of consumer price index; WGI denotes the world governance index; CAG is the current account (% of GDP); GSG shows the gross saving (% of GDP); and PCD is the private credit to GDP.
Table 2. Correlation matrix.
VariablesZSCNPGFBAFBTHSCRBACRESPIPMOBC5BDGSMRROASMCLGDPLINFWGICAGGSGPCD
ZSC1
NPG−0.1338 *1
FBA−0.1251 *−0.02791
FBT−0.0719 *−0.0140.7816 *1
HSC−0.0425 *−0.0760 *0.01920.01681
RBA−0.0549 *0.1802 *−0.1500 *−0.1951 *0.0473 *1
CRE0.1219 *0.012−0.1929 *−0.1245 *0.0699 *0.0725 *1
SPI0.01550.1310 *−0.01460.03170.00830.3493 *0.2811 *1
PMO0.2385 *−0.0795 *−0.2294 *−0.1711 *−0.0894 *−0.1270 *0.0883 *0.1487 *1
BC50.0979 *−0.1319 *0.02370.0139−0.0650 * −0.2564 *−0.0885 *−0.1671 *0.1349 *1
BDG0.2405 *−0.1215 *−0.02160.0821 * 0.0093−0.2681 *0.0588 *0.047 *0.1849 *−0.03331
SMR−0.0335−0.0757 *−0.0106−0.04160.0531 *0.0735 *0.00410.0461 *−0.0311−0.0417−0.1288 *1
ROA0.1335 *−0.1958 *0.1146 *0.0729 *−0.1437 *0.0879 *−0.0684 *0.0266−0.0897 *0.001−0.2408 *0.2427 *1
SMC0.2541 *−0.3215 *−0.1312 *−0.0462 *−0.029−0.3175 *0.0698 *−0.0619 *0.3392 *0.1416 *0.5548 *−0.012−0.0753 *1
LGDP0.0478 * −0.2061 *−0.3754 *−0.3293 *0.2481 *0.041 *0.1220 *0.0890 *0.2441 *−0.3012 *0.1542 *−0.0483 *−0.2536 *0.2898 *1
LINF0.1188 *−0.2457 *0.0569 *0.1358 *0.1607 *−0.0934 *−0.0096−0.0250.1091 *−0.0455 *0.2474 *−0.1603 *−0.1545 *0.1550 *0.2814 *1
WGI0.0567 *−0.3374 *0.01580.01440.1101 *−0.3796 *0.01150.1293 *0.2303 *0.2616 *0.4823 *−0.1263 *−0.2538 * 0.4476 *0.2839 *0.2129 *1
CAG0.0953 *−0.0564 *−0.2438 * −0.2347 *0.0514 *−0.02070.0150.0948 *0.1506 *0.1350 *0.0703 *0.0624 * 0.00280.3160 *0.2112 *−0.02690.0954 *1
GSG0.1401 *−0.1394 *−0.2954 *−0.2586 *−0.0280.01470.0654 *0.1408 *0.1712 *0.1284 *0.01220.0678 *0.0577 *0.2700 *0.1916 *0.0384−0.01620.6302 *1
PCD0.0781 *−0.1694 *−0.2460 *−0.1443 * 0.0549 *−0.2490 *0.0524 *−0.0750 *0.2603 *0.1661 *0.6224 *−0.1854 *−0.3627 *0.5025 * 0.3599 *0.3195 *0.6990 *0.0687 *0.02541
Note: ***, **, and * shows the coefficients are significant at the 1%, 5%, and 10% level of significance, respectively.
Table 3. Bank competition, foreign bank entry, and bank risk-taking behavior (Z-Score).
VariablesModel 1Model 2Model 3Model 4Model 5Model 6
FBT−0.0073 ***0.0049 ***0.0311 ***
(0.0015)(0.0018)(0.0095)
FBA −0.0085 ***−0.0003−0.0343 ***
(0.0012)(0.0015)(0.0072)
HSC−0.3470 **0.4260 ***2.3450 ***−0.4960 ***0.1840 *−1.8270 ***
(0.1470)(0.1130)(0.6530)(0.1140)(0.0953)(0.3550)
HSCT0.0073 ***−0.0065 ***−0.0558 ***
(0.0028)(0.0022)(0.0151)
HSCA 0.0128 ***−0.00060.0522 ***
(0.00231)(0.0018)(0.0109)
BAC50.00840 ***−0.0054 ***0.00732 ***0.00878 ***−0.0057 ***0.0088 ***
(0.0013)(0.0009)(0.0016)(0.0012)(0.0009)(0.0014)
BDG0.0042 ***0.0011 *0.0054 ***0.0041 ***0.0010 *0.0039 ***
(0.0004)(0.0006)(0.0004)(0.0004)(0.0006)(0.0005)
SMR−0.0009−0.0003−0.0007−0.0010−0.0003−0.0014 **
(0.0006)(0.0003)(0.0007)(0.0006)(0.0003)(0.0006)
ROA0.1350 ***0.1320 ***0.1250 ***0.1440 ***0.1330 ***0.1750 ***
(0.0155)(0.0084)(0.0225)(0.0156)(0.0084)(0.0252)
SMC0.0017 ***0.0007 **0.00050.0018 ***0.0007 **0.0030 ***
(0.0004)(0.0003)(0.0006)(0.0004)(0.0003)(0.0006)
LGDP0.0920 ***−0.04080.0929 ***0.0945 ***−0.02850.0555 **
(0.0140)(0.0275)(0.0167)(0.0140)(0.0269)(0.0243)
LINF0.2650 ***0.1440 ***0.13200.2360 ***0.1460 ***0.3500 ***
(0.0711)(0.0475)(0.0905)(0.0708)(0.0473)(0.0823)
WGI−0.0722 **−0.0742−0.0880 ***−0.0937 ***−0.0744−0.0940 **
(0.0291)(0.0659)(0.0337)(0.0304)(0.0655)(0.0388)
CAG−0.00220.0047 **0.0015−0.00100.0049 ***−0.0023
(0.0027)(0.0018)(0.0037)(0.0027)(0.0018)(0.0029)
GSG0.00320.00140.0101 **0.00250.0012−0.0044
(0.0024)(0.0019)(0.0040)(0.0024)(0.0019)(0.0032)
PCD−0.0035 ***−0.0019 ***−0.0032 ***−0.0030 ***−0.0018 ***−0.0030 ***
(0.0007)(0.0006)(0.0008)(0.0007)(0.0006)(0.0009)
Constant−1.9180 ***2.7263 ***−3.0250 ***−1.8840 ***2.6270 ***−0.4640
(0.4470)(−0.5600)(0.6190)(0.4500)(0.5430)(0.7750)
Adjusted R20.21110.2385 0.21690.2334
F-statistics28.2529.71 29.2128.89
Prob. value0.0000 0.00000.0000
Mean VIF1.75 1.81
Wu–Hausman test 21.2251 17.0512
Prob. value 0.0000 0.0000
Hansen J-statistics 1.1382 0.908
Prob. value 0.286 0.3406
Note: This table exhibits OLS regression, pooled regression, and 2SLS with GMM results showing the effect of the interactive role of bank competition and foreign bank entry on risk-taking behavior across countries. The dependent variable is the log of ZSC for all models; FBA and FBT are both independent variables and an indicator of foreign bank entry; FBA is the foreign bank assets to total bank assets; FBT is the total number of foreign banks to total banks; HSC shows the H-statistics, which is a measurement of bank competition; HSCT and HSCA are both interactive terms for foreign bank entry and the level of competition to check the moderating effect on financial stability; BC5 is the five-bank asset concentration; BDG is the bank deposit to GDP (%); SMR is the stock market return; ROA is the return on assets; SMC shows the stock market capitalization to GDP (%); LGDP is the log of GDP; LINF is the log of the consumer price index; WGI denotes the world governance index; CAG is the current account (% of GDP); GSG shows the gross saving (% of GDP); and PCD is the private credit to GDP. The Hausman test of the fixed pooled model was selected and the small values of VIF denotes that the models are free from the problem of multicollinearity. The Wu–Hausman test shows the endogeneity, and the insignificant values of Hansen’s J test confirm the instrumental variables are valid; the robust standard errors are reported in parentheses. ***, **, and * shows the coefficients are significant at the 1%, 5%, and 10% level of significance.
Table 4. Bank competition, foreign bank entry, and bank risk-taking behavior (NPG).
VariablesModel 1Model 2Model 3Model 4Model 5Model 6
FBT−0.0103−0.0730 ***−0.3010 ***
(0.0120)(0.0275)(0.0825)
FBA −0.0117−0.0585 ***−0.3860 ***
(0.0103)(0.0224)(0.0863)
HSC−3.0330 ***−2.7110−22.8400 ***−2.2100 **−3.4950 **−22.0600 ***
(1.1740)(1.6740)(5.8560)(0.9140)(1.4010)(4.6700)
HSCT0.0411 *0.0661 **0.5130 ***
(0.0227)(0.0334)(0.1350)
HSCA 0.02870.0960 ***0.6070 ***
(0.0186)(0.0271)(0.1330)
BAC5−0.0341 ***0.0127−0.0262 **−0.0362 ***0.0146−0.0339 **
(0.0104)(0.0136)(0.0126)(0.0103)(0.0136)(0.0138)
BDG−0.0012−0.0096−0.0090 *2.29e−05−0.0119−0.0022
(0.0037)(0.0090)(0.0046)(0.0037)(0.0090)(0.0053)
SMR−0.0153 ***−0.0089 **−0.0172 ***−0.0157 ***−0.0081 *−0.0225 ***
(0.0052)(0.0044)(0.0066)(0.0053)(0.0044)(0.0073)
ROA−1.4900 ***−1.1820 ***−1.3990 ***−1.4740 ***−1.1850 ***−1.0170 ***
(0.1240)(0.1250)(0.1780)(0.1250)(0.1250)(0.2090)
SMC−0.0192 ***−0.0330 ***−0.0094 **−0.0189 ***−0.0327 ***−0.0021
(0.0032)(0.0055)(0.0046)(0.0032)(0.0055)(0.0069)
LGDP−0.5430 ***−2.3220 ***−0.5650 ***−0.6030 ***−2.4940 ***−1.1710 ***
(0.1120)(0.4070)(0.1170)(0.1130)(0.3960)(0.1980)
LINF−4.5000 ***−1.2180 *−3.5240 ***−4.3630 ***−1.2710 *−2.6820 ***
(0.5680)(0.7020)(0.7930)(0.5690)(0.6960)(0.9270)
WGI−3.1660 ***−1.8350 *−3.0870 ***−3.1560 ***−2.2200 **−3.1700 ***
(0.2330)(0.9760)(0.2760)(0.2440)(0.9650)(0.3430)
CAG0.1520 ***0.3210 ***0.1230 ***0.1510 ***0.3190 ***0.1340 ***
(0.0219)(0.0275)(0.0301)(0.0219)(0.0275)(0.0326)
GSG−0.1380 ***−0.1480 ***−0.1960 ***−0.1400 ***−0.1440 ***−0.2370 ***
(0.0192)(0.0293)(0.0322)(0.0193)(0.0292)(0.0363)
PCD0.0323 ***0.0645 ***0.0317 ***0.0321 ***0.0655 ***0.0328 ***
(0.0057)(0.0092)(0.0070)(0.0061)(0.0093)(0.0083)
Constant49.8400 ***77.4200 ***58.5800 ***50.7500 ***81.3500 ***71.3300 ***
(3.5700)(8.2940)(4.9980)(3.6140)(7.9930)(6.9260)
Adjusted R20.36830.3390 0.36710.3417
F-statistics60.3948.64 60.0849.23
Prob. value0.00000.0000 0.00000.0000
Mean VIF1.75 1.81
Wu–Hausman test 16.6254 35.4521
Prob. value 0.0000 0.0000
Hansen J-statistics 1.9429 0.172
Prob. value 0.1633 0.6783
Note: This table exhibits OLS regression, pooled regression, and 2SLS with GMM results showing the interactive role of bank competition and foreign bank entry on risk-taking behavior across the countries. The dependent variable is the NPG (ratio of non-performing loans to the gross loans). The FBA and FBT are both independent variables and an indicator for foreign bank entry, FBA is the foreign bank assets to total bank assets, FBT is the total number of foreign banks to total banks, HSC shows the H-statists as a measurement of bank competition, HSCT and HSCA are both an interactive term for foreign bank entry and level of competition to check the moderating effect on financial stability, BC5 is the five-bank asset concentration, BDG is the bank deposit to GDP (%), SMR is the stock market return, ROA is the return on assets, SMC shows the stock market capitalization to GDP (%), LGDP is the log of GDP, LINF is the log of consumer price index, WGI denotes the world governance index, CAG is the current account (% of GDP), GSG shows the gross saving (% of GDP), and PCD is the private credit to GDP. The Hausman test of the fixed pooled model was selected, and the small values of VIF denotes that the models are free from the problem of multicollinearity. The Wu–Hausman test shows the endogeneity, and the insignificant values of Hansen’s J test confirm the instrumental variables are valid. The robust standard errors are reported in parentheses. ***, **, and * show that the coefficients are significant at the 1%, 5%, and 10% level of significance.
Table 5. Bank regulation, foreign bank entry, and bank risk-taking behavior (Z-Score).
VariablesModel 1Model 2Model 3Model 4
FBA−0.00113−0.0387 ***
(0.00175)(0.00729)
FBT 0.0014−0.0813 ***
(0.0020)(0.0226)
HSC0.2000 *−1.9930 ***0.4320 ***−5.2260 ***
(0.1190)(0.3570)(0.1420)(1.4840)
HSCA−0.00050.0589 ***
(0.0023)(0.0107)
HSCT −0.00635 **0.1260 ***
(0.00283)(0.0359)
RBA−0.0401−0.1090 ***−0.0344−0.1720 ***
(0.0455)(0.0234)(0.0455)(0.0467)
CRE0.05900.02470.05930.0883 ***
(0.0515)(0.0158)(0.0514)(0.0258)
SPI−0.005280.01160.001630.0048
(0.0367)(0.0107)(0.0371)(0.0138)
PMO0.1440 ***0.0652 ***0.142 **0.0795 ***
(0.0554)(0.0204)(0.0555)(0.0242)
BAC5−0.0051 ***0.0079 ***−0.0050 ***0.0088 ***
(0.0011)(0.0017)(0.0011)(0.0022)
BDG0.0016 **0.0040 ***0.0016 **0.0025 ***
(0.0007)(0.0005)(0.0007)(0.0009)
SMR−0.0003−0.0014 *−0.0004−0.0011
(0.0003)(0.0007)(0.0003)(0.0009)
ROA0.1570 ***0.2040 ***0.1580 ***0.1940 ***
(0.0108)(0.0304)(0.0108)(0.0356)
SMC0.00084 *0.0022 ***0.00082 *0.0026 ***
(0.0004)(0.0007)(0.0004)(0.0009)
LGDP−0.01270.0585 **−0.01240.1060 ***
(0.0295)(0.0247)(0.0296)(0.0268)
LINF0.1730 ***0.4020 ***0.1830 ***0.5830 ***
(0.0548)(0.0888)(0.0558)(0.1420)
WGI0.00638−0.06330.01680.0490
(0.0702)(0.0548)(0.0704)(0.0810)
CAG0.0048 **−0.001640.0047 **−0.0073 *
(0.0023)(0.0030)(0.0023)(0.0043)
GSG0.0022−0.00340.0020−0.0081
(0.0024)(0.0031)(0.0024)(0.0054)
PCD−0.0028 ***−0.0029 ***−0.0028 ***−0.0039 ***
(0.0007)(0.0010)(0.0007)(0.0012)
LGPC0.0013−0.1030 **0.0068−0.1940 **
(0.0564)(0.0413)(0.0564)(0.0762)
Constant0.82300.31400.50701.2630
(0.870)(1.093)(0.857)(1.601)
R20.2078 0.211
Wald Test360.85409.11367.41227.83
Prob. value0.00000.00000.00000.0000
Wu–Hausman test22.0305 23.3424
Prob. value0.0000 0.0000
Hansen J-statistics0.1951 1.7598
Prob. value0.6587 0.1846
Note: This table exhibits pooled regression and 2SLS with GMM results showing the interactive role of bank competition and foreign bank entry on risk-taking behavior across countries with controlled banking regulations. The dependent variable is the log of ZSC for all models. The FBA and FBT are both independent variables and an indicator for foreign bank entry, FBA is the foreign bank assets to total bank assets, FBT is the total number of foreign banks to total banks, HSC shows the H-statistics as a measurement of bank competition, HSCT and HSCA are both interactive terms for foreign bank entry and level of competition to check the moderating effect on financial stability, RBA is the restriction on bank activities, CRE is the capital regulation, SPI is the supervisory power index, PMO is the private monitoring, BC5 is the five-bank asset concentration, BDG is the bank deposit to GDP (%), SMR is the stock market return, ROA is the return on assets, SMC shows the stock market capitalization to GDP (%), LGDP is the log of GDP, LINF is the log of consumer price index, WGI denotes the world governance index, CAG is the current account (% of GDP), GSG shows the gross saving (% of GDP), and PCD is the private credit to GDP. The Hausman test of the fixed pooled model was selected and the small values of VIF denotes that the models are free from the problem of multicollinearity. The Wu–Hausman test shows the endogeneity, and the insignificant values of Hansen’s J test confirm the instrumental variables are valid. The robust standard errors are reported in parentheses. ***, **, and * shows the coefficients are significant at the 1%, 5%, and 10% level of significance.
Table 6. Bank regulation, foreign bank entry, and bank risk-taking behavior (Non-performing loans to gross loans NPG).
VariablesModel 1Model 2Model 3Model 4
FBA−0.0541 ***−0.2970 ***
(0.0163)(0.0706)
FBT −0.0483 **−0.3650 ***
(0.0191)(0.1070)
HSC−3.0550 **−15.5400 ***−2.3310−25.0300 ***
(1.2490)(3.6070)(1.5200)(7.5350)
HSCA0.0835 ***0.4400 ***
(0.0245)(0.1040)
HSCT 0.0559 *0.5830 ***
(0.0301)(0.1730)
RBA−0.4170 *−0.9520 ***−0.3930−0.8680 ***
(0.2470)(0.2230)(0.2460)(0.2390)
CRE−0.1650−0.4760 ***−0.1280−0.0511
(0.2650)(0.1370)(0.2630)(0.1330)
SPI0.3160 *0.4290 ***0.3410 *0.3140 ***
(0.1910)(0.0863)(0.1950)(0.0878)
PMO0.2510−0.06580.26100.0616
(0.2940)(0.1500)(0.2940)(0.1510)
BAC5−0.00432−0.0332 ***−0.0053−0.0235 *
(0.0124)(0.0120)(0.0124)(0.0125)
BDG−0.001720.0003−0.0007−0.0072
(0.0064)(0.0044)(0.0064)(0.0050)
SMR−0.0082 *−0.0177 ***−0.0086 *−0.0163 **
(0.0044)(0.0064)(0.0044)(0.0066)
ROA−1.2550 ***−1.0940 ***−1.2640 ***−1.2650 ***
(0.1220)(0.1910)(0.1220)(0.1850)
SMC−0.0297 ***−0.0111 **−0.0305 ***−0.0137 ***
(0.0047)(0.0050)(0.0047)(0.0044)
LGDP−0.7030 ***−0.7440 ***−0.6930 ***−0.3470 ***
(0.2190)(0.1530)(0.2160)(0.1270)
LINF−3.0080 ***−2.5220 ***−2.9180 ***−2.7000 ***
(0.5530)(0.8430)(0.5670)(0.8580)
WGI−1.4360 **−1.1480 ***−1.3050 **−1.3050 ***
(0.5950)(0.4440)(0.5970)(0.4310)
CAG0.3140 ***0.1770 ***0.3100 ***0.1590 ***
(0.0253)(0.0307)(0.0253)(0.0317)
GSG−0.1770 ***−0.2170 ***−0.1770 ***−0.2130 ***
(0.0256)(0.0321)(0.0257)(0.0336)
PCD0.0491 ***0.0290 ***0.0474 ***0.0317 ***
(0.0079)(0.0073)(0.0078)(0.0072)
LGPC−2.1440 ***−2.2460 ***−2.1450 ***−2.0570 ***
(0.4340)(0.3830)(0.4360)(0.3870)
Constant63.6200 ***81.7700 ***62.3100 ***72.5200 ***
(6.1640)(8.2490)(5.9260)(7.2210)
R20.3386 0.3356
Wald Test725.57630.97716.11591.53
Prob. value0.00000.00000.00000.0000
Wu–Hausman test23.7720 17.8581
Prob. value0.0000 0.0000
Hansen J-statistics0.2137 3.1424
Prob. value0.6439 0.0763
Note: This table exhibits pooled regression and 2SLS with GMM results showing the interactive role of bank competition and foreign bank entry on risk-taking across countries. The dependent variable is the NPG (ratio of non-performing loans to gross loans), FBA and FBT are both independent variables and an indicator for foreign bank entry, FBA is the foreign bank assets to total bank assets, FBT is the total number of foreign banks to total banks, HSC shows the H-statistics as a measurement of bank competition, HSCT and HSCA are both interactive terms for foreign bank entry and level of competition to check the moderating effect on financial stability, RBA is the restriction on bank activities, CRE is the capital regulation, SPI is the supervisory power index, PMO is the private monitoring, BC5 is the five-bank asset concentration, BDG is the bank deposit to GDP (%), SMR is the stock market return, ROA is the return on assets, SMC shows the stock market capitalization to GDP (%), LGDP is the log of GDP, LINF is the log of the consumer price index, WGI denotes the world governance index, CAG is the current account (% of GDP), GSG shows the gross saving (% of GDP), and PCD is the private credit to GDP. The Hausman test of the fixed pooled model was selected. The small values of VIF denote that the models are free from the problem of multicollinearity. The Wu–Hausman test shows the endogeneity, and the insignificant values of Hansen’s J test confirm the instrumental variables are valid. The robust standard errors are reported in parentheses. ***, **, and * show the coefficients are significant at the 1%, 5%, and 10% level of significance.
Table 7. Bank competition, foreign bank entry, and banking risk (2SLS results).
VariablesLZSCLZSCNPGNPG
FBT0.0567 ** −0.9330 **
(0.0245) (0.3640)
FBA 0.0305 *** −0.4930 ***
(0.0103) (0.120)
HSC3.8160 **0.9830 **−58.7700 ***−21.8000 ***
(1.6200)(0.4340)(22.5300)(5.098)
HSCT−0.0913 ** 1.379 ***
(0.0380) (0.5280)
HSCA −0.0322 ** 0.618 ***
(0.0125) (0.148)
BAC50.0086 ***0.0116 ***−0.0471 **−0.0633 ***
(0.00179)(0.0014)(0.0215)(0.0158)
BDG0.0071 ***0.0056 ***−0.0481 **−0.0159 **
(0.0011)(0.0005)(0.0195)(0.0068)
SMR−0.0004−0.0001−0.0250 **−0.0260 ***
(0.0008)(0.0007)(0.0108)(0.0080)
ROA0.1140 ***0.1080 ***−1.2000 ***−0.9990 ***
(0.0268)(0.0237)(0.2940)(0.2300)
SMC−0.0003−1.52 × 10−50.01590.00363
(0.0010)(0.0007)(0.0153)(0.0080)
LGDP0.1040 ***0.2020 ***−1.3140 ***−1.8200 ***
(0.0194)(0.0302)(0.3620)(0.3360)
LINF0.08300.0044−0.2420−1.6410
(0.1250)(0.1060)(2.0050)(1.0980)
WGI0.07010.0128−4.839 ***−4.241 ***
(0.0610)(0.0412)(0.845)(0.454)
CAG0.00188−5.76e−050.07390.1370 ***
(0.0043)(0.0036)(0.0554)(0.0349)
GSG0.0144 **0.0127 ***−0.2570 ***−0.2650 ***
(0.0063)(0.0046)(0.0657)(0.0439)
PCD−0.00626 ***−0.00366 ***0.0412 ***0.0389 ***
(0.0012)(0.0008)(0.0119)(0.0088)
DD*FBT−0.0109 *** 0.2070 **
(0.00364) (0.0848)
DD*FBA −0.0136 *** 0.1380 ***
(0.0032) (0.0350)
Constant−4.061 ***−5.079 ***88.82 ***87.77 ***
(1.027)(0.9380)(17.17)(10.81)
Wald Test210.99352.20208.82401.81
Prob. value0.00000.00000.00000.0000
Wu–Hausman test11.797511.599726.336632.4296
Prob. value0.00060.00000.00000.0000
Sargan Test3.75270.01722.16040.486
Prob. value0.05270.89540.14160.4857
Note: This table exhibits the 2SLS showing the interactive role of bank competition and foreign bank entry on the risk-taking behavior across countries. The dependent variables are the bank Z-score and NPG (ratio of non-performing loans to the gross loans), FBA and FBT are both independent variables and indicators of foreign bank entry, FBA is the foreign bank assets to total bank assets, FBT is the total number of foreign banks to total banks, HSC shows the H-statistics as a measurement of bank competition, HSCT and HSCA are both interactive terms for foreign bank entry and the level of competition to check the moderating effect on financial stability, BC5 is the five-bank asset concentration, BDG is the bank deposit to GDP (%), SMR is the stock market return, ROA is the return on assets, SMC shows the stock market capitalization to GDP (%), LGDP is the log of GDP, LINF is the log of the consumer price index, WGI denotes the world governance index, CAG is the current account (% of GDP), GSG shows the gross saving (% of GDP), and PCD is the private credit to GDP. DD*FBA and DD*FBT are both interactive terms used to examine foreign bank entry in developed economies. The significant value of the Wald test explains that the models are correctly specified, the Wu–Hausman test shows the endogeneity, the insignificant values of the Sargan test confirm the over-identifying restrictions, and the robust standard errors are reported in parentheses. ***, **, and * show the coefficients are significant at the 1%, 5%, and 10% level of significance.
Table 8. Bank competition, foreign bank entry, and banking risk (2SLS results).
VariablesLZSCLZSCNPGNPG
FBT0.0541 *** −0.3890 ***
(0.0133) (0.115)
FBT2−0.0005 *** 0.0030 ***
(0.0001) (0.0009)
FBA 0.0823 *** −0.6730 ***
(0.0285) (0.2440)
FBA2 −0.0007 *** 0.0053 ***
(0.0002) (0.0019)
HSC0.5220 *0.3350−10.03 ***−8.8200 ***
(0.2880)(0.3170)(2.320)(2.6870)
HSCT−0.0199 *** 0.2450 ***
(0.0072) (0.0610)
HSCA −0.0199 * 0.2820 ***
(0.0108) (0.0923)
BAC50.0071 ***0.0103 ***−0.0265 **−0.0469 ***
(0.0014)(0.0016)(0.0118)(0.0137)
BDG0.0063 ***0.0053 ***−0.0142 **−0.00904
(0.0006)(0.0006)(0.0058)(0.0060)
SMR−0.0007−0.0006−0.0168 ***−0.0185 **
(0.0006)(0.0008)(0.00630)(0.00749)
ROA0.1200 ***0.1260 ***−1.396 ***−1.334 ***
(0.01940)(0.0237)(0.163)(0.2010)
SMC−0.00030.0004−0.0065−0.0084
(0.0006)(0.0007)(0.0048)(0.0056)
LGDP0.0676 ***0.1560 ***−0.409 ***−1.0610 ***
(0.0162)(0.0251)(0.121)(0.220)
LINF0.2630 ***0.1420−4.378 ***−3.62005 ***
(0.0770)(0.102)(0.738)(0.885)
WGI0.0767 *−0.0374−3.9930 ***−3.5408 ***
(0.0423)(0.0416)(0.3960)(0.361)
CAG0.0057 *−0.00660.1050 ***0.1920 ***
(0.0033)(0.0048)(0.0321)(0.0369)
GSG0.0121 ***0.0281 ***−0.1950 ***−0.3270 ***
(0.0037)(0.0095)(0.0323)(0.0767)
PCD−0.0054 ***−0.00170.0432 ***0.0232 ***
(0.0008)(0.0011)(0.0078)(0.0084)
Constant−2.412 ***−5.118 ***53.58 ***74.62 ***
(0.5200)(1.1500)(4.3590)(10.4100)
Wald Test396.3306.4612.15451.05
Prob. value0.00000.00000.00000.0000
Wu–Hausman test19.754515.176115.723713.4202
Prob. value0.00000.00010.00010.0003
Sargan Test0.20843.33093.67891.1793
Prob. value0.6480.0680.05510.2775
Note: This table exhibits that the 2SLS showing the interactive role of bank competition and foreign bank entry on the risk-taking behavior across countries. The dependent variables are the bank Z-score and NPG (ratio of non-performing loans to the gross loans), FBA and FBT are both independent variables and indicators of foreign bank entry, FBA is the foreign bank assets to total bank assets, FBT is the total number of foreign banks to total banks. The FBA2 and FBT2 are both square terms of the independent variables to examine the non-linear relationship between foreign bank entry and risk-taking behavior (an inverted U-shape relationship). The HSC shows the H-statistics as a measurement of bank competition, HSCT and HSCA are both interactive terms of foreign bank entry and the level of competition to check the moderating effect on the stability position, BC5 is the five-bank asset concentration, BDG is the bank deposit to GDP (%), SMR is the stock market return, ROA is the return on assets, SMC shows the stock market capitalization to GDP (%), LGDP is the log of the GDP, LINF is the log of the consumer price index, WGI denotes the world governance index, CAG is the current account (% of GDP), GSG shows the gross saving (% of GDP), and PCD is the private credit to GDP. The significant value of the Wald test explains that the models are correctly specified. The Wu–Hausman test shows the endogeneity, and the insignificant values of the Sargan test confirm the over-identifying restrictions. The robust standard errors are reported in the parentheses. ***, **, and * shows the coefficients are significant at the 1%, 5%, and 10% level of significance.

