1. Introduction
The purpose of this paper is to build price indicators of deviation from the law of one price for corporate bonds within the euro area. According to the law of one price, two securities with identical cash flows and risk profiles should command the same price. We will equivalently refer to systematic and statistically significant deviations from the law of one price either as financial fragmentation or lack of financial integration. The yield on corporate bonds with similar credit rating and maturity structure (our main proxies for risk profiles) should not be significantly affected by the country where the bond is issued. The main contribution of this paper is to estimate country risk premia in the yields of non-financial corporate bonds for a panel of 719 individual bonds issued by 153 non-financial corporates, controlling for credit and maturity risk.
Our results show that while financial fragmentation has remained fairly limited during the post Lehman Great Recession, from 2008 to 2009, it reaches very high levels at the heights of the euro area sovereign crisis in 2011 and 2012. Corporate bonds issued in Italy and Spain bear higher yields than similar bonds issued in France and Germany. Fragmentation has receded gradually since the announcement of the Outright Monetary Transaction (OMT thereafter) program that the ECB announced in September 2012. Hence, during the most acute periods of the sovereign debt crisis, corporate bondholders have required higher yields to hold corporate bonds issued in Italy and Spain. To the extent that this increased the cost of funding for firms in these countries, it is likely to have dampened the effectiveness of the accommodative stance pursued by the ECB.
These country premia appear to be correlated with the credit premia of their respective sovereign. Such correlations show that corporate issuers are not fully insulated from the domestic economy and financial turmoil associated with a sovereign default. This can be due to several reasons including the difficulty to diversify portfolio against a sovereign default in Italy or Spain, risks of financial repression (
Becker and Ivashina 2014), redenomination risk (
De Santis 2015) or concerns on the funding of a public bailout of the finance industry (
Acharya et al. 2014;
Bofondi et al. 2013).
These results are useful for the analysis and implementation of monetary policy. Since 2010, the European Central Bank (ECB) has frequently referred to the financial fragmentation within the euro area as an impediment to the transmission of its monetary policy to bank lending rates and thus a major obstacle to the conduct of monetary policy (see for instance
ECB 2013 and
Coeuré 2014). Our measure of financial fragmentation, which we update on a quarterly frequency and publish on an
online appendix, can be used to assess this impediment to the transmission of the ECB monetary policy.
Our results relate to at least three strands of empirical finance: credit risks of sovereigns, credit risk on corporate and the measurement of financial fragmentation in the euro area.
Second, this paper is related to the literature on the credit spread. Studies using either reduced form models or calibrated models obtain that default probabilities explain only one third of the variations in credit spreads for investment grade bonds (
Collin-Dufresne et al. 2001;
Duffie et al. 2007;
Giesecke et al. 2011;
Huang and Huang 2012). The remaining part of the spread can include tax asymmetries (
Elton et al. 2001) or dispersed information (
Albagli et al. 2014). Most of the literature focuses however on credit risk premia and liquidity premia.
1 A credit risk premium is asked by the investors because of the tendency for defaults to cluster in bad states of the economy and the ensuing difficulty to hedge against such risk. Liquidity premia are asked for bonds that, in some state of the economy, are not fully liquid and therefore costly to sell. The role of the corporate bond illiquidity on corporate bond prices is emphasized in both theoretical (
Lo et al. 2004;
Acharya and Pedersen 2005;
Garleanu and Pedersen 2013) and empirical analyses emphasize (
Bao et al. 2011;
Dick-Nielsen et al. 2012;
Friewald et al. 2012). Our results highlight that both credit risk and liquidity premia peaked during the sovereign debt crisis for Italy and Spain.
Third, a growing literature investigates financial fragmentation in the euro area and their impact on the business cycle.
Gilchrist and Mojon (
2018) compute credit risk indices for the euro area banks and non-financial corporate issuers following the methodology of
Gilchrist and Zakrajsek (
2012). They show instead that their aggregate, security-specific measure of credit risk is a useful leading indicator of real activity.
Bleaney et al. (
2012) extend
Gilchrist and Zakrajsek (
2012) for non-financial corporate bonds issued in 8 European countries. They also estimate excess bond premia, defined as the difference between the credit spread and a measure of credit risk proxied by distance to default and relate it indicators of economic activity. Using prices at issuance,
Pianeselli and Zaghini (
2014) estimate the risk premia of non-financial long-term corporate bonds for a sample of euro area, US and UK bonds, whereas
Zaghini (
2016) focuses on euro area bonds. Unlike our paper, they focus on the primary market. Because issuances are not frequent events, they cannot identify developments in the fragmentation within a year. Previous crises however highlighted that the financial market can vary dramatically within a few weeks. Furthermore, by considering only a yearly time scale, their estimates are sensitive to differences in the seasonality in the issuance from one country to the other. For these two reasons, we prefer to focus on the secondary market. Our approach is closely related to the one of
Baele et al. (
2004). They estimate a series of cross-sectional regressions of corporate bond yield spreads against bond specific characteristics (coupon, liquidity, time to maturity) and a set of dummies proxying for rating and sectors. Next, they test for integration by checking whether the residuals from these regressions still contain systematic country components. Their analysis focuses on the 1995–2003 period, which can be viewed as a time of convergence of financial conditions across euro-area countries. Our study also complements
De Santis (
2018), who regresses credit spreads on various controls for issuer credit risk and country specific macroeconomic and financial variables. Similar to the law of one price which motivates our measure, his test for financial integration is constructed using the assumption that the country component of the excess bond premia should equal across all countries. Unlike our paper, however, he carries out a Wald test on the cross-sectional equality of the unobservable country risk in each period. The results of this approach are sensitive to the specification of the credit spread regression in the first stage and especially to omitted variables. Furthermore, coefficients in the credit spread regression are known to change during crises (
Dick-Nielsen et al. 2012), because changes in the excess bond spread are also driven by time-varying pricing of the credit risk (
Gilchrist and Zakrajsek 2012).
De Santis (
2018) accommodates it using a different set of coefficient for the times before and after the crisis. Our model, based on dummy variables and monthly time-varying coefficients, is less sensitive to model specification. In addition, the measurement of market fragmentation we propose is freely available on line and easy to implement, once the data is available.
The paper proceeds as follows.
Section 2 is devoted to the data, corporate bond main characteristics as well as the computation of the spreads.
Section 3 presents the reduced-form model for panel data. Results of the benchmark model are reported in
Section 4.
Section 5 presents a series of robustness checks.
Section 6 concludes.
2. Data
Our empirical analysis builds on a new database of comparable interest rates on corporate bonds. In this section, we first describe the source of our data and next we discuss in detail the summary statistics of our key variables.
2.1. Source
We collect data on individual corporate bonds over the period from January 2004 to August 2018. The dataset has been constructed at the security level from Datastream, Bloomberg and Dealogic. We impose several restrictions to ensure the data are homogeneous. The sample is restricted to fixed coupon, non-callable securities issued by non-financial corporations, for which Moody’s rating is available at all dates. We observe the yield of each bond, which we measure with the yield to maturity, on the last day of the month. We follow bonds from their issuance to their maturity. However, since the market price is volatile for bonds close to their maturity, we discard bonds with a residual maturity less than eighteen months.
The identification of a firm’s country requires special care, as the location of a firm does not necessarily match the nationality of its’ owner.
2 Furthermore, large firms sometime hold finance vehicle in charge of corporate debt issuance and these branches can be located in other countries. The location of the issuer, namely the branch, should not be confused with the location of its’ parent company. The country we will refer to hereafter is the location of the parent company, since it reflects the market in which the firm evolves and the sovereign to which it is mostly related to. Our sample contains data on securities whose issuer parent company are located either in Germany, France, Italy or Spain.
We complement the data on yields with the ratings of the parent company as provided by Moodys.’
2.2. Descriptive Statistics
The key variable we use in our empirical analysis is the corporate bond spread over the German government bond with similar maturity. More precisely, let the
index denote a corporate bond. The corresponding spread
is the difference between the yield
of the corporate debt security and the German Bund zero coupon of a similar duration
. Hence:
Asset swap spreads (ASW spreads) are sometime used in the literature instead of a yield-to-maturity spread such
. An ASW spread is a derivative price that is measuring credit spreads vis-à-vis the EURIBOR curve. It is traded by investors over the counter, often large investment banks, so as to hedge against both default risk and interest rate risk. Because asset swaps and a risk-free sovereign bond are both free of default risk, arbitrage among markets leads to similar spreads dynamics. Results provided by
De Santis (
2018) over the period 1999–2015 using both spreads are hence very close.
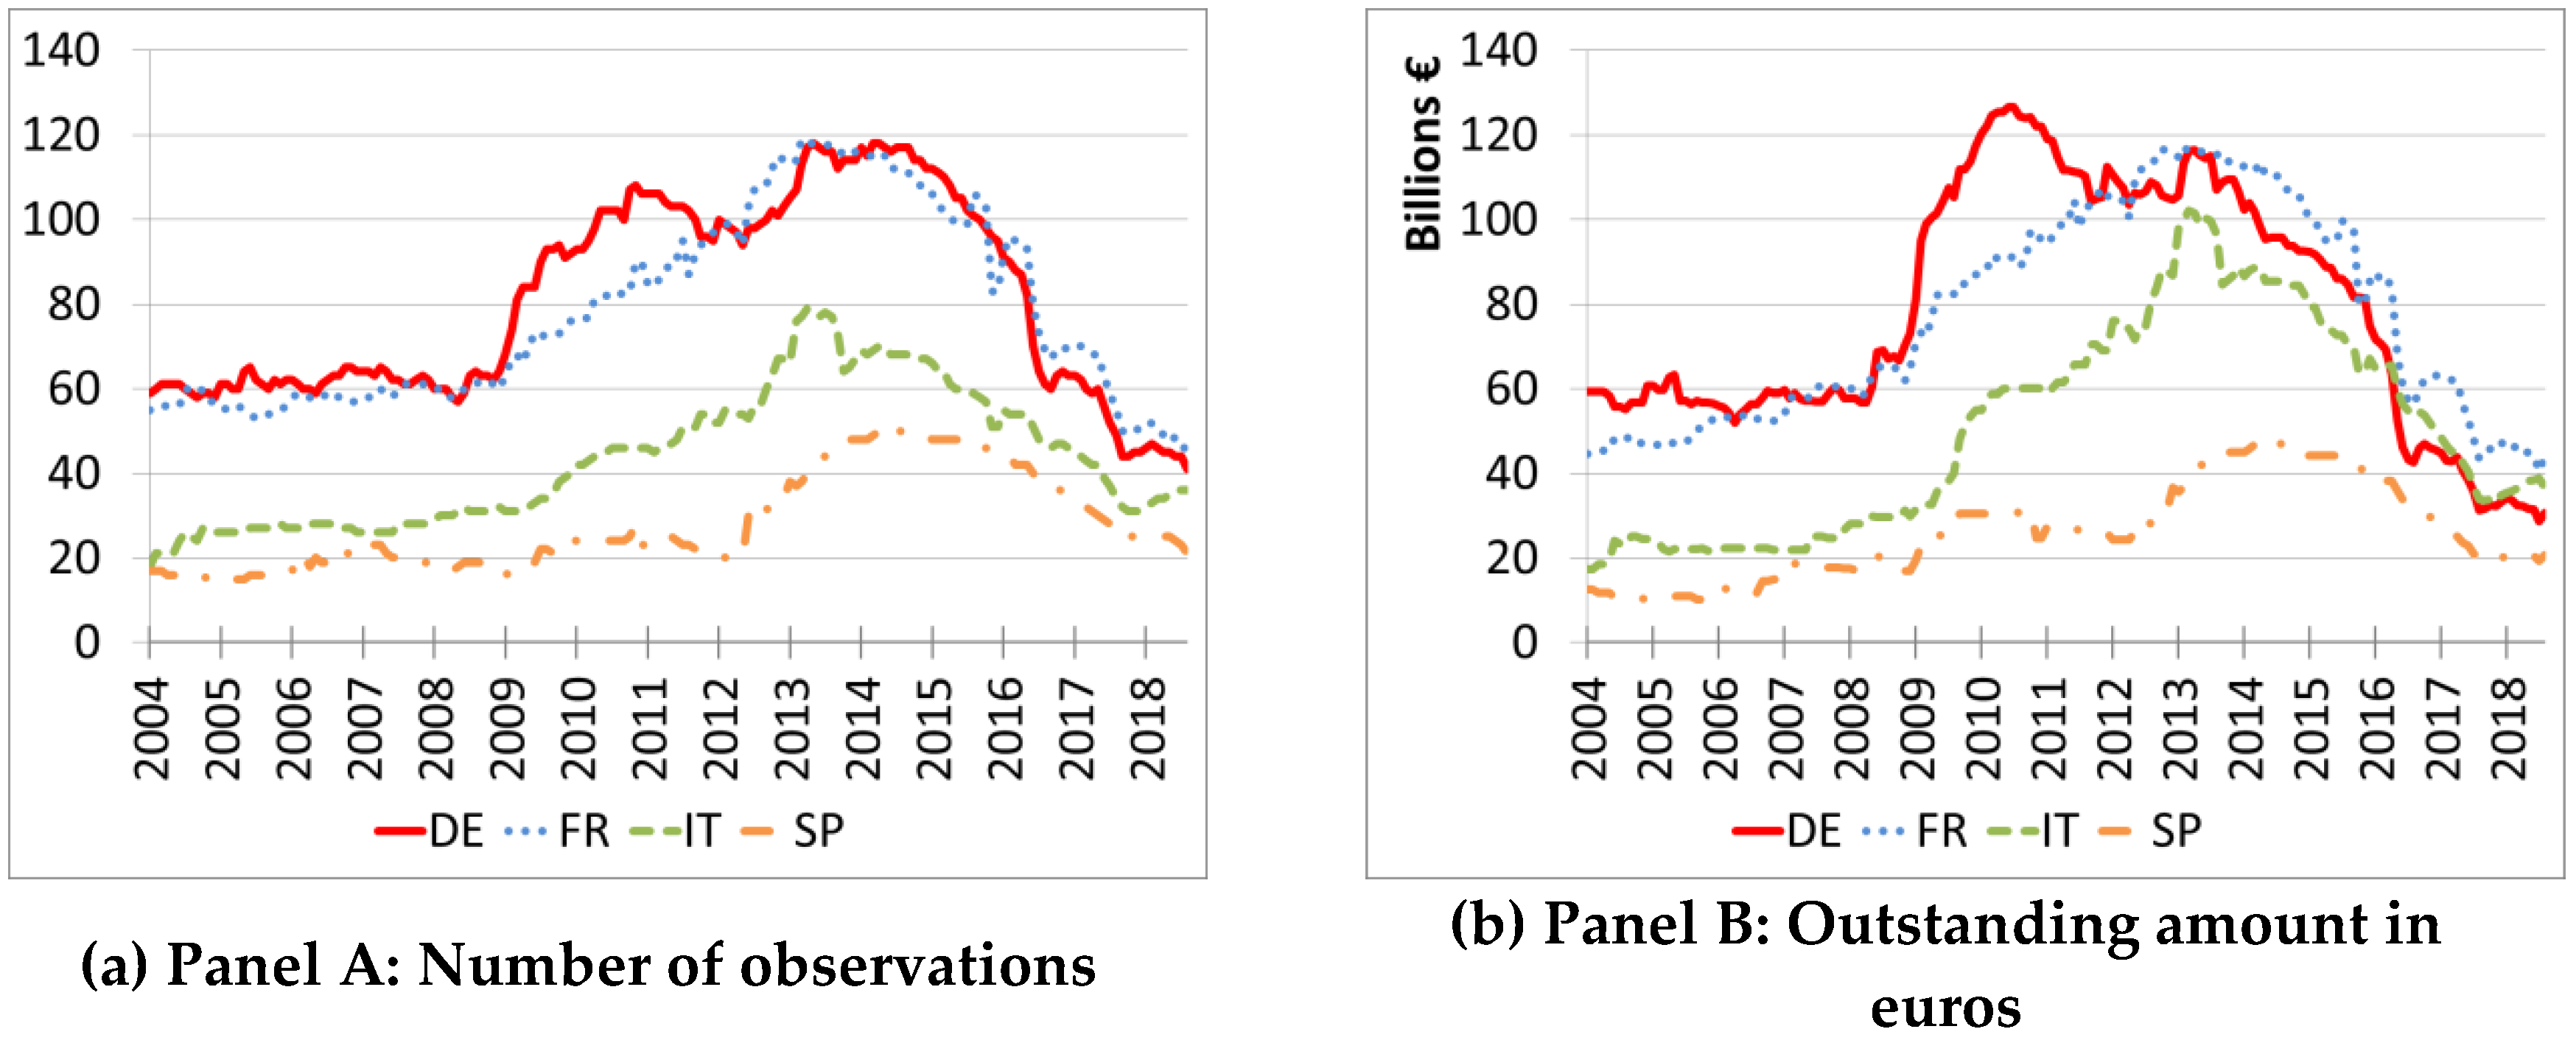
The sample is of about 40,000 monthly observations, relative to 719 corporate securities and 153 issuers. Details on the number of observations along with summary statistics on their main characteristics, including the size of the issuance, maturity and durations, are in
Table 1. About two third of the observations come from issuers located in France or Germany. Nonetheless, the average issuances, close to 1 billion dollars and the maturities, around 9 years, are quite similar across countries. The most noticeable difference is that Italian yields 60 basis points higher than their counterparts in Germany or France. This is partly explained by the maturity of Italian bonds, which is longer by about 1 year.
Figure 1 provides further information on the depth of the markets. The relative proportions of bonds issued in each country are quite stable over time. Germany and France have about twice more bonds on the market than Italy and Spain. However, the gap in outstanding amounts get narrower over time.
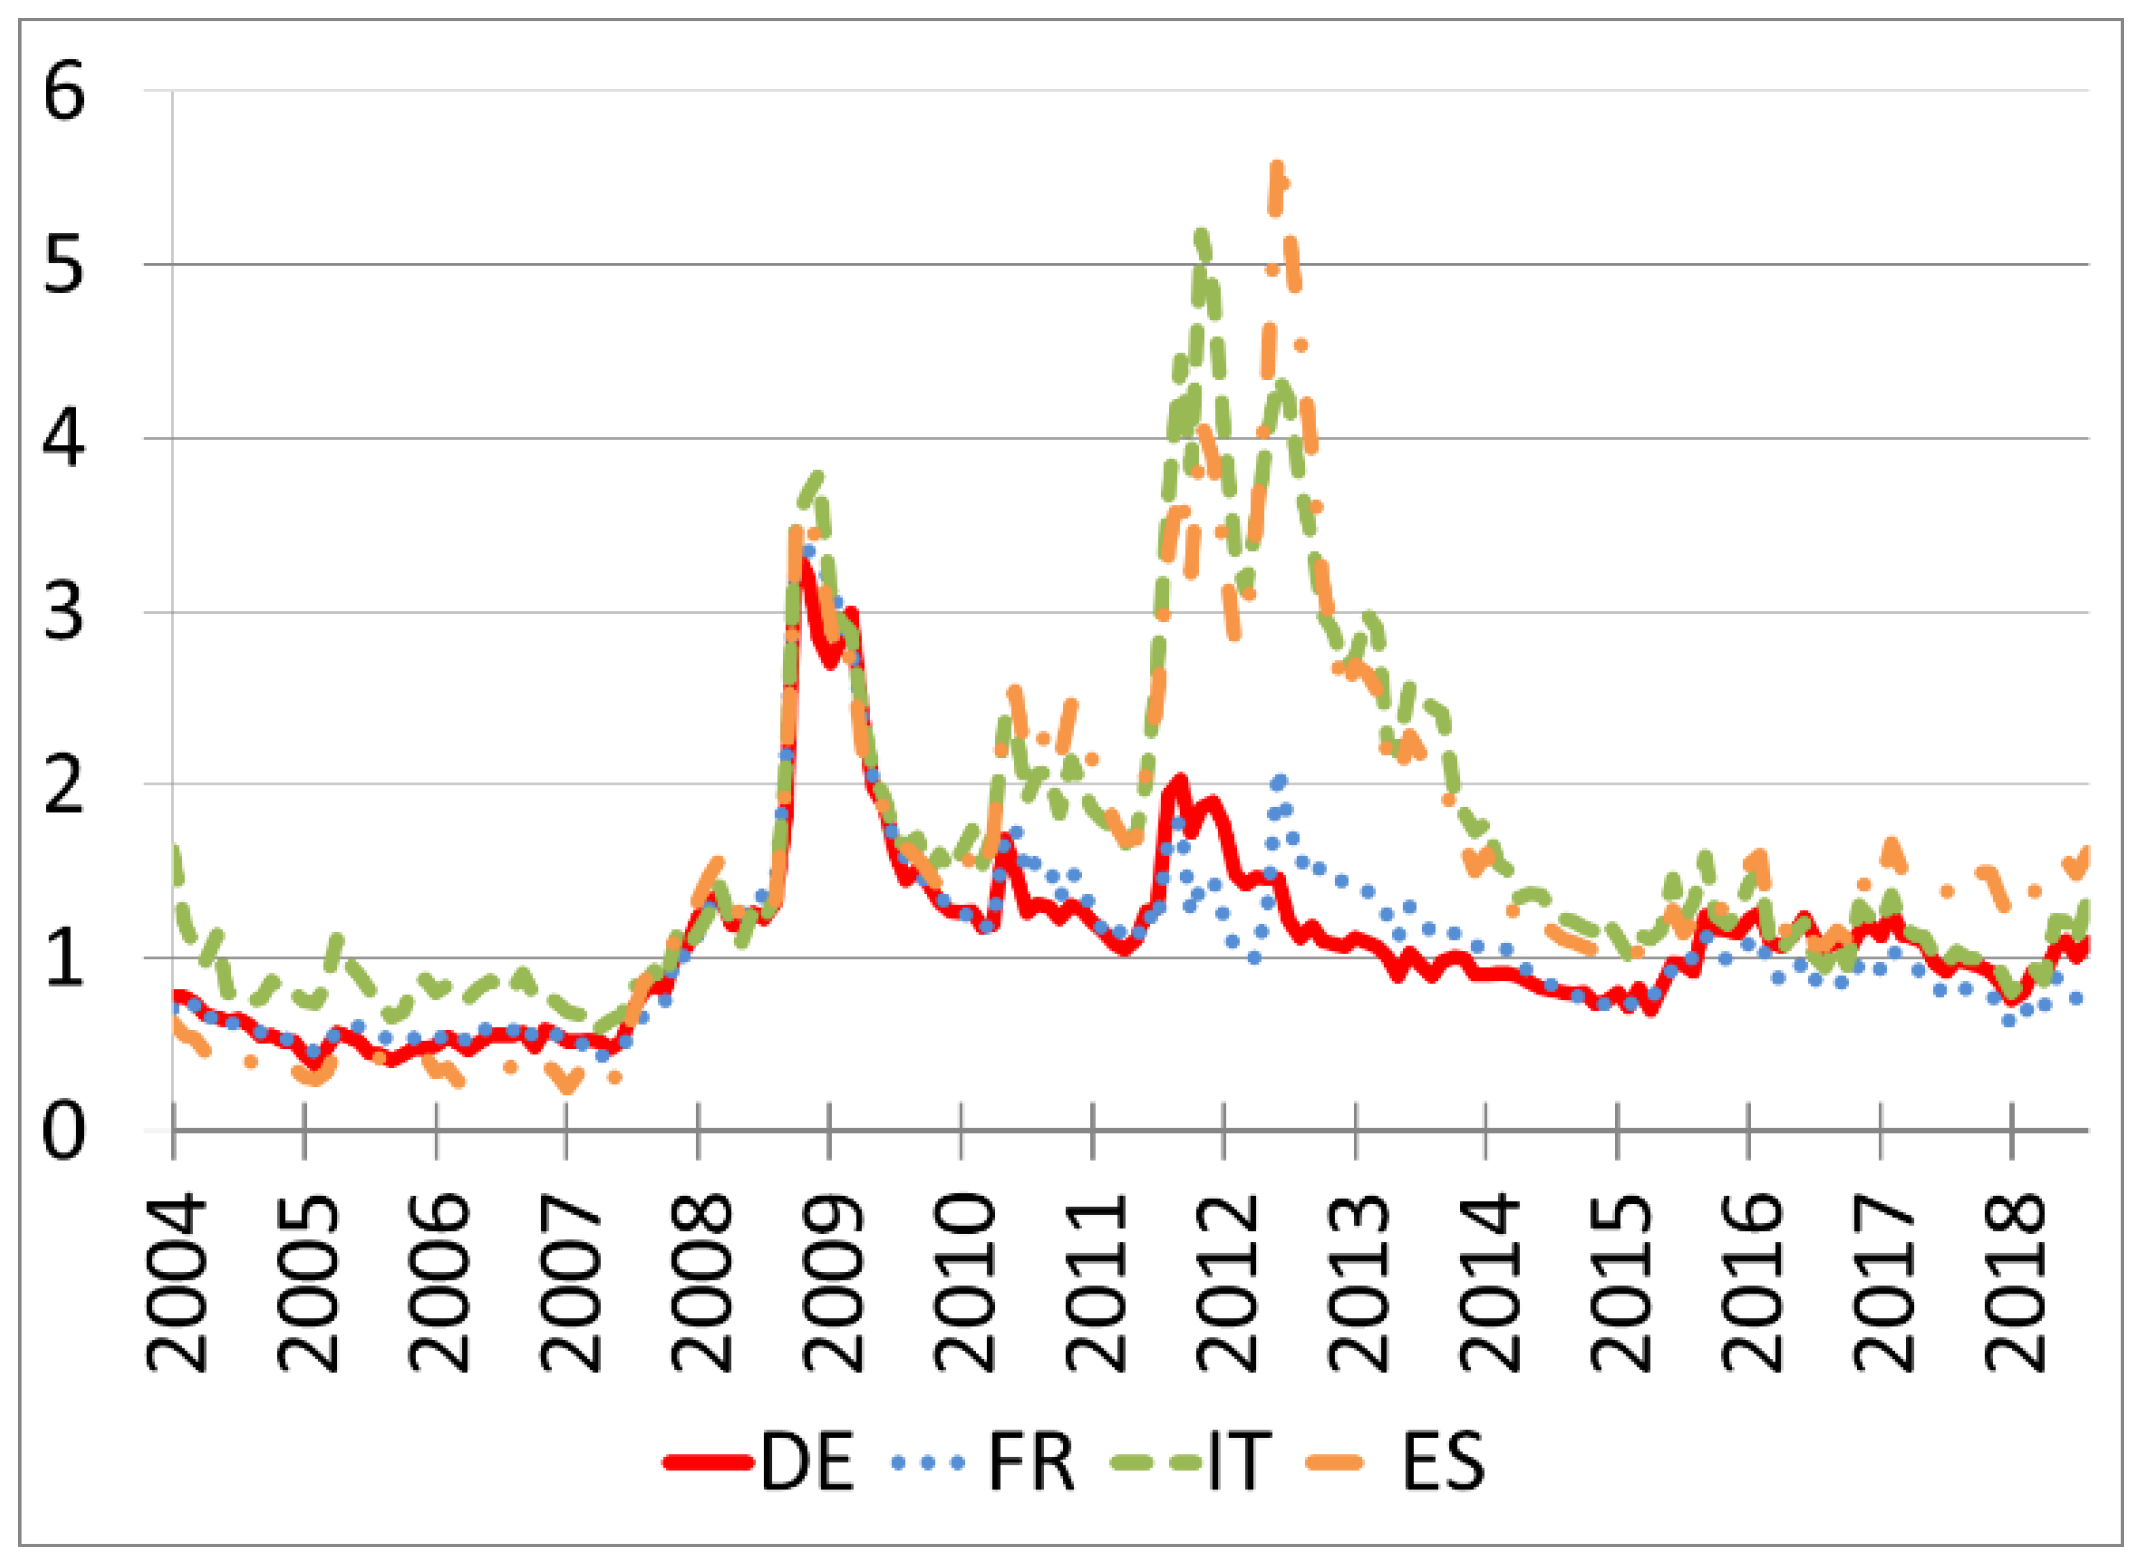
Figure 2 displays the evolution of the average spread in the countries under review. They co-move remarkably up to 2010 and split into two groups afterwards. For France and Germany, they stabilise at levels which are about 50 to 100 basis points above those observed before 2008. For Italy and Spain, they increase first mildly and temporarily in 2010 and then sharply from early 2011 to mid-2012. After that, they decrease. For Italy, the spread reaches at the end of the period levels similar to those observed for France and Germany, whereas for Spain, it remains greater by about 50 basis points.
2.3. Rating Dynamics
Differences in the cross-country averages could be explained by differences in firms’ characteristics. The widening in spreads observed between 2011 and 2014 for Italian and Spanish firms could be due to a composition effect, triggered for instance by an increase in the firms’ risk of default relative to their German and French counterparts. Indeed, the price of a bond without default risk is equal to the net present value of its’ future cash flows. It is a weighted average of the bond future payments. In the case where the bond presents a default risk that cannot be diversified, the weights are proportional to the default probability and hence decrease relative to the risk-free case. This why bonds with default risk trade at lower prices than risk-free bonds. This discount compensates investors for default risk and the losses they would incur in case a default would occur.
We control for individual default risks using the security credit ratings from Moodys’.
3 While ratings are only an imperfect measure of default risks, they remain the most widely used measures of credit risk. Banks can use ratings provided by rating agencies to compute their risk-weighted assets. This is a major driver of banks’ capital ratios, which is especially monitored by the supervisory authorities. Ratings are also used by the monetary authorities to define the lists of assets that can be pledged, as well as by the financial agents that engage in repo transactions. In addition, recent papers have showed that the accuracy of ratings improves in periods of financial stress like the one we consider in our sample (
Bar-Isaac and Shapiro 2013;
Koopman et al. 2009;
Broto and Molina 2014). One concern for our analysis is that the ratings of corporates can mechanically reflect the ratings of their sovereign (
Almeida et al. 2014;
Adelino and Ferreira 2016), without a direction connection with firms’ fundamentals.
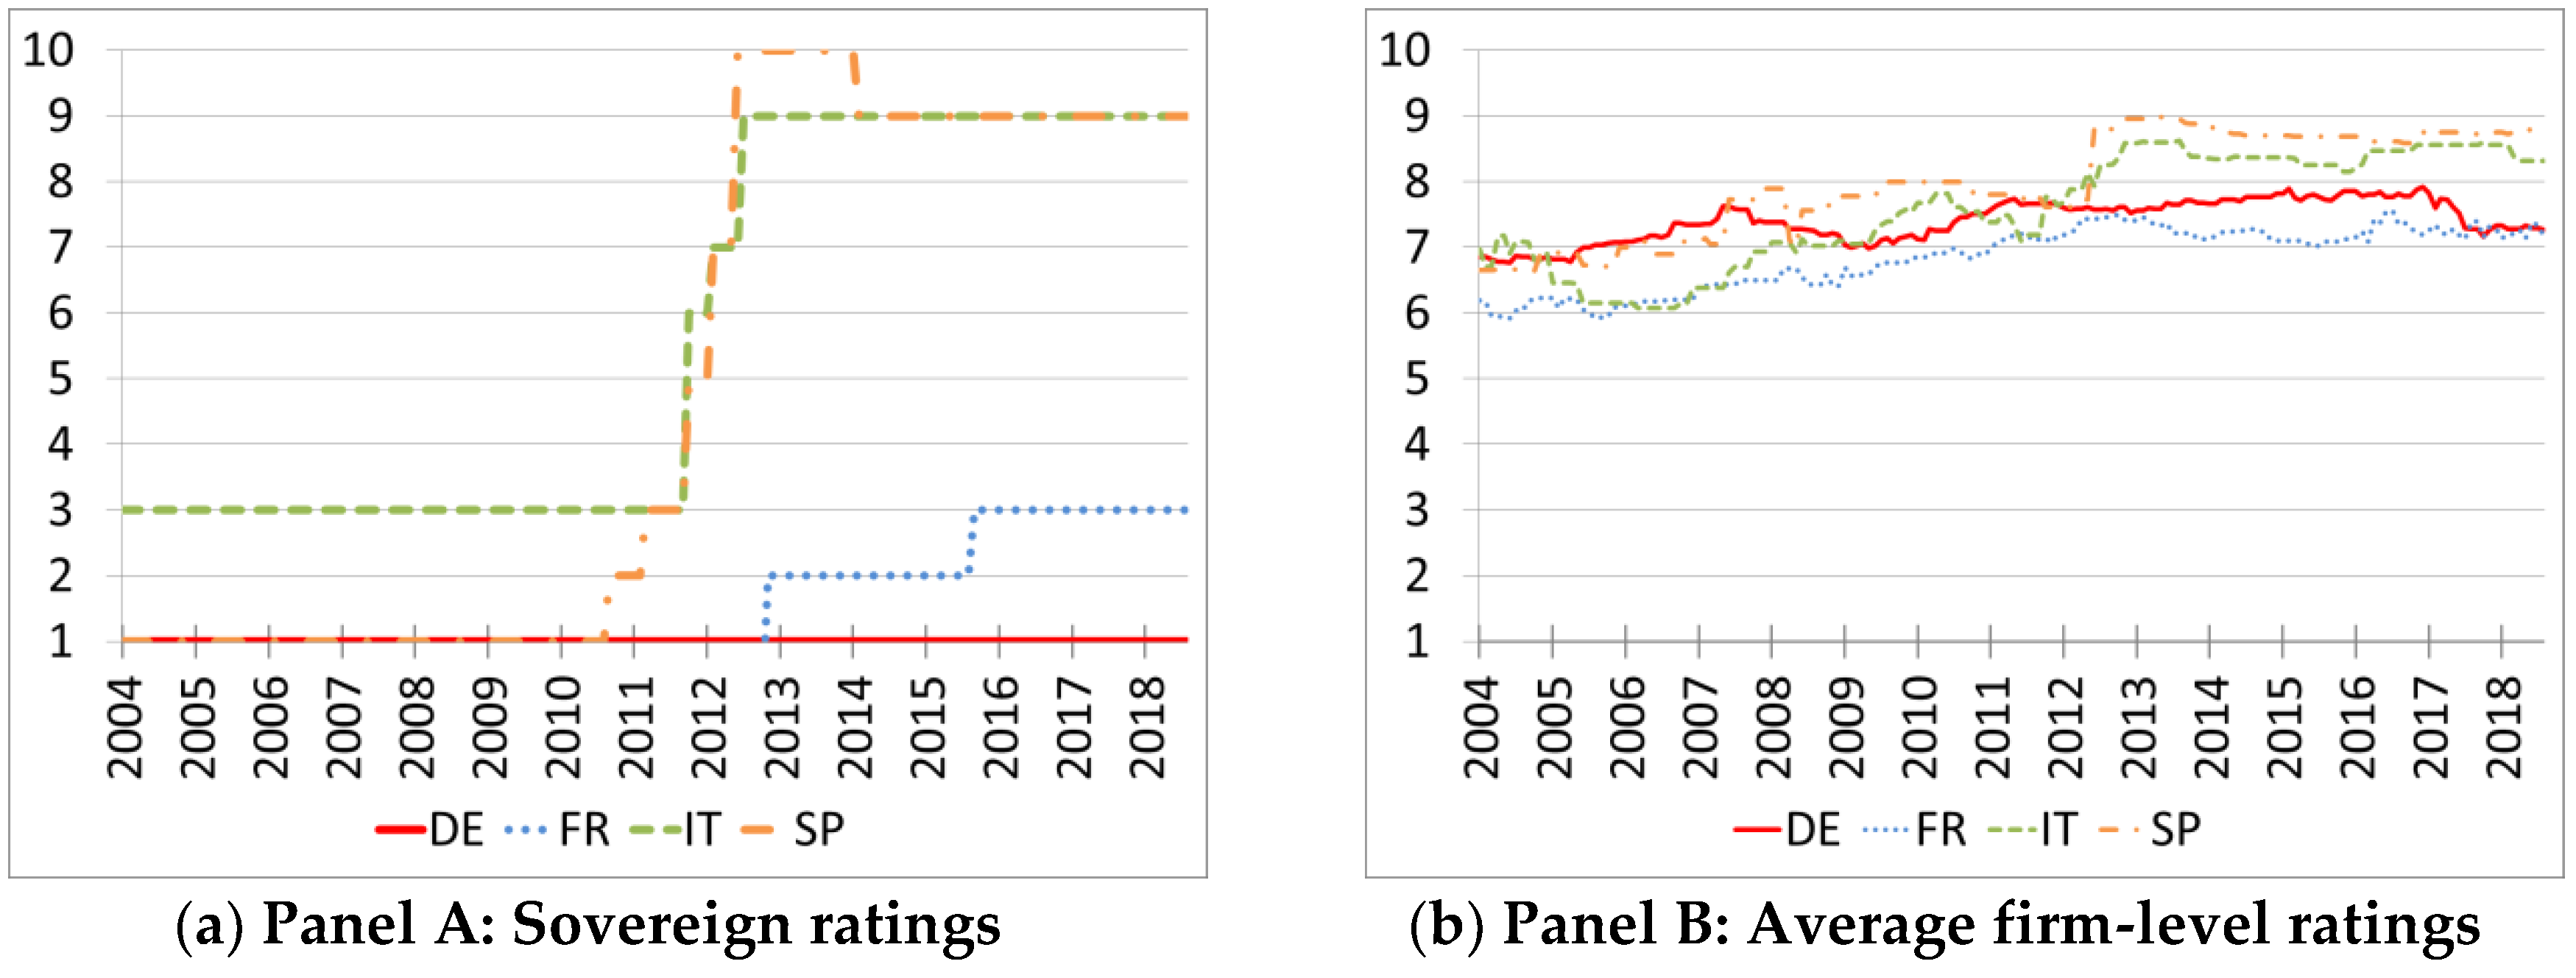
Figure 3 shows that this is rarely to be the case in our sample. Clearly, whereas sovereign and bonds series display a tendency toward more default risk, sovereign ratings deteriorate much more than security ratings. The Spanish sovereign was downgraded 9 notches, from Aaa to Baa3, over the period from 2010 to 2013, while securities issued by Spanish firms were on average downgraded by only 1 notch, from Baa1 to Baa2. A similar phenomenon can be observed in Italy. The so-called glass ceiling seems therefore fairly weak in our sample. This may be due to the abandon of such policies by the rating agencies in the early 2000s’.
Ratings in our sample are stable not only at the aggregate level but also at the security level. We show in
Table 2A that transition intensities from the current rating to another never exceed 5%.
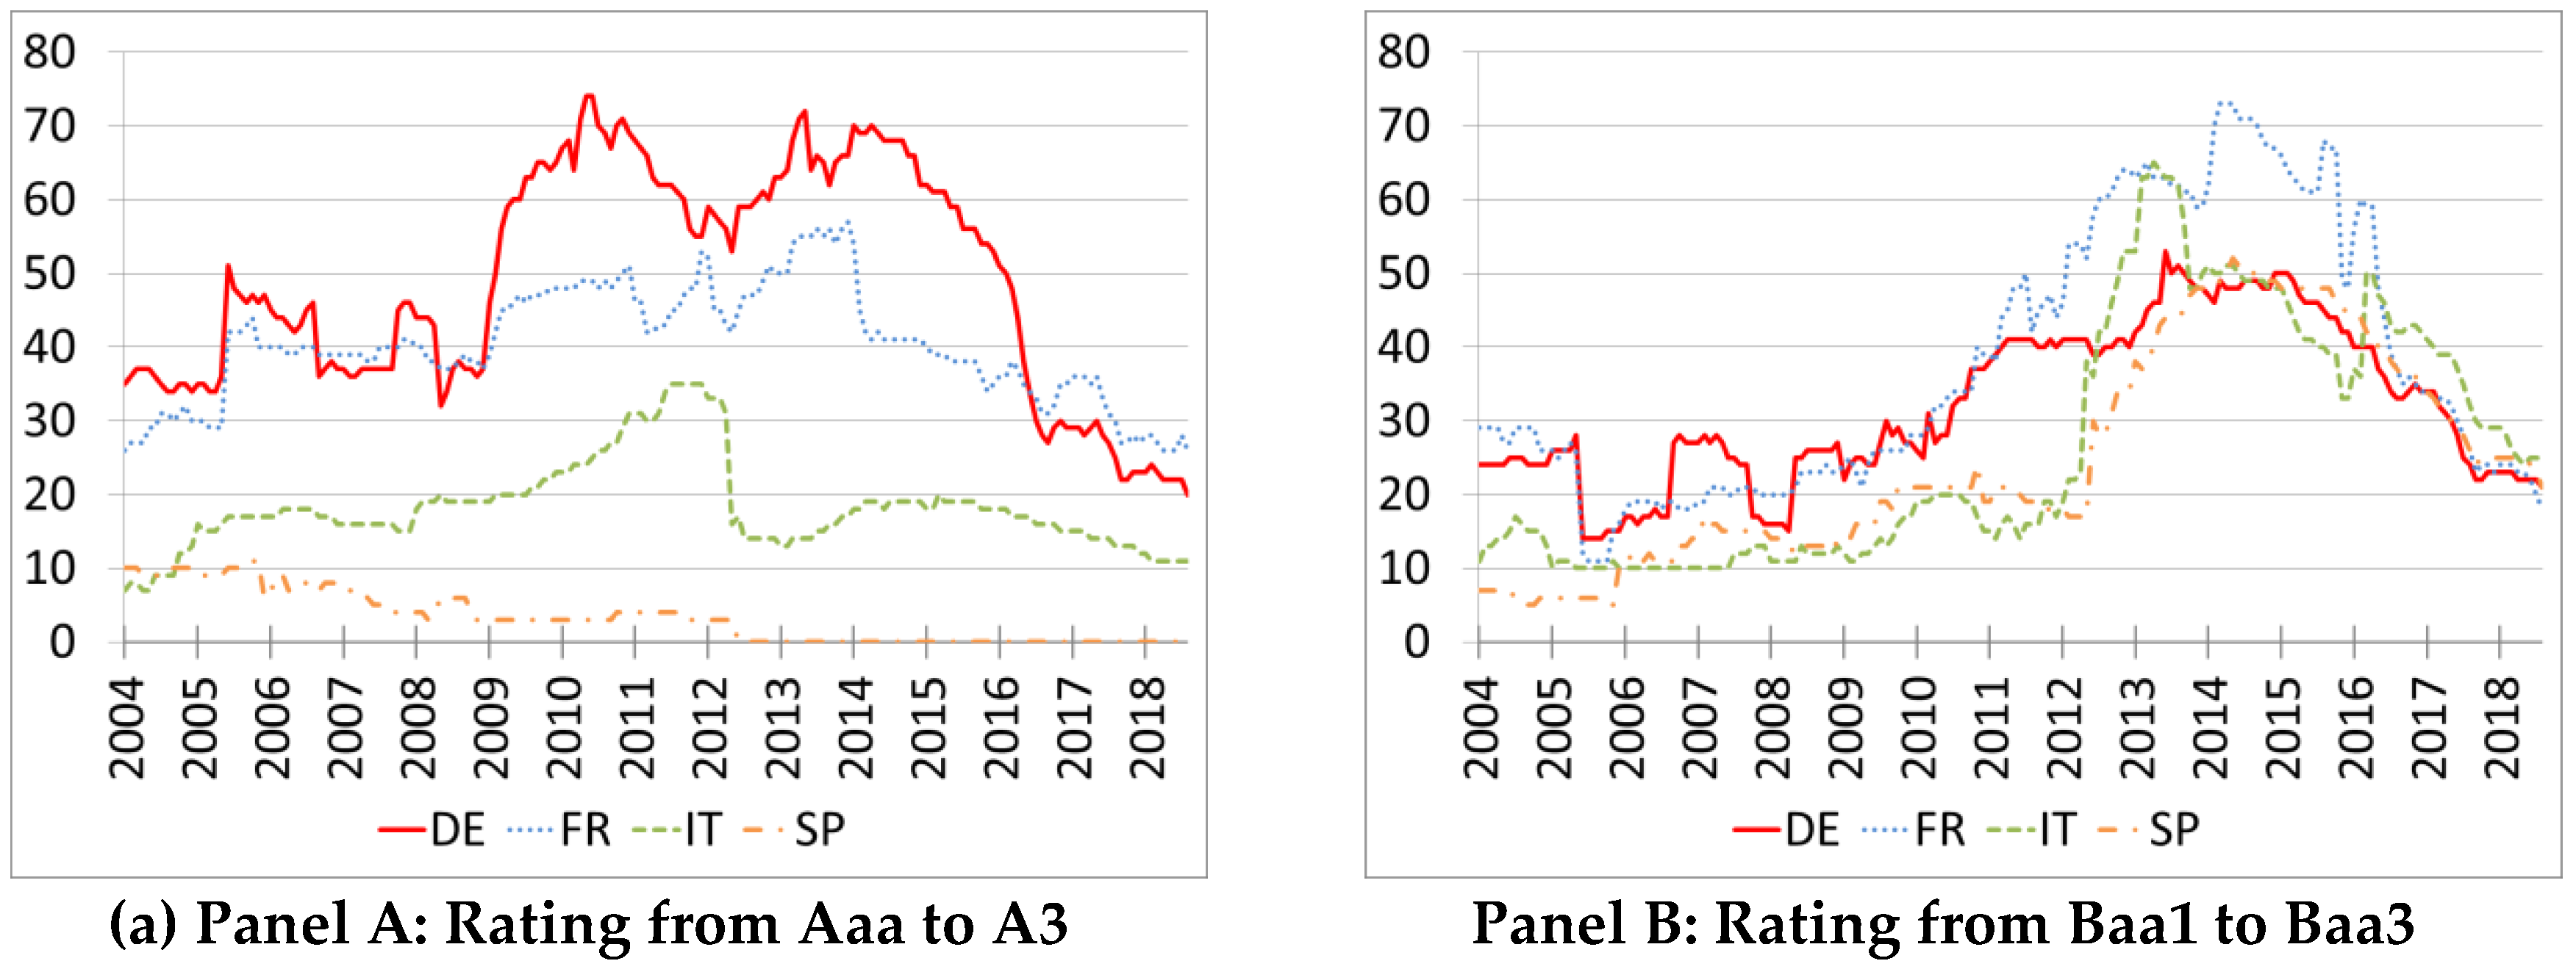
To ensure that we have a sufficient number of observations within each rating category at every point in time, we aggregated the ratings in two broad categories: a highly rated group, including all companies rated between Aaa and A3 and a lower rated group, including ratings between Baa and B3.
4 Figure 4 reports the evolution of the number of observations within each rating category. For Italy and Spain, the number of observations belonging to the group with the best rating dropped sharply in May and June 2012, which is mirrored by an increase in the group with the lowest ratings. In the case of Italy, the downgrades are magnified on
Figure 4 by the choice of the threshold at A3. The downgrades are of a relatively small magnitude on average, as can be seen on
Figure 4 but were enough to push below it many bonds which enjoyed rating of A3 or just above. Something similar occurred in France at the end of 2014. Even with these broad groups, there are no observations relative to Spain in the safest group after June 2012. The developments in 2012 notwithstanding, the transitions in and out of our two rating categories are rare (see
Table 2B). Downgrades are more likely than upgrades for bonds whose issuer parent is located in Italy (probability of an upgrade about 0.002, of a downgrade of 0.010) or Spain (probability of an upgrade lesser than 0.001, of a downgrade of 0.012).
Altogether, the rating structure is fairly stable throughout our sample.
3. Empirical Strategy
Our goal is to identify whether similar issuers in terms of risk and maturity but located in different member states pay similar or different premia. The most general specification would allow credit and term premia to vary with countries:
where
Sit is the difference between the yield to maturity of corporate bond
i and the zero coupon German Bund of equivalent maturity, as explained in the preceding section,
δi is the bond fixed effect,
is a monthly time dummy and
are dummies which identify each possible country-rating-maturity combination. In our sample, we have:
four different countries: C = {DE, FR, IT, ES};
two broad rating categories: high if the bond is rated A3 or higher and low if it is rated between Baa1 and Baa3, R = {HR, LR};
three types of maturities: short if the maturity of the bond is between 1 and 3 years, medium if it is between 3 and 6 years and long if it is more than 6 years, M = {ST, MT, LT}.
Taking a German bond with high rating and short maturity as reference, there would be a total of 23 possible combinations: {DE, FR, IT, ES} × {HR, LR} × {ST, MT, LT} \ {DE, HR, ST}. However, as discussed in the previous section and reported in
Table 1, many of these combinations involve only a few observations and sometimes no observation at all. This implies that the coefficients of some of the dummies would be at best poorly identified.
We therefore impose the following identification assumptions:
credit risk premia are identical across countries;
durations risk premia are identical across countries;
credit, country and durations risk premia are separable.
The resulting specification becomes:
where
is associated to a set of country dummies identifying bonds issued by corporates residing in France, Italy or Spain (
),
to dummies identifying lower rated bonds (
) and
to dummies for bonds with medium or long durations (
). The reference bond spread estimated by the intercept
δt is a German bond with high rating and short maturity. Fixed effects capture bond characteristics that are constant over time. This includes characteristics such as the amount issued or the coupon rate, which are often used as liquidity proxies in the cross-section.
It is easy to see that the default risk of a bond in this specification is fully captured by , which is independent of the country. Allowing for different country specific risk premia for a given probability of default would amount to allow for arbitrage opportunities. To see it, consider the spread of an Italian medium-term bond i with a low rating. This would be δt + δIT,t + δLR,t + δMD,t + δi, while a high rating bond would instead be δt + δIT,t + δMD,t + δi’ .The difference in yields between the two bonds is of δLR,t + (δi − δi’) and reflects only differences in bond-level default risk. If the same computation would lead to a different premium in another country, then one could engage in contracts buying the cheapest bond and selling the most expansive one to generate profit without taking any risk.
Our main object of interest is the estimated coefficient , which can be interpreted as the additional cost that non-German corporations have to pay compared to their German counterparts with similar risk profiles. Risk profiles are characterized here by both the observed and unobserved characteristics. In an integrated euro area, wide financial market and provided our risk controls are comprehensive, the country specific time fixed effects should not be significantly different from zero.
We estimate the above panel regression with the within estimator, that uses variations in the explanatory variables over time. Standard errors are clustered at the issuer level.
4. Main Results
This section presents the estimates of our main model and introduces our corporate bond market fragmentation index for the euro area. We report in the figures the estimated quantities at monthly frequency, together with the associated 95% confidence intervals derived from standard errors clustered at the level of the bond. We first report three main sets of results, the credit risk premia, the term spread and the country risk premia. We then introduce our corporate bond market fragmentation index.
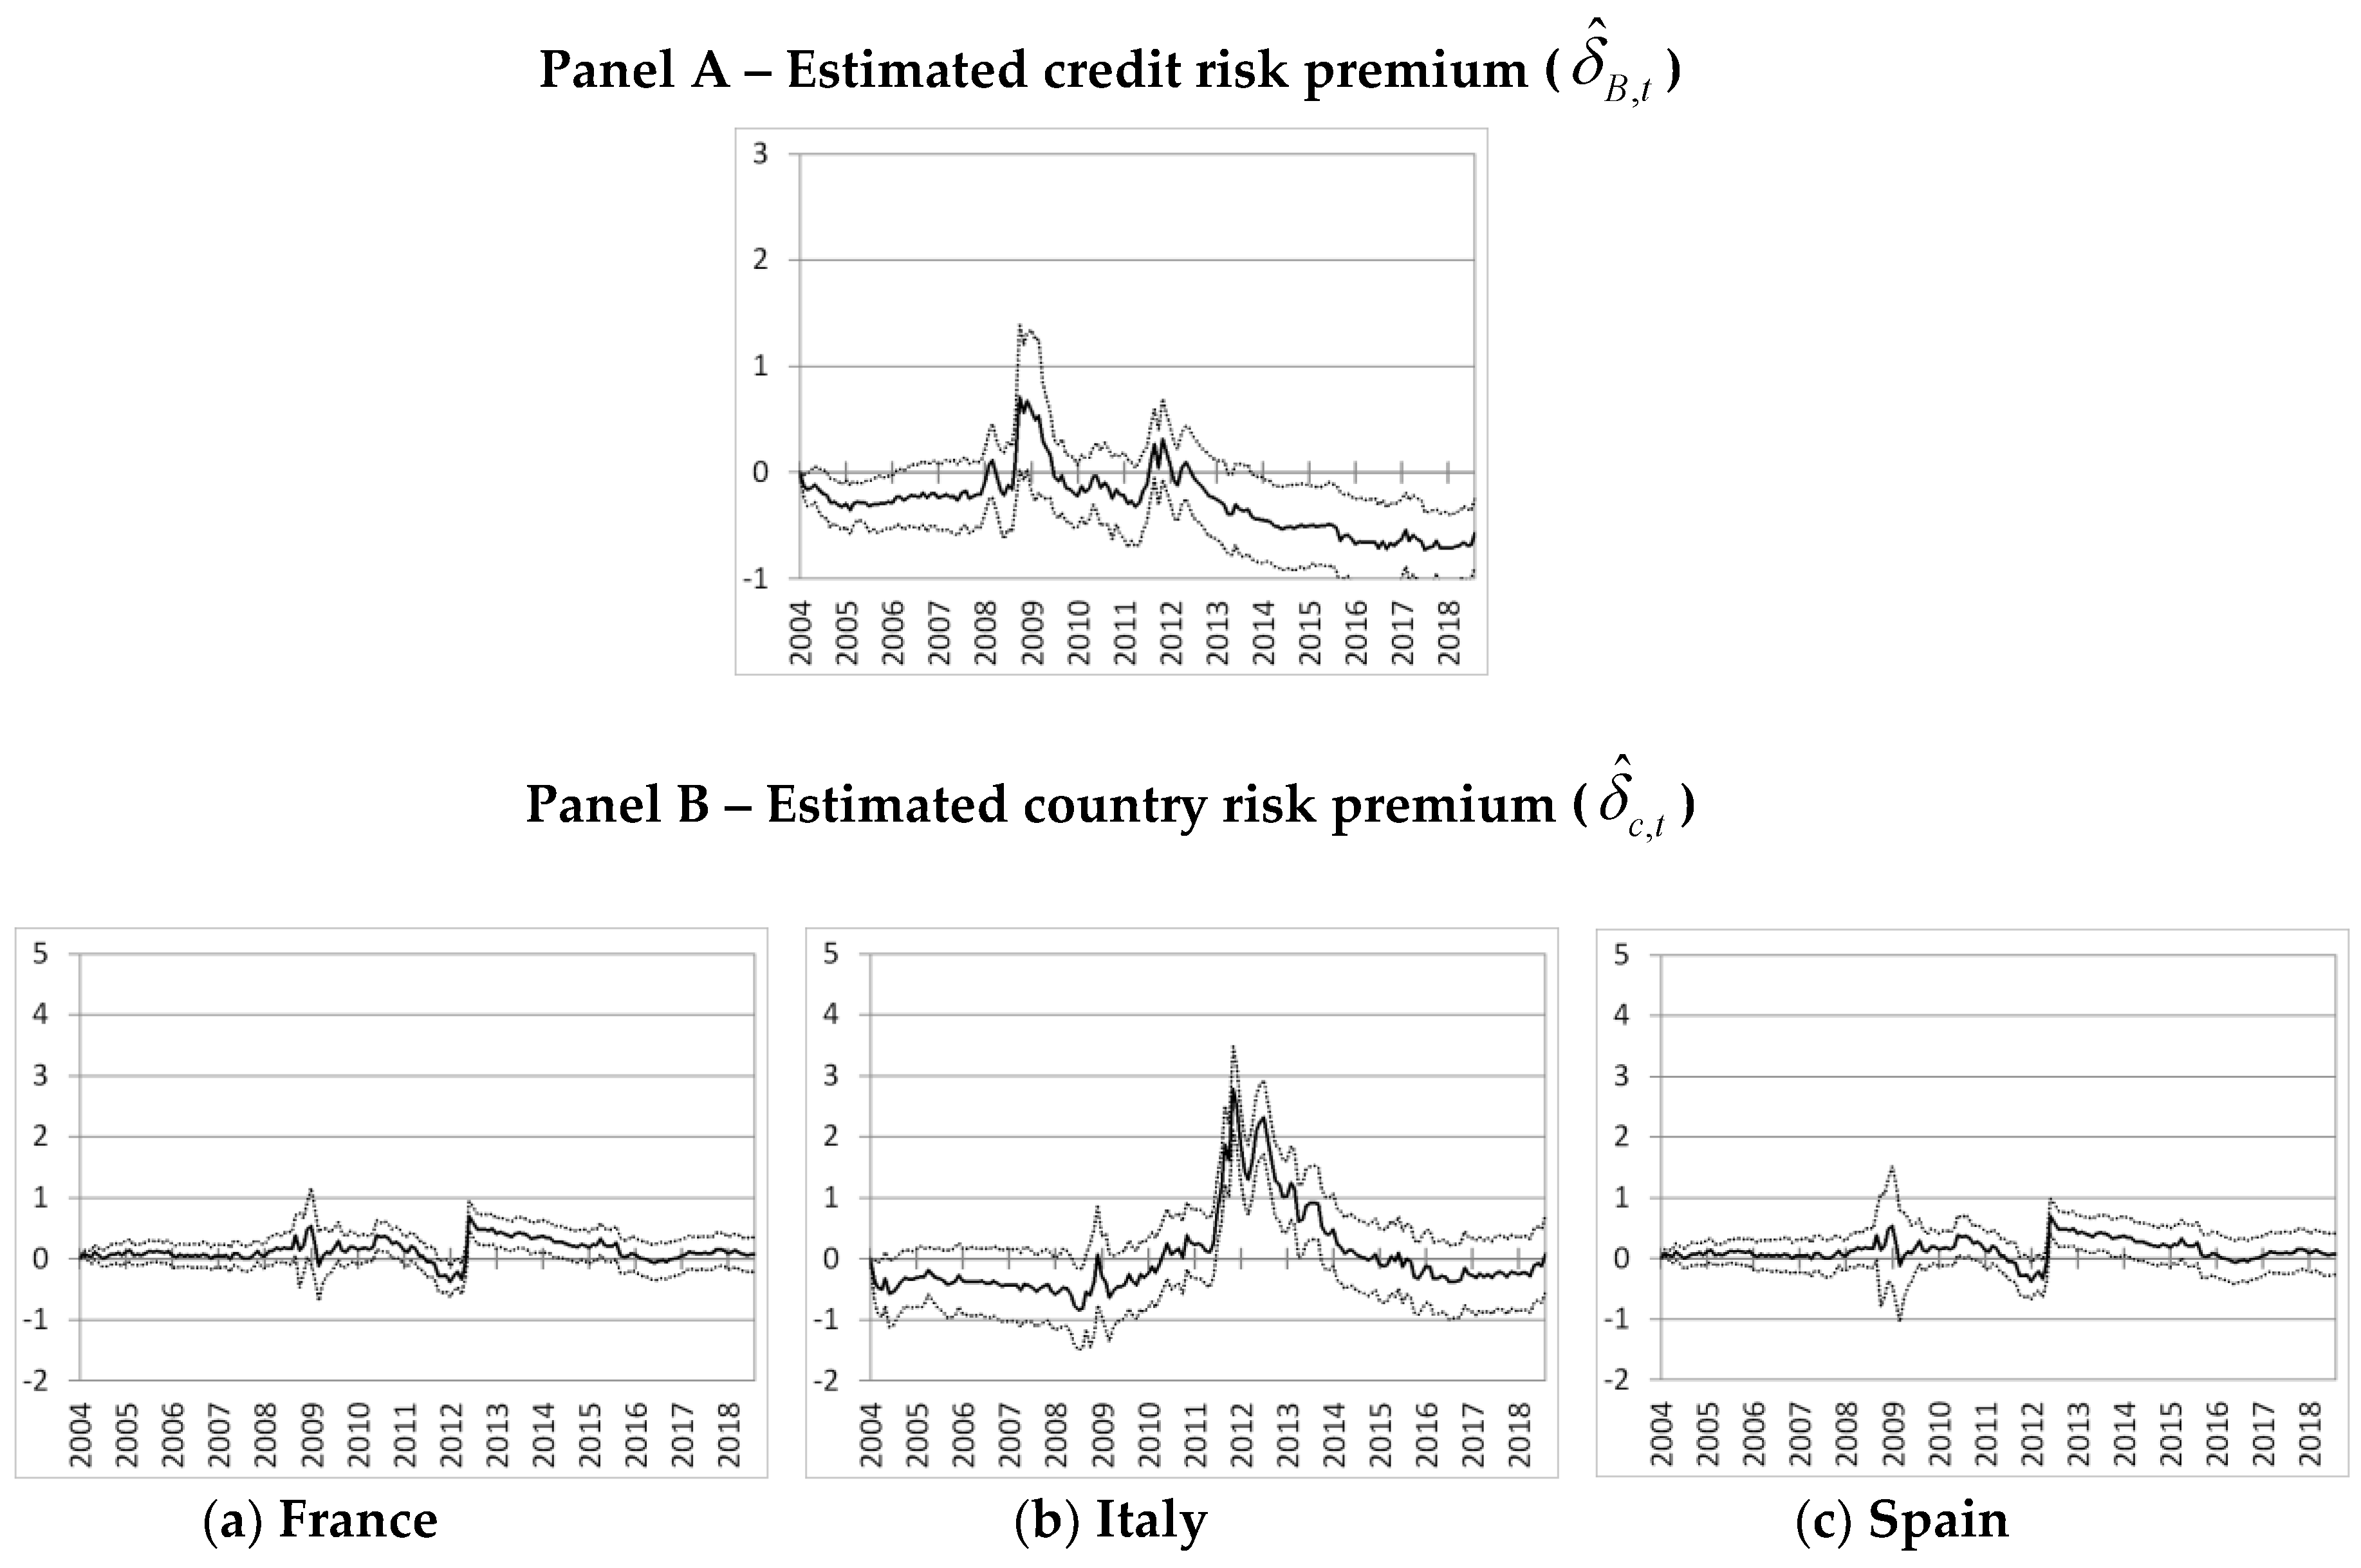
4.1. Credit Risk Premia
Credit risk premia are measured by
δLR,t., which depend only on the difference in the default probabilities among the two rating categories defined in
Section 2.3.
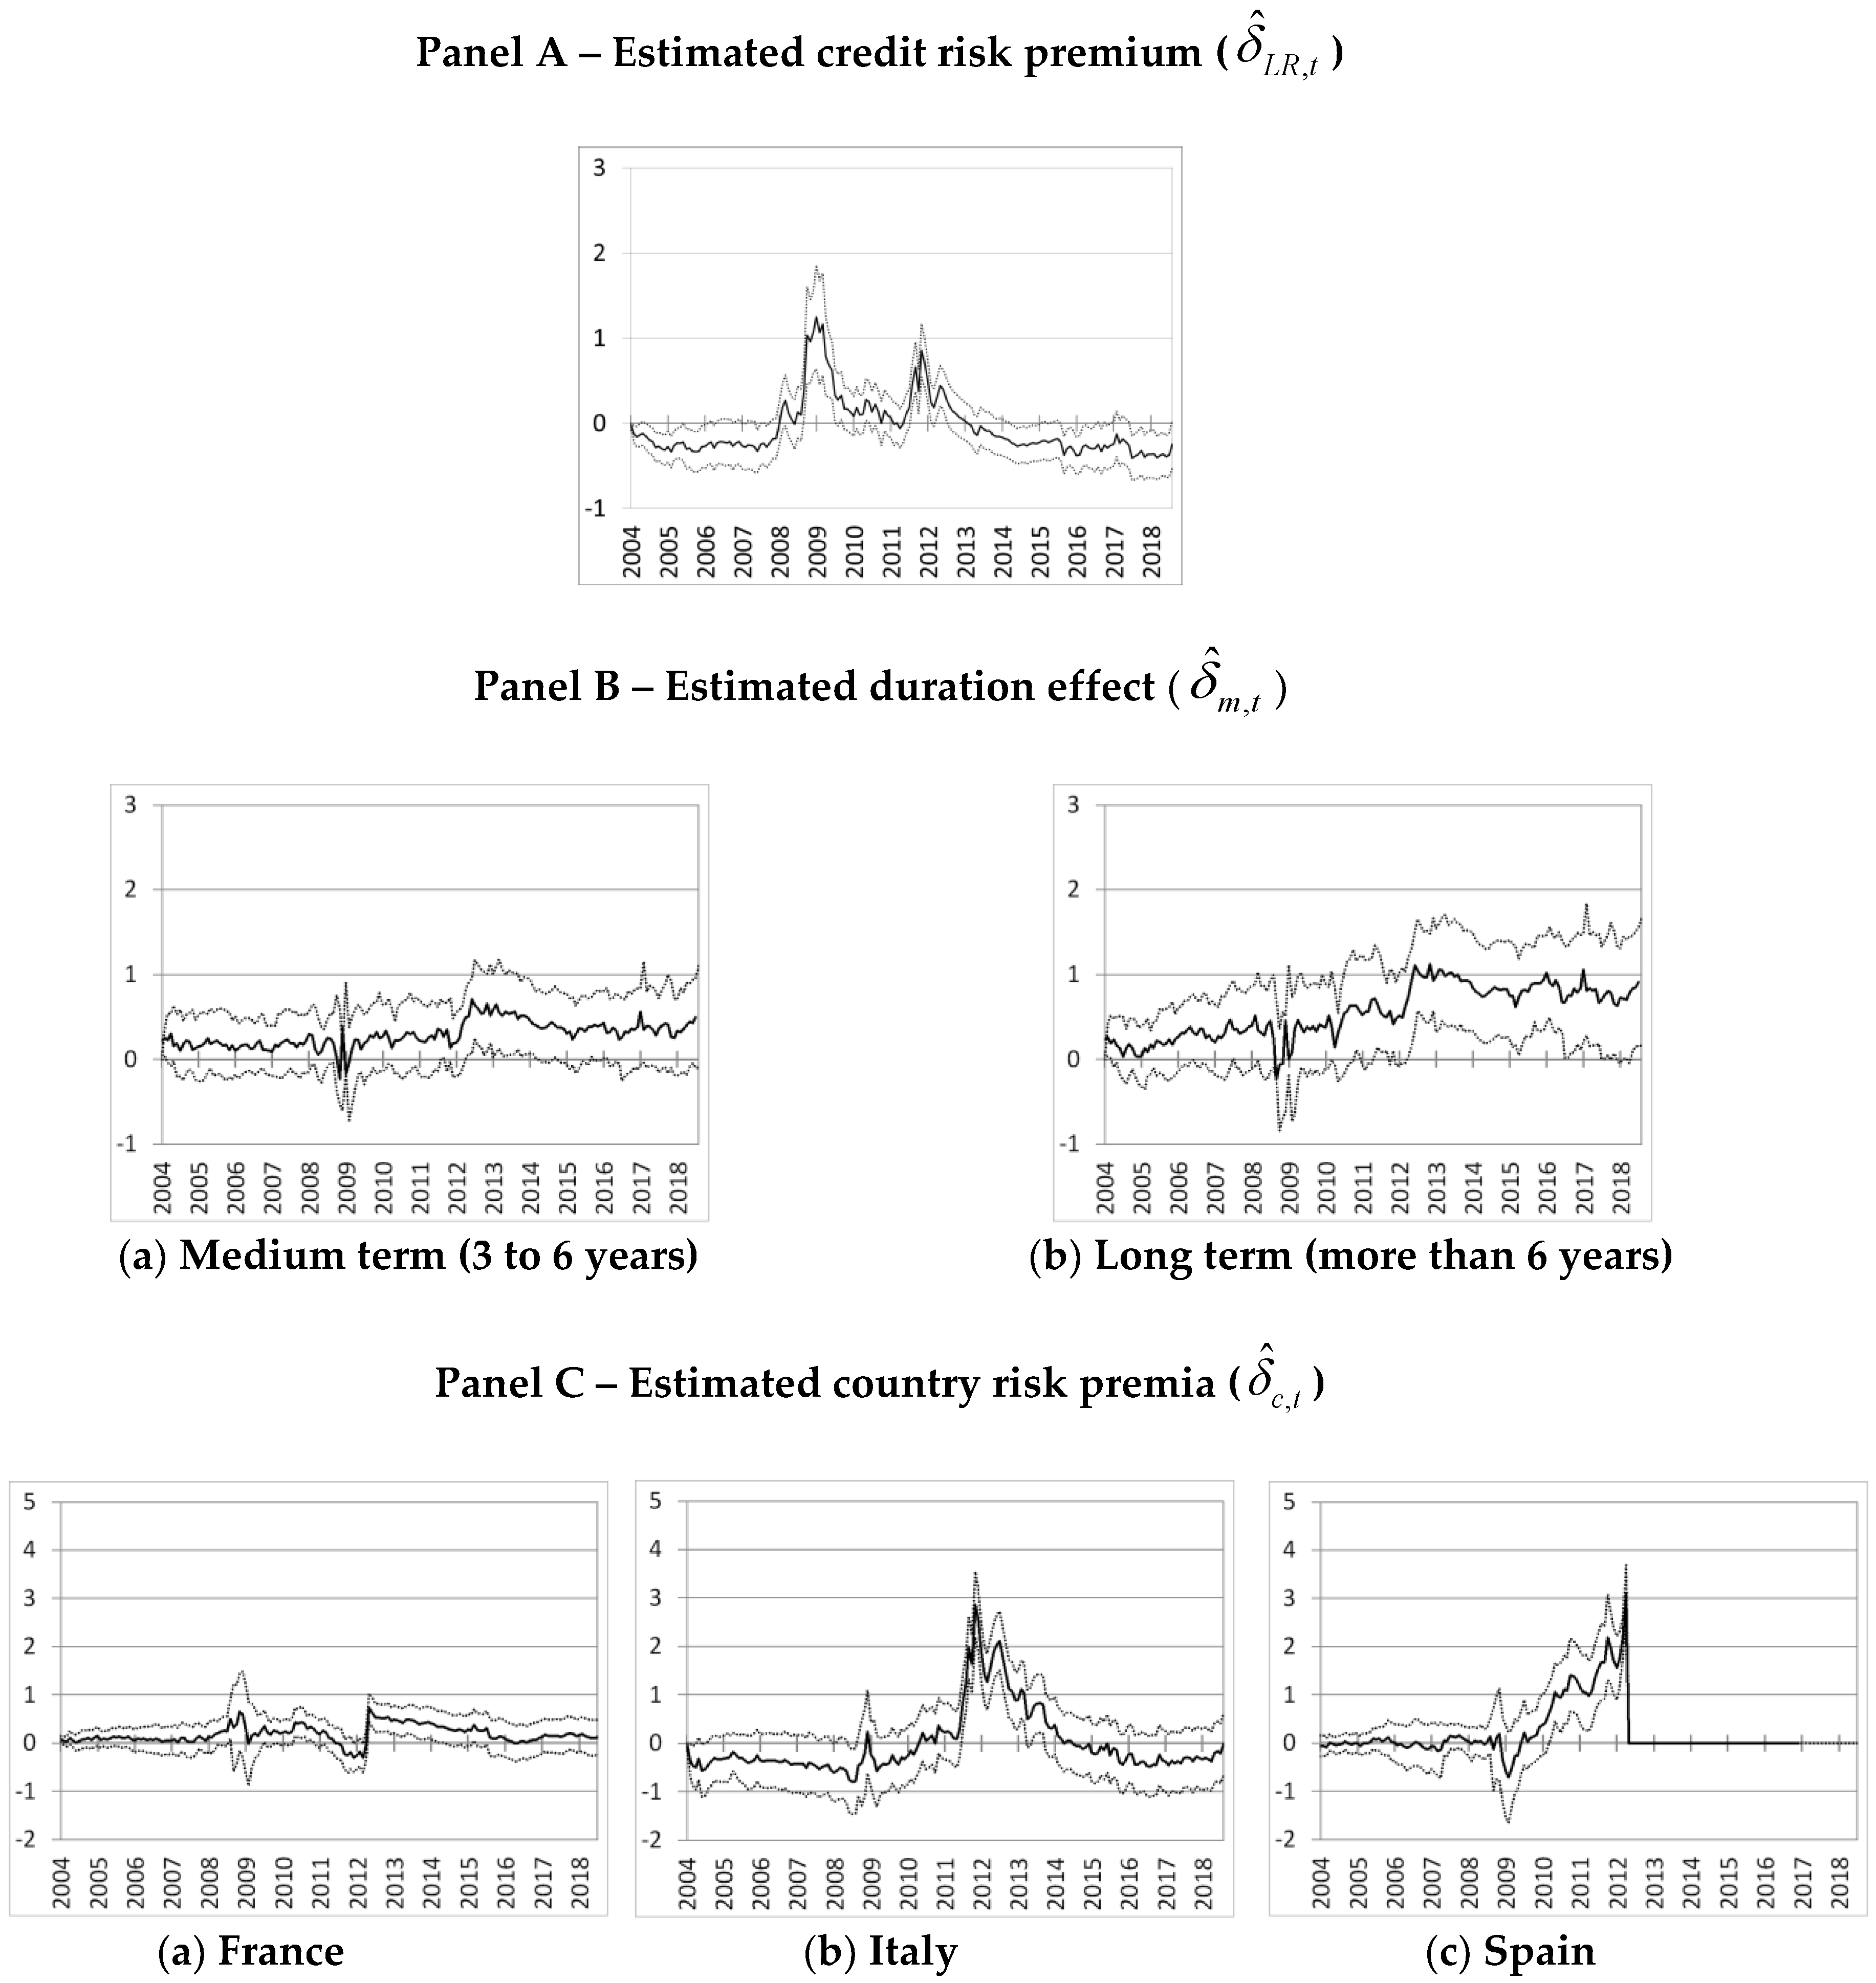
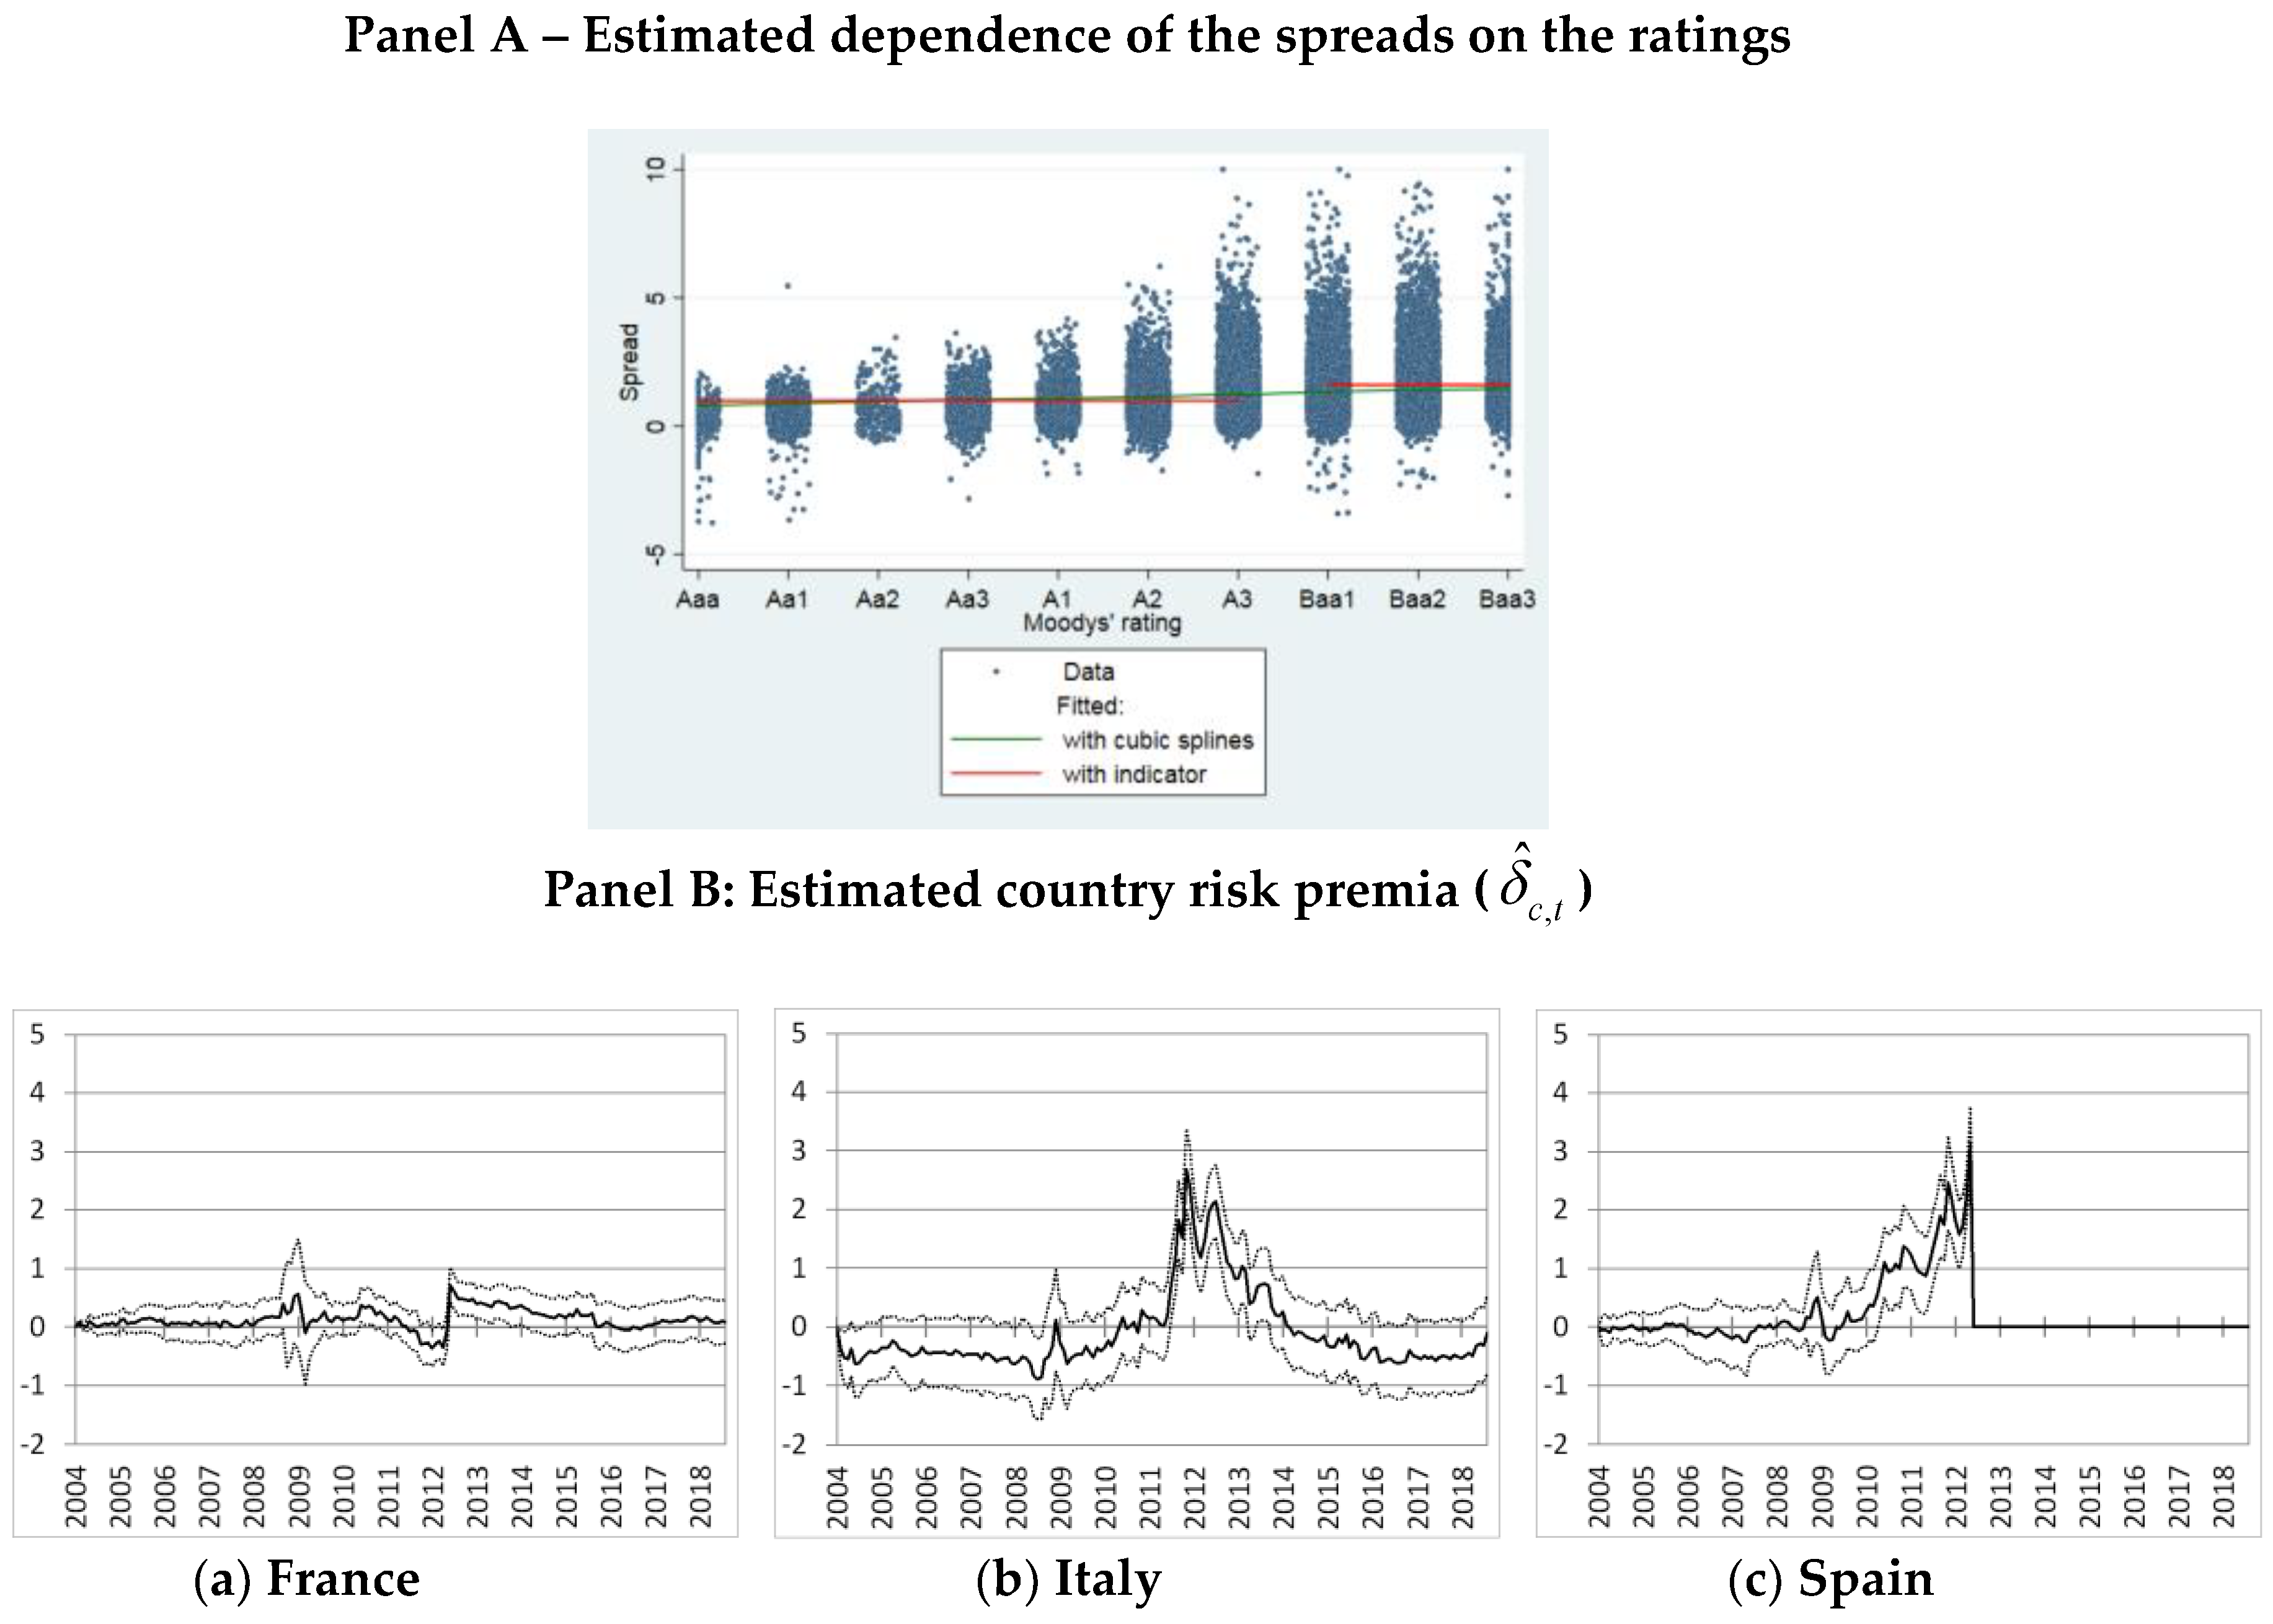
Figure 5, panel A, plots the evolutions of the estimated credit risk premia, which are normalized at 0 at their beginning in January 2004.
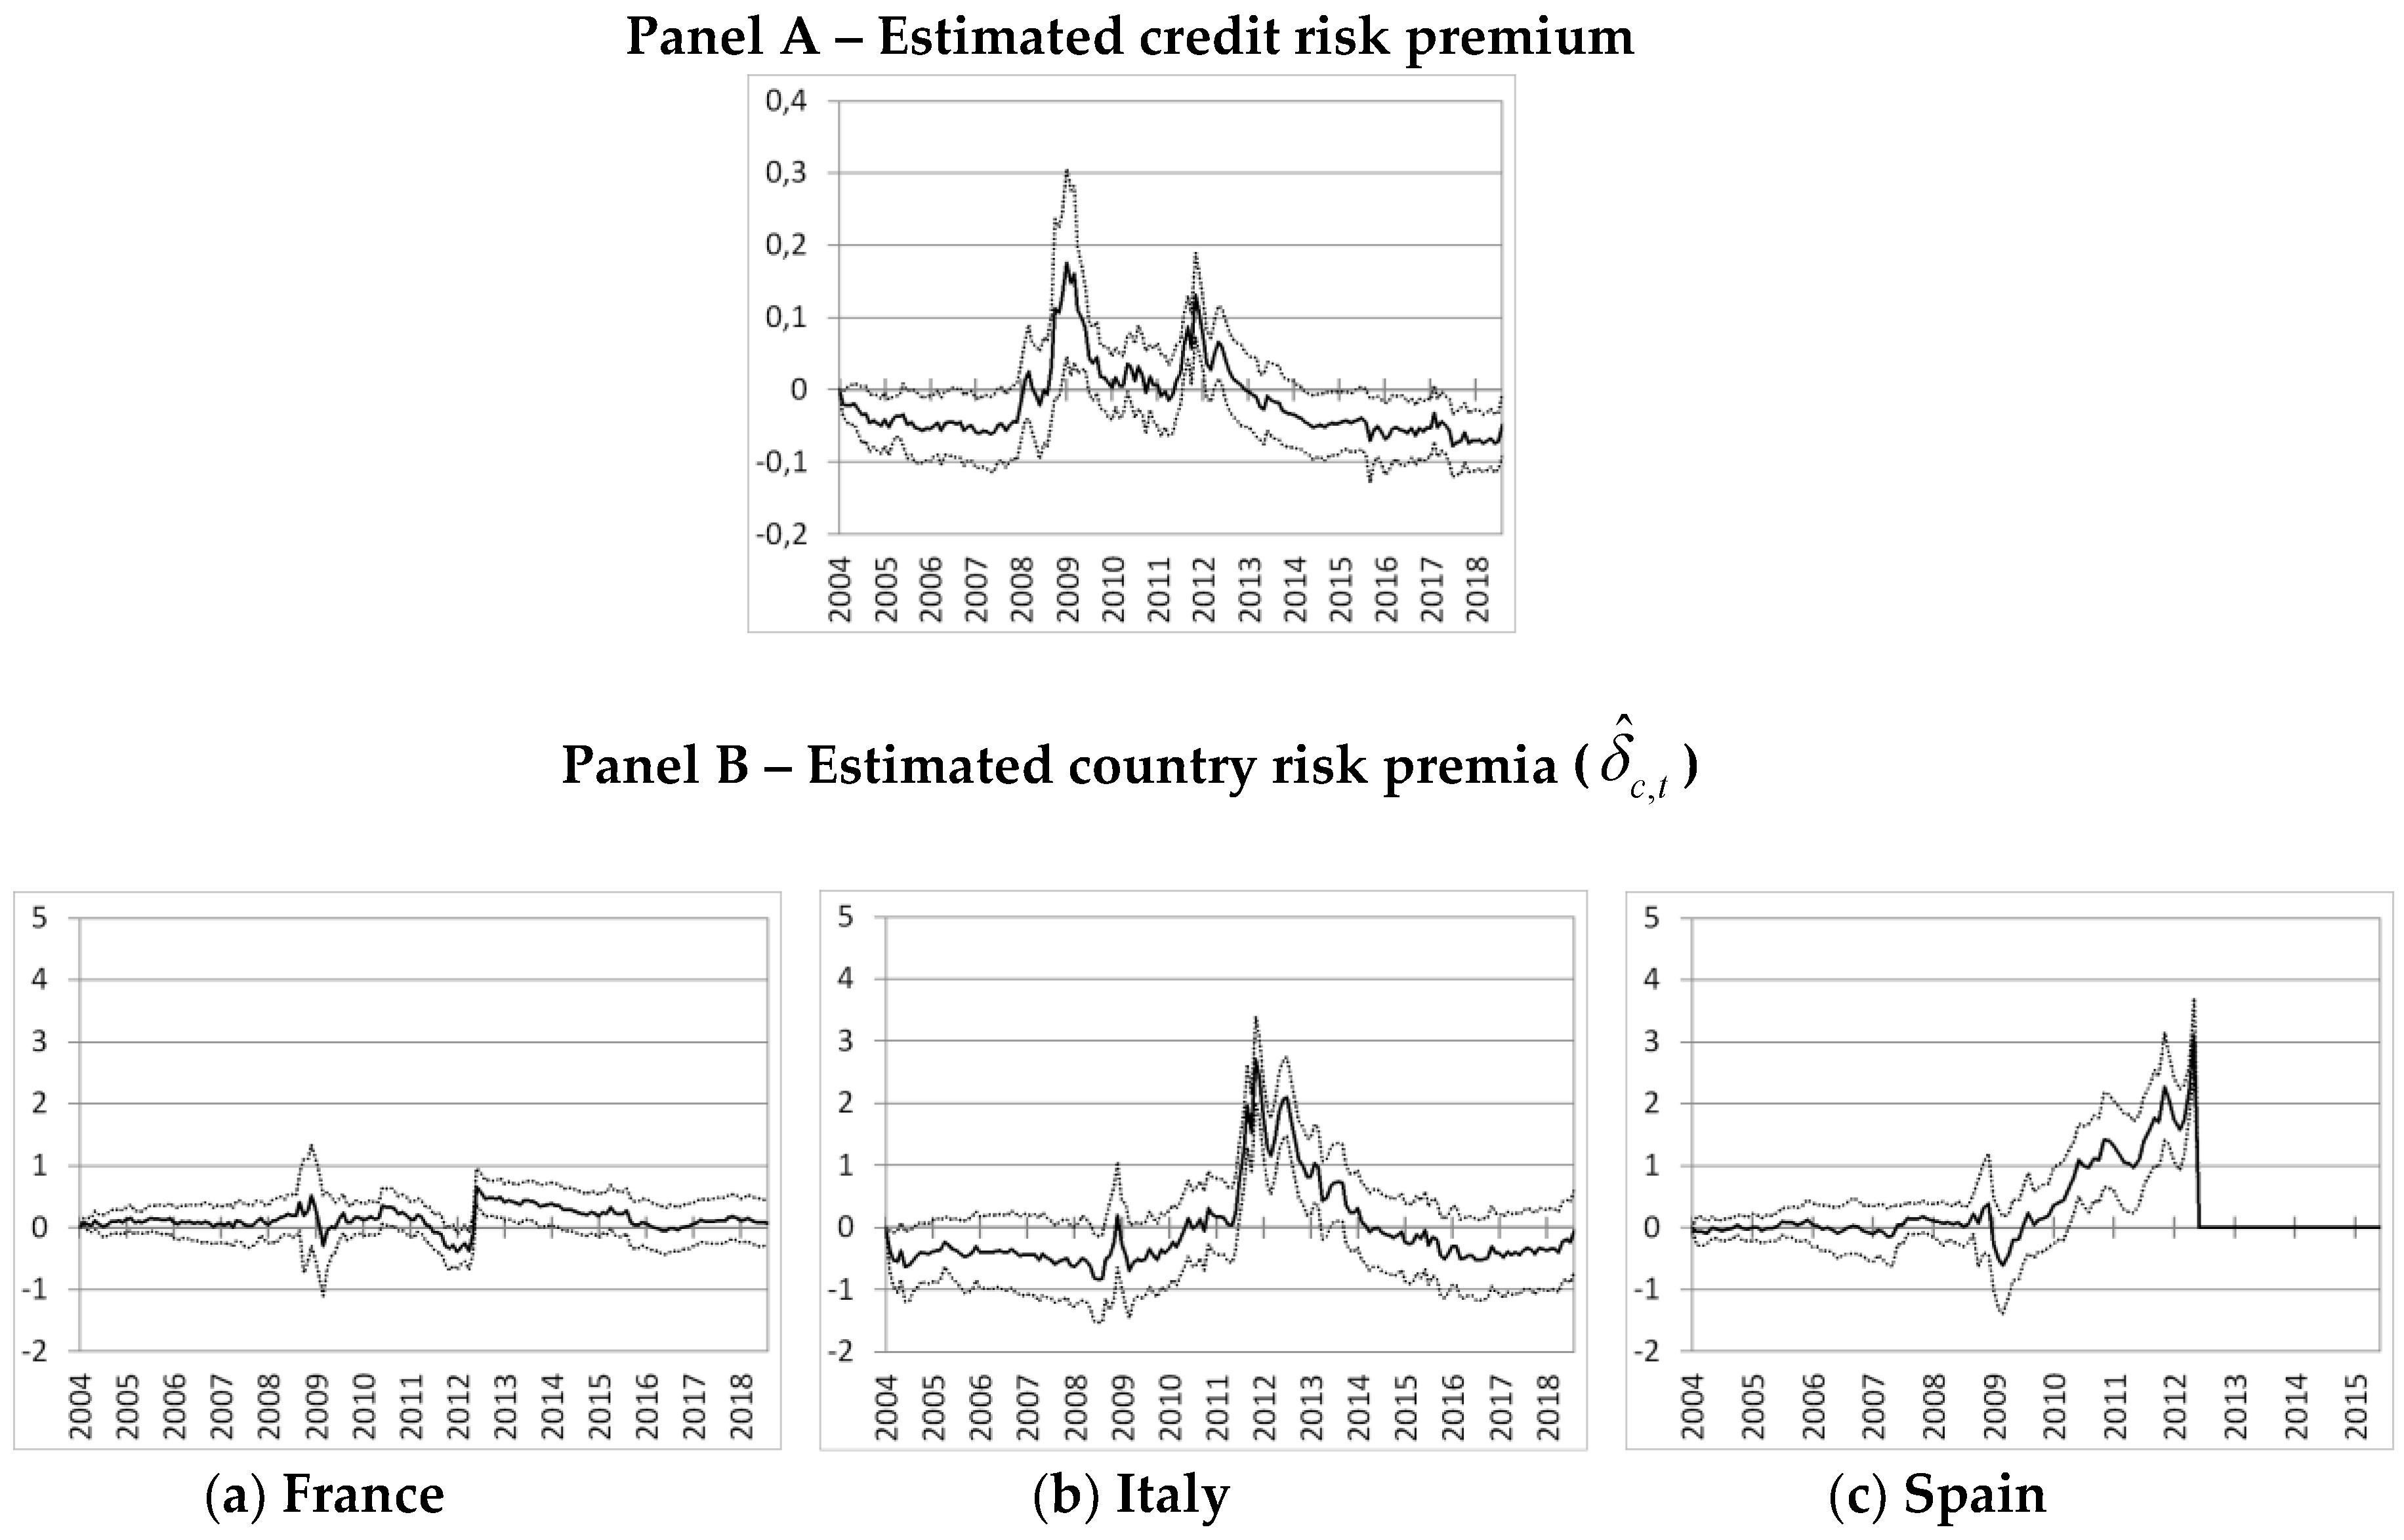
Credit risk premia started to increase in the first months of 2008, suggesting that a substantial re-pricing of risk was already under way before the Lehman default. Credit risk premia reached their peak in the aftermath of the Lehman bankruptcy, at more than 120 basis points above their level of January 2004. There was a second peak at the end of 2011, associated with the euro area sovereign debt crisis. However, this second peak is, at about 70 basis points more than the level of January 2004, much smaller than the one observed at the end of 2008. The decrease in the risk premia since summer 2012 indicates that the yields on securities rated from Aaa to A3 gets closer to those on bonds rated from Baa1 to Baa3. Since 2014, the credit risk premia are stable and close to the levels achieved before the 2008 financial crisis. No specific variations are observed in January or March 2015, dates at which the European QE has been announced and implemented.
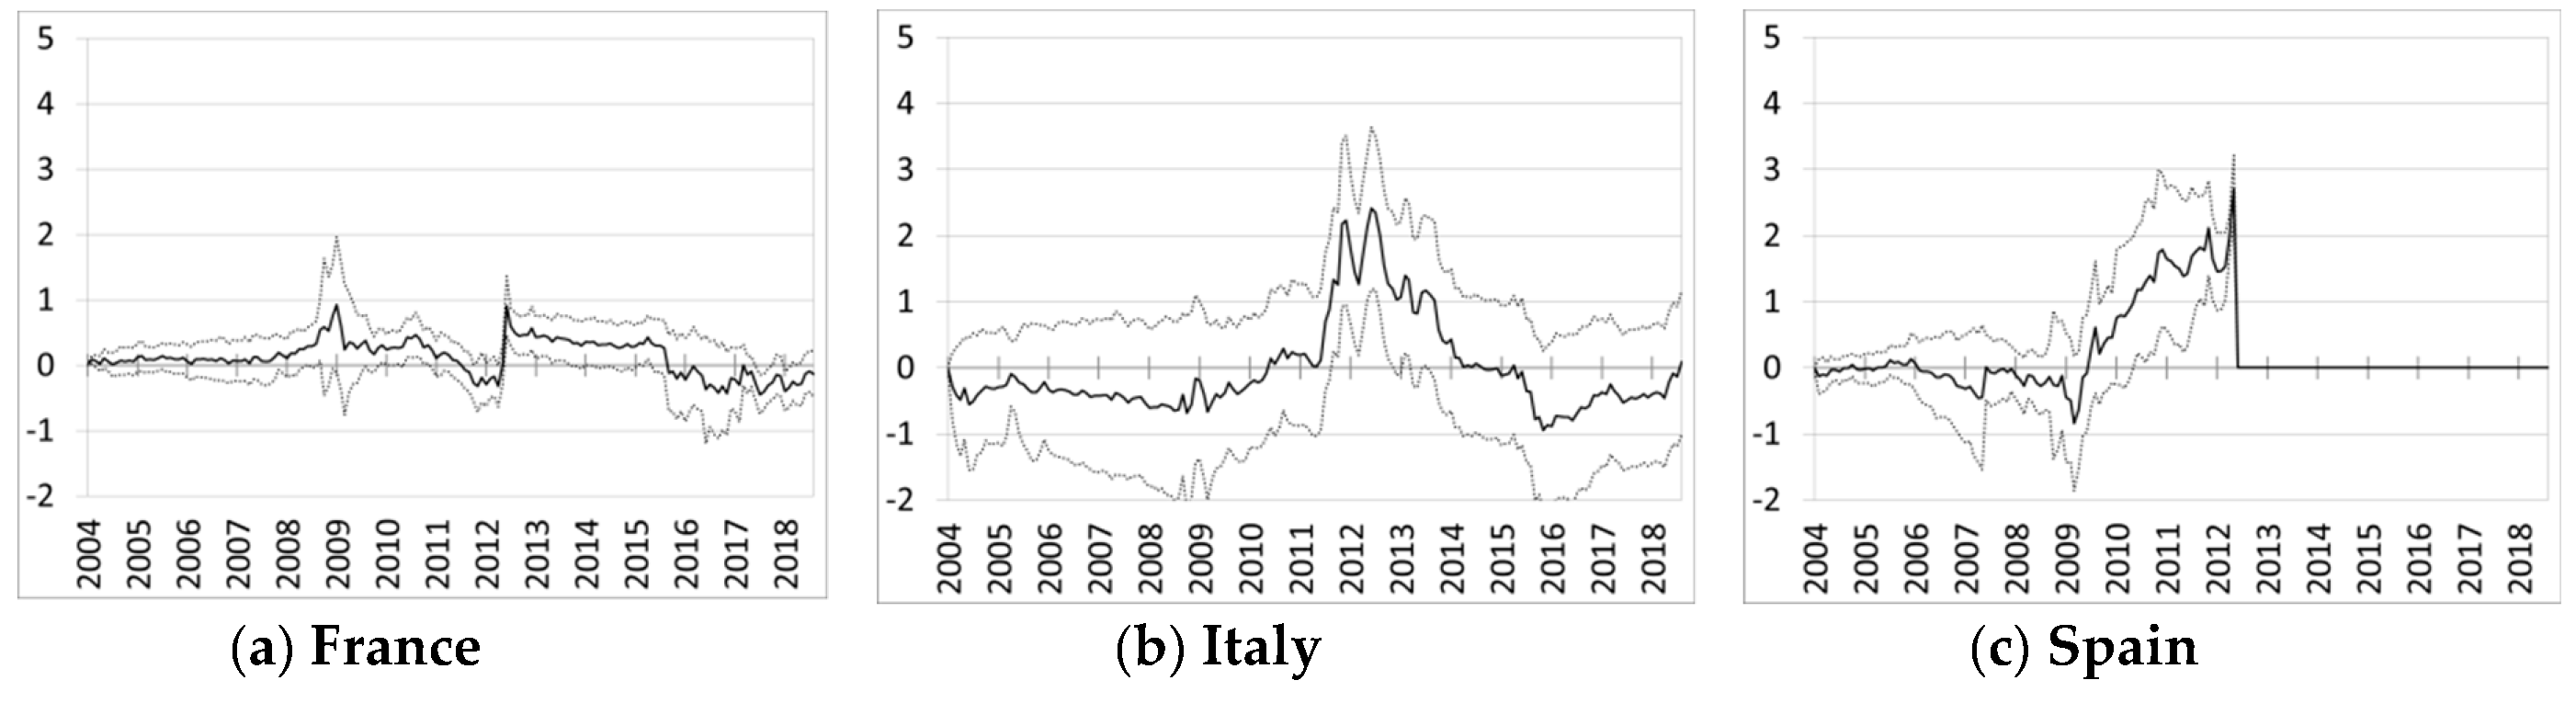
4.2. Maturity Structure
We now turn to the maturity structure of credit risk
5. We divide bonds in three categories with maturity of, 1 to 3 years, 3 to 6 years and more than 6 years.
Figure 5, panel B, plots the evolution of difference in yields with respect to the 1 to 3 years, that is specific to corporate bonds term structure. These differences have remained relatively stable around zero well into the crisis. The striking development revealed by the estimation is the substantial increases during the first half of 2012, especially for bonds of maturity superior to 6 years. Since the yield curve of the German sovereign remain quite stable at that time, this result indicates a steepening in the yield curve of corporate bonds relative to the yield curve of risk-free securities. It may in particular reflect the impact of 3 years Long Term Refinancing Operations (LTROs thereafter)
6 put in place on the first quarter of 2012 and the Outright Monetary Transactions (OMTs thereafter)
7, which would target bonds with maturity up to 3 years, announced in September 2012.
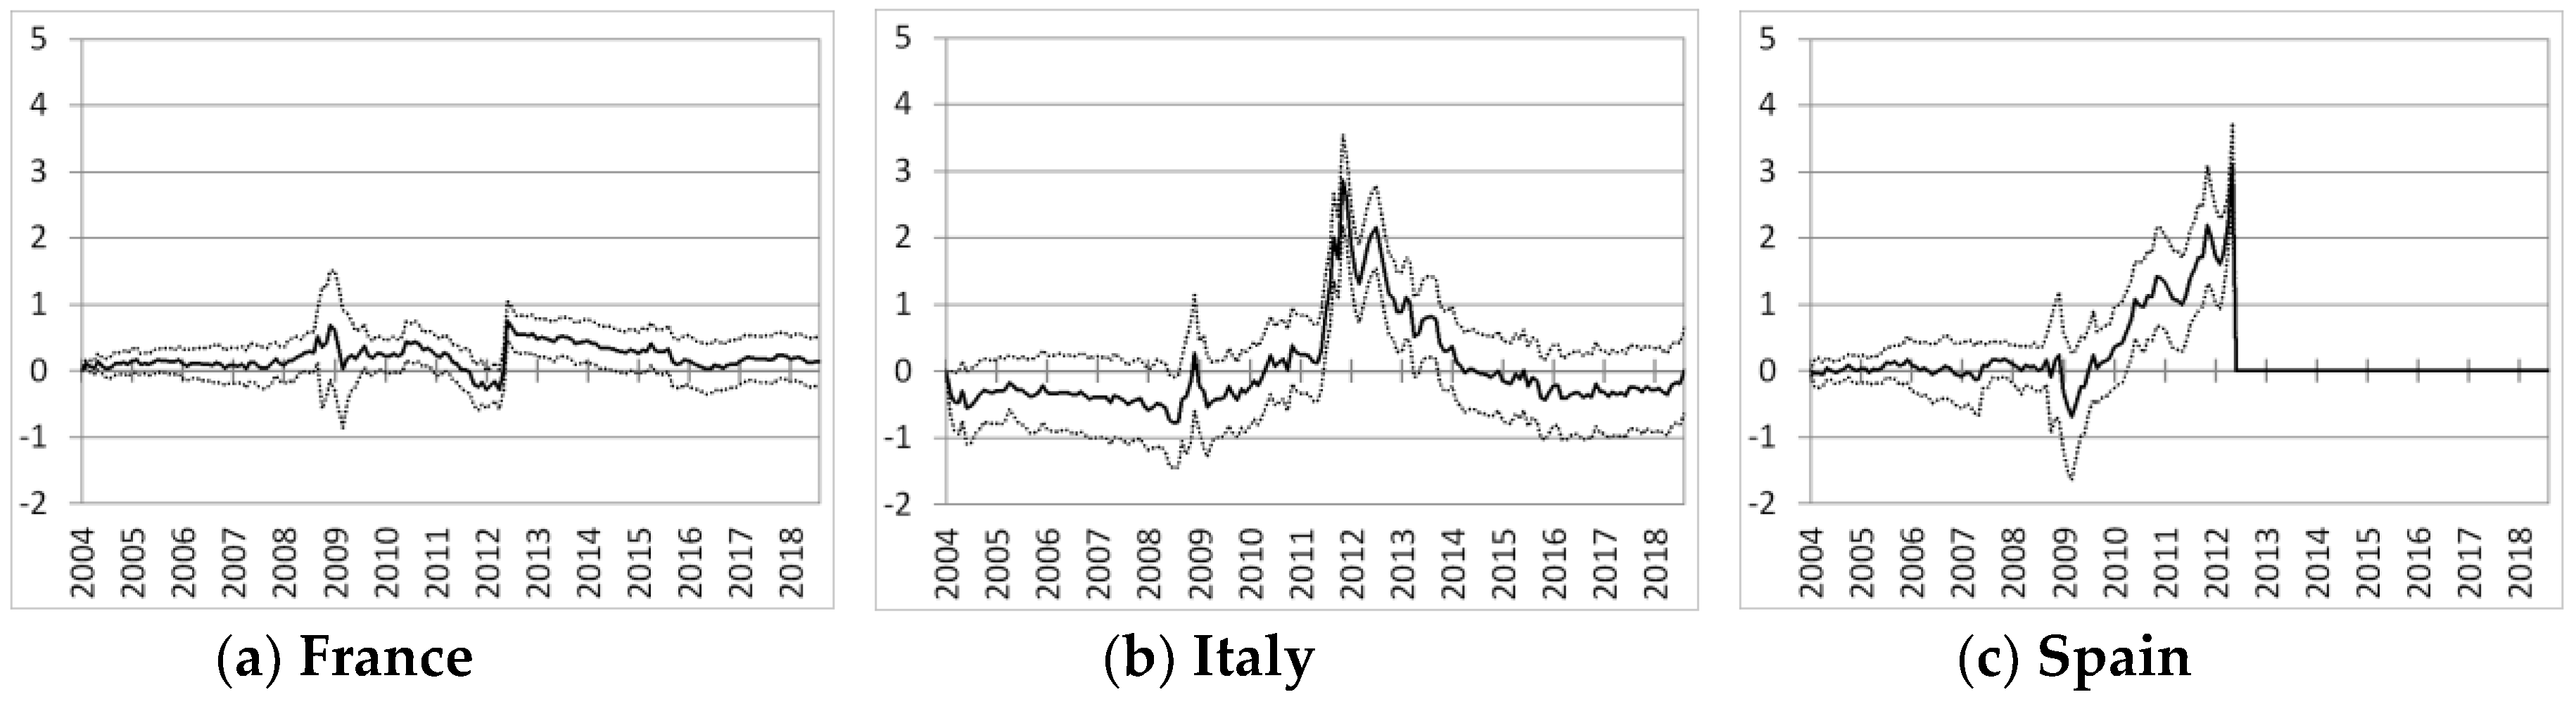
4.3. Country Risk Premia
The coefficient associated with the country dummy represents our main measure of financial fragmentation. Fragmentation was not an issue in 2004 and we set January 2004 as a reference for financial integration in our estimates. The charts in
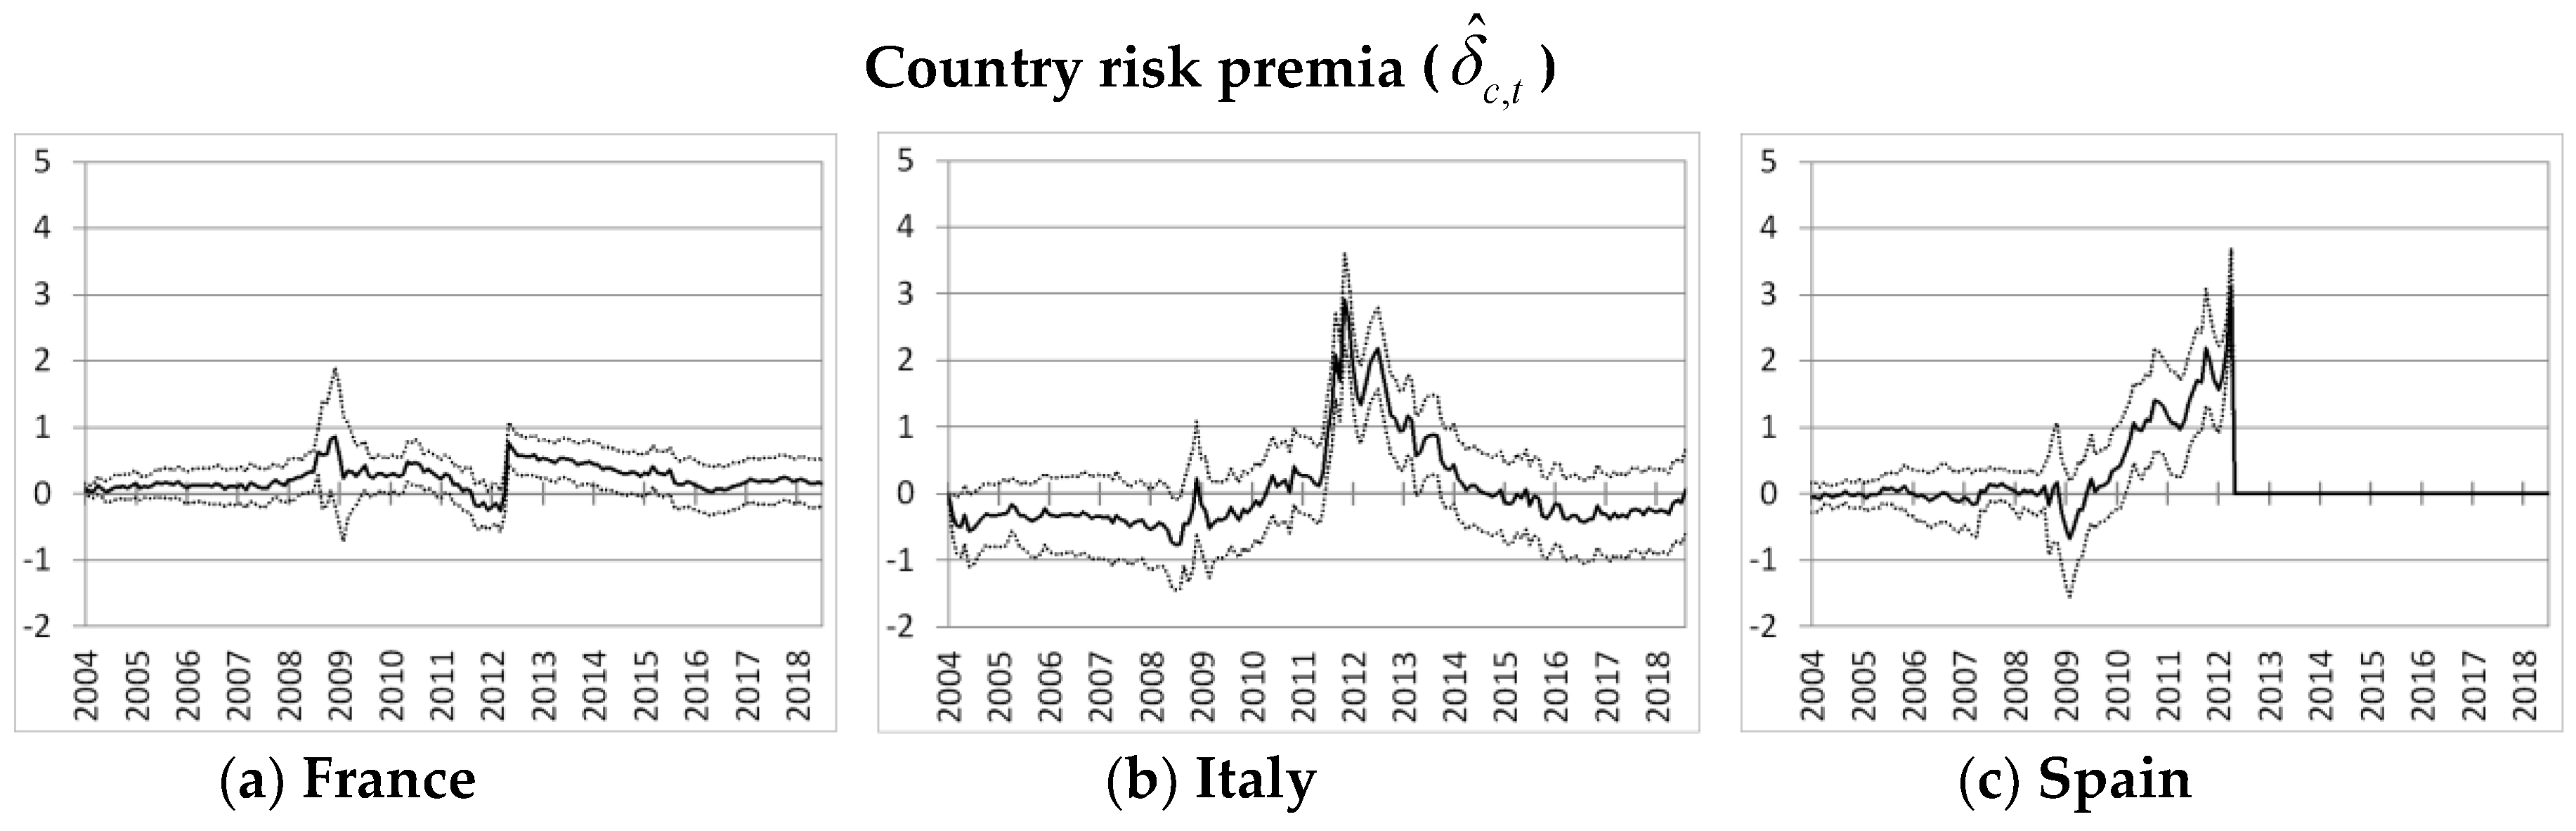
Figure 5, panel C, show that country risk premia did not differ from zero until 2010. That is, even after the start of the financial crisis, following the Lehman Brothers default in September 2008. Sizable country risk premia started to be priced for Italy and Spain (but not for France), only at the start of the euro area sovereign debt crisis in 2010. The observed country risk premia peaked at more than 180 basis points for Italy and at 300 basis points for Spain, during Summer 2012. There is a noticeable decline after the famous “whatever it takes” speech by Mario Draghi on July 2012 and the following announcement of the OMT program by the ECB in September 2012. It is also interesting to notice that according to our measure, there was no major sign of fragmentation for French non-financial corporate bonds. Finally, it is the country risk premia and not the credit risk that dominate spread during sovereign debt crisis. At that time, Italian and Spanish corporates were penalized by the rising defiance of investors toward their sovereign if compared to German and French firms of similar maturity and default risk.
Towards the end of the sample, in August 2018, the country coefficients for Italy have dropped close to pre-sovereign crisis level. Issuers located in Italy face however a progressive increase of their premia, of about 15 bp compared to 2017, since the beginning of 2018. Altogether, financial fragmentation has receded substantially with respect to 2012 and 2013.
4.4. A Corporate Bond Market Fragmentation Index
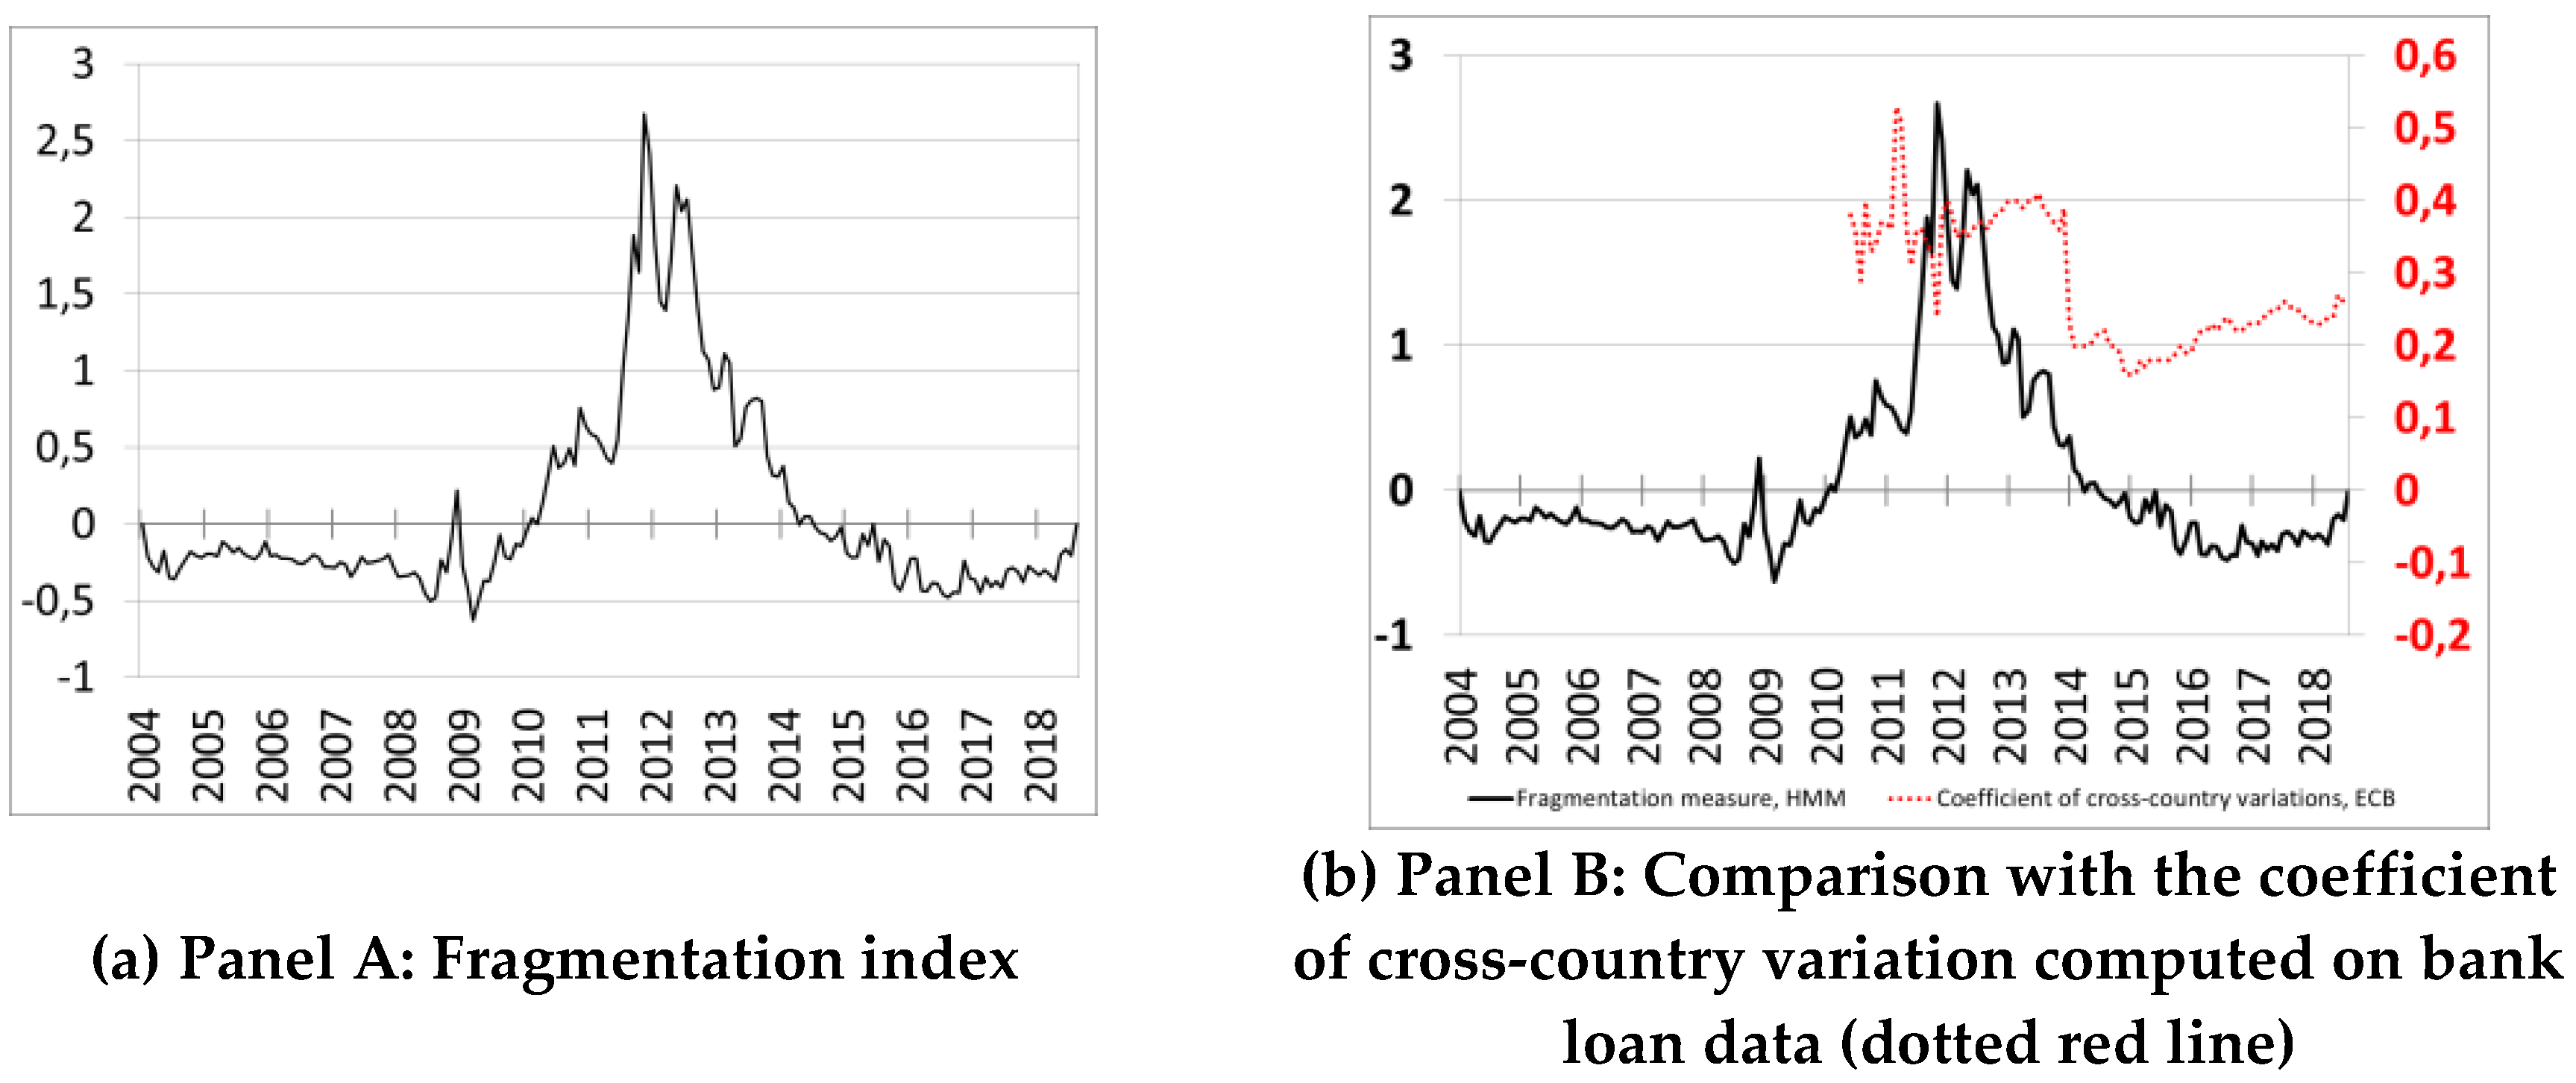
So as to as measure the gap in the yields between similar issuers located either in Germany or in a stressed country such as Italy or Spain, we derive a synthetic index of corporate bond market fragmentation as the average of the country premia for Italy and Spain, as described in
Section 4.3.
8 It is interpreted as the additional yield to maturity required by the market for a bond issued by a firm located in Italy or Spain, compared to a bond with the same rating category and the same residual maturity whose issuer is located in Germany.
9 Figure 6 shows the index (Panel A) and compares it to an alternative measure of fragmentation which is constructed by the ECB (Panel B).
Financial fragmentation has remained negligible until 2010 when the sovereign debt crisis began. The Greek budget deficit was subject to large corrections in October 2009 and the Greek sovereign bonds were downgraded to “junk” status in April 2010. By early 2010, corporate bond markets in Italy and Spain showed signs of contagion that ultimately peaked in summer 2012. It is only after the announcement of the OMTs that fragmentation receded. It reached the pre-crisis levels only in 2014.
Figure 6 also reports the dispersion of bank interest rates on new loans to NFCs (Panel B). It is the ratio of the cross-country standard deviation of bank interest rates on new loans divided by their average level.
10 Both fragmentation indices highlight the increase in the heterogeneity across funding costs from mid-2011. However, our measure which directly reflects market sentiment, peaked in mid-2012 and decrease afterward. The ECB indicator, which reflects self-reported interest rates bank loans, peaked in 2013 and showed a much more gradual decline. This suggests at least that the effects of fragmentation on the cost of issuing corporate debt securities receded much faster. It also indicates that Italian and Spanish firms that are too small to issue bonds are more likely to have suffered from financial fragmentation much longer.
6. Conclusions
This article uses corporate bond markets to assess the fragmentation of the euro area financial markets. We decompose yields of non-financial corporate bonds to disentangle country-specific premia from other observable determinants of risk. We examine the performance of our approach under various changes in the modelling strategy and provide simple measure of financial fragmentation.
Financial fragmentation in the corporate bond market began in the first half of 2010 at the start of the sovereign debt crisis. The fragmentation peaked in 2011 and 2012. It receded gradually following the OMT in September 2012. Our results show that the large changes in the country premia over 2011–2012 were driven by differences in the expectations of a sovereign default rather than by changes in corporate issuer fundamentals, such as their creditworthiness. Because high sovereign interest rates increase their debt burden, sovereign default probabilities go in the same direction than sovereign funding costs. This may lead to multiple equilibria, one equilibria with both a low sovereign funding cost and a low probability of default and a second equilibria with both a high sovereign funding cost and a high probability of default (
Calvo 1988). From this point of view, the OMTs are a success to the extent that their announcement removed the self-fulfilling expectations that could have led some Euro area countries to the adverse equilibrium.
These results show clear evidence that the European sovereign debt crisis has reversed the process of financial integration in the Euro area. Bondholders asked the Italian and Spanish issuer to pay a significant premium with respect to their German (and to a lesser extent French) counterparts to hold their bonds, even if they display similar risk profiles (including default probability).
Our results confirm that the sovereign debt crisis has introduced heterogeneity in the transmission of monetary policy in the euro area. The adoption and the implementation of non-standard monetary policy measures in the euro area could take this additional piece of information into account. Our synthetic indicator can also be used to monitor the effectiveness of the non-standard measures in addressing the heterogeneity on funding conditions in the various countries of the euro area.


