Abstract
Landfill fires pose a real threat to the environment as they cause the migration of pollutants to the atmosphere and water sources. A greater risk is observed in the case of wild landfills, which do not have adequate isolation from the ground. The aim of this article is to present the results of studies on the toxicity of waste from a fire in a landfill in Trzebinia (southern Poland). Both soil and waste samples were investigated. The samples were analyzed using the GC-MS method and the leachates using ICP-OES. A total of 32 samples of incinerated waste and soil were collected. The organic compounds included naphthalene, fluorene, phenanthrene, anthracene, acenaphthene, acenaphthylene, fluoranthene, pyrene, benzo (c) phenanthrene, benzo (a) anthracene, chrysene, benzo (ghi) fluoranthene, benzo (b + k) fluoranthene, benzo (a) fluoranthene, benzo (c) fluoranthene, benzo (a) pyrene, benzo (e) pyrene, perylene, indeno[1,2,3-cd] pyrene, benzo (ghi) perylene, and dibenzo (a + h) anthracene. Among the inorganic parameters, sulfates, chlorides, arsenic, boron, cadmium, copper, lead, and zinc were taken into account. Phenanthrene reached values exceeding 33 mg/L. Fluoranthene dominated in most of the samples. Sulfates and chlorides were present in the samples in concentrations exceeding 400 and 50 mg/L, respectively. Compounds contained in burnt waste may have a negative impact on soil and water health safety. Therefore, it is important to conduct research and counteract the negative effects of waste fires.
1. Introduction
The problem of landfill fires is becoming a more common and dangerous phenomenon worldwide every year [1,2,3,4]. Wild landfills occur most frequently, for example, on forest margins, in ditches, and on the peripheries of inhabited areas [5]. Since the oil, solvents, fuel, rusted metal, and batteries contained within them can cause severe environmental damage, they must be properly disposed of, which is expensive [6,7].
In 2012, the global generation of municipal solid waste (MSW) reached approximately 1.3 billion tons per year [8]. Although illegal dumping occurs for various reasons, one is thought to be the shortage of proper waste treatment facilities [9], while another could be the desire to dispose of waste cheaply. The problems with waste storage in Poland are influenced by economic and political factors [10].
Every day, about 10–30% of the MSW generated in metro cities and 30–50% in smaller cities and towns is left uncollected [11]. Another problem may be the low level of waste recycling. For example, the rate of recycling in Malaysia is as low as 15%, far behind developed countries such as Singapore, Germany, and South Korea, in which the annual rate is in the range of 50% to 75% [12].
One of the dangers that can arise from illegal landfills is fire, which can be caused by deliberate arson or spontaneous combustion resulting from the chemical reactions of waste, reactive materials, failure of landfill gas systems, smoking or sparks, landfill equipment, lightning strikes, or heated waste [13]. The main cause of fire is methane, as it is highly flammable [14]. It makes up about 40–60% of landfill gas. Carbon dioxide accounts for about the same amount, and the remainder is composed of nitrogen, oxygen, hydrogen, ammonia, sulphides, and other gases [15]. The amount of methane generated and migrating through a MSW landfill can lead to the increased intensity of the fire [16,17]. Over the years, according to the State Fire Service, there has been a consistently high number of landfill fires, which sometimes stayed active for days [18].
Higher temperature fires can cause the breakdown of volatile compounds which emit dense black smoke [19]. Such uncontrolled burning carries the risk of spreading rapidly beyond the landfill’s perimeter and can lead to air pollution. In the aftermath, dense smoke can travel for several kilometers, threatening nearby residents. The consequences of a landfill fire can also produce a potential chemical hazard. Burnt waste on unprotected soil may lead to the physical and chemical degradation of the soil [20], which can cause it to migrate to aquifers [21].
An example of the most hazardous solid waste that can be found in wild landfills is used car tires. Approximately 240 million vehicle tires are discarded worldwide every year [22]. Only around 25% of the discarded tires are reprocessed/reused, while the remaining ones end up in landfills or illegal dumps [23]. These man-made products mainly consist of styrene-butadiene, poly (butadiene), bromated butyl rubber, carbon black, extender oils, nylon, and steel wire [24]. In open fires, tire emissions reflect their chemical composition, which is 50% natural or synthetic rubber by weight, 25% black carbon, 10% metal (mostly in the steel belt), 1% sulfur, 1% zinc oxide, and trace quantities of other materials [25].
After being landfilled, waste materials are subjected to a series of physicochemical and biological transformations, provided to create leachate [26]. The leachate composition varies among landfills depending on the type of waste buried, degradation stage, climate conditions, characteristics of the landfill site, socioeconomic factors, and landfill technology [27,28].
Heavy metals and polycyclic aromatic hydrocarbons (PAHs) pose a potential threat to the environment and nearby residents. PAHs have been reported to have carcinogenic properties, and 16 PAHs have been listed as priority pollutants by the US Environmental Protection Agency [29]. There is the potential for them to be generated in situ in municipal landfill fires [30,31,32].
Environmental aspects related to the impact of potential landfill fires have only been addressed in several scientific articles. In the work of Øygard et al. [4], landfill leachate collected during and after an accidental landfill fire was tested. Levels of selected metals and compounds were determined compared to compounds present in the leachate under normal conditions. Research conducted by Raudonyte-Svirbutaviciene et al. [33] focused on soil contaminated with PAHs and heavy metals after a tire landfill fire in Lithuania. Escobar-Arnanz et al. [34] used two-dimensional gas chromatography-time-of-flight mass spectrometry to analyze soil samples from an uncontrolled tire dump fire. In another work by Rim-Rukeh [35], five landfills in Nigeria, where fires are most common, were tested for air pollution. Precipitation leachate that washed away long-term burnt waste after a previous landfill fire was analyzed in Romania [36].
PAHs are among the pollutants hazardous to human health and have been included in the list of hazardous substances, with important factors being the quantity of the substance, the duration of exposure, the route of exposure, and the effects of other chemicals to which the body is exposed. PAHs can penetrate the body via the respiratory and digestive systems, and by direct skin contact with particular substances such as soot and tar [37]. As persistent compounds, PAHs do not have a carcinogenic or mutagenic effect themselves, but their metabolites do [38]. To determine the harmfulness of PAHs, indicators of the toxicity of individual PAHs were introduced. Benzo(a)pyrene (BaP) is used as a reference substance, and the carcinogenic strength of Toxicity Equivalence Factor (TEF) of other compounds is calculated against BaP. The toxicity equivalent RTBaP Toxic Equivalent (TEQ) is the sum of the concentrations of individual PAHs and their relative toxicity factors [39], and it is calculated using Formula (1):
RTBaP = 0.001 × [Na] + 0.001 × [Acy] + 0.001 × [Ace] + 0.001 × [Fl]
+ 0.001 × [Fen] + 0.01 × [An] + 0.001 × [Flu] + 0.001 × [Pir] + 0.1 × [BaA]
+ 0.01 × [Ch] + 0.1 × [BbF] + 0.1 × [BkF] + 1 × [BaP] +5 × [DBA] + 0.1 × [BghiP]
+ 0.1 × [IP]
+ 0.001 × [Fen] + 0.01 × [An] + 0.001 × [Flu] + 0.001 × [Pir] + 0.1 × [BaA]
+ 0.01 × [Ch] + 0.1 × [BbF] + 0.1 × [BkF] + 1 × [BaP] +5 × [DBA] + 0.1 × [BghiP]
+ 0.1 × [IP]
A TEF value of 0 means that the compound is not carcinogenic. In a scientific paper [40], the calculation of mutagenicity equivalent (MEQ) and carcinogenicity (TCDD-TEQ) was suggested in order to assess the harmfulness of PAHs. The mutagenicity equivalent is given as the sum of the concentrations of the individual PAHs and their relative mutagenicity factors:
MEQ = 0.00056 × [Acy] + 0.082 × [BaA] + 0.017 × [Ch] + 0.25 × [BbF]
+ 0.11 × [BkF] + 1 × [BaP] + 0.31 × [IP] + 0.29 × [DBA] + 0.19 × [BghiP]
+ 0.11 × [BkF] + 1 × [BaP] + 0.31 × [IP] + 0.29 × [DBA] + 0.19 × [BghiP]
Carcinogenicity is equivalent to the sum of the concentrations of individual PAHs and their relative carcinogenicity coefficients:
TCDD-TEQ = 0.000025 × BaA + 0.00020 × [Ch] + 0.000354 × [BaP]
+ 0.00110 × [IP] + 0.00203 × [DBA] + 0.00253 × [BbF] + 0.00487 × [BkF]
+ 0.00110 × [IP] + 0.00203 × [DBA] + 0.00253 × [BbF] + 0.00487 × [BkF]
The harmfulness of PAHs is also expressed as the ratio of PAHs classified as carcinogenic to the sum of all labelled PAHs:
ΣPAHcarc/ΣPAH = ([BaA] + [BaP] + [BbF] + [BkF] + [Ch] + [DBA] + [IP])/([SWWA])
The closer the value of the ratio ΣPAHcarc/ΣPAH is to 1, the greater the risk posed to the population.
The purpose of this study is to investigate the toxic substances generated during a wild landfill fire. Such research has not yet been performed in Poland. Moreover, in the world’s literature, the problem has not been sufficiently addressed, with such key information missing as the level of contaminants produced, their migration extent, and time present in the soil. A wildfire that occurred in the town of Trzebinia (Poland) (2016 y.) was examined to assess its potential threat to the nearby natural environment. The soil incinerated waste and the leachate generated by washing incinerated waste from the landfill were tested for compounds and elements hazardous to health and the environment. Compounds detected in all samples were identified, and their abundance and profiles were recalculated using appropriate quantitative methods.
2. Materials and Methods
2.1. Study Area
The wild dump (28,000 m2) is located in the southern part of the town of Trzebinia (southern Poland). It is situated in a tree-lined space. To the west, there is the Trzebinia Penitentiary (approx. 130 m), to the north is an industrial area (approx. 284 m). The types of solid waste stored in the landfill included used tires, black rubber, plastic packaging, and textiles, among others.
Between 26 and 27 May 2018, a fire occurred at the wild landfill, at around 1:30 am (Figure 1). The fire spread at a swift pace, which made the firefighting operation difficult. The fire was extinguished by pouring water on it, and then the area was covered with firefighting foam to protect the nearby forest. For at least two days, the smell of the fire could be felt within a radius of 6–7 km. Children and the elderly living in the area were advised to stay inside their homes. No one was injured or killed in the fire.
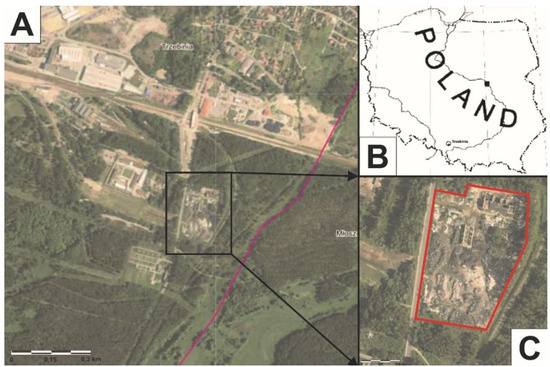
Figure 1.
(A–C) Wild landfill fire location in Trzebinia on Słowackiego Street.
According to reports from nearby authorities, the landfill described had been unused since 2013. The owner was required to dispose of the waste stored there. However, for unexplained reasons, he abandoned the facility. Since then, waste has been a never-ending problem for the town government, nearby residents, and the natural environment.
The ensuing fire created a huge, dark cloud of smoke that spread to nearby neighborhoods. This garbage created very poisonous and dense fumes that could, among other things, impede firefighting operations in the area. According to data provided by “Airlyeu” on the fire, in Chrzanów, the PM 2.5 and PM 10 standards were exceeded by 336% and 260%, respectively.
The charred, leftover waste remains uncovered at all times, unprotected from the elements (Figure 2A,B). During rainfall, waste that was altered by the fire is systematically washed away. The resulting leachate then infiltrates deep into a nearby aquifer, creating a dangerous “pollution cloud”.
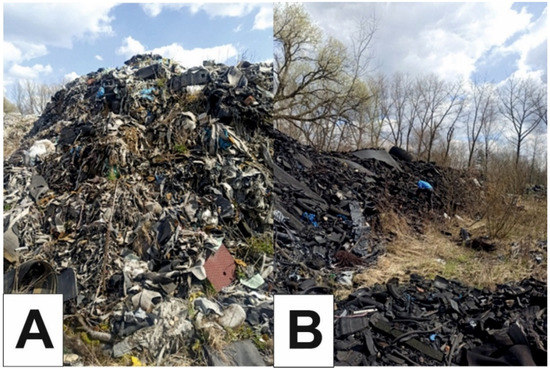
Figure 2.
(A,B) The present site of the burnt wild waste dump in Trzebinia on Słowackiego Street (April 2021).
2.2. Sampling
During two days of sampling in the morning hours of 24 April 2021, and 24 November 2021, a total of 32 soil and burnt solid waste samples were collected from the study area of the wild landfill in Trzebinia (Table 1). All samples included in the study were collected at an appropriate distance using a pre-planned route.

Table 1.
Sample code and description.
Samples of approximately 20 g of surface soil and waste were collected with a steel spatula in glass jars and then closed tightly and transported to the laboratory. Next, the soil samples were air-dried in a clean laboratory room.
2.3. Sample Preparation and Characterization
2.3.1. Sample Preparation for Laboratory Analysis
The 12 waste samples (Appendix A Figure A1A–L) collected on 24 November 2021, were prepared for transport to the i2 Analytical Limited Sp. z o.o. Pionierów 39 Str. accredited laboratory in Ruda Śląska. The objective was to perform specific tests on the content of leachate generated from the aforementioned waste. The laboratory was commissioned to test the contents for inorganic compounds: chlorides, sulfates, and heavy metals: boron, arsenic, cadmium, copper, lead, mercury, and zinc.
Before being sent to the laboratory, the waste samples were dried, weighed, flooded with demineralized water, and then washed according to the PN-EN 12457-2 Norm. The resulting leachates were filtered and transported to an accredited laboratory in glass containers at room temperature.
Chlorides were analyzed using the colorimetric method using a Discrete Analyzer, while the other ordered compounds were analyzed using the Inductively Coupled Plasma Optical Emission Spectrometry (ICP-OES) technique. All analyses were performed using ISO 17025 accreditation and the procedure L039-PL.
2.3.2. Sample Preparation for GC-MS
Appropriately dried, cataloged, and aged transformed solid waste samples were extracted with dichloromethane in an ultrasonic bath for 15 min at 30 °C. The extracts were filtered, the solvent evaporated, and the extract yields calculated. All samples were derivatized (silanized) prior to gas chromatography-mass spectrometry (GC-MS) analysis.
2.3.3. Gas Chromatography-Mass Spectrometry (GC-MS)
The GC-MS analyses were carried out using an Agilent Technologies 7890A gas analyzer chromatograph and Agilent 5975C network mass spectrometer with the triple-axis detector system at the Department of Natural Sciences, Sosnowiec, Poland, using helium (6.0 Grade) as the carrier gas at a constant flow rate of 2.6 mL/min. Separation was obtained with a J&W HP5-MS (60 m × 0.32 mm i.d., 0.25 μm film thickness) fused silica capillary column coated with a chemically bonded phase (5% phenyl, 95% methylsiloxane), for which the GC oven temperature was programmed from 45 °C (1 min) to 100 °C at 20 °C/min, then to 300 °C (hold 60 min) at 3 °C/min, with a solvent delay of 10 min [41]. Mass spectra were recorded from 45 to 550 da (0–40 min) and 50–700 da (>40 min) electron impact mode, with an ionization energy of 70 eV. Data were acquired in full scan mode and processed with the Hewlett Packard Chemstation software. The compounds were identified by their mass spectra, and a comparison of peak retention times with those of standard compounds was carried out, as well as an interpretation of MS fragmentation patterns, and literature data [42].
Peaks were integrated manually. Quantitative analysis was performed based on the 5-point calibration curves for the analytical standards. The linear correlation between the peak areas and PAH concentrations was checked within the range of 0.10–10 μg/mL, with correlation coefficient values within the range of 0.997–0.998. For quality assurance and quality control (QA/QC), the analysis of each sample series was accompanied by the analysis of a blank sample comprising the whole analysis procedure to assess possible contamination during the procedure. The method performance was verified by analyzing the NIST SRM 1649b reference material and comparing the results with the certified concentrations of the investigated PAHs. The limits of detection (LODs) were calculated as three times the standard deviation of background peaks in the procedural blanks repeated three times. The average LOD values were 2.0 ± 0.05 ng/mL. Concentrations below the LOD were considered zero for all calculations.
Gas chromatography coupled to mass spectrometry is a good, widely used analytical technique to assess the degree of contamination of soil and water, or the level of toxicity of waste where an assessment of chemical composition is required. It has been used in multifaceted ways in environmental and geochemical studies on various aspects of waste in scientific papers [41,43,44,45]. The method allows the identification of individual substances based on mass spectra and quantitative analysis.
3. Results and Discussion
3.1. PAH Concentrations in Soil and Combusted Solid Waste Samples from the Wild Landfill Fire
Among the PAHs of the Trzebinia samples, the following were identified (Table 2): naphthalene (N) (m/z = 128), fluorene (F) (m/z = 166), phenanthrene (P) (m/z = 178), anthracene (A) (m/z = 178), acenaphthene (Ace) (m/z = 154), acenaphthylene (Acy) (m/z = 152), fluoranthene (Fl) (m/z = 202), pyrene (Py) (m/z = 202), benzo(c)phenanthrene (BcPhe) (m/z = 252), benzo(a)anthracene (BaA) (m/z = 228), chrysene (Ch) (m/z = 228), benzo(ghi)fluoranthene (BghiFl) (m/z = 228), benzo(b + k)fluoranthene (Bb + kF)(m/z = 252), benzo(a)fluoranthene (BaF) (m/z = 252), benzo(c)fluoranthene (BcF) (m/z = 252), benzo(a)pyrene (BaP) (m/z = 252), benzo(e)pyrene (BeP) (m/z = 252), perylene (Pe) (m/z = 252), indeno[1,2,3-cd]pyrene (IP) (m/z = 276), benzo(ghi)perylene (BghiP) (m/z = 276), and dibenzo(a + h)anthracene (DB) (m/z = 278). PAHs have been reported to be among the most abundant classes of organic pollutants generated in many open burning processes [46,47]. The values of diagnostic PAH ratios in the Trzebinia samples are presented in Table 3.
Table 2.
Polycyclic aromatic hydrocarbon concentrations in the Trzebinia samples (ppm).
Table 3.
Values of diagnostic PAH ratios in the Trzebinia samples.
In the samples analyzed, fluoranthene and pyrene were detected in 31 samples. The highest fluoranthene concentrations (ppm) were recorded in the following samples: WR6.O (6.721 ppm), WR5.O (5.559 ppm),WR1.O (4.956 ppm), WR4.O (4.873 ppm), WR2O (1.836 ppm), WR8G (1.835 ppm), WR10.O (1.457 ppm), WR5G (1.207 ppm), WR9.O (1.200 ppm), WR11.O (1.095 ppm), and WR4o (1.018 ppm), while pyrene concentrations were recorded in the following samples: WR12G (39.311 ppm), WR6o (25.577 ppm), WR5G (13.652 ppm), WR2G (12.036 ppm), WR2o (9.638 ppm), WR3G (9.113 ppm), WR5O (8.728 ppm), and WR1.O (6.552 ppm).
Phenanthrene and anthracene are among the co-extensive compounds, where the formation of anthracene is thought to result from combustion [48,49]. Lighter naphthalene (m/z = 128) was recorded in 24 samples: WR2G, WR1O, WR3G, WR2O, WR5G, WR6G, WR7G, WR3O, WR4O, WR8G, WR12G, WR6O, WR7O, WR1.O, WR2.O, WR3.O, WR4.O, WR5.O, WR6.O, WR8.O, WR9.O, WR10.O, WR11.O, and WR12.O. The average concentrations (ppm) of individual PAHs in the samples were as follows: N—4.305 ppm, F—0.994 ppm, P—17.455 ppm, A—0.18 ppm, Ace—6.48 ppm, Acy—4.738 ppm, Fl—1.257 ppm, Py—5.923 ppm, BcPhe—0.31 ppm, BaA—1.394 ppm, Ch—1.269 ppm, BghiFl—0.31 ppm, Bb + kF—2.056 ppm, BaF—0.533 ppm, BcF—0.396 ppm, BaP—1.504 ppm, BeP—1.318 ppm, Pe—0.295 ppm, IP—0.109 ppm, BghiP—0.545 ppm, and DB—0.32 ppm.
Some of the most abundant PAHs (except naphthalene) in controlled and uncontrolled landfill fire waste samples are reported to be phenanthrene, fluoranthene and pyrene [33]. In addition, the low-molecular weight PAHs, naphthalene, acenaphthene, acenaphthylene, anthracene, phenanthrene, and fluorene, are quickly transformed by many bacteria and fungi. Furthermore, high-molecular weight PAHs are more recalcitrant in the environment and resist both chemical and microbial biodegradation [50].
The diagram in (Figure 3) presents the distribution pattern (%) of 2–6-ring PAHs in the samples (ppm) from Trzebinia. The most dominant PAHs are 3-ring (P, A, Ace, Acy, F), which are present in 31. The sum of the 3-ring PAH values was 955.102 ppm. 4-ring PAHs (Fl, Py, BaA, Ch) represent the second value of the tested samples. These were observed in 31 samples, with a total value of 314.701 ppm. 5-ring-shaped PAHs (BghiFl, BcPhe, Bb + kF, BaF, BcF, BaP, BeP, Pe, DB) were observed in 31 samples, with a total value of 225.382 ppm. Naphthalene 2-ring PAH was observed in 25 samples, with a total value of 137.774 ppm. The lowest level of PAHs was 6-ring (IP, BghiP). These were observed in 24 samples. Naphthalene was more dominant in burnt waste than in soil samples. In contrast, 3-ring PAHs were more dominant in soil samples.
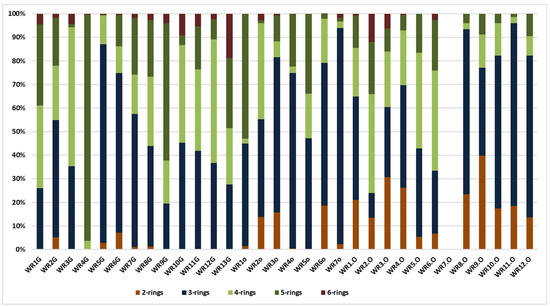
Figure 3.
Distribution pattern (%) of 2–6-ring PAHs in the samples (ppm) from Trzebinia.
An important question to ask at the outset is whether the source of pollution is traffic, combustion of fossil fuels in nearby plants, or the wild landfill fire described here. For this purpose, PAH diagnostic coefficients were used (Figure 4 and Figure 5). Several PAH diagnostic ratios were calculated based on quantitative analysis (Table 3) [51]. The origins of PAHs in soil may be identified by the phenanthrene/anthracene and the fluoranthene/pyrene ratios [52]. Three types of ratios of PAHs to their possible effects were compared: anthracene and phenanthrene to fluoranthene and pyrene, benzo(a)anthracene and chrysene to fluoranthene and pyrene, and indeno[1,2,3-cd]pyrene and benzo(g,h,i)perylene to fluoranthene and pyrene. In Figure 4, the distribution of the individual soil samples is presented, whereas Figure 5 presents the distribution of burnt waste from the wild landfill in Trzebinia. The soil samples in range (A/(P + A)) were plotted in the area corresponding to combustion and petroleum to biomass and coal combustion (Fl/(Fl + Py))—WR1G, WR2G, WR3G, WR4G, WR5G, WR8G, WR9G, WR10G, WR11G, WR12G, and WR13G. In the second case, most of the samples were recorded in the combustion range (BaA/(Ch + BaA)) to biomass and coal combustion (Fl/(Fl + Py))—except the WR2G sample. In the third case, most samples—except WR6G and WR7G, were recorded, with 11 samples in the range of biomass and coal combustion IdP/(IdP + BghiP)) to biomass and coal combustion (Fl/(Fl + Py)). Samples of burnt solid waste showed high separability compared to soil samples (A/(P + A)), (BaA/(Ch + BaA)), IdP/(IdP + BghiP)) to (Fl/(Fl + Py)). The production of PAHs will presumably be controlled by waste composition (concentrations have been shown to increase dramatically when the proportion of plastic in the waste increases) and combustion conditions [53]. Escobar-Arnanz et al. [34] suggested the potential of aromatic compounds with a wide range of rings to diffuse into the environment through, among other things, emission sources, the nature of the compounds produced, and meteorological conditions, where atmospheric deposition is considered the main source of PAHs in soil [54].
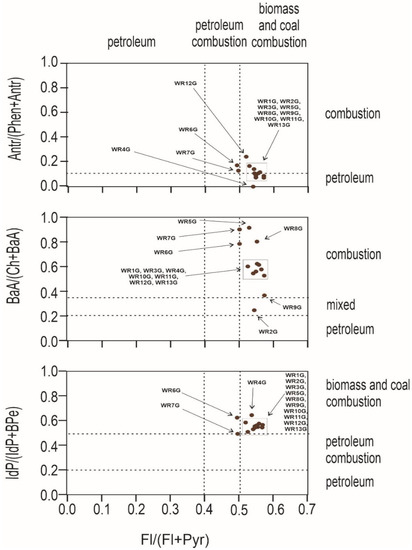
Figure 4.
Diagnostics diagrams of PAHs in soils investigated from wild waste dump in Trzebinia on Słowackiego Street. A—anthracene, P—phenanthrene, Fl—fluoranthene, Py—pyrene, BaA—benzo(a)anthracene, Ch—chrysene, IP—indeno(1,2,3-cd)pyrene, BghiP—benzo(ghi)perylene.
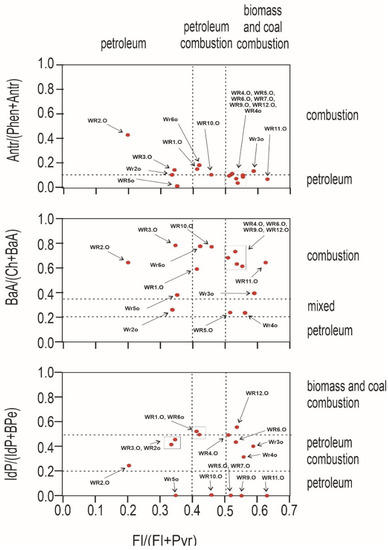
Figure 5.
Diagnostics diagrams of PAHs in burnt waste investigated from wild waste dump in Trzebinia on Słowackiego Street. A—anthracene, P—phenanthrene, Fl—fluoranthene, Py—pyrene, BaA—benzo(a)anthracene, Ch—chrysene, IP—indeno(1,2,3-cd)pyrene, BghiP—benzo(ghi)perylene.
The mean RTBaP concentration of the samples tested was 3.571 ppm. Above-average results were observed in 13 samples (11 soil samples, 2 burnt waste): WR1G = 5.042 ppm, WR2G = 9.366 pmm, WR3G = 5.559 pmm, WR5G = 4.127 pmm, WR6G = 5.015 ppm, WR7G = 3.783 ppm, WR8G = 5.464 ppm, WR10G = 11.134 ppm, WR11G = 7.285 ppm, WR12G = 23.513 ppm, WR13G = 5.661 ppm, WR6O = 7.894 ppm, and WR6.O = 3.886 ppm. The highest concentration was found in soil samples WR12G and WR10G. The mean MEQ concentration of the samples tested was 2.386 ppm. Above-average results were observed in 10 samples (6 soil samples, 4 burnt waste): WR1G = 3.198 ppm, WR2G = 6.211 ppm, WR3G = 4.231 ppm, WR8G = 4.107 ppm, WR10G = 3.214 ppm, WR12G = 19.836 ppm, WR2O = 2.7 ppm, WR6O = 4.766 ppm, WR1.O = 2.938 ppm, and WR6.O = 4.257 ppm. The highest concentration was found in soil sample WR12G. The TCDD-TEQ were observed in 10 samples: WR1G, WR2G, WR3G, WR8G, WR10G, WR12G, WR2O, WR6O, WR1.O, and WR6.O—the highest in soil sample WR12G = 0.05 ppm. The average ratio ∑PAHcarc/∑PAH in the tested samples was 0.171 ppm. Above-average results were observed in 13 samples (10 soil samples, 3 burnt waste): WR1G = 0.41 ppm, WR2G = 0.234, WR3G = 0.393 ppm, WR4G = 0.44 ppm, WR8G = 0.27 ppm, WR9G = 0.391 ppm, WR10G = 0.32 ppm, WR11G = 0.33 ppm, WR12G = 0.417 ppm, WR13 = 0.353 ppm, WR2O = 0.178 ppm, WR2.O = 0.241 ppm, and WR6.O = 0.26 ppm. The highest concentration was found in soil samples WR4G and WR12G.
Studies related to PAHs under the influence of fire in landfills have also been conducted in several types of research—[4,18,33,55].
The sum of PAH concentrations in the soil samples investigated shows high variability in the range of 0.964–184.611 ppm. The same conclusion can be reached for samples of combusted waste 0.000–212.045 ppm. Only sample WR7.O (unburnt wallpaper) was below the detection limit of ppm. The highest content of the PAH sum was in the burnt waste sample WR4O: 212.045 ppm. However, while 6 more samples of combusted waste were analyzed than soil samples, the mean sum of PAHs is higher in the soil samples (52.452 ppm). The samples collected may be divided into three subgroups: (i) with a maximum concentration of PAHs > 100 ppm/g in samples: WR5G, WR12G, WR4O, and WR6O (4 samples), (ii) with a mean concentration of PAHs in the range 50–100 ppm/g, including WR2G, WR6G, WR1.O, and WR11.O (4 samples), and (iii) with the lowest PAH concentrations of < 50 ppm/g, including WR1G, WR3G, WR4G, WR7G, WR8G, WR9G, WR10G, WR11G, WR13G, WR1O, WR2O, WR3O, WR5O, WR7O, WR2.O, WR3.O, WR4.O, WR5.O, WR6.O, WR7.O, WR8.O, WR9.O, WR10.O, and WR12.O (24 samples). In the samples examined, a high cumulative PAH content was found, which is alarming even years after the fire in the wild landfill. The total concentrations of all carcinogenic PAHs (BaA, BaP, Bb + kF, Ch, DB, IP) are well above the permissible values. The highest sum was found in soil samples 153.324 ppm, with the largest amount found in sample WR12G = 66.189 ppm (Figure 6). In the combusted waste samples, 59.554 ppm were measured, with the WR6O sample having the highest value of 14.056 ppm. These results may be compared with the occurrence of PAH contaminants in other parts of Poland [56,57]. In addition, it can be seen that the sum results of PAHs correspond to highly contaminated industrial soils, although there is no industrial plant around the landfill [58,59]. This also shows that soil microorganisms cannot cope with the degradation of this amount of pollutant.
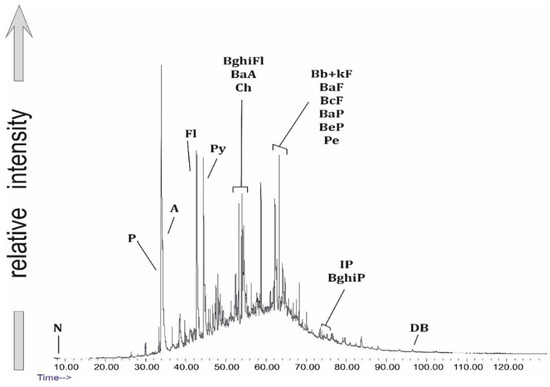
Figure 6.
Generalized PAH distribution in sample WR12G.
To assess the effects of PAHs on health and the environmental, several indicators were calculated. They defined the toxicity of individual PAHs and the whole compound group to assess the risk caused by exposure to a PAH mixture. The reference contamination was BaP. Basically, the TEF factor for the other 16 PAHs was calculated using BaP. The toxicity value, TEQ, is the sum of individual PAH concentrations and their relative toxicity coefficients [60,61] (Table 2). The organization of carbon atoms as a bay region causes a high degree of biochemical reactivity to some PAHs and their metabolites [62]. The results showed an increased risk of carcinogenicity in the area of the fire, but no serious risk to the surrounding residents was identified. These results are comparable to other studies [33,55].
The mutagenicity equivalent MEQ and concentrations were also calculated [40]. This is one of the factors that may increase cancer risk [63]. MEQ concentrations were higher in soil samples than in combusted waste. Accordingly, WR12G recorded 19.836 ppm and WR2G 6.211 ppm. RTBaP and MEQ are quite different (RTBaP 114.26 ppm compared to MEQ 76.359 ppm).
BaPE was used to evaluate the toxicity of PAHs (Table 2). This method is often used to calculate toxicity in soil, air, and combusted waste in this article. The values of the indicator vary considerably between the soil samples and the combusted waste. Most soil samples exceeded 1.5 ppm/g, with the highest result in sample WR12G of 15.33 ppm/g. Almost all combusted waste samples (except WR6O, WR1.O, and WR6.O) did not exceed the limit value of 1.5 ppm/g, with the highest result in sample WR6O of 4.05 ppm/g.
PAH distribution transformations occur during migration in the air, which were not observed in the source material. A group of compounds emitted on particles exhibits a different distribution from the source material due to the sorption of the pyrolytic phase itself. The formation of hydrocarbons in fires in municipal waste occurs with oxygen or with severely restricted access. It is assumed that the formation of hydrocarbon groups is different from that of pyrolysis during complete or near-complete combustion. In addition, the use of diagnostic methods obtained from the landfill fire was not considered appropriate due to anomalies of high PAH levels in soils.
2-ring naphthalenes were found to be significantly higher in combusted waste than in soil samples. This may be related to a study [64], in which, in laboratory conditions, controlled heating and burning of coal spoils was carried out to determine PAH emissions with full access and without access to oxygen. Increased 2-ring concentrations in the range of 200 °C were observed. In addition, another paper [65] established that temperatures of up to 250 °F have been measured in municipal solid waste landfills when they are undergoing a subsurface reaction. This means that a firing temperature of about 200 °C may have contributed to the increase of naphthalenes in the combusted waste.
3.2. MPI Concentrations in Soil and Combusted Solid Waste Samples from the Wild Landfill Fire
Methylphenanthrenes (m/z = 192) were found in 30 samples (Table 4) from the wild waste dump in Trzebinia. The average values of MPI3 and MPI1 in the samples from this set were MPI3 = 1.97 and MPI1 = 2.95. The highest MPI3 above average was recorded in samples WR1G = 1.63, WR2G = 2.01, WR4O = 3.45, WR8G = 4.34, WR9G = 3.38, WR10G = 3.27, WR5O = 4.93, WR11G = 4.39, WR13G = 3.91, and WR5.O = 2.01. On the other hand, MPI1 index above the mean was recorded in samples WR2G = 3.02, WR4O = 5.18, WR8G = 6.52, WR9G = 5.07, WR10G = 4.90, WR5O = 7.39, WR11G = 6.59, WR13G = 5.86, and WR5.O = 3.01. The mean Rc was 2.84. The MPI1 values were used to calculate the theoretical reflectivity value of fossil fuel vitrinite Rc based on the formula proposed by Radke [66].
Table 4.
Values of geochemical ratios found in DEP extracts ratios in the Trzebinia samples.
Rc values above 2.0 correspond to a thermally highly transformed organic substance, while significant parameter variations indicate heterogeneous temperatures during the fire. At the same time, it was noted that the location of the samples taken affects the index value. In the case of soils, these high values indicate that a fire is the cause and not car traffic. An example Rc of car traffic and coal combustion in private fireplaces would be about 0.7–0.9 [66,67,68,69]. The mean MPI3 and MPI1 values also correspond to a high thermal transformation of the samples.
3.3. Compound Contents in Leachate Samples of Burnt Solid Waste from the Wild Landfill Fire
Physical and chemical results indicate that the leachates analyzed were most contaminated by major ions, namely sulfate and chloride (Table 5).
Table 5.
Results of physicochemical analyses of the leachates analyzed.
Of the metals, zinc is the most significant contributor. The highest concentrations of sulfate were observed in samples 5 and 8. These include samples of burnt tires and rubber and foam. Both samples had sulfate contents exceeding 1000 mg/L. These samples have the highest concentrations of most contaminants. This is also true for the chloride content in these samples: 85 and 320 mg/L, respectively. Sample 8 also had a high concentration of zinc, over 50 mg/L. In this case, the highest concentration was found in sample 5 (100 mg/L). There were few arsenic, lead, cadmium, or copper concentrations in the samples tested. The concentrations of each constituent in the leachate are shown in (Figure 7A,B). The leachate produced by washing burnt rubber black waste and tires displayed a dark black color. This was most likely caused by very fine soot from the combustion process.
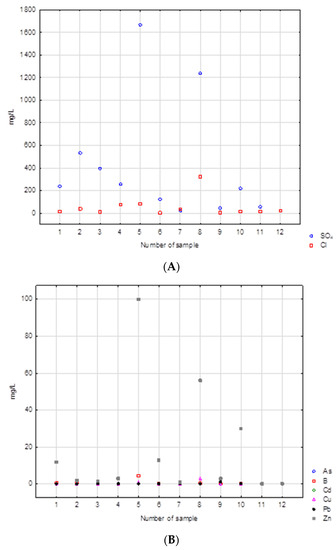
Figure 7.
(A,B) Concentrations of main ions in the leachates analyzed.
The results obtained from the leachate tests show that the contamination caused by metals and major ions is low compared to organic compounds (Appendix A Table A1). Similar results regarding the amount of contaminant leaching from such waste has been documented in other studies such as Hennerbert et al. [70]. Burnt tires also had significant concentrations of sulfate and zinc in the leachate, but the other parameters tested did not indicate high contamination.
The results of the physicochemical analyses were compared with the permissible values of these parameters in groundwater based on the Regulation of the Minister of Maritime Economy and Inland Navigation of 11 October 2019, on the criteria and method of assessing the state of groundwater bodies. In the case of sulfates, three samples (WR2.O, WR5.O, and WR8.O) would be classified as water quality class V (poor chemical status). Samples WR7.O, WR9.O, and WR12.O would be classified as quality class I (good chemical condition). It should be noted that the V class of water quality includes water samples with sulfate concentrations higher than 500 mg/L. In this context, samples with concentrations exceeding 1200 mg/L seem particularly dangerous. Typical sulfate levels in fresh water range from 0 to 630 mg/L in rivers, from 2 to 250 mg/L in lakes and from 0 to 230 mg/L in groundwater [71].
It is assumed that the chloride concentration in unpolluted waters can reach 10 mg/L. The concentration of this component in precipitation fluctuates around 1 mg/L. The high chloride content in waters and soils is a result of anthropogenic activity. It is also a typical indicator of groundwater pollution in the area of landfills [72]. The upper limit of the hydrochemical background for this component is 60 mg/L. In the case of sample numbers WR4.O, WR5.O, and WR8.O, these values are much higher. In the last one, it would be classified as water quality class IV. The high chloride content of this sample may come from dyes in the textiles.
In the case of arsenic, the acceptable concentration value for the first class is 0.01 mg/L. On the other hand, the upper limit of the natural hydrochemical background is twice as high. The arsenic content in the samples tested ranges from 0.0062 (WR10.O) to 0.085 mg/L (WR3.O). This suggests that the most contaminated samples would be classified in quality class IV.
Only two samples (WR4.O and WR5.O) have the content of boron ions appropriate for the V quality class. In other cases, these are concentrations characteristic of quality class III and higher. Boron is an important pollution indicator for municipal waste, but it is also a component of paints.
In the event of contamination with copper, cadmium, or lead, most samples would be graded into third and fourth quality classes. However, there are also samples whose concentration of the mentioned components suggests that they belong to class V. For example, the concentration of lead in sample WR9.O is ten times higher than the lower limit for class V, and in the case of copper ions, a concentration six times higher was found in sample WR8.O.
In the case of zinc ions, the natural hydrochemical background is in the range 0.005–0.050 mg/L. Only two of the samples tested could be classified as class II of water quality. Most, however, are classified in the fourth and fifth quality class. For samples WR10.O and WR5.O, the concentrations of zinc ions are 15 times and 50 times higher, respectively, than the fifth-class limit. It should be borne in mind that high zinc contents in the waste tested may be, among other things, the effect of the use of zinc oxide in tire vulcanization.
The results from the laboratory were also compared with the acceptable standards for leaching pollutants specified in the Regulation of the Minister of Economy of July 16, 2015, on allowing waste to be deposited in landfills [73]. The values were converted depending on the size of the waste sample collected. For all samples tested, except for sample number 3 (sponge), the limit values were reduced by 10 times, and for this sample by 20. When comparing the results obtained with the standards, for all parameters, except for lead and zinc, the requirements for depositing non-municipal waste are met. In the case of lead, only one sample (WR9.O) slightly exceeds the allowed concentration. The situation is much worse with zinc. For this sample size, the acceptable value limit is 5 mg/L. In the set of analyses obtained, as many as 5 samples exceed this value. One of the samples (WR5.O) was up to 20 times higher. It should also be noted that these are the results of leachability tests obtained from small samples of waste. These values should be properly recalculated depending on the total mass of waste located in the wild landfill.
It is also possible to constantly monitor changes in soil or water quality in the vicinity of such facilities with the use of sensors and artificial intelligence [74,75].
The concentrations of the individual components are not too high compared to the typical values that can be recorded in soils. A similar lack of increased concentration of inorganic compounds in soils in the vicinity of the fires was also observed in other studies [55,76,77].
4. Conclusions
Soil samples and incinerated waste were analyzed to determine how a wild landfill fire may affect the environment and the health of the surrounding inhabitants. The most significant finding of the research is that the currently deposited burnt solid waste in the wild landfill poses a potentially permanent hazard to the environment. Samples taken even a long time after the fire started in the study area contain significant concentrations of hazardous organic compounds, in particular PAHs. This includes both soil samples and solid waste transformed by the fire. The results obtained show a high total concentration of the PAHs found in the samples. These results show that these soils are at similar pollution levels to soils heavily polluted by industry, although there are no industrial installations on the site itself or in the surrounding area. However, lower levels of mutagenicity and carcinogenicity were observed. ΣPAHcarc/ΣPAH did not approach 1, which is considered a potential health risk, in any of the samples tested. However, since the general summary PAH level is high, it follows that carcinogenicity is also high.
No significant spikes in heavy metal content were observed in leachate collected from the incinerated waste samples. This may be justified because, during the incineration of solid waste such as tires and black rubber, more organic compounds are formed by high temperature and oxidation.
Personal protective measures (gloves, protective clothing, and protective masks) are required for workers in all future work on the site of a burnt wild landfill. They aim to reduce skin contact with dust and reduce the risk of contaminated dust particles being breathed into the body, which could increase the risk of lung cancer.
Research of this type must be carried out in conjunction with environmental monitoring to identify potential threats to the environment and human health early. This is important since the amount of illegal waste stored in previously unsecured and unattended places is growing year by year.
It is worth mentioning that similar tests are currently being carried out at sites after fires in Sosnowiec and Sobolew to obtain a larger database of results for contaminant tests.
In addition, future research could be complemented by the development of a pollutant migration model and geochemical modeling using appropriate programs.
Author Contributions
Conceptualization, W.R. and M.J.F.; methodology, W.R., M.J.F. and D.D.; formal analysis, W.R., M.J.F. and D.D.; field work, W.R. and D.D.; writing—original draft preparation, W.R., M.J.F. and D.D.; supervision, M.J.F. All authors have read and agreed to the published version of the manuscript.
Funding
The research and laboratory equipment used to test the samples in this paper were funded through a competition organized by the Doctoral School at the University of Silesia in Katowice.
Institutional Review Board Statement
Not applicable.
Informed Consent Statement
Not applicable.
Conflicts of Interest
The authors declare that they have no conflict of interest.
Nomenclature
| A—anthracene | Ace—acenaphthene |
| Acy—acenaphthylene | BaA—benzo(a)anthracene |
| BaF—benzo(a)fluoranthene | BaP—benzo(a)pyrene |
| Bb + kF—benzo(b + k)fluoranthene | BcF—benzo(c)fluoranthene |
| BcPhe—benzo(c)phenanthrene | BeP—benzo(e)pyrene |
| BghiFl—benzo(ghi)fluoranthene | BghiP—benzo(ghi)perylene |
| Ch—chrysene | DB—dibenzo(a + h)anthracene |
| DMR—Dimethylnaphthalene Ratio | Fl—fluoranthene |
| F—fluorene | GC-MS—Gas chromatography-mass spectrometry |
| IP—indeno[1,2,3-cd]pyrene | ICP-OES—Inductively Coupled Plasma Optical Emission Spectrometry |
| MNR—Methylnaphthalene Ratio | MOE—Ministry of Environment |
| MPI—Methylphenanthrene Index | MSW—Municipal solid waste |
| N—naphthalene | P—phenanthrene |
| PAHs—Polycyclic aromatic hydrocarbons | Pe—perylene |
| Py—pyrene | TEF—Toxicity Equivalence Factor |
| TEQ—Toxic Equivalent | TNR—Trimethylnaphthalene Ratio |
Appendix A


Figure A1.
(A–L) Presentation of 12 solid waste samples subjected to the leaching process.
Figure A1.
(A–L) Presentation of 12 solid waste samples subjected to the leaching process.


Table A1.
Results of chemical analyses.
Table A1.
Results of chemical analyses.
| Unit | SO4 [mg/L] | Cl [mg/L] | As [µg/L] | B [mg/l] | Cd [µg/L] | Cu [µg/L] | Pb [µg/L] | Zn [mg/L] | |
|---|---|---|---|---|---|---|---|---|---|
| No. | |||||||||
| WR1.O | 239.0 | 13.0 | 64.0 | 0.6 | 28.0 | 12.0 | 12.0 | 12.0 | |
| WR2.O | 534.0 | 38.0 | 82.0 | 1.0 | 0.1 | 4.9 | 13.0 | 1.9 | |
| WR3.O | 397.0 | 8.1 | 85.0 | 1.1 | 0.4 | 70.0 | 15.0 | 1.6 | |
| WR4.O | 255.0 | 76.0 | 59.0 | 3.1 | 1.5 | 50.0 | 9.6 | 2.9 | |
| WR5.O | 1670.0 | 83.0 | 9.0 | 4.6 | 18.0 | 760.0 | 41.0 | 100.0 | |
| WR6.O | 121.0 | 0.8 | 7.0 | 0.1 | 27.0 | 83.0 | 30.0 | 13.0 | |
| WR7.O | 20.8 | 30.0 | 7.0 | 0.1 | 0.2 | 150.0 | 12.0 | 0.85 | |
| WR8.O | 1240.0 | 320.0 | 14.0 | 0.4 | 35.0 | 300.0 | 13.0 | 56.0 | |
| WR9.O | 43.5 | 2.7 | 8.0 | 0.1 | 4.6 | 37.0 | 110.0 | 2.9 | |
| WR10.O | 220.0 | 16.0 | 6.0 | 0.2 | .5 | 68.0 | 16.0 | 30.0 | |
| WR11.O | 58.2 | 15.0 | 10.0 | 0.1 | 0.1 | 20.0 | 6.7 | 0.22 | |
| WR12.O | 17.9 | 20.0 | 35.0 | 0.1 | 0.9 | 59.0 | 33.0 | 0.25 | |
References
- Koda, E.; Pachuta, K.; Osinski, P. Potential of plant applications in the initial stage of the landfill reclamation process. Polish J. Environ. Stud. 2013, 22, 1731–1739. [Google Scholar]
- Vaverkova, M.D.; Elbl, J.; Koda, E.; Adamcova, D.; Bilgin, A.; Lukas, V.; Podlasek, A.; Kintl, A.; Wdowska, M.; Brtnicky, M.; et al. Chemical composition and hazardous effects of leachate from the active municipal solid waste landfill surrounded by farmlands. Sustainability 2020, 12, 4531. [Google Scholar] [CrossRef]
- Stańczyk-Mazanek, E.; Stępniak, L.; Kępa, U. Analysis of Migration of Polycyclic Aromatic Hydrocarbonsfrom Sewage Sludge Used for Fertilization to Soils, Surface Waters, and Plants. Water 2019, 11, 1270. [Google Scholar] [CrossRef]
- Øygard, J.; Mage, A.; Gjengedal, E.; Svane, T. Effect of an uncontrolled fire and the subsequent fire fight on the chemical composition of landfill leachate. Waste Manag. 2005, 25, 712–718. [Google Scholar] [CrossRef]
- Vaverkova, M.D.; Maxianova, A.; Winkler, J.; Adamcova, D.; Podlasek, A. Environmental consequences and the role of illegal waste dumps and their impact on land degradation. Land Use Policy 2019, 89, 104234. [Google Scholar] [CrossRef]
- Esa, M.R.; Halog, A.; Rigamonti, L. Strategies for minimizing construction and demolition wastes in Malaysia. Resour. Conserv. Recycl. 2017, 120, 219–229. [Google Scholar] [CrossRef]
- Lu, W. Big data analytics to identify illegal construction waste dumping: A Hong Kong study. Resour. Conserv. Recycl. 2018, 141, 264–272. [Google Scholar] [CrossRef]
- Kremser, K.; Thallner, S.; Strbik, D.; Spiess, S.; Kucera, J.; Vaculovic, T.; Vsiansky, D.; Haberbauer, M.; Mandl, M.; Guebitz, G. Leachability of metals from waste incineration residues by iron and sulfur-oxidizing bacteria. J. Environ. Manag. 2021, 280, 111734. [Google Scholar] [CrossRef]
- Ichinose, D.; Yamamoto, M. On the relationship between the provision of waste management service and illegal dumping. Resour. Energy Econ. 2010, 33, 79–93. [Google Scholar] [CrossRef]
- Bihałowicz, J.; Rogula-Kozlowska, W.; Krasuski, A. Contribution of landfill fires to air pollution—An assessment methodology. Waste Manag. 2021, 125, 182–191. [Google Scholar] [CrossRef]
- Nagpure, A. Assessment of quantity and composition of illegal dumped municipal solid waste (MSW) in Delhi. Resour. Conserv. Recycl. 2018, 141, 54–60. [Google Scholar] [CrossRef]
- Sarabatin, M.A. RM2b Urus Sisa Pepejal. Berita Harian, 5 February 2016. [Google Scholar]
- Jeff, P. Landfill Fire Case Study and Discussion. Missouri Waste Control Coalition Environmental Conference 2018, USA. Available online: http://www.mowastecoalition.org/resources/Documents/2018%20conference/2018%20%20MWCC%20-%20Landfill%20Fire%20Presentation.pdf (accessed on 15 September 2022).
- Aderemi, A.; Otitoloju, A. An assessment of landfill fires and their potential health effects—A case study of a municipal solid waste landfill in Lagos, Nigeria. Int. J. Environ. Prot. 2012, 2, 22–26. [Google Scholar]
- Tchobanoglous, G.; Theisen, H.; Vigil, S.A. Integrated Solid Waste Management: Engineering Principles and Management Issues; McGraw-Hill: New York, NY, USA, 1993. [Google Scholar]
- Stearns, R.P.; Peyotan, G.S. Utilization of landfills as building sites. Waste Manag. Res. 1984, 2, 75–83. [Google Scholar] [CrossRef]
- United States Fire Administration. Landfill Fires—Their Magnitude, Characteristics and Mitigation. US Fire Administration 2002, Emmetsburg, USA. Available online: www.usfa.fema.gov/downloads/pdf/publications/fa-225.pdf (accessed on 15 September 2022).
- Downard, J.; Singh, A.; Bullard, R.; Jayarathne, T.; Rathnayake, C.; Simmons, D.; Wels, B.; Spak, S.; Peters, T.; Beardsley, D. Uncontrolled combustion of shredded tires in a landfill e Part 1: Characterization of gaseous and particulate emissions. Atmos. Environ. 2014, 10, 195–204. [Google Scholar] [CrossRef]
- New Zealand Ministry of Environment. Landfill Guidelines: Hazards of Burning on Landfills; Technology Representatives; New Zealand Ministry of Environment: Thorndon, New Zealand, 1997. [Google Scholar]
- Koda, E.; Miszkowska, A.; Sieczka, A.; Osiński, P. Heavy metal contamination within a restored landfill site. Environ. Geotech. 2018, 7, 512–521. [Google Scholar] [CrossRef]
- Abiriga, D.; Vestgarden, L.; Klempe, H. Groundwater contamination from a municipal landfill: Effect of age, landfill closure, and season on groundwater chemistry. Sci. Total Environ. 2020, 737, 140307. [Google Scholar] [CrossRef]
- Sladek, T.A. Workshop on Disposal Techniques with Energy Recovery for Scrapped Vehicle Tires; City and County of Denver; The Energy Task Force of the Urban Consortium for Technology Initiatives; U.S. Department of Energy: Denver, CO, USA, 1987. [Google Scholar]
- DeMarini, D.M.; Lemieux, P.M.; Ryan, J.V.; Brooks, L.R.; Williams, R.W. Mutagenicity and chemical analysis of emissions from the open burning of scrap rubber tires. Environ. Sci. Technol. 1994, 28, 136. [Google Scholar] [CrossRef]
- Wang, C.; Li, D.; Zhai, T.; Wang, H.; Sun, Q.; Li, H. Direct conversion of waste tires into three-dimensional graphene. Energy Storage Mater. 2019, 23, 499–507. [Google Scholar] [CrossRef]
- Seidelt, S.; Muller-Hagedorn, A.; Bockhorn, H. Description of tire pyrolysis by thermal degradation behaviour of main components. J. Anal. Appl. Pyrolysis 2006, 75, 11–18. [Google Scholar] [CrossRef]
- Silva, A.; Prata, J.; Duarte, A.; Soares, A.; Barcelo, D.; Rocha-Santos, T. Microplastics in landfill leachates: The need for reconnaissance studies and remediation technologies. Case Stud. Chem. Environ. Eng. 2021, 3, 100072. [Google Scholar] [CrossRef]
- Mahon, A.M.; O’Connell, B.; Healy, M.G.; O’Connor, I.; Officer, R.; Nash, R. Microplastics in sewage sludge: Effects of treatment, Environ. Sci. Technol. 2016, 51, 810–818. [Google Scholar] [CrossRef]
- Sundt, P.; Schulze, P.E.; Syversen, F. Sources of Microplastic-Pollution to the Marine Environment Project. Report Norweg Environ Agency 2020, Report nr: M-321/2015. Available online: https://www.miljodirektoratet.no/globalassets/publikasjoner/M321/M321.pdf (accessed on 15 September 2022).
- Bi, C.; Chen, Y.; Zhao, Z.; Li, Q.; Zhou, Q.; Ye, Z.; Ge, X. Characteristics, sources and health risks of toxic species (PCDD/Fs, PAHs and heavy metals) in PM2.5 during fall and winter in an industrial area. Chemosphere 2020, 238M, 124620. [Google Scholar] [CrossRef]
- Loehr, R.C.; Erickson, D.C.; Kelmar, L.A. Characteristics of residues at hazardous waste land treatment units wat. Water Res. 1993, 27, 1127–1138. [Google Scholar] [CrossRef]
- Wild, S.R.; Jones, K.C. Polynuchear aromatic hydrocarbon on the United Kingdom environment—A preliminary source inventory and budget. Env. Pollut. 1995, 88, 91–108. [Google Scholar] [CrossRef]
- Ruokojani, P.; Ruuskanen, J.; Ettala, M.; Rahkonen, P.; Jarhanen, J. Formation of polyaromatic hydrocarbons and phychlonated organic compounds in municipal waste landfill fires. Chemosphere 1995, 31, 3899–3908. [Google Scholar] [CrossRef]
- Raudonyte-Svirbutaviciene, E.; Stakeniene, R.; Joksas, K.; Valiulis, D.; Bycenkiene, S.; Zarkow, A. Distribution of polycyclic aromatic hydrocarbons and heavy metals in soil following a large tire fire incident: A case study. Chemosphere 2022, 286, 131556. [Google Scholar] [CrossRef]
- Escobar-Arnanz, J.; Mekni, S.; Blanco, G.; Eljarrat, E.; Barcelo, D.; Ramos, L. Characterization of organic aromatic compounds in soils affected by an uncontrolled tire landfill fire through the use of comprehensive two-dimensional gas chromatography–time-of-flight mass spectrometry. J. Chromatogr. A 2017, 1536, 163–175. [Google Scholar] [CrossRef]
- Rim-Rukeh, A. An assessment of the contribution of municipal solid waste dump sites fire to atmospheric pollution. Open J. Air Pollut. 2014, 3, 53–60. [Google Scholar] [CrossRef]
- Cocean, I.; Diaconu, M.; Cocean, A.; Postolachi, C.; Gurlui, S. Landfill Waste Fire Effects Over Town Areas Under Rainwaters. IOP Conf. Ser. Mater. Sci. Eng. 2020, 877, 012048. [Google Scholar] [CrossRef]
- Kim, K.H.; Jahan, S.A.; Kabir, E.; Brown, R.J.C. A review of airborne polycyclic aromatic hydrocarbons (PAHs) and their human health effects. Environ. Int. 2013, 60, 71–80. [Google Scholar] [CrossRef]
- White, P.A. The genotoxicity of priority polycyclic aromatic hydrocarbons in complex mixtures. Mutat. Res. 2002, 515, 85–98. [Google Scholar] [CrossRef]
- Nisbet, I.C.T.; LaGoy, P.K. Toxic equivalency factors (TEFs) for polycyclic aromatic hydrocarbons (PAHs). Regul. Toxicol. Pharmacol. 1992, 16, 290–300. [Google Scholar] [CrossRef]
- Rogula-Kozłowska, W.; Kozielska, B.; Klejnowski, K. Concentration, origin and health hazard from fi ne particle-bound PAH at three characteristic sites in Southern Poland. Bull. Environ. Contam. Toxicol. 2013, 91, 349–355. [Google Scholar] [CrossRef] [PubMed]
- Rybicki, M.; Marynowski, L.; Simoneit, B. Composition of organic compounds from low-temperature burning of lignite and their application as tracers in ambient air. Chemosphere 2020, 249, 126087. [Google Scholar] [CrossRef]
- Philp, R.P. Fossil Fuel Biomarkers. In Application and Spectra; Elsevier: Amsterdam, The Netherlands, 1985; p. 294. [Google Scholar]
- Liu, H.; Liang, Y.; Zhang, D.; Wang, C.; Liang, H.; Cai, H. Impact of MSW landfill on the environmental contamination of phthalate esters. Waste Manag. 2010, 30, 1569–1576. [Google Scholar] [CrossRef]
- Fabiańska, M.; Misz-Kennan, M.; Ciesielczuk, J.; Pierwoła, J.; Nitecka, N.; Brzozowski, J. Thermal history of coal wastes reflected in their organic geochemistry and petrography; the case study: The Katowice-Wełnowiec dump, Poland. Int. J. Coal Geol. 2017, 184, 11–26. [Google Scholar] [CrossRef]
- Fabiańska, M.; Ciesielczuk, J.; Misz-Kennan, M.; Kruszewski, L.; Kowalski, A. Preservation of coal-waste geochemical markers in vegetation and soil on self-heating coal-waste dumps in Silesia, Poland. Geochemistry 2016, 76, 211–226. [Google Scholar] [CrossRef]
- CalEPA. Tire Fire Report Office of Environmental Health Hazard Assessment; California Environmental Protection Agency: Sacramento, CA, USA, 2002. [Google Scholar]
- Lemieux, P.; Lutes, C.; Santoianni, D. Emissions of organic air toxics from open burning: A comprehensive review. Prog. Energy Combust. Sci. 2004, 30, 1–32. [Google Scholar] [CrossRef]
- Simoneit, B.R.T. Biomarker PAHs in the environment. In The Handbook of Environmental Chemistry, PAHs and Related Compounds; Neilson, A.H., Ed.; Springer-Verlag: Berlin/Heidelberg, Germany, 1998; Volume 3, pp. 176–221. [Google Scholar]
- Pereira, W.E.; Hostettler, F.D.; Luoma, S.N.; van Geen, A.; Fuller, C.C.; Anima, R.J. Sedimentary record of anthropogenic and biogenic polycyclic aromatic hydrocarbons in San Francisco Bay (California). Mar. Chem. 1999, 64, 99–113. [Google Scholar] [CrossRef]
- Carl, E.C.; John, B.S. 7—Bioremediation of Polycyclic Aromatic Hydrocarbons by Liqninolytic and non Ligninolytic Fungi; Cambridge University Press: London, UK, 2009; pp. 136–187. [Google Scholar]
- Charriau, A.; Bodineau, L.; Ouddane, B.; Fischer, J.-C. Polycyclic aromatic hydrocarbons and n-alkanes in sediments of the Upper Scheldt River Basin: Contamination levels and source apportionment. J. Environ. Monit. 2009, 11, 1086–1093. [Google Scholar] [CrossRef]
- Wang, X.J.; Chen, J.; Zhang, Z.H.; Piao, X.Y.; Hu, J.D.; Tao, S. Distribution and Sources of Polycyclic Aromatic Hydrocarbons in Soil Profiles of Tianjin Area, People’s Republic of China. Bull Env. Contam Toxicol 2004, 73, 739–748. [Google Scholar] [CrossRef]
- Yasuda, K.; Kaneko, M.; Yoshino, H. Basic research on the emission of polycyclic aromatic hydrocarbons caused by waste incineration. JAPCA 1989, 39, 1557–1561. [Google Scholar] [CrossRef]
- Mostert, M.R.M.; Ayoko, G.A.; Kokot, S. Application of chemometrics to analysisof soil pollutants. TRAC Trends Anal. Chem. 2010, 29, 430–445. [Google Scholar] [CrossRef]
- Chrysikou, L.; Gemenetzis, P.; Kouras, A.; Manoli, E.; Terzi, E.; Samara, C. Distribution of persistent organic pollutants, polycyclic aromatic hydrocarbons and trace elements in soil and vegetation following a large scale landfill fire in northern Greece. Environ. Int. 2008, 34, 210–225. [Google Scholar] [CrossRef]
- Wcisło, E. Soil Contamination with Polycyclic Aromatic Hydrocarbons (PAHs) in Poland—A Review. Pol. J. Environ. Stud. 1998, 7, 267–272. [Google Scholar]
- Maliszewska-Kordybach, B.; Smreczak, B.; Klimkowicz-Pawlas, A.; Terelak, H. Monitoring of the total content of polycyclic aromatic hydrocarbons (PAHs) in arable soils in Poland. Chemosphere 2008, 73, 1284–1291. [Google Scholar] [CrossRef]
- Musa Badowe, B.A.; Shukurov, N.; Leimer, S.; Kersten, M.; Steinberger, Y.; Wilcke, W. Polycyclic aromatic hydrocarbons (PAHs) in soils of an industrial area in semi-arid Uzbekistan: Spatial distribution, relationship with trace metals and risk assessment. Environ. Geochem. Health 2021, 43, 4847–4861. [Google Scholar]
- Gune, M.; Ma, W.; Sampath, S.; Li, W.; Li, Y.; Udayashankar, H.; Balakrishna, K.; Zhang, Z. Occurrence of polycyclic aromatic hydrocarbons (PAHs) in air and soil surrounding a coal-fired thermal power plant in the south-west coast of India. In Environmental Science and Pollution Research; Springer: Berlin/Heidelberg, Germany, 2019. [Google Scholar] [CrossRef]
- Zhang, D.; An, T.; Qiao, M.; Loganathan, B.; Zeng, X.; Sheng, G.; Fu, J. Source identification and health risk of polycyclic aromatic hydrocarbons associated with electronic dismantling in Guiyu town, South China. J. Hazard. Mater. 2011, 192, 1–7. [Google Scholar] [CrossRef]
- Jelonek, Z.; Fabiańska, M.; Jelonek, I. Quantitative Assessment of Organic and Inorganic Contaminants in Charcoal. Resources 2021, 10, 69. [Google Scholar] [CrossRef]
- Bourotte, C.; Forti, M.C.; Taniguchi, S.; Bícego, M.C.; Lotufo, P. A wintertime study of PAHs in fine and coarse aerosols in São Paulo city, Brazil. Atmos. Environ. 2005, 39, 3799–3811. [Google Scholar] [CrossRef]
- Parra, Y.J.; Oloyede, O.O.; Pereira, G.M.; De Almeida Lima, P.H.A.; Da Silva Caumo, S.E.; Morenikeji, O.A.; De Castro Vasconcellos, P. Polycyclic aromatic hydrocarbons in soils and sediments in Southwest Nigeria. Environ. Pollut. 2020, 259, 113732. [Google Scholar] [CrossRef] [PubMed]
- Li, C.; Zhang, X.; Gao, X.; Qi, S.; Wang, Y. The Potential Environmental Impact of PAHs on Soil and Water Resources in Air Deposited Coal Refuse Sites in Niangziguan Karst Catchment, Northern China. Int. J. Environ. Res. Public Health 2019, 16, 1368. [Google Scholar] [CrossRef] [PubMed]
- Musilli, A. Landfill elevated internal temperature detection and landfill fire index assessment for fire monitoring. Theses Diss. 2016, 2340. Available online: https://rdw.rowan.edu/etd/2340 (accessed on 15 September 2022).
- Radke, M.; Welte, D.H.; Willsch, H. Maturity parameters based on aromatic hydrocarbons: Influence of the organic matter type. Org. Geochem. 1986, 10, 51–63. [Google Scholar] [CrossRef]
- Radke, M. Organic geochemistry of aromatic hydrocarbons. Adv. Pet. Geochem. 1988, 2, 141–203. [Google Scholar]
- Fabiańska, M.; Smółka-Danielowska. Biomarker compounds in ash from coal combustion in domestic furnaces (Upper Silesia Coal Basin, Poland). Fuel 2012, 102, 333–344. [Google Scholar] [CrossRef]
- Fabiańska, M.; Kozielska, B.; Konieczyński, J.; Kowalski, A. Sources of organic pollution in particulate matter and soil of Silesian Agglomeration (Poland): Evidence from geochemical markers. Env. Geochem. Health 2016, 38, 821–842. [Google Scholar] [CrossRef]
- Hennerbert, P.; Lambert, S.; Fouillen, F.; Charrasse, B. Assessing the environmental impact of shredded tires as embankment fill material. Can. Geotech. J. 2014, 51, 469–478. [Google Scholar] [CrossRef]
- Backer, L. Assessing the acute gastrointestinal effects of ingesting naturally-occurring high levels of sulfate in drinking water. CRC Rev. Clin. Lab. Sci. 2000, 37, 389–400. [Google Scholar] [CrossRef]
- Dąbrowska, D.; Witkowski, A.; Sołtysiak, M. Application of pollution indices for the assessment of the negative impact of a municipal landfill on groundwater (Tychy, southern Poland). Geol. Q. 2018, 62, 496–508. [Google Scholar] [CrossRef]
- Regulation 2015. Regulation of the Minister of Economy of 16 July 2015 on the acceptance of waste to landfills. J. Laws 2015, 1277. [Google Scholar]
- Połap, D.; Winnicka, A.; Serwata, K.; Kęsik, K.; Woźniak, M. An Intelligent System for Monitoring Skin Diseases. Sensors 2018, 18, 2552. [Google Scholar] [CrossRef]
- Winnicka, A.; Kęsik, K.; Połap, D.; Woźniak, M.; Marszałek, Z. A Multi-Agent Gamification System for Managing Smart Homes. Sensors 2019, 19, 1249. [Google Scholar] [CrossRef]
- Samara, C. Chemical mass balance source apportionment of TSP in a lignite-burning area of Western Macedonia, Greece. Atmospheric Environ. 2005, 39, 6430–6443. [Google Scholar] [CrossRef]
- Nadal, M.; Schuhmacher, M.; Domingo, J.L. Levels of metals, PCBs, PCNs and PAHs in soils of a highly industrialized chemical/petrochemical area: Temporal trend. Chemosphere 2007, 66, 267–276. [Google Scholar] [CrossRef]


Publisher’s Note: MDPI stays neutral with regard to jurisdictional claims in published maps and institutional affiliations. |
© 2022 by the authors. Licensee MDPI, Basel, Switzerland. This article is an open access article distributed under the terms and conditions of the Creative Commons Attribution (CC BY) license (https://creativecommons.org/licenses/by/4.0/).