Ammonium Removal from Aqueous Solutions by Clinoptilolite: Determination of Isotherm and Thermodynamic Parameters and Comparison of Kinetics by the Double Exponential Model and Conventional Kinetic Models

Abstract
:1. Introduction
2. Material and Methods
2.1. Physical Properties of the Clinoptilolite
2.2. Experimental Procedure

2.3. Statistical Analysis of Data


| Isotherm models | Expression * | Adjustable model parameters * | Constraints * |
|---|---|---|---|
| Two-parameter isotherms | |||
| Freundlich [29] |  | Kf, 1/n | n > 1 |
| Langmuir [30] |  | Qm, aL | - |
| D-R [31,32] |  | Qm, E | Qm, E > 0 |
| Tempkin [33] | 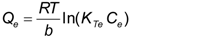 | KTe, b | - |
| Three-parameter isotherms | |||
| Redlich-Peterson [34] | 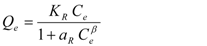 | KR, aR, β | 0 < β < 1 |
| Sips [35] | 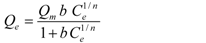 | Qm, 1/n, b | 0 < 1/n < 1 |
| Toth [36] |  | Qm, KT, 1/n | 0 < 1/n < 1 |
| Khan [37] |  | Qm, bK, aK |
3. Results and Discussion
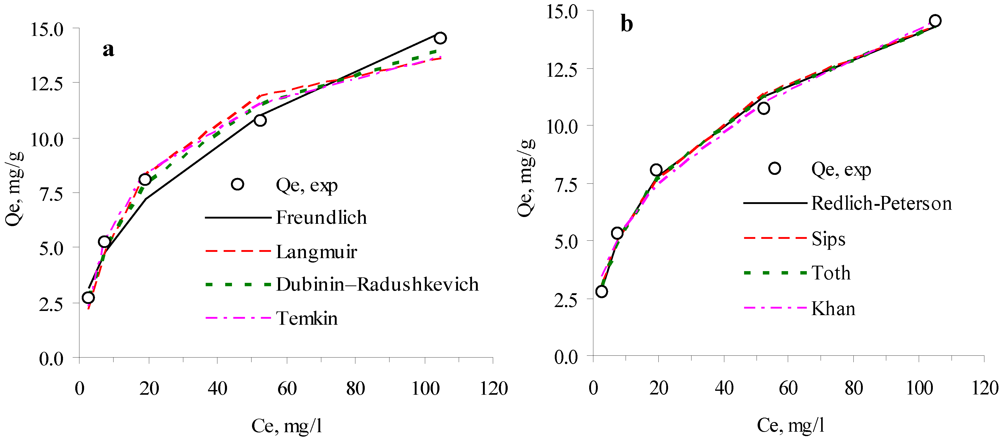
3.1. Adsorption Isotherms

| Two-parameter isotherms | 10 °C | 25 °C | 40 °C | Three-parameter isotherms | 10 °C | 25 °C | 40 °C | |
|---|---|---|---|---|---|---|---|---|
| Freundlich | Redlich-Peterson | |||||||
| Kf | 2.055 | 1.961 | 1.660 | KR | 2.387 | 2.217 | 0.863 | |
| 1/n | 0.424 | 0.434 | 0.464 | aR | 0.610 | 0.585 | 0.084 | |
| R² (non-linear) | 0.986 | 0.987 | 0.962 | β | 0.709 | 0.701 | 0.905 | |
| HYBRID | 7.211 | 6.575 | 17.166 | R² (non-linear) | 0.993 | 0.994 | 0.999 | |
| ΔQ, (%) | 8.093 | 7.692 | 12.487 | HYBRID | 27.832 | 25.424 | 14.187 | |
| Langmuir | ΔQ, (%) | 4.799 | 4.458 | 4.048 | ||||
| aL | 0.056 | 0.052 | 0.045 | Sips | ||||
| Qm | 15.902 | 16.163 | 16.305 | Qm | 33.075 | 33.905 | 17.338 | |
| R² (non-linear) | 0.971 | 0.973 | 0.995 | as | 0.058 | 0.054 | 0.051 | |
| HYBRID | 92.123 | 85.887 | 14.316 | 1/n | 0.551 | 0.560 | 0.913 | |
| ΔQ, (%) | 9.868 | 9.620 | 3.438 | R² (non-linear) | 0.991 | 0.992 | 0.995 | |
| D–R | HYBRID | 39.054 | 35.520 | 18.599 | ||||
| Qm | 19.108 | 19.330 | 19.406 | ΔQ, (%) | 6.348 | 5.943 | 4.366 | |
| E | 7.024 | 7.268 | 7.379 | Toth | ||||
| R² (non-linear) | 0.988 | 0.989 | 0.993 | Qm | 64.023 | 67.410 | 18.309 | |
| HYBRID | 33.750 | 31.798 | 18.461 | KTo | 1.540 | 1.631 | 11.042 | |
| ΔQ, (%) | 3.980 | 3.504 | 5.888 | n | 0.256 | 0.258 | 0.798 | |
| Tempkin | R² (non-linear) | 0.992 | 0.993 | 0.996 | ||||
| KTe | 0.736 | 0.673 | 0.469 | HYBRID | 34.297 | 31.120 | 16.590 | |
| b | 748.321 | 773.183 | 748.566 | ΔQ, (%) | 5.690 | 5.288 | 4.256 | |
| R² (non-linear) | 0.982 | 0.981 | 0.999 | Khan isotherm | ||||
| HYBRID | 51.874 | 54.940 | 3.193 | Qm | 0.180 | 0.161 | 0.145 | |
| ΔQ, (%) | 6.777 | 7.499 | 1.976 | bK | 545.242 | 548.264 | 545.194 | |
| aK | 0.599 | 0.589 | 0.583 | |||||
| R² (non-linear) | 0.988 | 0.989 | 0.969 | |||||
| HYBRID | 52.619 | 48.473 | 131.342 | |||||
| ΔQ, (%) | 8.141 | 7.727 | 13.157 |
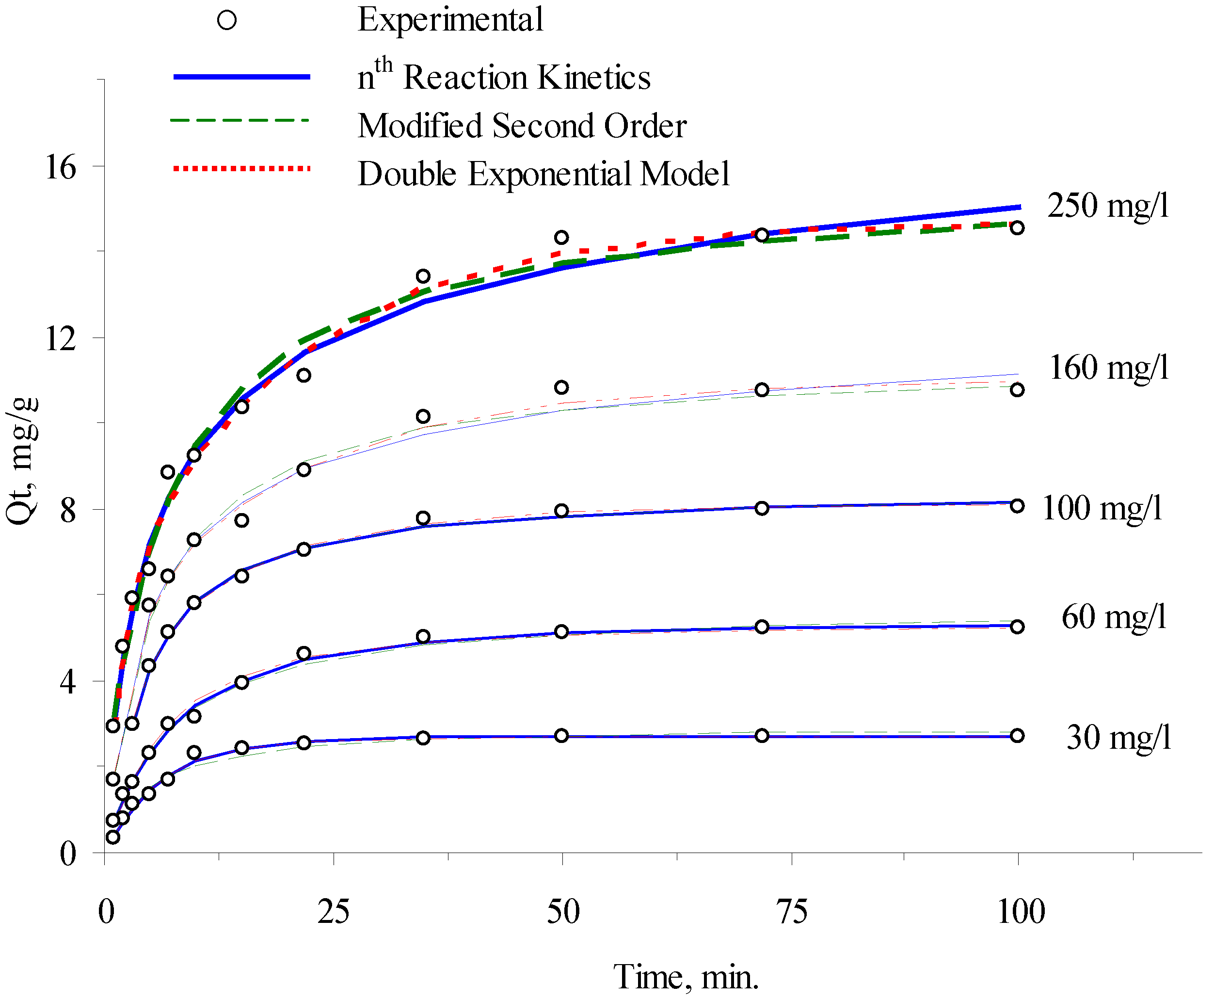
3.2. Adsorption Kinetics

| Ci (initial conc.), mg/L | 30 | 60 | 100 | 160 | 250 |
|---|---|---|---|---|---|
| Qe, exp. (mg/g) | 2.716 | 5.248 | 8.054 | 10.734 | 14.504 |
| nth-order kinetic model | |||||
| Qe, cal., (mg/g) | 2.713 | 5.383 | 8.485 | 13.775 | 20.832 |
| n | 1.162 | 1.446 | 1.961 | 3.419 | 4.162 |
| βn | 0.996 | 1.014 | 0.857 | 0.848 | 1.085 |
| kn (min−1) | 0.173 | 0.123 | 0.231 | 0.220 | 0.174 |
| HIBRID | 0.654 | 0.532 | 0.205 | 1.474 | 2.918 |
| Average Δq (%) | 3.979 | 2.959 | 1.166 | 2.321 | 4.043 |
| R2 | 0.989 | 0.996 | 0.997 | 0.989 | 0.987 |
| Modified second-order model | |||||
| Qe, (mg/g) | 2.961 | 5.819 | 8.518 | 11.499 | 15.621 |
| k2 (min−1) | 0.228 | 0.138 | 0.236 | 0.175 | 0.141 |
| β | 0.901 | 1.002 | 0.839 | 1.004 | 1.113 |
| HIBRID | 0.892 | 0.607 | 0.176 | 1.624 | 3.154 |
| Average Δq (%) | 4.469 | 3.329 | 1.144 | 3.086 | 5.023 |
| R2 | 0.980 | 0.993 | 0.997 | 0.988 | 0.986 |
| Double Exponential Model | |||||
| Qe, (mg/g) | 2.771 | 5.236 | 8.095 | 10.992 | 14.700 |
| D1 | 26.427 | 33.567 | 45.292 | 50.886 | 53.777 |
| D2 | 1.280 | 18.790 | 35.663 | 59.037 | 93.223 |
| KD1 | 0.159 | 0.182 | 0.267 | 0.357 | 0.611 |
| KD2 | 0.009 | 0.050 | 0.059 | 0.048 | 0.051 |
| RF, % | 95.38 | 64.11 | 55.95 | 46.29 | 36.58 |
| SF, % | 4.62 | 35.89 | 44.05 | 53.71 | 63.42 |
| HIBRID | 0.780 | 1.208 | 0.216 | 1.142 | 2.554 |
| Average Δq (%) | 4.682 | 3.903 | 1.233 | 2.516 | 2.841 |
| R2 | 0.990 | 0.992 | 0.998 | 0.994 | 0.991 |
3.2.1. nth-Order Kinetics

3.2.2. Modified Second-Order

3.2.3. Double Exponential Model


3.2.4. Evaluation of Kinetic Studies
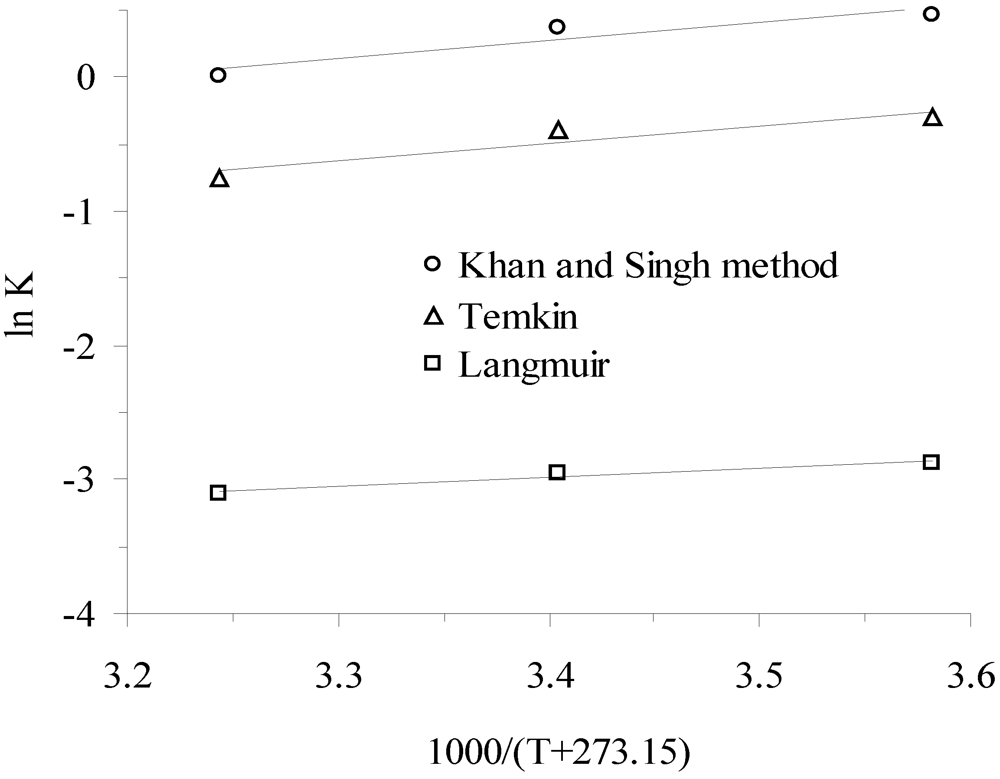
3.3. Thermodynamic Parameters


| Temperature, °C | K * | Slope × 10−3 | Intercept | R2 (linear) | ∆G°, kJ/mol | ∆H°, kJ/mol | ∆S°, J/mol-K |
|---|---|---|---|---|---|---|---|
| KKS | |||||||
| 10 °C | 1.596 | −1.10 | |||||
| 25 °C | 1.454 | 1.34 | −4.20 | 0.877 | −0.93 | −11.11 | −34.95 |
| 40 °C | 1.011 | −0.03 | |||||
| KTe | |||||||
| 10 °C | 0.736 | 0.72 | |||||
| 25 °C | 0.673 | 1.31 | −4.90 | 0.873 | 0.98 | −10.92 | −40.73 |
| 40 °C | 0.469 | 1.97 | |||||
| aL | |||||||
| 10 °C | 0.056 | 6.77 | |||||
| 25 °C | 0.052 | 0.65 | −5.18 | 0.977 | 7.35 | −5.43 | −43.03 |
| 40 °C | 0.045 | 8.07 |
4. Conclusions
Conflict of Interest
References
- Rozic, M.; Cerjan-Stefanovic, S.; Kurajica, S.; Vancina, V.; Hodzic, E. Ammonical nitrogen removal from water treatment with clays and zeolites. Water Res. 2000, 34, 3675–3681. [Google Scholar]
- Tchobanoglous, G.; Burton, F. Metcalf and Eddy Inc. Wastewater Engineering: Treatment, Disposal and Reuse, 3rd ed; McGraw-Hill Inc.: New York, NY, USA, 1991. [Google Scholar]
- Patterson, J.W. Industrial Wastewater Treatment Technology, 2nd ed; Butterworth Publishers: Stoneham, MA, USA, 1985. [Google Scholar]
- Jorgensen, T.C.; Weatherley, L.R. Ammonia removal from wastewater by ion exchange in the presence of organic contaminants. Water Res. 2003, 37, 1723–1728. [Google Scholar]
- Mercer, B.W.; Ames, L.L.; Torhill, C.J.; Slike, W.J.; Dean, R.B. Ammonia removal from secondary effluents by selective ion exchange. J. Water Poll. Control Fed. 1970, 42, R95–R107. [Google Scholar]
- Wang, Y.; Liu, S.; Xu, Z.; Han, T.; Chuan, S.; Zhu, T. Ammonia removal from leachate solution using natural Chinese clinoptilolite. J. Hazard. Mater. 2006, B136, 735–740. [Google Scholar]
- Karadag, D.; Koc, Y.; Turan, M.; Armagan, B. Removal of ammonium ion from aqueous solution using natural Turkish clinoptilolite. J. Hazard. Mater. 2006, B136, 604–609. [Google Scholar]
- Demir, A.; Gunay, A.; Debik, E. Ammonium removal from aqueous solution by ion-exchange using packed bed natural zeolite. Water SA 2002, 28, 329–335. [Google Scholar]
- Sarioglu, M. Removal of ammonium from municipal wastewater using natural Turkish (Dogantepe) zeolite. Sep. Purif. Technol. 2005, 41, 1–11. [Google Scholar]
- Ramos, R.L.; Armenta, G.A.; Gutierrez, L.V.G.; Coronado, R.M.G.; Barron, J.M. Ammonia exchange on clinoptilolite from mineral deposits located in Mexico. J. Chem. Technol. Biot. 2004, 79, 651–657. [Google Scholar]
- Gao, L.; Wang, Y.; Xu, Y.; Zhou, S.L.; Zhuang, T.T.; Wu, Z.Y.; Zhu, J.H. New strategy to reduce the harmful effects of smoking: Reducing the level of N-nitrosamines in mainstream smoke by NaA zeolite and in vitro and in vivo investigations. Clean 2008, 36, 270–278. [Google Scholar]
- Turan, N.G.; Ergun, O.N. Improving the quality of municipal solid waste compost by using expanded perlite and natural zeolite. Clean 2008, 36, 330–334. [Google Scholar]
- Curkovic, L.; Stefanovic, S.C.; Filipan, T. Metal ion exchange by natural and modified zeolites. Water Res. 1997, 31, 1379–1382. [Google Scholar]
- Günay, A.; Arslankaya, E.; Tosun, İ. Lead removal from aqueous solution by natural and pretreated clinoptilolite: Adsorption equilibrium and kinetics. J. Hazard. Mater. 2007, 146, 362–371. [Google Scholar] [CrossRef]
- Kılıç, M.; Yazıcı, H.; Solak, M. A comprehensive study on removal and recovery of copper(II) from aqueous solutions by NaOH-pretreated Marrubium globosum ssp. globosum leaves powder: Potential for utilizing the copper(II) condensed desorption solutions in agricultural applications. Bioresour. Technol. 2009, 100, 2130–2137. [Google Scholar] [CrossRef]
- Li, M.; Zhu, X.; Zhu, F.; Ren, G.; Cao, G.; Song, L. Application of modified zeolite for ammonium removal from drinking water. Desalination 2011, 271, 295–300. [Google Scholar]
- Inglezakis, V.J.; Hadjiandreou, K.J.; Loizidou, M.D.; Grigoropoulou, H.P. Pretreatment of natural clinoptilolite in a laboratory-scale ion exchange packed bed. Water Res. 2001, 35, 2161–2166. [Google Scholar]
- Semmens, M.J.; Martin, W.P. Influence of pretreatment on the capacity and selectivity of clinoptilolite for metal ions. Water Res. 1988, 22, 537–542. [Google Scholar]
- Rivas, F.J.; Beltrán, F.J.; Gimeno, O.; Frades, J.; Carvalho, F. Adsorption of landfill leachates onto activated carbon Equilibrium and kinetics. J. Hazard. Mater. 2006, B131, 170–178. [Google Scholar]
- Aksu, Z.; İşoğlu, İ.A. Removal of copper(II) ions from aqueous solution by biosorption onto agricultural waste sugar beet pulp. Process Biochem. 2005, 40, 3031–3044. [Google Scholar] [CrossRef]
- Arican, B.; Gokcay, C.F.; Yetis, U. Mechanistics of nickel sorption by activated sludge. Process Biochem. 2002, 37, 1307–1315. [Google Scholar]
- Han, R.; Wang, Y.; Han, P.; Shi, J.; Yang, J.; Lub, Y. Removal of methylene blue from aqueous solution by chaff in batch mode. J. Hazard. Mater. 2006, B137, 550–557. [Google Scholar]
- Argun, M.E.; Dursun, S.; Ozdemir, C.; Karatas, M. Heavy metal adsorption by modified oak sawdust: Thermodynamics and kinetics. J. Hazard. Mater. 2007, 141, 77–85. [Google Scholar]
- Choi, J.-W.; Choi, N.-C.; Lee, S.-J.; Kim, D.-J. Novel three-stage kinetic model for aqueous benzene adsorption on activated carbon. J. Colloid Interf. Sci. 2007, 314, 367–372. [Google Scholar]
- Standard Methods for the Examination of Water and Wastewater, 19th ed; American Public Health Association/American Water Works Association/Water Environment Federation: Washington, DC, USA, 1995.
- Chowdhury, S.; Saha, P. Adsorption kinetic modeling of safranin onto rice husk biomatrix using pseudo-first- and pseudo-second-order kinetic models: Comparison of linear and non-linear methods. Clean 2011, 39, 274–282. [Google Scholar]
- Porter, J.F.; McKay, G.; Choy, K.H. The prediction of sorption from a binary mixture of acidic dyes using single- and mixed isotherm variants of the ideal adsorbed solute theory. Chem. Eng. Sci. 1999, 54, 5863–5885. [Google Scholar]
- Kapoor, A.; Yang, R.T. Surface diffusion on energetically heterogeneous surfaces. AIChE J. 1989, 35, 1735–1738. [Google Scholar]
- Freundlich, H.M.F. Over the adsorption in solution. J. Phys. Chem. 1906, 57, 385–470. [Google Scholar]
- Langmuir, I. The adsorption of gases on plane surfaces of glass, mica and platinum. J. Am. Chem.Soc. 1918, 40, 1361–1403. [Google Scholar]
- Dubinin, M.M.; Radushkevich, L.V. Equation of the characteristic curve of activated charcoal. Chem. Zentr. 1947, 1, 875–890. [Google Scholar]
- Dubinin, M.M. The potential theory of adsorption of gases and vapors for adsorbents with energetically non-uniform surface. Chem. Rev. 1960, 60, 235–266. [Google Scholar]
- Tempkin, M.I.; Pyzhev, V. Kinetics of ammonia synthesis on promoted iron catalysts. Acta Physiochim. 1940, URSS 12, 217–222. [Google Scholar]
- Redlich, O.J.; Peterson, D.L. A useful adsorption isotherm. J. Phys. Chem. 1959, 63, 1024–1026. [Google Scholar]
- Sips, R. On the structure of a catalyst surface. J. Chem. Phys. 1948, 16, 490–495. [Google Scholar]
- Toth, J. State equations of the solid gas interface layer. Acta Chem. Acad. Hung. 1971, 69, 311–317. [Google Scholar]
- Khan, A.R.; Al-Waheab, I.R.; Al-Haddad, A. Generalized equation for adsorption isotherms for multicomponent organic pollutants in dilute aqueous solution. Environ. Technol. 1996, 17, 13–23. [Google Scholar]
- Gunay, A. Application of nonlinear regression analysis for ammonium exchange by natural (Bigadic) clinoptilolite. J. Hazard. Mater. 2007, 148, 708–713. [Google Scholar]
- Özer, A. Removal of Pb(II) ions from aqueous solutions by sulphuric acid-treated wheat bran. J. Hazard. Mater. 2007, 141, 753–761. [Google Scholar]
- Cheung, C.W.; Porter, J.F.; McKay, G. Sorption kinetic analysis for the removal of cadmium ions from effluents using bone char. Water Res. 2001, 35, 605–612. [Google Scholar]
- Suzuki, M. Adsorption Engineering; Elsevier Science Publishing Company Inc.: New York, NY, USA, 1990. [Google Scholar]
- Chiron, N.; Guilet, R.; Deydier, E. Adsorption of Cu(II) and Pb(II) onto a grafted silica: Isotherms and kinetic models. Water Res. 2003, 37, 3079–3086. [Google Scholar]
- Wilczak, A.; Keinath, T.M. Kinetics of sorption and desorption of copper(II) and lead(II) on activated carbon. Water Environ. Res. 1993, 65, 238–244. [Google Scholar]
- Blázquez, G.; Mártin-Lara, M.A.; Tenorio, G.; Calero, M. Batch biosorption of lead(II) from aqueous solutions by olive tree pruning waste: Equilibrium, kinetics and thermodynamic study. Chem. Eng. J. 2011, 168, 170–177. [Google Scholar]
- Ghaedi, M.; Ghezelbash, G.R.; Marahel, F.; Ehsanipour, S.; Najibi, A.; Soylak, M. Equilibrium, thermodynamic, and kinetic studies on lead (II) biosorption from aqueous solution by Saccharomyces cerevisiae biomass. Clean 2010, 38, 877–885. [Google Scholar]
- Khan, A.A.; Singh, R.P. Adsorption thermodynamics of carbofuran on Sn (IV) arsenosilicate in H+, Na+ and Ca2+ forms. Colloids Surf. 1987, 24, 33–42. [Google Scholar]
© 2012 by the authors; licensee MDPI, Basel, Switzerland. This article is an open-access article distributed under the terms and conditions of the Creative Commons Attribution license (http://creativecommons.org/licenses/by/3.0/).
Share and Cite
Tosun, İ. Ammonium Removal from Aqueous Solutions by Clinoptilolite: Determination of Isotherm and Thermodynamic Parameters and Comparison of Kinetics by the Double Exponential Model and Conventional Kinetic Models. Int. J. Environ. Res. Public Health 2012, 9, 970-984. https://doi.org/10.3390/ijerph9030970
Tosun İ. Ammonium Removal from Aqueous Solutions by Clinoptilolite: Determination of Isotherm and Thermodynamic Parameters and Comparison of Kinetics by the Double Exponential Model and Conventional Kinetic Models. International Journal of Environmental Research and Public Health. 2012; 9(3):970-984. https://doi.org/10.3390/ijerph9030970
Chicago/Turabian StyleTosun, İsmail. 2012. "Ammonium Removal from Aqueous Solutions by Clinoptilolite: Determination of Isotherm and Thermodynamic Parameters and Comparison of Kinetics by the Double Exponential Model and Conventional Kinetic Models" International Journal of Environmental Research and Public Health 9, no. 3: 970-984. https://doi.org/10.3390/ijerph9030970
APA StyleTosun, İ. (2012). Ammonium Removal from Aqueous Solutions by Clinoptilolite: Determination of Isotherm and Thermodynamic Parameters and Comparison of Kinetics by the Double Exponential Model and Conventional Kinetic Models. International Journal of Environmental Research and Public Health, 9(3), 970-984. https://doi.org/10.3390/ijerph9030970