IL-22 mRNA Expression in Blood Samples as a Useful Biomarker for Assessing the Adverse Health Effects of PCBs on Allergic Children

Abstract
:1. Introduction
2. Materials and Methods
2.1. Subjects
2.2. PCBs Assessment
2.3. Quantitative Real-Time PCR (q-RT-PCR)
2.4. Statistical Methods
3. Results

| All | Negative (egg and milk and wheat) | Positive (egg and/or milk and/or wheat) | |||||||
|---|---|---|---|---|---|---|---|---|---|
| Primer | +50 m (N = 22) | <50 m (N = 8) | p value | +50 m (N = 6) | <50 m (N = 2) | p value | +50 m (N = 16) | <50 m (N = 6) | p value |
| median (95%CI) | median (95%CI) | median (95%CI) | median (95%CI) | median (95%CI) | median (95%CI) | ||||
| IL6 | 1.25 (0.99, 2.69) | 1.85 (1.14, 5.24) | 0.348 | 0.89 (0.45, 12.9) | 1.57 (0.90, 2.25) | 0.739 | 1.28 (1.07, 2.73) | 1.85 (1.27, 6.46) | 0.238 |
| IL8 | 1.02 (0.75, 1.81) | 1.65 (0.81, 3.95) | 0.174 | 1.45 (1.00, 2.34) | 1.17 (0.63, 1.71) | 0.505 | 0.96 (0.59, 2.06) | 2.03 (0.96, 6.46) | 0.090 |
| IL10 | 2.52 (1.63, 3.33) | 2.00 (0.95, 2.54) | 0.205 | 2.88 (1.05, 7.77) | 1.74 (1.32, 2.17) | 0.317 | 2.43 (1.57, 3.53) | 2.00 (0.35, 2.68) | 0.461 |
| IL17 | 1.47 (1.23, 1.56) | 1.69 (1.09, 2.34) | 0.425 | 0.73 (0.30, 1.71) | 1.19 (1.18, 1.20) | 0.505 | 1.51 (1.28, 2.13) | 1.86 (0.98, 2.46) | 0.302 |
| IL22 | 28.3 (9.51, 56.9) | 119 (42.8, 318) | 0.010 | 2.39 (0.95, 33.1) | 54.6 (53.0, 56.2) | 0.046 | 47.8 (21.1, 90.8) | 231 (27.9, 325) | 0.023 |
| COX2 | 0.59 (0.42, 1.01) | 0.79 (0.29, 1.00) | 0.888 | 0.97 (0.21, 1.16) | 0.50 (0.11, 0.89) | 0.182 | 0.49 (0.39, 0.95) | 0.79 (0.41, 1.11) | 0.269 |
| CYP1A1 | 6.86 (1.75, 8.28) | 14.2 (7.33, 32.5) | 0.010 | 1.25 (0.65, 6.83) | 11.6 (9.92, 13.2) | 0.046 | 7.32 (3.57, 12.4) | 16.0 (5.74, 40.4) | 0.065 |
| Foxp3 | 1.55 (1.24, 1.86) | 1.72 (1.07, 2.03) | 0.673 | 0.72 (0.38, 1.88) | 1.12 (1.10, 1.14) | 0.505 | 1.61 (1.29, 2.24) | 1.82 (1.07, 2.22) | 0.507 |
| SOCS3 | 1.57 (1.27, 1.78) | 1.81 (1.11, 2.08) | 0.425 | 0.71 (0.36, 1.85) | 1.18 (1.15, 1.20) | 0.505 | 1.65 (1.31, 2.21) | 1.91 (1.10, 2.30) | 0.338 |
| RelB | 1.61 (1.29, 1.86) | 1.85 (1.10, 2.13) | 0.512 | 0.71 (0.36, 1.95) | 1.14 (1.14, 1.15) | 0.505 | 1.67 (1.34, 2.28) | 1.92 (1.11, 2.35) | 0.376 |
| Egg | Milk | Wheat | |||||||||
|---|---|---|---|---|---|---|---|---|---|---|---|
| primer | all (N = 30) | negative (N = 12) | positive (N = 18) | p value | negative (N = 22) | positive (N = 8) | p value | negative (N = 22) | positive (N = 8) | p value | |
| median (95%CI) | median (95%CI) | median (95%CI) | median (95%CI) | median (95%CI) | median (95%CI) | median (95%CI) | |||||
| IL6 | 1.34 (1.14, 2.26) | 1.19 (0.79, 6.29) | 1.41 (1.21, 2.56) | 0.582 | 1.43 (1.13, 2.80) | 1.32 (0.84, 3.69) | 0.639 | 1.43 (1.19, 2.69) | 1.19 (0.63, 6.82) | 0.482 | |
| IL8 | 1.33 (0.95, 1.79) | 1.21 (0.64, 1.79) | 1.40 (0.91, 2.36) | 0.612 | 1.16 (0.75, 1.71) | 2.03 (0.77, 4.58) | 0.189 | 1.16 (0.69, 1.71) | 2.37 (0.85, 4.78) | 0.083 | |
| IL10 | 2.26 (1.79, 2.58) | 2.35 (1.35, 3.81) | 2.26 (1.68, 2.57) | 0.612 | 2.17 (1.53, 3.33) | 2.41 (1.41, 2.62) | 0.963 | 2.35 (1.53, 3.33) | 2.14 (1.26, 2.53) | 0.453 | |
| IL17 | 1.50 (1.25, 1.67) | 1.22 (0.51, 1.99) | 1.55 (1.31, 1.69) | 0.352 | 1.54 (1.20, 1.70) | 1.42 (0.75, 2.17) | 0.888 | 1.55 (1.25, 1.77) | 1.28 (0.35, 1.79) | 0.159 | |
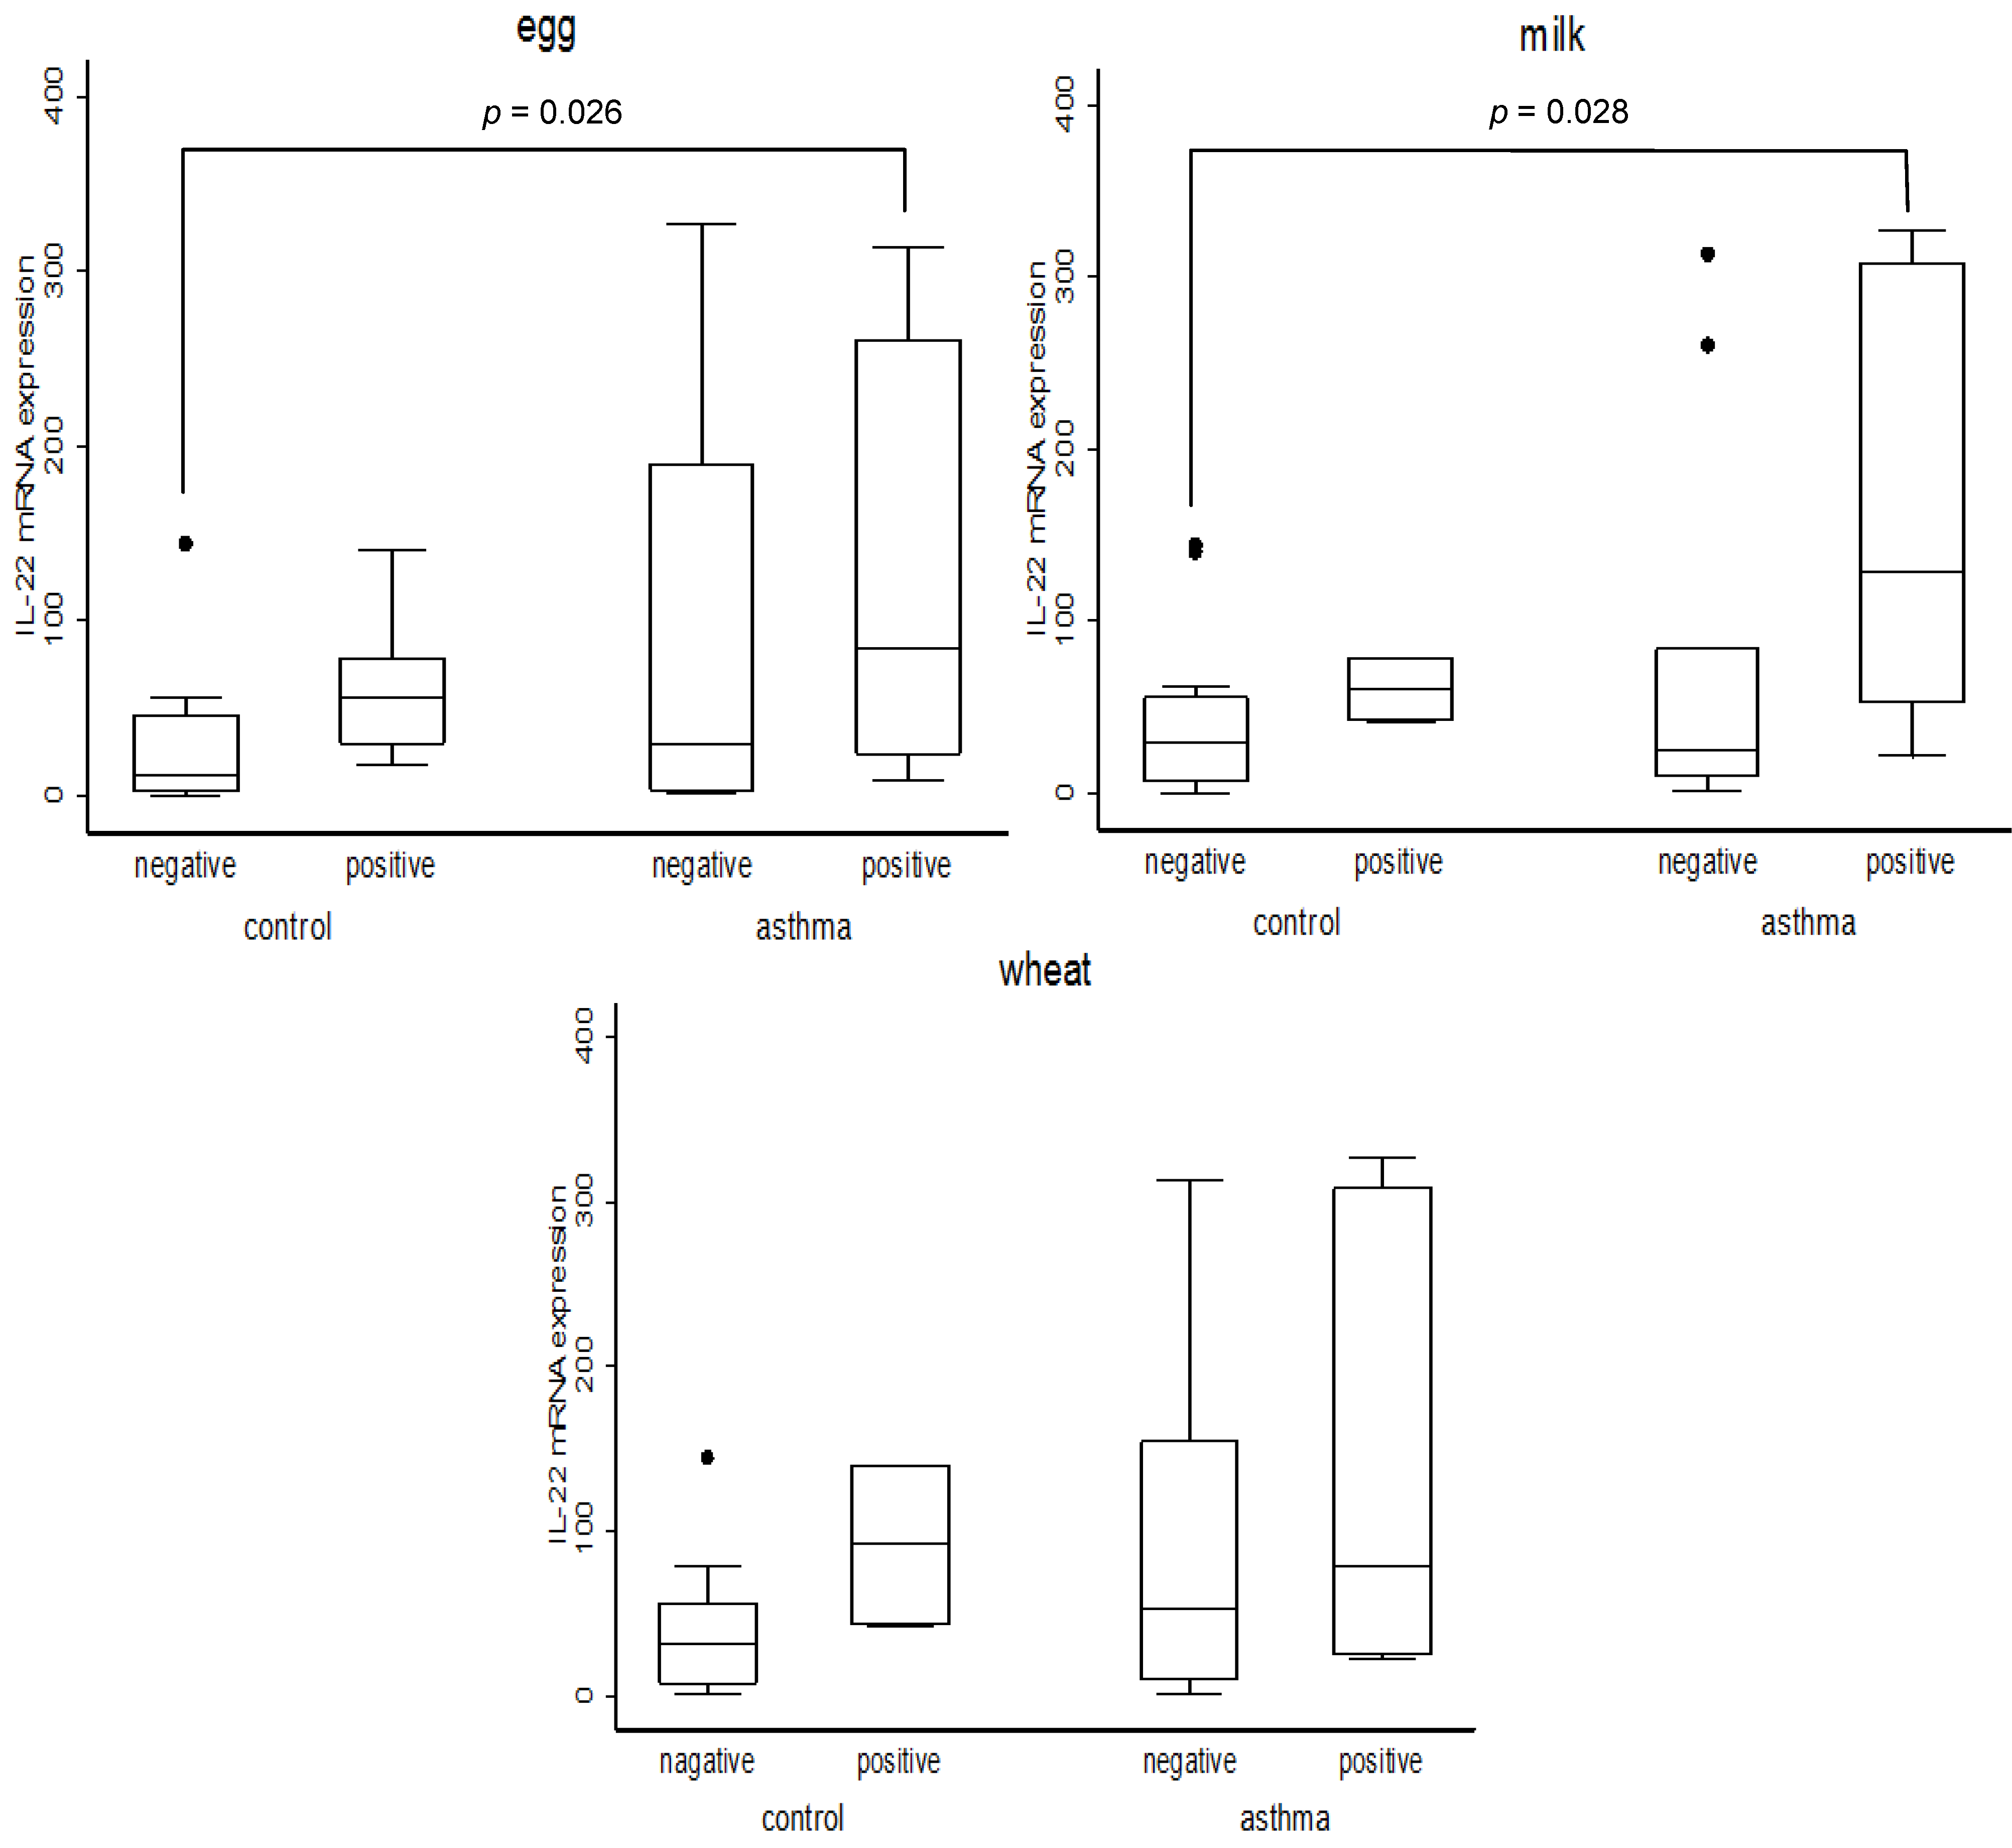
| IL22 | 47.6 (22.0, 76.6) | 12.3 (1.56, 55.8) | 59.1 (27.4, 130) | 0.022 | 28.3 (9.51, 56.9) | 91.3 (35.5, 314) | 0.031 | 33.2 (9.51, 62.9) | 78.6 (23.4, 314) | 0.111 | |
| COX2 | 0.68 (0.42, 0.94) | 0.81 (0.32, 1.09) | 0.59 (0.41, 0.91) | 0.612 | 0.59 (0.41, 0.95) | 0.74 (0.41, 1.75) | 0.399 | 0.63 (0.42, 0.95) | 0.68 (0.37, 1.75) | 0.673 | |
| CYP1A1 | 7.50 (4.03, 11.8) | 5.03 (1.24, 12.9) | 8.17 (5.47, 14.4) | 0.271 | 7.21 (2.20, 12.8) | 7.92 (3.89, 25.0) | 0.639 | 7.74 (3.23, 13.3) | 6.54 (0.72, 22.2) | 0.639 | |
| Foxp3 | 1.61 (1.26, 1.85) | 1.20 (0.51, 1.88) | 1.68 (1.33, 1.88) | 0.352 | 1.66 (1.14, 1.87) | 1.50 (0.82, 2.03) | 0.851 | 1.74 (1.25, 1.89) | 1.29 (0.37, 1.76) | 0.146 | |
| SOCS3 | 1.65 (1.29, 1.81) | 1.25 (0.49, 1.85) | 1.71 (1.33, 1.93) | 0.352 | 1.71 (1.20, 1.85) | 1.52 (0.83, 2.08) | 0.815 | 1.76 (1.30, 1.87) | 1.30 (0.34, 1.83) | 0.146 | |
| RelB | 1.67 (1.29, 1.87) | 1.24 (0.49, 1.95) | 1.73 (1.37, 1.92) | 0.374 | 1.72 (1.15, 1.91) | 1.57 (0.84, 2.13) | 0.888 | 1.81 (1.33, 1.93) | 1.31 (0.36, 1.87) | 0.146 | |
| total PCBs tertile | negative (N) | median (95%CI) | positive (N) | median (95%CI) | p value |
|---|---|---|---|---|---|
| low | 6 | 6.33 (1.20, 132) | 4 | 81.4 (30.4, 140) | 0.088 |
| medium | 2 | 54.6 (53.0, 56.2) | 8 | 41.3 (15.2, 278) | 1.000 |
| high | 4 | 18.7 (1.00, 326) | 6 | 57.6 (26.0, 293) | 0.286 |
| total PCBs tertile | negative (N) | median (95%CI) | positive (N) | median (95%CI) | p value |
|---|---|---|---|---|---|
| low | 9 | 17.5 (3.61, 136) | 1 | 78.8 (78.8, 78.8) | 0.602 |
| medium | 8 | 54.6 (15.2, 278) | 2 | 62.7 (21.6, 104) | 1.000 |
| high | 5 | 24.2 (1.00, 61.7) | 5 | 154 (42.1, 326) | 0.028 |
| PCB | negative (N) | median (95%CI) | positive (N) | median (95%CI) | p value |
|---|---|---|---|---|---|
| #61 + 74 | 5 | 26.1 (1.00, 61.7) | 5 | 154 (42.1, 326) | 0.076 |
| #99 | 5 | 24.2 (1.00, 313) | 5 | 53.5 (21.6, 326) | 0.347 |
| #118 | 6 | 25.2 (1.03, 61.1) | 4 | 104 (21.6, 326) | 0.201 |
| #138 | 4 | 18.7 (1.00, 61.7) | 6 | 104 (21.6, 324) | 0.088 |
| #146 | 5 | 24.2 (1.00, 61.7) | 5 | 154 (42.1, 326) | 0.028 |
| #153 | 5 | 24.2 (1.00, 61.7) | 5 | 177 (42.1, 327) | 0.028 |
| #156 | 5 | 9.70 (1.00, 61.7) | 5 | 104 (42.1, 308) | 0.028 |
| #163 + 164 | 4 | 18.7 (1.00, 61.7) | 6 | 129 (43.3, 324) | 0.033 |
| #170 | 4 | 18.7 (1.00, 61.7) | 6 | 129 (43.3, 324) | 0.033 |
| #177 | 4 | 18.7 (1.00, 61.7) | 6 | 129 (43.3, 324) | 0.033 |
| #178 | 4 | 18.7 (1.00, 61.7) | 6 | 129 (43.3, 324) | 0.033 |
| #180 + 193 | 4 | 18.7 (1.00, 61.7) | 6 | 129 (43.3, 324) | 0.033 |
| #183 | 5 | 24.2 (1.00, 61.7) | 5 | 154 (42.1, 326) | 0.028 |
| #182 + 187 | 5 | 24.2 (1.00, 61.7) | 5 | 104 (42.1, 308) | 0.028 |
| #194 | 5 | 36.0 (1.00, 61.7) | 5 | 104 (42.1, 308) | 0.076 |
| #198 + 199 | 5 | 24.2 (1.00, 61.7) | 5 | 104 (42.1, 308) | 0.028 |
| PCB | negative (N) | median (95%CI) | positive (N) | median (95%CI) | p value |
|---|---|---|---|---|---|
| individual PCB low concentration group | |||||
| #156 * | 6 | 6.33 (1.20, 132) | 5 | 83.9 (30.4, 313) | 0.045 |
| #182 + 187 | 6 | 6.33 (1.20, 132) | 4 | 81.4 (30.4, 140) | 0.088 |
| #194 | 5 | 7.02 (0.95, 145) | 5 | 140 (30.4, 313) | 0.047 |
| #198 + 199 | 5 | 7.02 (0.95, 145) | 5 | 140 (30.4, 313) | 0.047 |
| individual PCB medium concentration group | |||||
| #156 ** | 3 | 56.2 (53.0, 326) | 6 | 25.2 (18.2, 240) | 0.197 |
| #182 + 187 | 3 | 56.2 (53.0, 326) | 7 | 26.2 (12.2, 297) | 0.305 |
| #194 | 4 | 54.6 (3.44, 326) | 6 | 22.9 (10.5, 78.2) | 0.394 |
| #198 + 199 | 4 | 54.6 (3.44, 326) | 6 | 23.9 (10.5, 81.2) | 0.670 |
| individual PCB high concentration group | |||||
| #156 | 3 | 1.33 (1.00, 36.0) | 7 | 61.7 (19.9, 260) | 0.030 |
| #182 + 187 | 3 | 1.33 (1.00, 36.0) | 7 | 61.7 (19.9, 260) | 0.030 |
| #182 + 187 | 3 | 1.33 (1.00, 36.1) | 7 | 61.7 (29.8, 260) | 0.030 |
| #194 | 3 | 1.33 (1.00, 36.2) | 7 | 61.7 (45.7, 260) | 0.017 |
| #198 + 199 | 3 | 1.33 (1.00, 36.3) | 7 | 61.7 (29.8, 260) | 0.030 |

4. Discussion
Acknowledgments
Conflict of Interest
References
- Eubig, P.A.; Aguiar, A.; Schantz, S.L. Lead and PCBs as risk factors for attention deficit/hyperactivity disorder. Environmen. Health Perspect. 2010, 118, 1654–1667. [Google Scholar] [CrossRef]
- Burns, J.S.; Williams, P.L.; Sergeyev, O.; Korrick, S.; Lee, M.M.; Revich, B.; Altshul, L.; Del Prato, J.T.; Humblet, O.; Patterson, D.G., Jr.; Turner, W.E.; Needham, L.L.; Starovoytov, M.; Hauser, R. Serum dioxins and polychlorinated biphenyls are associated with growth among Russian boys. Pediatrics 2011, 127, e59–e68. [Google Scholar]
- Fitzgerald, E.F.; Belanger, E.E.; Gomez, M.I.; Cayo, M.; McCaffrey, R.J.; Seegal, R.F.; Jansing, R.L.; Hwang, S.A.; Hicks, H.E. Polychlorinated biphenyl exposure and neuropsychological status among older residents of upper Hudson River communities. Environ. Health Perspect. 2008, 116, 209–215. [Google Scholar]
- Tashakkor, A.Y.; Chow, K.S.; Carlsten, C. Modification by antioxidant supplementation of changes in human lung function associated with air pollutant exposure: A systematic review. BMC Public Health 2011, 11, 532. [Google Scholar] [CrossRef]
- Mann, J.K.; Balmes, J.R.; Bruckner, T.A.; Mortimer, K.M.; Margolis, H.G.; Pratt, B.; Hammond, S.K.; Lurmann, F.W.; Tager, I.B. Short-term effects of air pollution on wheeze in asthmatic children in Fresno, California. Environmen. Health Perspect. 2010, 118, 1497–1502. [Google Scholar] [CrossRef]
- Jarup, L. Hazards of heavy metal contamination. Brit. Med. Bull. 2003, 68, 167–182. [Google Scholar] [CrossRef]
- Sakamoto, M.; Feng, X.; Li, P.; Qiu, G.; Jiang, H.; Yoshida, M.; Iwaia, T.; Liu, X.J.; Murata, K. High exposure of Chinese mercury mine workers to elemental mercury vapor and increased methylmercury levels in their hair. Environ. Health Prev. Med. 2007, 12, 66–70. [Google Scholar] [CrossRef]
- Przyrembel, H.; Heinrich-Hirsch, B.; Vieth, B. Exposition to and health effects of residues in human milk. Advan. Experiment. Med. Biol. 2000, 478, 307–325. [Google Scholar]
- Gallagher, R.P.; Macarthur, A.C.; Lee, T.K.; Weber, J.P.; Leblanc, A.; Mark Elwood, J.; Borugian, M.; Abanto, Z.; Spinelli, J.J. Plasma levels of polychlorinated biphenyls and risk of cutaneous malignant melanoma: A preliminary study. Int. J. Cancer 2011, 128, 1872–1880. [Google Scholar] [CrossRef]
- Dutta, S.K.; Mitra, P.S.; Ghosh, S.; Zang, S.; Sonneborn, D.; Hertz-Picciotto, I.; Trnovec, T.; Palkovicova, L.; Sovcikova, E.; Ghimbovschi, S.; Hoffman, E.P. Differential gene expression and a functional analysis of PCB-exposed children: Understanding disease and disorder development. Environ. Int. 2012, 40, 143–154. [Google Scholar] [CrossRef]
- Mitra, P.S.; Ghosh, S.; Zang, S.; Sonneborn, D.; Hertz-Picciotto, I.; Trnovec, T.; Palkovicova, L.; Sovcikova, E.; Ghimbovschi, S.; Hoffman, E.P.; Dutta, S.K. Analysis of the toxicogenomic effects of exposure to persistent organic pollutants (POPs) in Slovakian girls: Correlations between gene expression and disease risk. Environ. Int. 2012, 39, 188–199. [Google Scholar] [CrossRef]
- Tsuji, M.; Vogel, C.F.; Koriyama, C.; Akiba, S.; Katoh, T.; Kawamoto, T.; Matsumura, F. Association of serum levels of polychlorinated biphenyls with IL-8 mRNA expression in blood samples from asthmatic and non-asthmatic Japanese children. Chemosphere 2012, 87, 1228–1234. [Google Scholar] [CrossRef]
- Vogel, C.F.; Sciullo, E.; Wong, P.; Kuzmicky, P.; Kado, N.; Matsumura, F. Induction of proinflammatory cytokines and C-reactive protein in human macrophage cell line U937 exposed to air pollution particulates. Environmen. Health Perspect. 2005, 113, 1536–1541. [Google Scholar] [CrossRef]
- Wu, J.; Teng, M.; Gao, L.; Zheng, M. Background air levels of polychlorinated biphenyls in China. Sci. Total Environ. 2011, 409, 1818–1823. [Google Scholar] [CrossRef]
- Andersson, H.; Piras, E.; Demma, J.; Hellman, B.; Brittebo, E. Low levels of the air pollutant 1-nitropyrene induce DNA damage, increased levels of reactive oxygen species and endoplasmic reticulum stress in human endothelial cells. Toxicology 2009, 262, 57–64. [Google Scholar] [CrossRef]
- Fujiyoshi, P.T.; Michalek, J.E.; Matsumura, F. Molecular epidemiologic evidence for diabetogenic effects of dioxin exposure in U.S. Air force veterans of the Vietnam war. Environ. Health Perspect. 2006, 114, 1677–1683. [Google Scholar]
- Commins, S.; Steinke, J.W.; Borish, L. The extended IL-10 superfamily: IL-10, IL-19, IL-20, IL-22, IL-24, IL-26, IL-28, and IL-29. J. Allergy Clin. Immun. 2008, 121, 1108–1111. [Google Scholar] [CrossRef]
- Besnard, A.G.; Sabat, R.; Dumoutier, L.; Renauld, J.C.; Willart, M.; Lambrecht, B.; Teixeira, M.M.; Charron, S.; Fick, L.; Erard, F.; Warszawska, K.; Wolk, K.; Quesniaux, V.; Ryffel, B.; Togbe, D. Dual role of IL-22 in allergic airway inflammation and its cross-talk with IL-17A. Amer. J. Respir. Criti. Care Med. 2011, 183, 1153–1163. [Google Scholar] [CrossRef]
- Farfariello, V.; Amantini, C.; Nabissi, M.; Morelli, M.B.; Aperio, C.; Caprodossi, S.; Carlucci, A.; Bianchi, A.M.; Santoni, G. IL-22 mRNA in peripheral blood mononuclear cells from allergic rhinitic and asthmatic pediatric patients. Pediat. Allergy Immun.: Off. Publ. Eur. Soc. Pediat. Allergy Immun. 2011, 22, 419–423. [Google Scholar]
- Zhu, J.; Cao, Y.; Li, K.; Wang, Z.; Zuo, P.; Xiong, W.; Xu, Y.; Xiong, S. Increased expression of aryl hydrocarbon receptor and interleukin 22 in patients with allergic asthma. Asian Pac. J. Allergy Immun. 2011, 29, 266–272. [Google Scholar]
- Martino, D.J.; Bosco, A.; McKenna, K.L.; Hollams, E.; Mok, D.; Holt, P.G.; Prescott, S.L. T-cell activation genes differentially expressed at birth in CD4+ T-cells from children who develop IgE food allergy. Allergy 2012, 67, 191–200. [Google Scholar] [CrossRef]
- Mitra, A.; Raychaudhuri, S.K.; Raychaudhuri, S.P. Functional role of IL-22 in psoriatic arthritis. Arthritis Res. Ther. 2012, 14, R65. [Google Scholar] [CrossRef]
- Van Den Heuvel, R.L.; Koppen, G.; Staessen, J.A.; Hond, E.D.; Verheyen, G.; Nawrot, T.S.; Roels, H.A.; Vlietinck, R.; Schoeters, G.E. Immunologic biomarkers in relation to exposure markers of PCBs and dioxins in Flemish adolescents (Belgium). Environ. Health Perspect. 2002, 110, 595–600. [Google Scholar]
- Noakes, P.S.; Taylor, P.; Wilkinson, S.; Prescott, S.L. The relationship between persistent organic pollutants in maternal and neonatal tissues and immune responses to allergens: A novel exploratory study. Chemosphere 2006, 63, 1304–1311. [Google Scholar] [CrossRef]
- Grandjean, P.; Poulsen, L.K.; Heilmann, C.; Steuerwald, U.; Weihe, P. Allergy and sensitization during childhood associated with prenatal and lactational exposure to marine pollutants. Environ. Health Perspect. 2010, 118, 1429–1433. [Google Scholar] [CrossRef]
- Plopper, C.G.; Hyde, D.M. The non-human primate as a model for studying COPD and asthma. Pulm. Pharmacol. Ther. 2008, 21, 755–766. [Google Scholar] [CrossRef]
- Zheng, T.; Holford, T.R.; Mayne, S.T.; Tessari, J.; Ward, B.; Carter, D.; Owens, P.H.; Boyle, P.; Dubrow, R.; Archibeque-Engle, S.; Dawood, O.; Zahm, S.H. Risk of female breast cancer associated with serum polychlorinated biphenyls and 1,1-dichloro-2,2'-bis(p-chlorophenyl)ethylene. Cancer Epidemiol. Biomarkers Prev. 2000, 9, 167–174. [Google Scholar]
- Zheng, T.; Holford, T.R.; Tessari, J.; Mayne, S.T.; Owens, P.H.; Ward, B.; Carter, D.; Boyle, P.; Dubrow, R.; Archibeque-Engle, S.; Zahm, S.H. Breast cancer risk associated with congeners of polychlorinated biphenyls. Amer. J. Epidemiol. 2000, 152, 50–58. [Google Scholar] [CrossRef]
- Demers, A.; Ayotte, P.; Brisson, J.; Dodin, S.; Robert, J.; Dewailly, E. Plasma concentrations of polychlorinated biphenyls and the risk of breast cancer: A congener-specific analysis. Amer. J. Epidemiol. 2002, 155, 629–635. [Google Scholar] [CrossRef]
- Besnard, A.G.; Togbe, D.; Couillin, I.; Tan, Z.; Zheng, S.G.; Erard, F.; Le Bert, M.; Quesniaux, V.; Ryffel, B. Inflammasome-IL-1-Th17 response in allergic lung inflammation. J. Mol. Cell Biol. 2012, 4, 3–10. [Google Scholar] [CrossRef]
© 2012 by the authors; licensee MDPI, Basel, Switzerland. This article is an open-access article distributed under the terms and conditions of the Creative Commons Attribution license (http://creativecommons.org/licenses/by/3.0/).
Share and Cite
Tsuji, M.; Kawamoto, T.; Koriyama, C.; Matsumura, F. IL-22 mRNA Expression in Blood Samples as a Useful Biomarker for Assessing the Adverse Health Effects of PCBs on Allergic Children. Int. J. Environ. Res. Public Health 2012, 9, 4321-4332. https://doi.org/10.3390/ijerph9124321
Tsuji M, Kawamoto T, Koriyama C, Matsumura F. IL-22 mRNA Expression in Blood Samples as a Useful Biomarker for Assessing the Adverse Health Effects of PCBs on Allergic Children. International Journal of Environmental Research and Public Health. 2012; 9(12):4321-4332. https://doi.org/10.3390/ijerph9124321
Chicago/Turabian StyleTsuji, Mayumi, Toshihiro Kawamoto, Chihaya Koriyama, and Fumio Matsumura. 2012. "IL-22 mRNA Expression in Blood Samples as a Useful Biomarker for Assessing the Adverse Health Effects of PCBs on Allergic Children" International Journal of Environmental Research and Public Health 9, no. 12: 4321-4332. https://doi.org/10.3390/ijerph9124321
APA StyleTsuji, M., Kawamoto, T., Koriyama, C., & Matsumura, F. (2012). IL-22 mRNA Expression in Blood Samples as a Useful Biomarker for Assessing the Adverse Health Effects of PCBs on Allergic Children. International Journal of Environmental Research and Public Health, 9(12), 4321-4332. https://doi.org/10.3390/ijerph9124321