Spatio-Temporal Diffusion Pattern and Hotspot Detection of Dengue in Chachoengsao Province, Thailand


Abstract
:1. Introduction
2. Materials and Methods
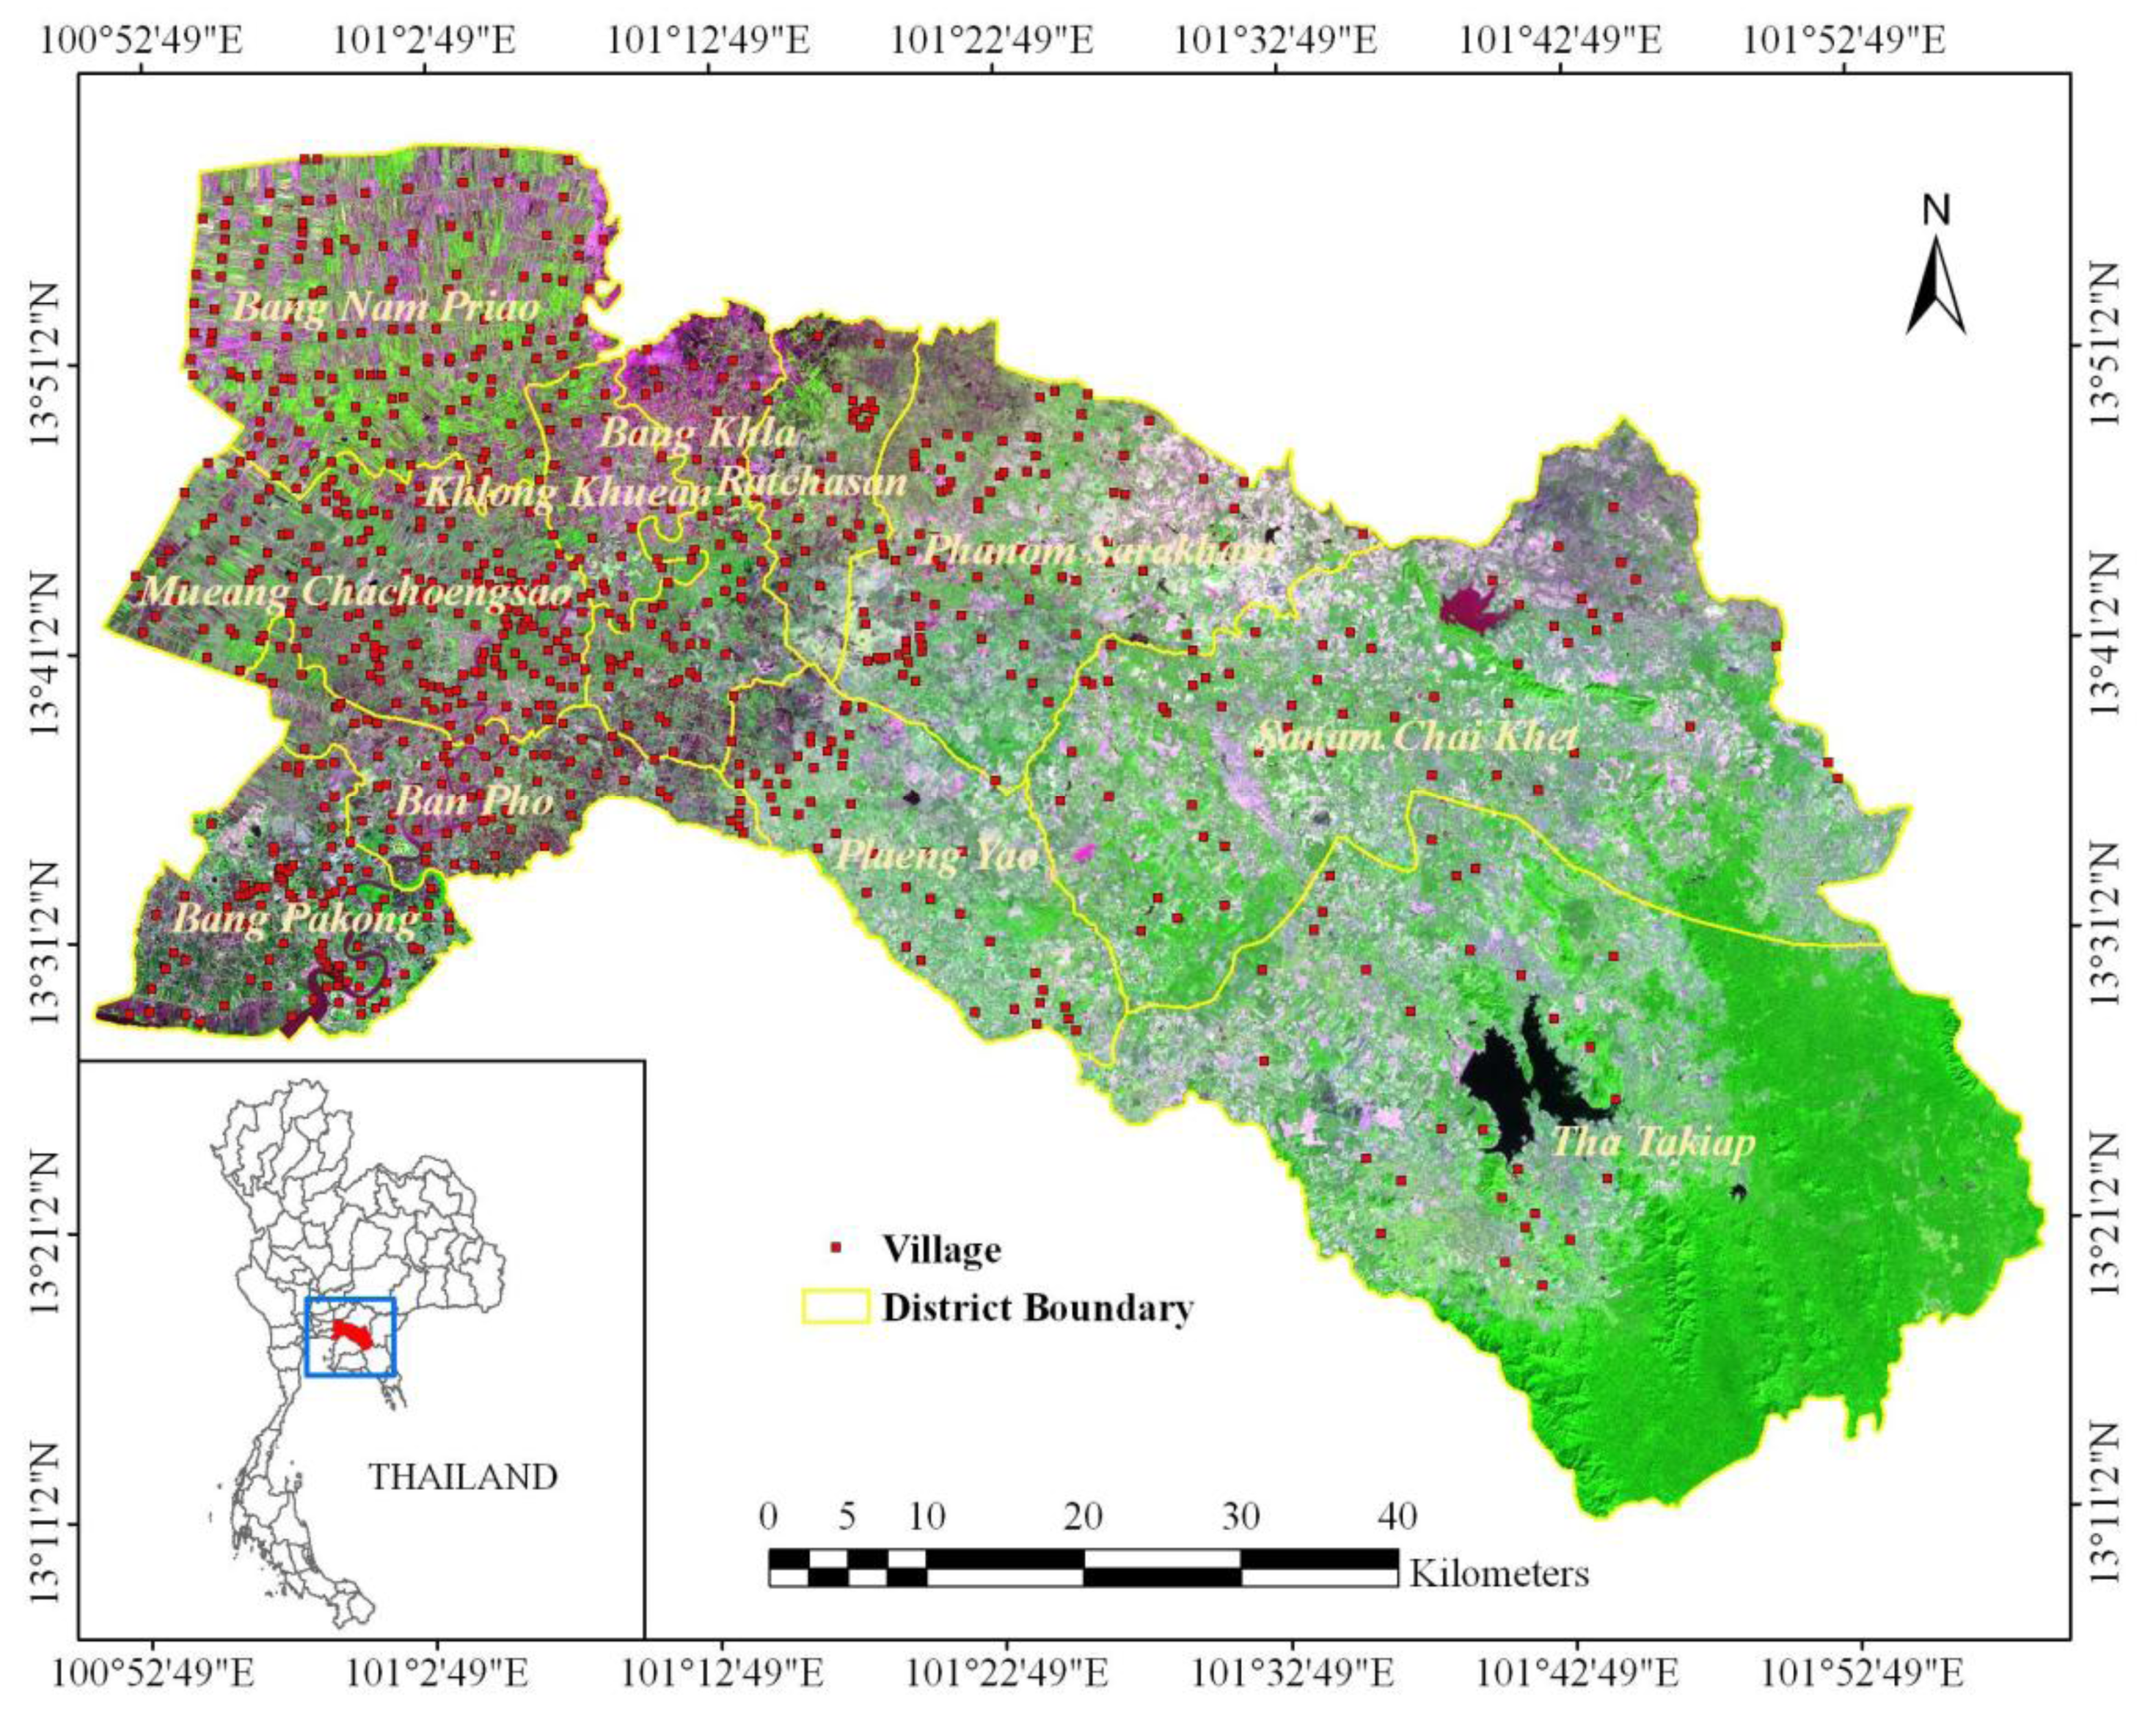
2.1. Study Area: Chachoengsao Province, Thailand
2.2. Data
2.2.1. Dengue epidemiological data
2.2.2. Village data
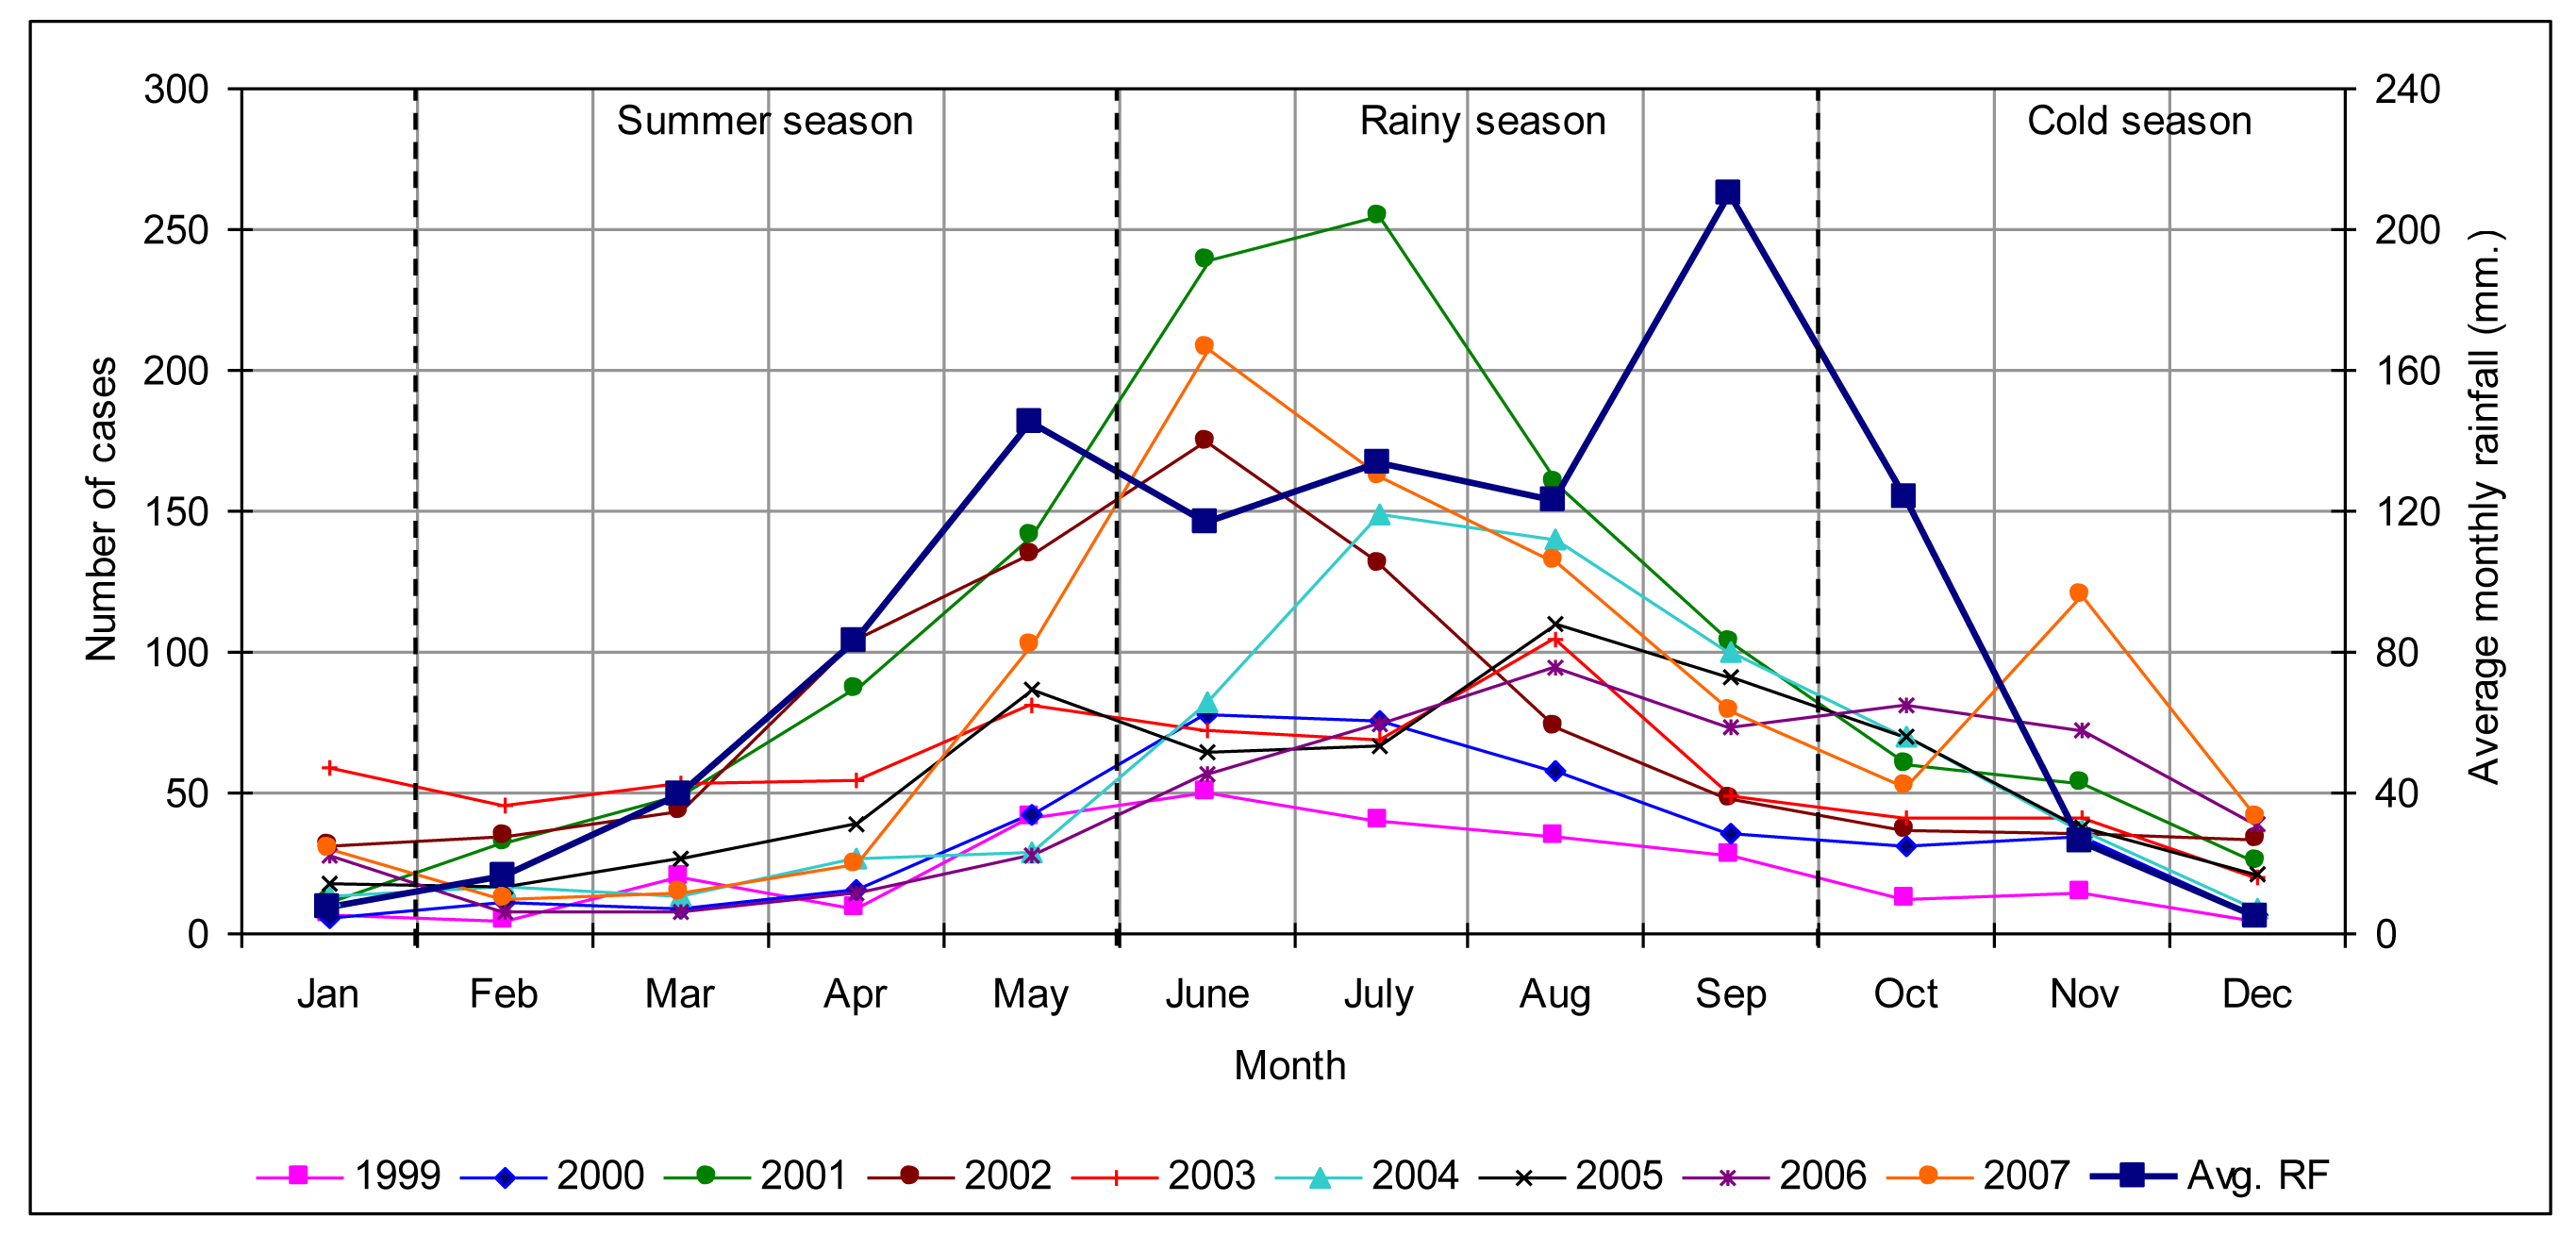
2.2.3. Climatic data
2.3. Spatio-Temporal Diffusion Pattern
2.3.1. General analysis
2.3.2. Temporal analysis
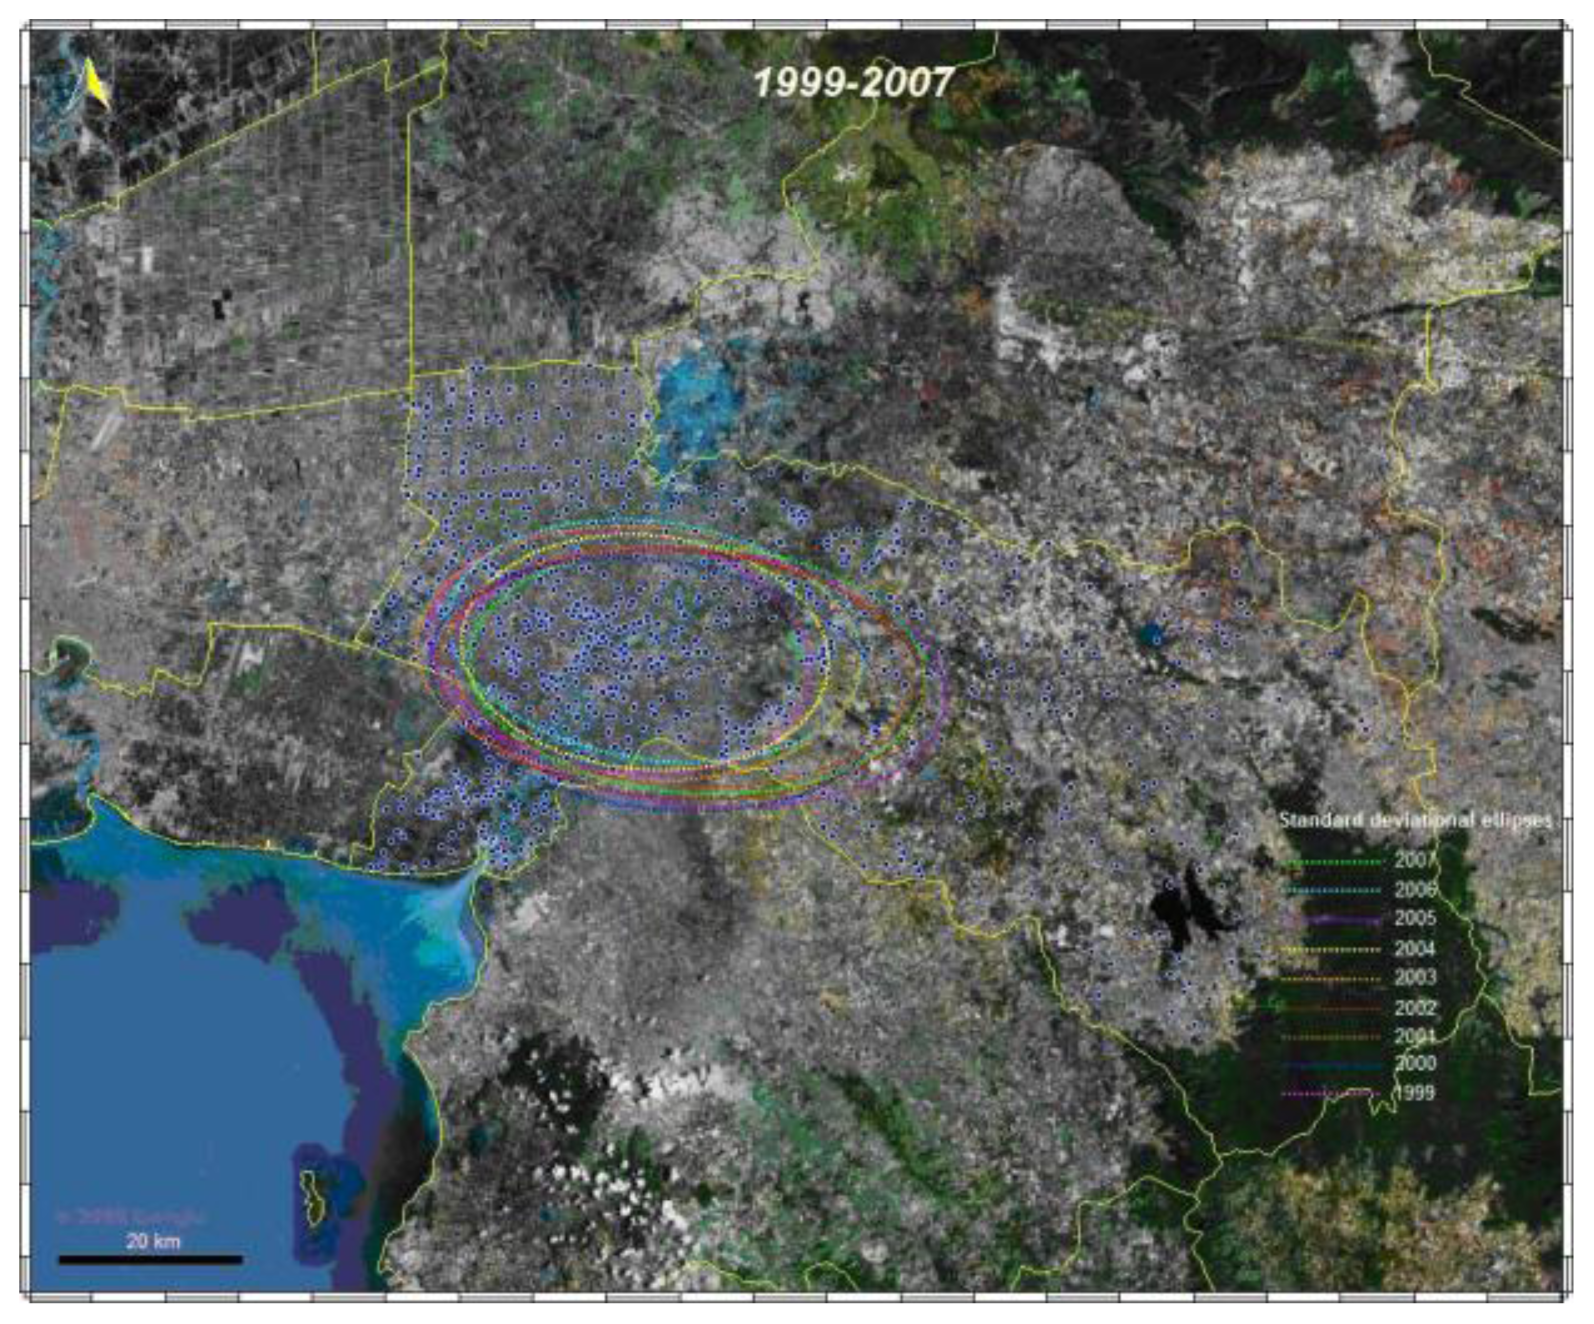
2.3.3. Spatial analysis
2.3.4. Space-time analysis
2.4. Hotspot Detection
2.5. Software
3. Results
3.1. Spatio-Temporal Analysis of Dengue
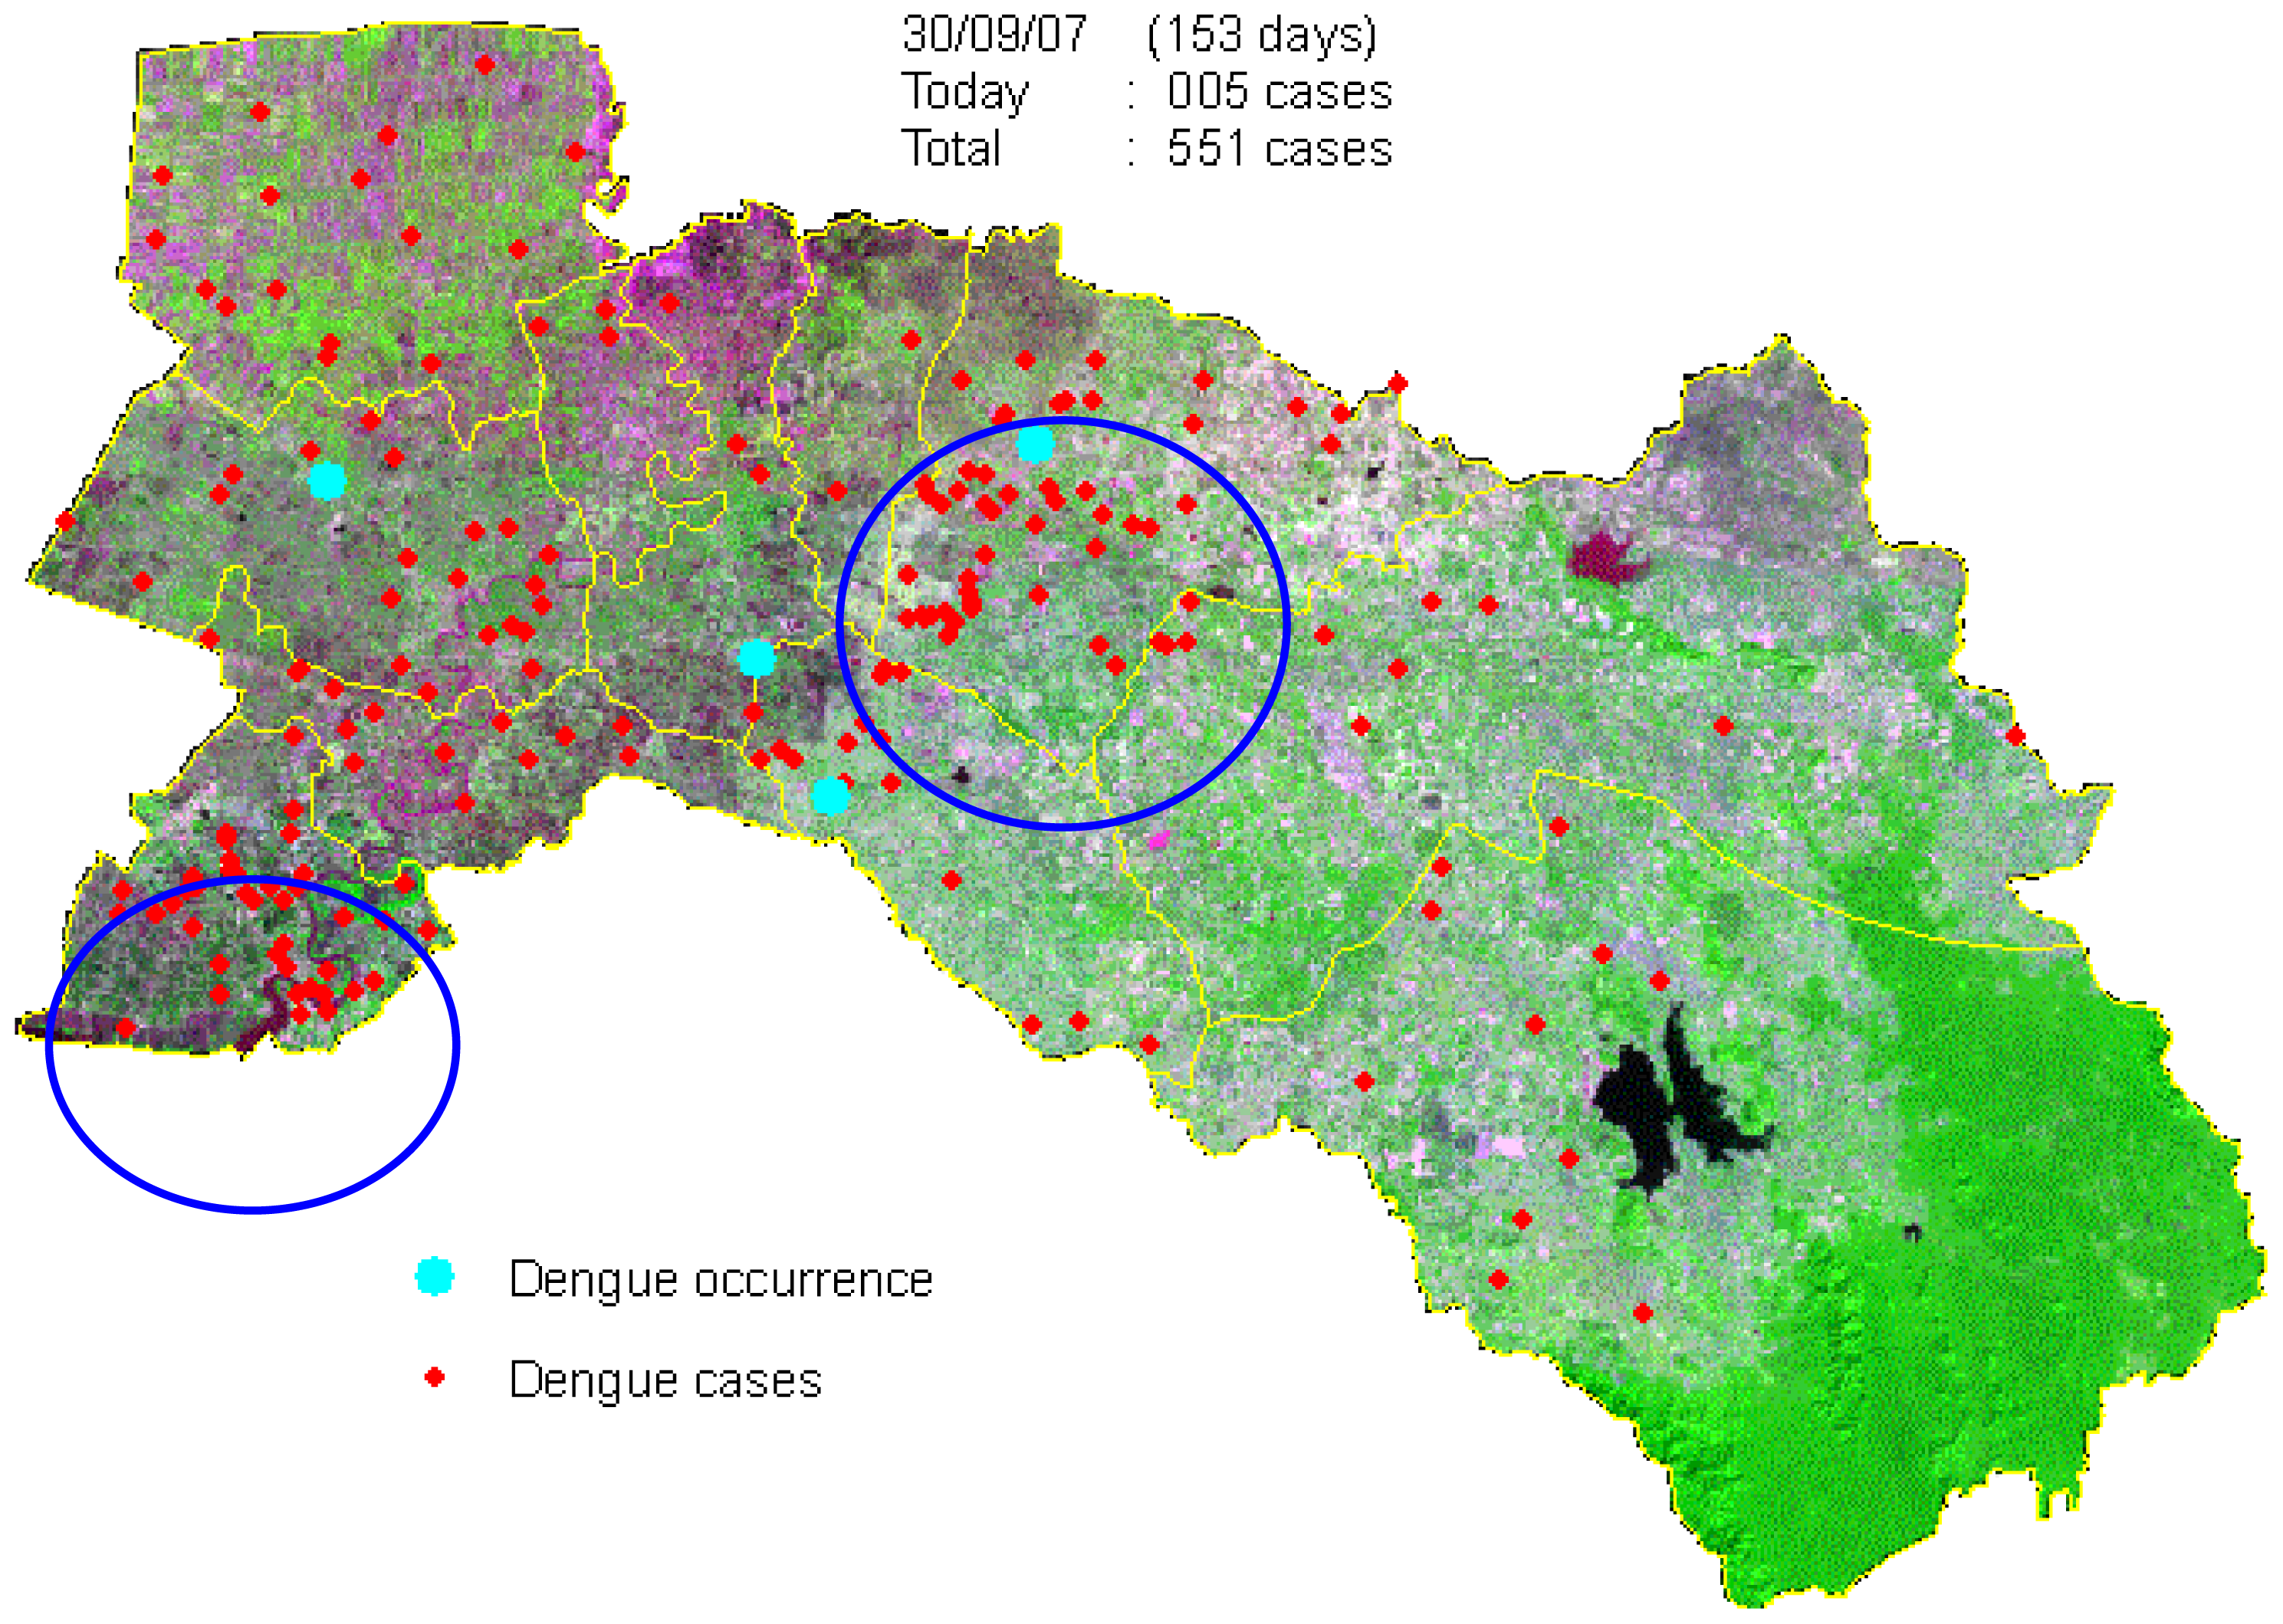
3.1.1. General analysis
3.1.2. Temporal analysis
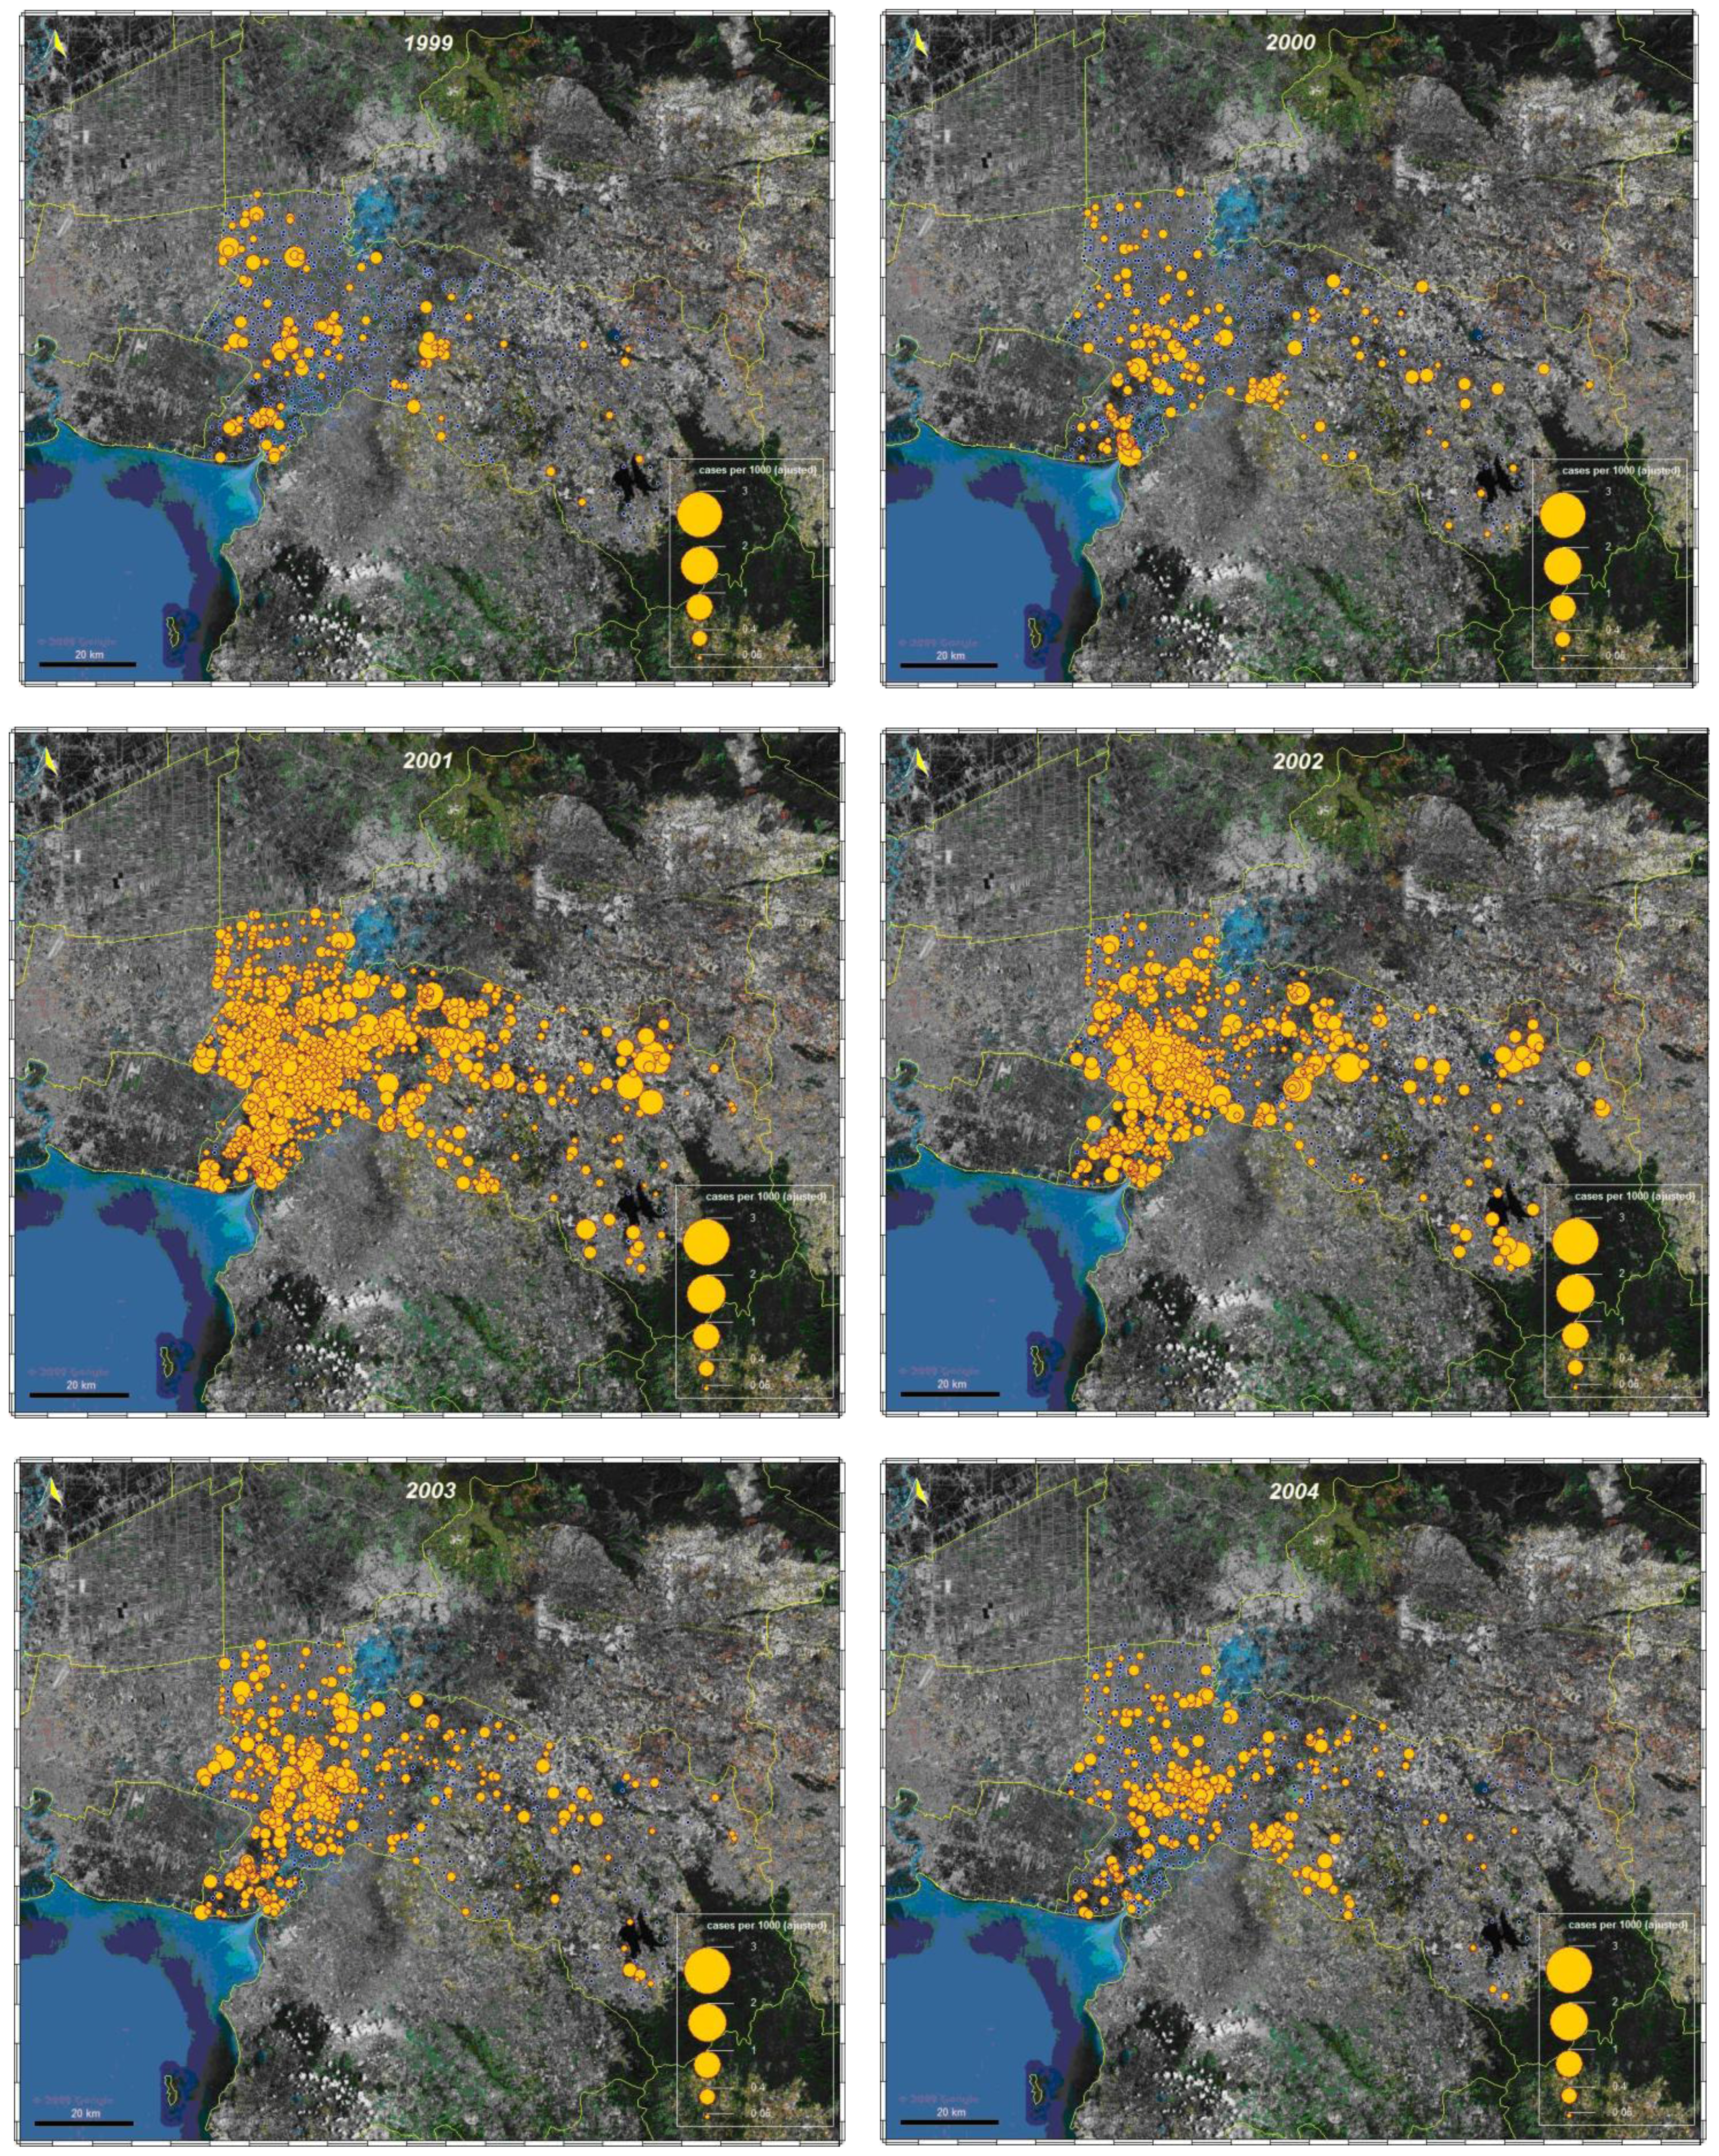
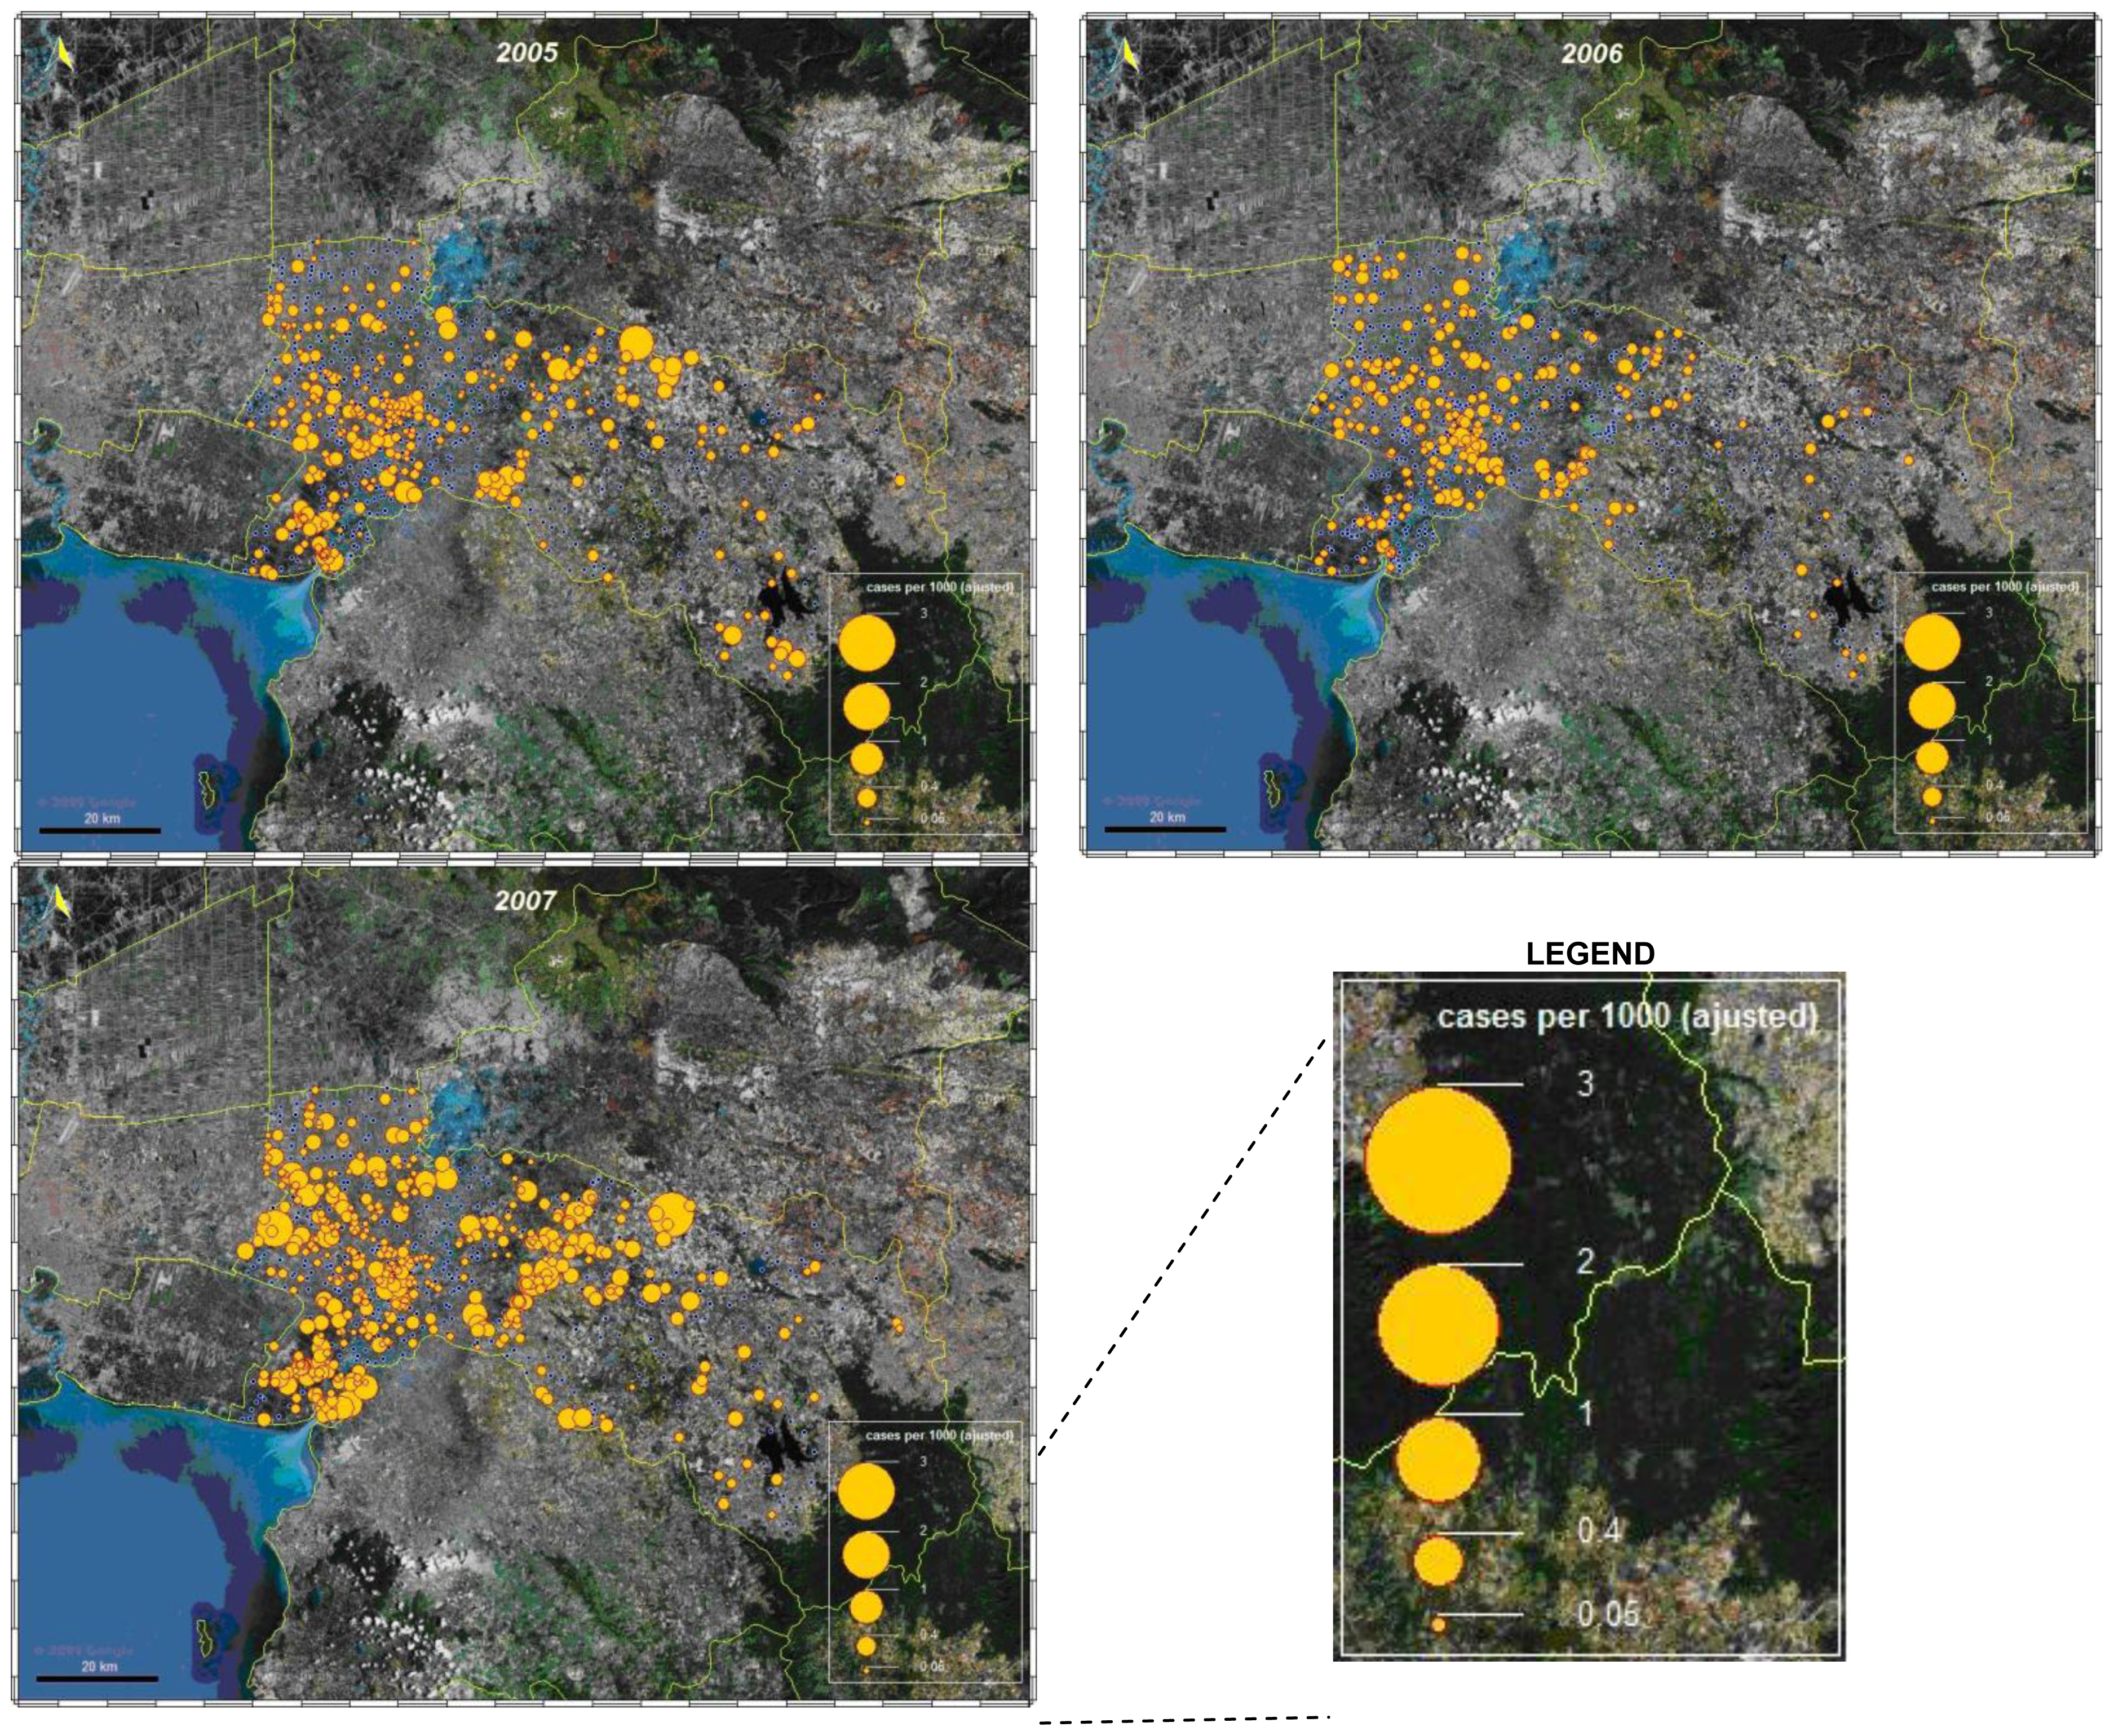
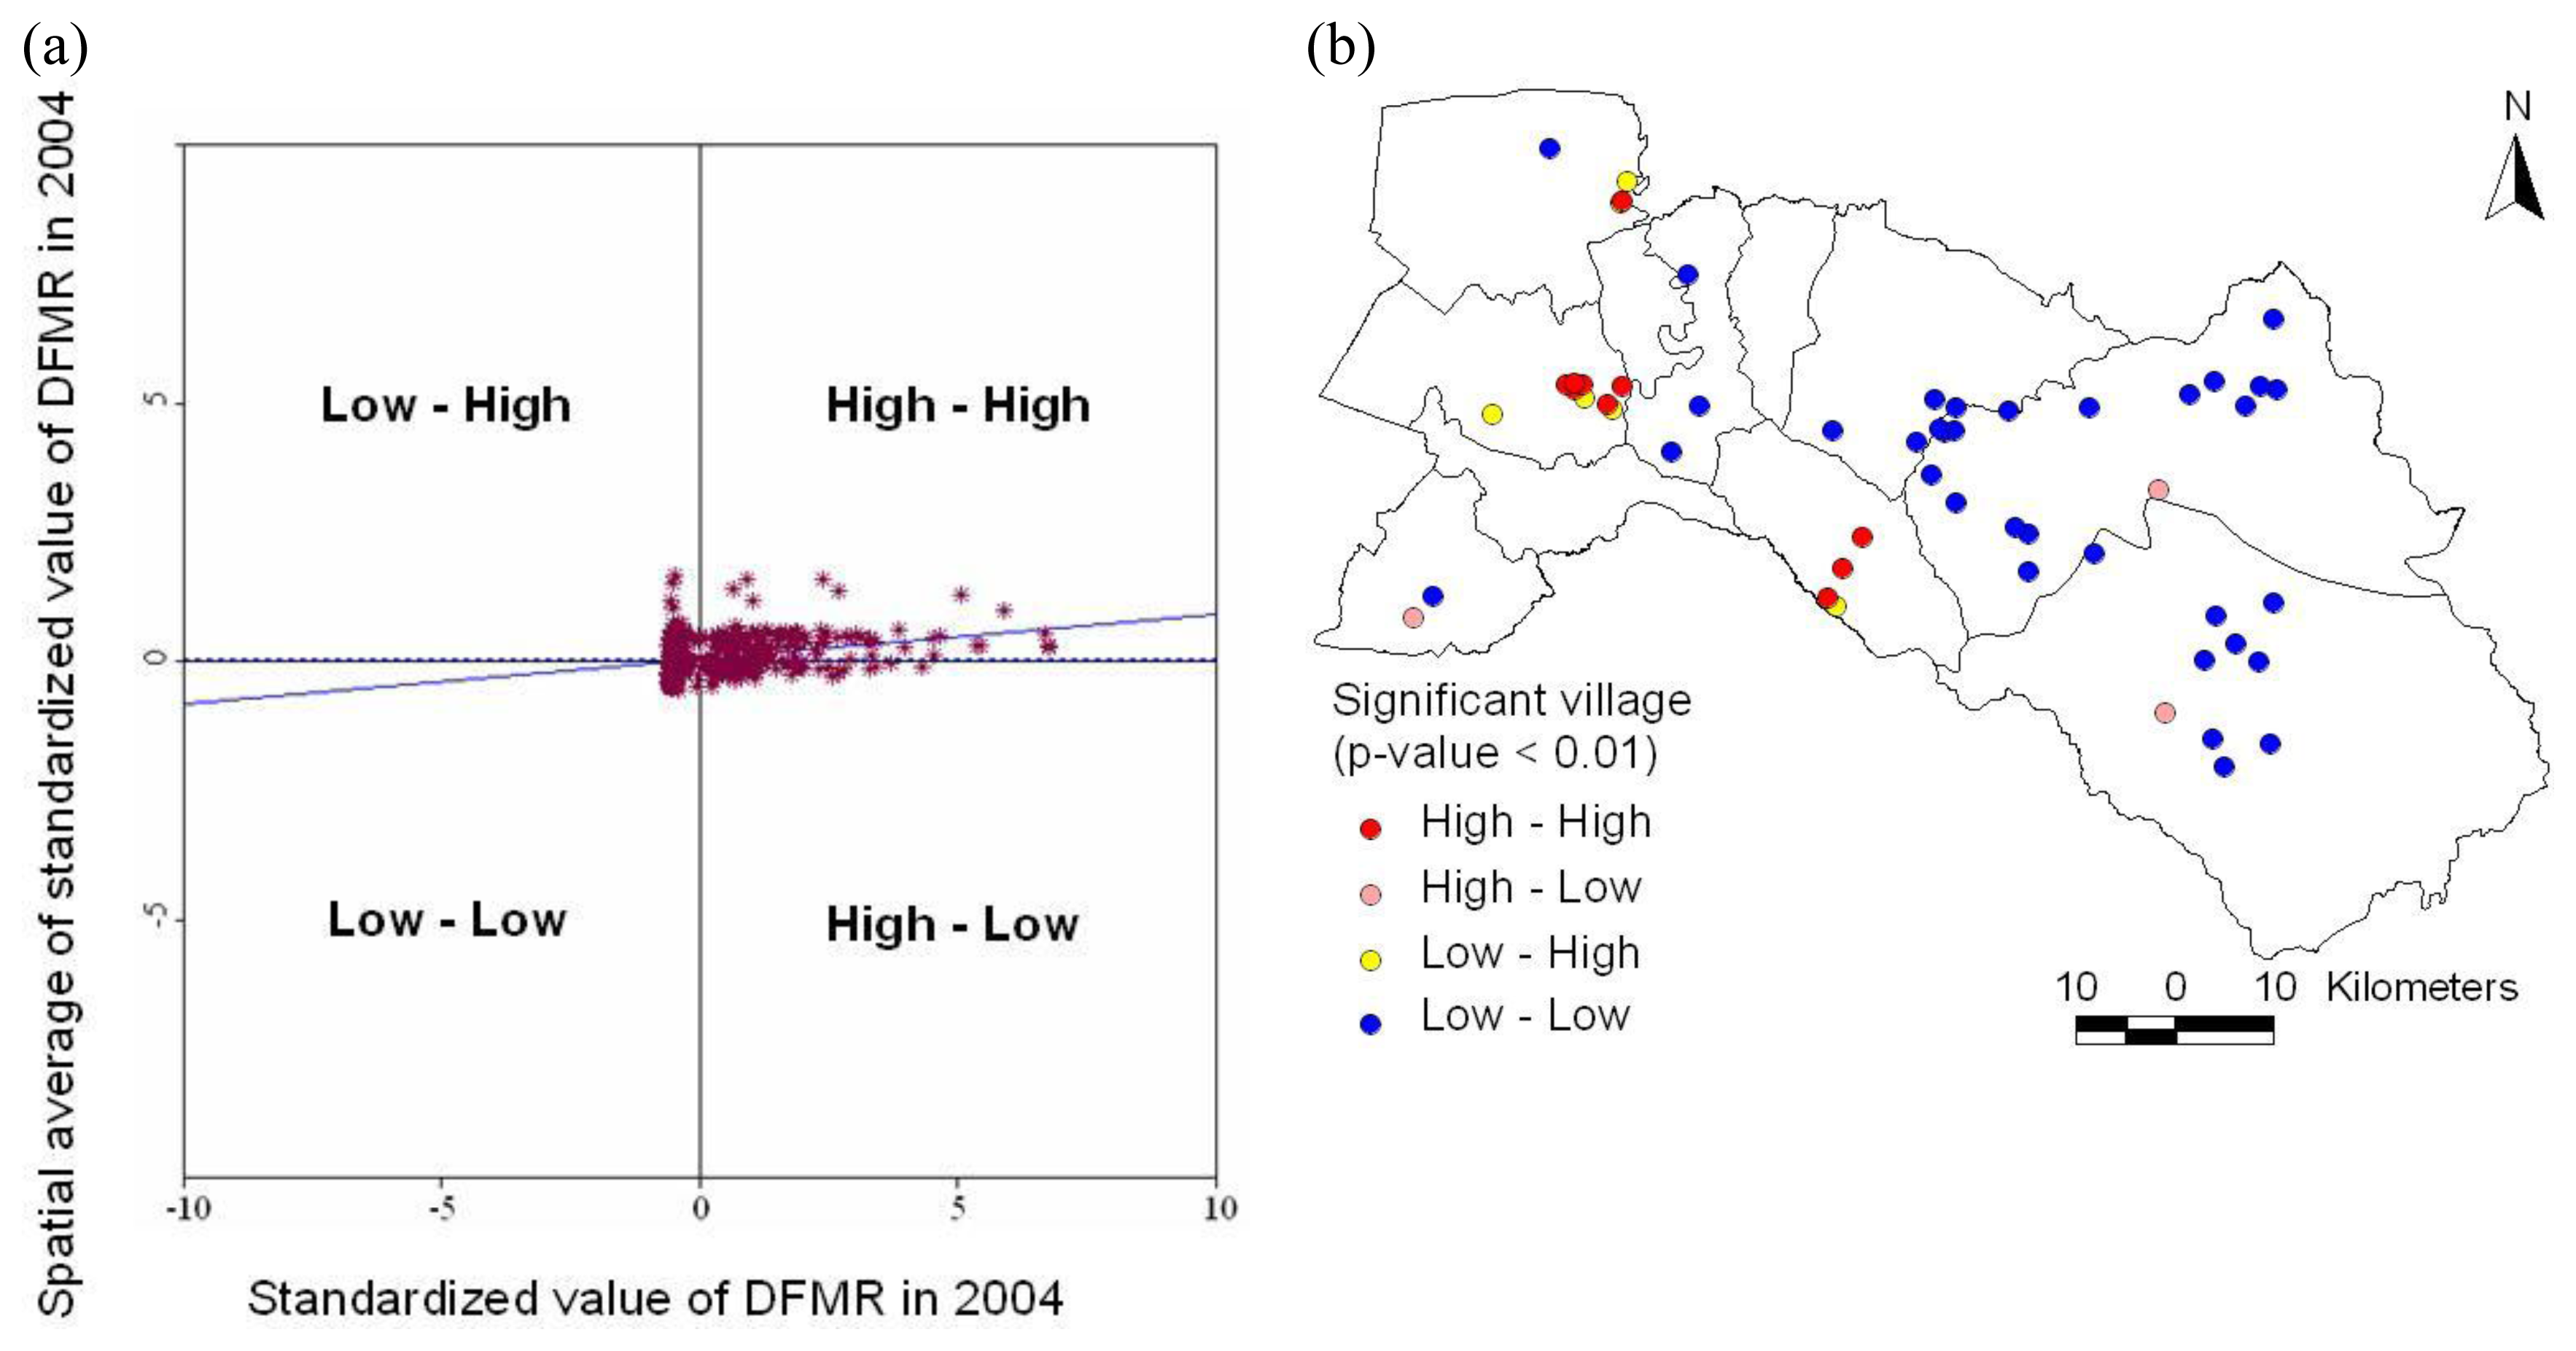
3.1.3. Spatial analysis
3.1.4. Space-time cluster analysis
3.2. Dengue Hotspot Detection
4. Discussion
5. Conclusions
Acknowledgments
References
- Dengue Guidelines for Diagnosis, Treatment, Prevention and Control; World Health Organization (WHO): Geneva, Switzerland, 2009.
- Derouich, M; Boutayeb, A; Twizell, EH. A model of dengue fever. Biomed. Eng 2003, 2, 4. [Google Scholar]
- Social Mobilization and Communication for Dengue Fever Prevention and Control: A Guide on Achieving and Sustaining Behavioural Results; World Health Organization (WHO): Geneva, Switzerland, 2002.
- Kittayapong, P; Yoksan, S; Chansang, U; Chansang, C; Bhumiratana, A. Suppression of dengue transmission by application of integrated vector control strategies at sero-positive GIS-Based Foci. Am. J. Trop. Med. Hyg 2008, 78, 70–76. [Google Scholar]
- Dengue and Dengue Haemorrhagic Fever; World Health Organization (WHO): Geneva, Switzerland, 2010.
- Barbazan, P; Yoksan, S; Gonzalez, JP. Dengue haemorrhagic fever epidemiology in Thailand: Description and forecasting of epidemics. Microbes Infect 2002, 4, 699–705. [Google Scholar]
- Gubler, DJ. Dengue and dengue haemorrhagic fever; its history and resurgence as a global public health problem. In Dengue and Dengue Haemorrhagic Fever; Commonwealth Agricultural Bureau (CAB) International: London, UK, 1997. [Google Scholar]
- Jetten, JH; Focks, DA. Changes in the distribution of dengue transmission under climate warming scenarios. Am. J. Trop. Med. Hyg 1997, 57, 285–297. [Google Scholar]
- Dengue Haemorrhagic Fever: Diagnosis, Treatment, Prevention and Control, 2nd ed; World Health Organization (WHO): Geneva, Switzerland, 1997.
- Nakhapakorn, K; Tripathi, NK. An information value based analysis of physical and climatic factors affecting dengue fever and dengue haemorrhagic fever incidence. Int. J. Health Geogr 2005, 4, 13. [Google Scholar]
- Ali, M; Wagatsuma, Y; Emch, M; Breiman, RF. Use of a geographic information system for defining spatial risk for dengue transmission in Bangladesh: role for Aedes albopictus in an urban outbreak. Am. J. Trop. Med. Hyg 2003, 69, 634–640. [Google Scholar]
- Wu, PC; Lay, JG; Guo, HR; Lin, CY; Lung, SC; Su, HJ. Higher temperature and urbanization affect the spatial patterns of dengue fever transmission in subtropical Taiwan. Sci. Total Environ 2009, 407, 2224–2233. [Google Scholar]
- Rotela, C; Fouque, F; Lamfri, M; Sabatier, P; Introini, V; Zaidenberg, M; Scavuzzo, C. Space-time analysis of the dengue spreading dynamics in the 2004 Tartagel outbreak, Northern Argentina. Acta Trop 2007, 103, 1–13. [Google Scholar]
- Mondini, A; Chiaravalloti-Neto, F. Spatial correlation of incidence of dengue with socioeconomic, demographic and environmental variables in a Brazilian city. Sci. Total Environ 2008, 393, 241–248. [Google Scholar]
- Twumasi, YA; Merem, EC. GIS applications in land management: The loss of high quality land to development in central Mississippi from 1987–2002. Int. J. Environ. Res. Public Health 2005, 2, 234–244. [Google Scholar]
- Brownstein, JS; Rosen, H; Prudy, D; Miller, JR; Merlino, M; Mostashari, F; Fish, D. Spatial analysis of West Nile Virus: Rapid risk assessment of an introduced vector-borne zoonosis. Vector Borne Zoonotic Dis 2002, 2, 101–112. [Google Scholar]
- Pui-Jen, T; Men-Lung, L; Chien-Min, C; Cheng-Hwang, P. Spatial autocorrelation analysis of health case hotspots in Taiwan in 2006. BMC Public Health 2009, 9, 464. [Google Scholar]
- Pace, RK; Barry, R; Sirmans, CF. Spatial statistics and real estate. J. Real Estate Financ. Econ 1998, 17, 5–13. [Google Scholar]
- Ping, JL; Green, CJ; Zartman, RE; Bronson, KF. Exploring spatial dependence of cotton yield using global and local autocorrelation statistics. Field Crop Res 2004, 89, 219–236. [Google Scholar]
- Yeshiwondim, AK; Gopal, S; Hailemariam, AT; Dengela, DO; Patel, HP. Spatial analysis of malaria incidence at the village level in areas with unstable transmission in Ethiopia. Int. J. Health Geogr 2009, 8, 1–11. [Google Scholar]
- Si, YL; Debba, P; Skidmore, AK; Toxopeus, AG; Li, L. Spatial and temporal patterns of global H5N1 outbreaks. Int. Arch. Photogram. Rem. Sens. Spatial Inform. Sci 2008, 1117, 69–74. [Google Scholar]
- Cummings, DAT; Irizarry, RA; Huang, NE; Endy, TP; Nisalak, A; Ungchusak, k; Burke, DS. Travelling waves in the occurrence of dengue haemorrhagic fever in Thailand. Nature 2004, 427, 344–347. [Google Scholar]
- Maidana, NA; Yang, HM. Describing the geographic spread of dengue disease by traveling waves. Math. Biosci 2008, 215, 64–77. [Google Scholar]
- Tran, A; Raffy, M. On the dynamics of dengue epidemics from large-scale information. Theor. Popul. Biol 2006, 69, 3–12. [Google Scholar]
- Marshall, R. Mapping disease and mortality rates using empirical Bayes estimators. J. Appl. Statist 1991, 40, 283–294. [Google Scholar]
- Anselin, L. Spatial statistical modeling in a GIS environment. In GIS, Spatial Analysis, and Modeling; Environmental Systems Research Institute (ESRI) Press: Redlands, CA, USA, 2005; pp. 93–111. [Google Scholar]
- Chaikaew, N; Tripathi, NK; Souris, M. Exploring spatial patterns and hotspots of diarrhea in Chiang Mai, Thailand. Int. J. Health Geogr 2009, 8, 36. [Google Scholar]
- Ebdon, D. Statistic in geography: A practical approach, 2nd ed; Blackwell Publishing: Malden, MA, USA, 1991. [Google Scholar]
- Boots, BN; Getis, A. Point Pattern Analysis Newbury Park; Sage Publications: Newbury Park, CA, USA, 1998. [Google Scholar]
- Fang, L; Yan, L; Liang, S; Vlas, SJD; Feng, D; Han, X; Zhao, W; Xu, B; Bian, L; Yang, H; Gong, P; Richardus, JH; Cao, W. Spatial analysis of hemorrhagic fever with renal syndrome in China. BMC Infect. Dis 2006, 6, 77. [Google Scholar]
- Kan, CC; Lee, PF; Wen, TH; Chao, DY; Wu, MH; Lin, NH; Huang, SY; Shang, CS; Fan, IC; Shu, PY; Huang, JH; King, CC; Pai, L. Two clustering diffusion patterns identified from the 2001–2003 dengue epidemic, Kaohsiung, Taiwan. Am. J. Trop. Med. Hyg 2008, 79, 344–352. [Google Scholar]
- Eisen, L; Lozano-Fuentes, S. Use of mapping and spatial and space-time modeling approaches in operacional control of Aedes aegypti and dengue. PLoS Negl. Trop. Dis 2009, 3, 1–7. [Google Scholar]
- Zhong, S; Xue, Y; Cao, C; Cao, W; Li, X; Guo, J; Fang, L. The application of space/time analysis of GIS in spatial epidemiology: a case study of Hepatitis S in China using GIS. IEEE 2005, 8, 1612–1615. [Google Scholar]
- Osei, FB; Duker, AA. Spatial and demographic patterns of Cholera in Ashanti region—Ghana. Int. J. Health Geogr 2008, 7, 44. [Google Scholar]
- Anselin, L. Local Indicators of Spatial Association—LISA. Geogr. Anal 1995, 27, 93–116. [Google Scholar]
- Ord, JK; Getis, A. Local spatial autocorrelations statistics: distributional issues and application. Geogr. Anal 1995, 27, 286–306. [Google Scholar]
- Hinman, S; Blackburn, JK; Curtis, A. Spatial and temporal structure of typhoid outbreaks in Washington D.C., 1906–1909: evaluating local clustering with the Gi* statistic. Int. J. Health Geogr 2006, 5, 13. [Google Scholar]
- Getis, A; Morrison, AC; Gray, K; Scott, TW. Characteristics of the spatial pattern of the dengue vector, Aedes aegypti. Iquitos, Peru. Am. J. Trop. Med. Hyg 2003, 69, 494–505. [Google Scholar]
- Feser, E; Sweeney, S; Renski, H. A descriptive analysis of discrete U.S. industrial complexes. J. Regional Sci 2005, 45, 395–419. [Google Scholar]
- Jepsen, MR; Simonsen, J; Ethelberg, JS. Spatio-temporal cluster analysis of the incidence of Campylobacter cases and patients with general diarrhea in a Danish county, 1995–2004. Int. J. Health Geogr 2009, 8, 11. [Google Scholar]
- Goodchild, MF. Spatial Autocorrelation, Concept and Techniques in Modern Geography; Geo Books: Norwich, UK, 1986. [Google Scholar]
- Keating, J. An investigation into the cyclical incidence of dengue fever. Soc. Sci. Med 2001, 53, 1587–1597. [Google Scholar]
- Guha-Sapir, D; Schimmer, B. Dengue fever: New paradigms for a changing epidemiology. Emerg. Themes Epidem 2005, 2, 1. [Google Scholar]
- El-Baddy, AA; Al-Ali, KH. Prevalence and seasonal distribution of dengue mosquito, Aedes aegypti (Diptera: Culicidae) in Al-Madinah Al-Munawwarah, Saudi Arabia. J. Ethol 2010, 7, 80–88. [Google Scholar]
- Deubel, V; Rodhanin, F. Climate variations and dengue fever: direct and indirect impacts. Med. Mal. Infect 1999, 29, 289–295. [Google Scholar]
- Sriprom, M; Chalvet-Monfray, K; Chaimane, T; Vongsawat, K; Bicout, DJ. Monthly district level risk of dengue occurrences in Sakon Nakhon Province, Thailand. Sci. Total Environ 2010, 408, 5521–5528. [Google Scholar]
- Meza, JL. Empirical Bayes estimation smoothing of relative risks in disease mapping. J. Statist. Plan Infer 2002, 112, 43–62. [Google Scholar]


| Gender | Year | Percentage (%) | ||||||||
|---|---|---|---|---|---|---|---|---|---|---|
| 1999 | 2000 | 2001 | 2002 | 2003 | 2004 | 2005 | 2006 | 2007 | ||
| Male | 143 | 218 | 626 | 475 | 374 | 323 | 306 | 251 | 416 | 53.71 |
| Female | 123 | 162 | 610 | 456 | 316 | 221 | 217 | 218 | 376 | 46.29 |
| Total | 266 | 380 | 1,236 | 931 | 690 | 544 | 523 | 469 | 792 | 100.00 |
| Year | RF | TEMP | RH | |||
|---|---|---|---|---|---|---|
| t | t−1 | t | t−1 | t | t−1 | |
| 1999 | 0.460 | 0.512 | −0.042 | 0.262 | 0.631 | 0.610 |
| 2000 | 0.676 | 0.839 | 0.258 | 0.677 | 0.647 | 0.777 |
| 2001 | 0.548 | 0.516 | 0.380 | 0.342 | 0.539 | 0.506 |
| 2002 | 0.472 | 0.346 | 0.608 | 0.768 | 0.158 | 0.252 |
| 2003 | 0.488 | 0.296 | 0.538 | 0.316 | 0.544 | 0.319 |
| 2004 | 0.872 | 0.916 | 0.177 | 0.277 | 0.682 | 0.777 |
| 2005 | 0.729 | 0.481 | 0.525 | 0.524 | 0.840 | 0.551 |
| 2006 | 0.528 | 0.836 | −0.026 | 0.325 | 0.580 | 0.825 |
| 2007 | 0.446 | 0.726 | 0.166 | 0.487 | 0.461 | 0.740 |
| Year | DFMR | Pattern | |
|---|---|---|---|
| Moran’s I | Z-score | ||
| 1999 | 0.07 | 5.87 | Clustered |
| 2000 | 0.09 | 5.45 | Clustered |
| 2001 | 0.06 | 4.49 | Clustered |
| 2002 | 0.03 | 3.38 | Clustered |
| 2003 | 0.07 | 5.87 | Clustered |
| 2004 | 0.12 | 7.79 | Clustered |
| 2005 | 0.05 | 2.66 | Clustered |
| 2006 | 0.05 | 2.79 | Clustered |
| 2007 | 0.07 | 2.71 | Clustered |
© 2011 by the authors; licensee Molecular Diversity Preservation International, Basel, Switzerland. This article is an open-access article distributed under the terms and conditions of the Creative Commons Attribution license (http://creativecommons.org/licenses/by/3.0/).
Share and Cite
Jeefoo, P.; Tripathi, N.K.; Souris, M. Spatio-Temporal Diffusion Pattern and Hotspot Detection of Dengue in Chachoengsao Province, Thailand. Int. J. Environ. Res. Public Health 2011, 8, 51-74. https://doi.org/10.3390/ijerph8010051
Jeefoo P, Tripathi NK, Souris M. Spatio-Temporal Diffusion Pattern and Hotspot Detection of Dengue in Chachoengsao Province, Thailand. International Journal of Environmental Research and Public Health. 2011; 8(1):51-74. https://doi.org/10.3390/ijerph8010051
Chicago/Turabian StyleJeefoo, Phaisarn, Nitin Kumar Tripathi, and Marc Souris. 2011. "Spatio-Temporal Diffusion Pattern and Hotspot Detection of Dengue in Chachoengsao Province, Thailand" International Journal of Environmental Research and Public Health 8, no. 1: 51-74. https://doi.org/10.3390/ijerph8010051
APA StyleJeefoo, P., Tripathi, N. K., & Souris, M. (2011). Spatio-Temporal Diffusion Pattern and Hotspot Detection of Dengue in Chachoengsao Province, Thailand. International Journal of Environmental Research and Public Health, 8(1), 51-74. https://doi.org/10.3390/ijerph8010051