


Performance of Risk Scores in SARS-CoV-2 Infection: A Retrospective Study
 , ,
, ,  ,
,  and
and
Abstract
1. Introduction
2. Materials and Methods
2.1. Study Design
2.2. Methods
2.3. Outcome
2.4. Risk Scores
2.5. Statistical Analysis
3. Results
4. Discussion
5. Conclusions
Author Contributions
Funding
Institutional Review Board Statement
Informed Consent Statement
Data Availability Statement
Acknowledgments
Conflicts of Interest
Abbreviations
| (AUC) | Area under the curve |
| (BUN) | Blood urea nitrogen |
| (CKD) | Chronic kidney disease |
| (COPD) | Chronic obstructive pulmonary disease |
| (CAP) | Community-acquired pneumonia |
| (COVID-19) | Coronavirus disease 2019 |
| (CRP) | C-reactive protein |
| (GCS) | Glasgow Coma Scale |
| (ICU) | Intensive care unit |
| (INR) | International normalised ratio |
| (LDH) | Lactate dehydrogenase |
| (-)(LR) | Negative likelihood ratio |
| (NPV) | Negative predictive value |
| (NLR) | Neutrophil and lymphocyte values and their ratio |
| (+)(LR) | Positive likelihood ratio |
| (PPV) | Positive predictive value |
| (ROC) | Receiver operating characteristic |
| (SICU) | Sub-intensive care unit |
References
- Zhou, P.; Yang, X.L.; Wang, X.G.; Hu, B.; Zhang, L.; Zhang, W.; Si, H.R.; Zhu, Y.; Li, B.; Huang, C.L.; et al. A pneumonia outbreak associated with a new coronavirus of probable bat origin. Nature 2020, 579, 270–273. [Google Scholar] [CrossRef]
- Yu, X.; Wei, D.; Chen, Y.; Zhang, D.; Zhang, X. Retrospective detection of SARS-CoV-2 in hospitalized patients with influenza-like illness. Emerg. Microbes Infect. 2020, 9, 1470–1473. [Google Scholar] [CrossRef]
- Shi, Y.; Wang, G.; Cai, X.P.; Deng, J.W.; Zheng, L.; Zhu, H.H.; Zheng, M.; Yang, B.; Chen, Z. An overview of COVID-19. J. Zhejiang Univ. Sci. B 2020, 21, 343–360. [Google Scholar] [CrossRef] [PubMed]
- Azzolino, D.; Cesari, M. Fatigue in the COVID-19 pandemic. Lancet Healthy Longev. 2022, 3, e128–e129. [Google Scholar] [CrossRef] [PubMed]
- Awad, M.; Al-hussaniy, H.A.; Alburghaif, A.H.; Tawfeeq, K.T. The role of COVID-19 in myopathy: Incidence, causes, treatment, and prevention. J. Med. Life 2022, 15, 1458–1463. [Google Scholar] [CrossRef] [PubMed]
- Gaudio, A.; Murabito, A.R.; Agodi, A.; Montineri, A.; Castellino, P.; D.O.CoV Research. Vitamin D Levels Are Reduced at the Time of Hospital Admission in Sicilian SARS-CoV-2-Positive Patients. Int. J. Environ. Res. Public Health 2021, 18, 3491. [Google Scholar] [CrossRef]
- World Health Organization. Coronavirus Disease 2019 (COVID-19). Available online: https://covid19.who.int/ (accessed on 12 June 2025).
- Ji, D.; Zhang, D.; Xu, J.; Chen, Z.; Yang, T.; Zhao, P.; Chen, G.; Cheng, G.; Wang, Y.; Bi, J.; et al. Prediction for Progression Risk in Patients With COVID-19 Pneumonia: The CALL Score. Clin. Infect. Dis. 2020, 71, 1393–1399. [Google Scholar] [CrossRef]
- Haimovich, A.D.; Ravindra, N.G.; Stoytchev, S.; Young, H.P.; Wilson, F.P.; van Dijk, D.; Schulz, W.L.; Taylor, R.A. Development and Validation of the Quick COVID-19 Severity Index: A Prognostic Tool for Early Clinical Decompensation. Ann. Emerg. Med. 2020, 76, 442–453. [Google Scholar] [CrossRef]
- Altschul, D.J.; Unda, S.R.; Benton, J.; de la Garza Ramos, R.; Cezayirli, P.; Mehler, M.; Eskandar, E.N. A novel severity score to predict inpatient mortality in COVID-19 patients. Sci. Rep. 2020, 10, 16726. [Google Scholar] [CrossRef]
- Knight, S.R.; Ho, A.; Pius, R.; Buchan, I.; Carson, G.; Drake, T.M.; Dunning, J.; Fairfield, C.J.; Gamble, C.; Green, C.A.; et al. Risk stratification of patients admitted to hospital with covid-19 using the ISARIC WHO Clinical Characterisation Protocol: Development and validation of the 4C Mortality Score. BMJ 2020, 370, m3339. [Google Scholar] [CrossRef]
- Liang, W.; Liang, H.; Ou, L.; Chen, B.; Chen, A.; Li, C.; Li, Y.; Guan, W.; Sang, L.; Lu, J.; et al. Development and Validation of a Clinical Risk Score to Predict the Occurrence of Critical Illness in Hospitalized Patients with COVID-19. JAMA Intern. Med. 2020, 180, 1081–1089. [Google Scholar] [CrossRef]
- Buccheri, E.; Dell’Aquila, D.; Russo, M. Artificial intelligence in health data analysis: The Darwinian evolution theory suggests an extremely simple and zero-cost large-scale screening tool for prediabetes and type 2 diabetes. Diabetes Res. Clin. Pract. 2021, 174, 108722. [Google Scholar] [CrossRef]
- Buccheri, E.; Dell’Aquila, D.; Russo, M. Stratified analysis of the age-related waist circumference cut-off model for the screening of dysglycemia at zero-cost. Obes. Med. 2022, 31, 100398. [Google Scholar] [CrossRef]
- Buccheri, E.; Dell’Aquila, D.; Russo, M.; Chiaramonte, R.; Musumeci, G.; Vecchio, M. Can artificial intelligence simplify the screening of muscle mass loss? Heliyon 2023, 9, e16323. [Google Scholar] [CrossRef] [PubMed]
- Buccheri, E.; Dell’Aquila, D.; Russo, M.; Chiaramonte, R.; Vecchio, M. Appendicular Skeletal Muscle Mass in Older Adults Can Be Estimated with a Simple Equation Using a Few Zero-Cost Variables. J. Geriatr. Phys. Ther. 2024, 47, E149–E158. [Google Scholar] [CrossRef] [PubMed]
- Hosmer, D.W.; Lemeshow, S. Applied logistic regression, 2nd ed.; Wiley: Hoboken, NJ, USA, 2000; pp. 156–164. [Google Scholar]
- Ronda, V.E.; Alcaraz, S.R.; Torregrosa, P.R.; Suau, M.G.; Perez, E.N.; Ramirez, J.M.L.; Andres, M.; Moreno-Perez, O.; Blanes, A.C.; Carbonell, J.G.; et al. Application of validated severity scores for pneumonia caused by SARS-CoV-2. Med. Clín. 2021, 157, 99–105. [Google Scholar]
- Armiñanzas, C.; Revillas, F.A.d.L.; Cuadra, M.G.; Arnaiz, A.; Sampedro, M.F.; González-Rico, C.; Ferrer, D.; Mora, V.; Suberviola, B.; Latorre, M.; et al. Usefulness of the COVID-GRAM and CURB-65 scores for predicting severity in patients with COVID-19. Int. J Infect. Dis. 2021, 108, 282–288. [Google Scholar] [CrossRef]
- De Vito, A.; Colpani, A.; Saderi, L.; Puci, M.; Zauli, B.; Meloni, M.C.; Fois, M.; Bitti, A.; Di Castri, C.; Fiore, V.; et al. Is the 4C Score Still a Valid Item to Predict In-Hospital Mortality in People with SARS-CoV-2 Infections in the Omicron Variant Era? Life 2023, 13, 183. [Google Scholar] [CrossRef]
- Sebastian, A.; Madziarski, M.; Madej, M.; Proc, K.; Szymala-Pędzik, M.; Żórawska, J.; Gronek, M.; Morgiel, E.; Kujawa, K.; Skarupski, M.; et al. The Usefulness of the COVID-GRAM Score in Predicting the Outcomes of Study Population with COVID-19. Int. J. Environ. Res. Public Health 2022, 19, 12537. [Google Scholar] [CrossRef]
- Ucan, E.S.; Alpaydin, A.O.; Ozuygur, S.S.; Ercan, S.E.L.İ.N.; Unal, B.E.L.G.İ.N.; Sayiner, A.A.; Ergan, B.E.G.Ü.M.; Gokmen, N.; Savran, Y.; Kilinc, O.Ğ.U.Z.; et al. Pneumonia severity indices predict prognosis in coronavirus disease-2019. Respir. Med. Res. 2021, 79, 100826. [Google Scholar] [CrossRef]
- De Socio, G.V.; Gidari, A.; Sicari, F.; Palumbo, M.; Francisci, D. National Early Warning Score 2 (NEWS2) better predicts critical Coronavirus Disease 2019 (COVID-19) illness than COVID-GRAM, a multi-centre study. Infection 2021, 49, 1033–1038. [Google Scholar] [CrossRef]
- Moreno-Pérez, Ó.; Andrés, M.; León-Ramirez, J.M.; Sánchez-Payá, J.; Boix, V.; Gil, J.; Merino, E. The COVID-GRAM Tool for Patients Hospitalized With COVID-19 in Europe. JAMA Intern. Med. 2021, 181, 1000–1001. [Google Scholar] [CrossRef]
- Jones, A.; Pitre, T.; Junek, M.; Kapralik, J.; Patel, R.; Feng, E.; Dawson, L.; Tsang, J.L.; Duong, M.; Ho, T.; et al. External validation of the 4C mortality score among COVID-19 patients admitted to hospital in Ontario, Canada: A retrospective study. Sci. Rep. 2021, 11, 18638. [Google Scholar] [CrossRef]
- Wellbelove, Z.; Walsh, C.; Perinpanathan, T.; Lillie, P.; Barlow, G. Comparing the 4C mortality score for COVID-19 to established scores (CURB65, CRB65, qSOFA, NEWS) for respiratory infection patients. J. Infect. 2020, 82, 414–451. [Google Scholar] [CrossRef] [PubMed]
- Grifoni, E.; Valoriani, A.; Cei, F.; Vannucchi, V.; Moroni, F.; Pelagatti, L.; Tarquini, R.; Landini, G.; Masotti, L. The CALL Score for Predicting Outcomes in Patients With COVID-19. Clin. Infect. Dis. 2021, 72, 182–183. [Google Scholar] [CrossRef] [PubMed]
- Sanhueza, M.; Barrera, M.; Pedemonte, J.C.; Rojas, L. Validation of the CALL score as a mortality prediction tool in a cohort of hospitalized COVID-19 patients in Chile. Front. Med. 2023, 10, 1164615. [Google Scholar] [CrossRef] [PubMed]
- Ak, R.; Kurt, E.; Bahadirli, S. Comparison of two risk prediction models specific for COVID-19: The Brescia-COVID Respiratory Severity Scale versus the Quick COVID-19 Severity Index. Disaster Med. Public Health Prep. 2021, 4, e46–e50. [Google Scholar] [CrossRef]
- Rodriguez-Nava, G.; Yanez-Bello, M.A.; Trelles-Garcia, D.P.; Chung, C.W.; Friedman, H.J.; Hines, D.W. Performance of the quick COVID-19 severity index and the Brescia-COVID respiratory severity scale in hospitalized patients with COVID-19 in a community hospital setting. Int. J. Infect. Dis. 2021, 102, 571–576. [Google Scholar] [CrossRef]
- Toker, İ.; Kılınç-Toker, A.; Turunç-Özdemir, A.; Altuntaş, M. Comparison of CURB-65 Pneumonia Severity Score, Quick COVID-19 Severity Index, and Brescia-COVID Respiratory Severity Scale in Emergently Hospitalized COVID-19 Patients with Pneumonia. Infect. Dis. Clin. Microbiol. 2022, 4, 244–251. [Google Scholar] [CrossRef]


| Type of Score | Risk Class Classification | Variables Used |
|---|---|---|
| CALL score [8] | Class A (4–6) Class B (7–9) Class C (10–13) | Comorbidity Age Lymphocyte LDH |
| qCSI [9] | Low (0–3) Low-medium (4–6) Medium-high (7–9) High (10–12) | Respiratory rate Pulse oximetry Oxygen flow rate |
| COVID Severity Score [10] | Low (0–3) Medium (4–7) High (8–10) | Age Oxygen saturation Mean arterial pressure BUN CRP INR |
| 4C Mortality Score [11] | Low (0–3) Medium (4–8) High (9–14) Very high (≥15) | Age Gender Number of comorbidities Respiratory rate Oxygen saturation GCS BUN CRP |
| COVID-GRAM [12] | Low (<1.7%) Medium (1.7% to <40.4%) High (≥40.4%) | Chest X-ray abnormalities Age Haemoptysis Dyspnoea Unconsciousness Number of comorbidities Cancer history NLR LDH Direct bilirubin |
| Male | 64 (53.8) |
| Female | 55 (46.2) |
| Age (years) | 64.7 ± 18.4 |
| Any Comorbidity | 89 (74.8) |
| Hypertension | 56 (47.1) |
| Diabetes | 15 (12.6) |
| CKD | 13 (10.9) |
| Cardiovascular diseases | 23 (19.3) |
| Neuropsychiatric diseases | 20 (16.8) |
| COPD | 6 (5) |
| Cancer | 7 (5.9) |
| Chest X-ray abnormalities | 107 (89.9) |
| Dyspnoea | 54 (45.4) |
| In-hospital Mortality | 23 (19.3) |
| Transferred to ICU/SICU | 44 (36.9) |
| CALL Score | No. of Patients | Deaths | Transferred |
|---|---|---|---|
| Class A (4–6) | 19 | 0 | 2 |
| Class B (7–9) | 49 | 4 | 15 |
| Class C (10–13) | 51 | 19 | 27 |
| qCSI | No. of patients | Deaths | Transferred |
| Low (0–3) | 87 | 13 | 22 |
| Low–medium (4–6) | 23 | 5 | 13 |
| Medium–high (7–9) | 6 | 2 | 6 |
| High (10–12) | 3 | 3 | 3 |
| COVID Severity Score | No. of patients | Deaths | Transferred |
| Low (0–3) | 71 | 5 | 16 |
| Medium (4–7) | 46 | 16 | 26 |
| High (8–10) | 2 | 2 | 2 |
| 4C Mortality Score | No. of patients | Deaths | Transferred |
| Low (0–3) | 28 | 0 | 0 |
| Medium (4–8) | 36 | 1 | 11 |
| High (9–14) | 42 | 11 | 22 |
| Very high (≥ 15) | 13 | 11 | 11 |
| COVID-GRAM | No. of patients | Deaths | Transferred |
| Low (<1.7%) | 5 | 0 | 0 |
| Medium (1.7% to <40.4%) | 75 | 4 | 17 |
| High (≥40.4%) | 39 | 19 | 27 |
| Score | Risk Score | Sensitivity (95% CI) | Specificity (95% CI) | PPV (95% CI) | NPV (95% CI) | (+)LR (95% CI) | (-)LR (95% CI) |
|---|---|---|---|---|---|---|---|
| CALL Score | Class A | 100 (85.2–100) | 0.0 (0.0–3.8) | 19.3 | - | 1.00 | - |
| Class B | 100 (85.2–100) | 19.8 (12.4–29.2) | 23 (21.3–24.8) | 100 | 1.25 (1.13–1.38) | 0.00 | |
| Class C | 82.6 (61.2–95) | 66.7 (56.3–76) | 37.3 (29.7–45.5) | 94.1 (86.7–97.5) | 2.48 (1.76–3.48) | 0.26 (0.11–0.64) | |
| qCSI | Low | 100 (85.2–100) | 0.0 (0.0–3.8) | 19.3 | - | 1.00 | - |
| Low–medium | 43.5 (23.2–65.5) | 77.1 (67.4–85.0) | 31.3 (20.1–45.1) | 85.1 (79.6–89.2) | 1.90 (1.05–3.43) | 0.73 (0.50–1.07) | |
| Medium–high | 21.7 (7.5–43.7) | 95.8 (89.7–98.9) | 55.6 (26.7–81.1) | 83.6 (80.4–86.4) | 5.22 (1.52–17.91) | 0.82 (0.66–1.02) | |
| High | 13.0 (2.8–33.6) | 100 (96.2–100) | 100 | 82.8 (80.4–84.9) | - | 0.87 (0.74–1.02) | |
| COVID Severity Score | Low | 100 (85.2–100) | 0.0 (0.0–3.8) | 19.3 | - | 1.00 | - |
| Medium | 78.3 (56.3–92.5) | 68.8 (58.5–77.8) | 37.5 (29.4–46.4) | 93.0 (85.7–96.7) | 2.50 (1.74–3.61) | 0.32 (0.14–0.69) | |
| High | 8.7 (1.1–28.0) | 100 (96.2–100) | 100 | 82.1 (80.1–83.8) | - | 0.91 (0.80–1.04) | |
| 4C Mortality Score | Low | 100 (85.2–100) | 0.0 (0.0–3.8) | 19.3 | - | 1.00 | - |
| Medium | 100 (85.2–100) | 29.2 (20.3–39.3) | 25.3 (22.9–27.8) | 100 | 1.41 (1.24–1.61) | 0.00 | |
| High | 95.7 (78.1–99.9) | 65.6 (55.2–75.0) | 40.0 (33.3–47.1) | 98.4 (90.2–99.8) | 2.78 (2.08–3.72) | 0.07 (0.01–0.45) | |
| Very high | 47.8 (26.8–69.4) | 97.9 (92.7–99.7) | 84.6 (56.7–95.9) | 88.7 (84.1–92.1) | 22.96 (5.46–96.54) | 0.53 (0.36–0.79) | |
| COVID-GRAM | Low | 100 (85.2–100) | 0.0 (0.0–3.8) | 19.3 | - | 1.00 | - |
| Medium | 100 (85.2–100) | 5.2 (1.7–11.7) | 20.2 (19.4–20.9) | 100 | 1.05 (1.01–1.11) | 0.00 | |
| High | 82.6 (61.2–95.0) | 79.2 (69.7–86.8) | 48.7 (38.1–59.4) | 95.0 (88.6–97.9) | 3.97 (2.57–6.11) | 0.22 (0.09–0.54) |
| Score | Risk Score | Sensitivity (95% CI) | Specificity (95% CI) | PPV (95% CI) | NPV (95% CI) | (+)LR (95% CI) | (-)LR (95% CI) |
|---|---|---|---|---|---|---|---|
| CALL Score | Class A | 100 (92.0–100) | 0.0 (0.0–4.8) | 37.0 | - | 1.00 | - |
| Class B | 95.5 (84.5–99.4) | 22.7 (13.8–33.8) | 42.0 (38.7–45.4) | 89.5 (67.3–97.2) | 1.23 (1.07–1.42) | 0.20 (0.05–0.83) | |
| Class C | 61.4 (45.5–75.6) | 68.0 (56.2–78.3) | 52.9 (42.9–62.8) | 75.0 (66.7–81.8) | 1.92 (1.28–2.87) | 0.57 (0.38–0.85) | |
| qCSI | Low | 100 (92.0–100) | 0 (0–4.8) | 37.0 | - | 1.00 | - |
| Low–medium | 50.0 (34.6–65.4) | 86.7 (76.8–93.4) | 68.8 (53.5–80.8) | 74.7 (68.5–80.1) | 3.75 (1.96–7.17) | 0.58 (0.42–0.79) | |
| Medium–high | 20.5 (9.8–35.3) | 100 (95.2–100) | 100 | 68.2 (64.8–71.3) | - | 0.80 (0.68–0.92) | |
| High | 6.8 (1.4–18.7) | 100 (95.2–100) | 100 | 64.7 (62.8–66.5) | - | 0.93 (0.86–1.01) | |
| COVID Severity Score | Low | 100 (92.0–100) | 0.0 (0.0–4.8) | 37.0 | - | 1.00 | - |
| Medium | 63.6 (47.8–77.6) | 73.3 (61.9–82.9) | 58.3 (47.5–68.4) | 77.5 (69.4–83.9) | 2.39 (1.54–3.69) | 0.50 (0.33–0.75) | |
| High | 4.6 (0.6–15.5) | 100 (95.2–100) | 100 | 64.1 (62.6–65.6) | - | 0.95 (0.89–1.02) | |
| 4C Mortality Score | Low | 100 (92.0–100) | 0.0 (0.0–4.8) | 37.0 | - | 1.00 | - |
| Medium | 100 (92.0–100) | 37.3 (26.4–49.3) | 48.4 (44.0–52.7) | 100 | 1.60 (1.34–1.90) | 0.00 | |
| High | 75.0 (59.7–86.8) | 70.7 (59.0–80.6) | 60.0 (50.4–68.9) | 82.8 (73.9–89.1) | 2.56 (1.73–3.78) | 0.35 (0.21–0.60) | |
| Very high | 25.0 (13.2–40.3) | 97.3 (90.7–99.7) | 84.6 (56.1–95.9) | 68.9 (65.0–72.5) | 9.38 (2.18–40.37) | 0.77 (0.65–0.92) | |
| COVID-GRAM | Low | 100 (92.0–100) | 0.0 (0.0–4.8) | 37.0 | - | 1.00 | - |
| Medium | 100 (92.0–100) | 6.7 (2.2–14.9) | 38.6 (37.2–40.0) | 100 | 1.07 (1.01–1.14) | 0.00 | |
| High | 61.4 (45.5–75.6) | 84.0 (73.7–91.4) | 69.2 (56.0–79.9) | 78.7 (78.6–84.5) | 3.84 (2.17–6.78) | 0.46 (0.31–0.68) |
| In-Hospital Mortality | AUC | SE | 95% CI | p Value |
|---|---|---|---|---|
| CALL Score | 0.764 | 0.041 | 0.677 to 0.837 | <0.001 |
| qCSI | 0.621 | 0.061 | 0.528 to 0.709 | 0.046 |
| COVID Severity Score | 0.749 | 0.051 | 0.661 to 0.824 | <0.001 |
| 4C Mortality | 0.885 | 0.031 | 0.814 to 0.936 | <0.001 |
| COVID-GRAM | 0.813 | 0.044 | 0.732 to 0.879 | <0.001 |
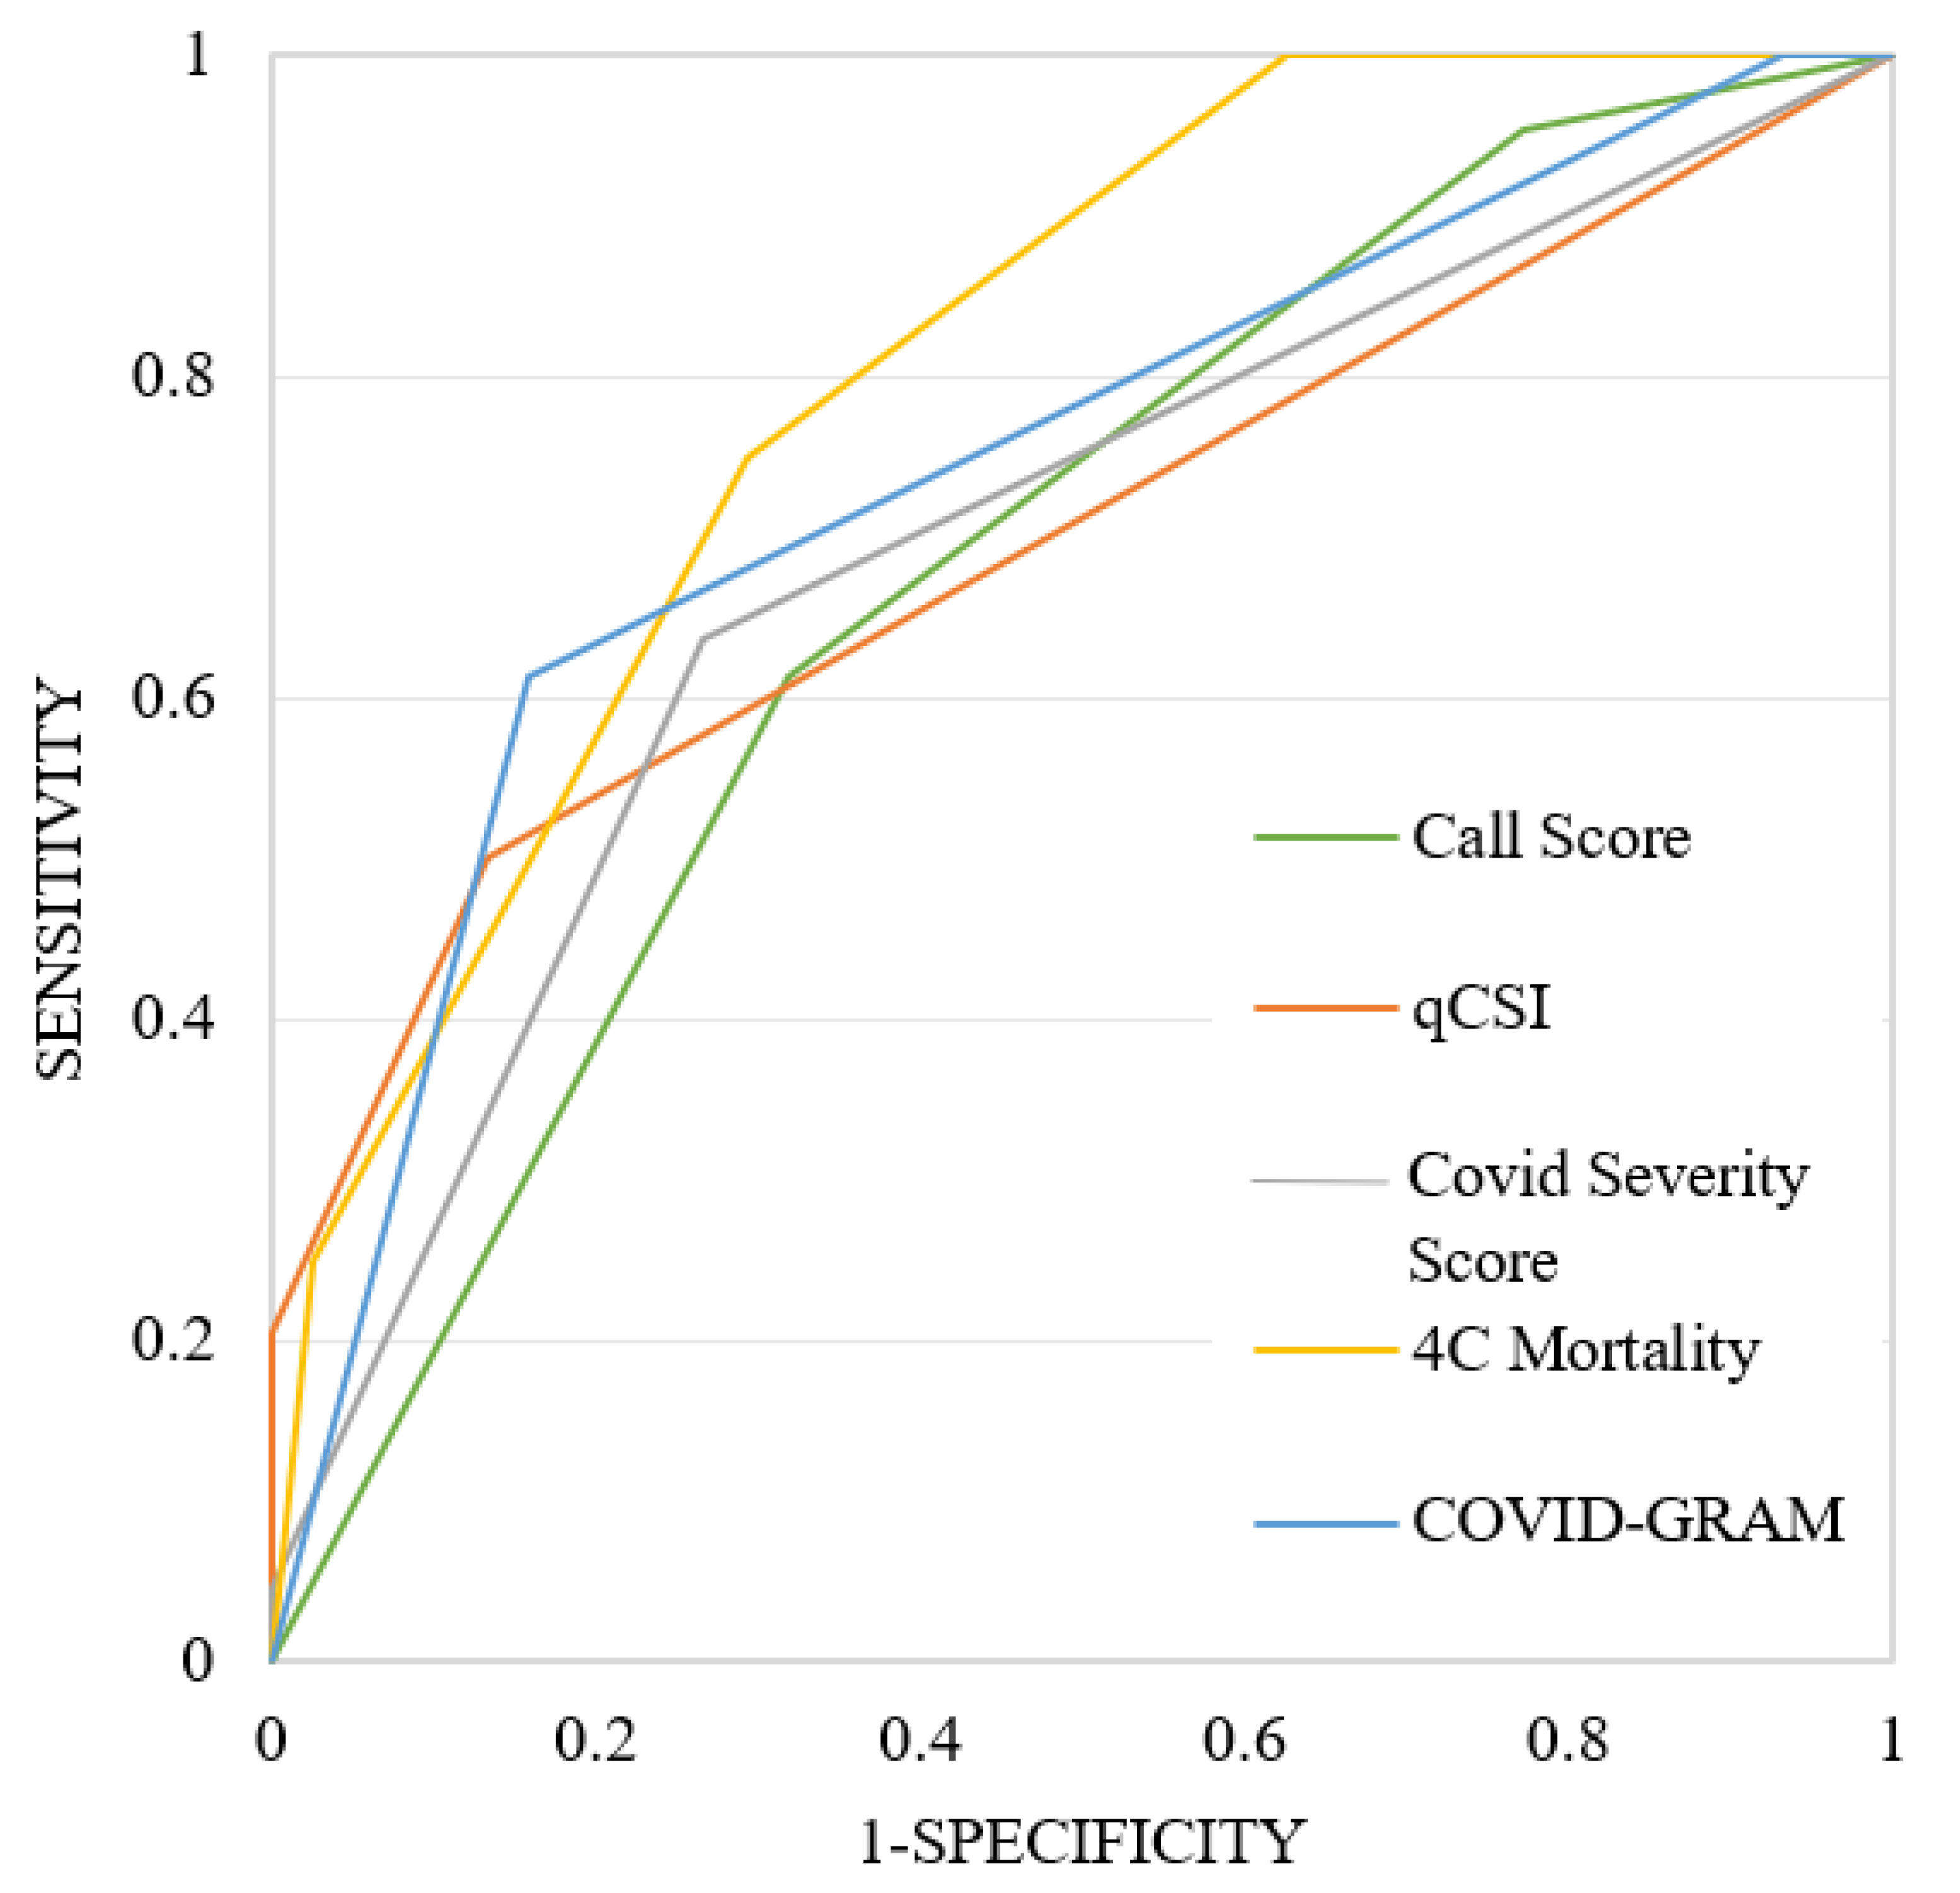
| ICU Admission | AUC | SE | 95% CI | p Value |
|---|---|---|---|---|
| CALL Score | 0.675 | 0.045 | 0.583 to 0.758 | <0.001 |
| qCSI | 0.697 | 0.043 | 0.606 to 0.778 | <0.001 |
| COVID Severity Score | 0.691 | 0.045 | 0.600 to 0.772 | <0.001 |
| 4C Mortality | 0.802 | 0.037 | 0.719 to 0.869 | <0.001 |
| COVID-GRAM | 0.740 | 0.041 | 0.651 to 0.816 | <0.001 |
| Score Comparison | |AUC1-AUC2| | SE | 95% CI | p Value | Cohen’s K |
|---|---|---|---|---|---|
| CALL Score~qCSI | 0.142 | 0.075 | −0.004 to 0.289 | 0.057 | 0.034 |
| CALL Score~CSS | 0.015 | 0.052 | −0.086 to 0.116 | 0.772 | 0.148 |
| CALL Score~4C Mortality | 0.121 | 0.042 | 0.038 to 0.204 | 0.004 | 0.509 |
| CALL Score~COVID-GRAM | 0.050 | 0.061 | −0.069 to 0.169 | 0.413 | 0.367 |
| qCSI~CSS | 0.127 | 0.075 | −0.020 to 0.274 | 0.089 | 0.205 |
| qCSI~4C Mortality | 0.264 | 0.070 | 0.127 to 0.400 | <0.001 | 0.125 |
| qCSI~COVID-GRAM | 0.192 | 0.076 | 0.049 to 0.341 | 0.012 | 0.052 |
| CSS~4C Mortality | 0.136 | 0.040 | 0.058 to 0.214 | <0.001 | 0.185 |
| CSS~COVID-GRAM | 0.065 | 0.069 | −0.071 to 0.201 | 0.350 | 0.061 |
| 4C Mortality~COVID-GRAM | 0.072 | 0.052 | −0.030 to 0.173 | 0.166 | 0.350 |
| Score Comparison | |AUC1-AUC2| | SE | 95% CI | p Value |
|---|---|---|---|---|
| CALL Score~qCSI | 0.022 | 0.064 | −0.104 to 0.148 | 0.734 |
| CALL Score~CSS | 0.016 | 0.041 | −0.064 to 0.096 | 0.699 |
| CALL Score~4C Mortality | 0.127 | 0.037 | 0.054 to 0.199 | <0.001 |
| CALL Score~COVID-GRAM | 0.065 | 0.050 | −0.033 to 0.162 | 0.193 |
| qCSI~CSS | 0.006 | 0.059 | −0.109 to 0.121 | 0.918 |
| qCSI~4C Mortality | 0.105 | 0.056 | −0.005 to 0.215 | 0.063 |
| qCSI~COVID-GRAM | 0.043 | 0.064 | −0.083 to 0.168 | 0.505 |
| CSS~4C Mortality | 0.111 | 0.035 | 0.042 to 0.180 | 0.002 |
| CSS~COVID-GRAM | 0.049 | 0.049 | −0.048 to 0.146 | 0.324 |
| 4C Mortality~COVID-GRAM | 0.062 | 0.043 | −0.022 to 0.146 | 0.146 |
Disclaimer/Publisher’s Note: The statements, opinions and data contained in all publications are solely those of the individual author(s) and contributor(s) and not of MDPI and/or the editor(s). MDPI and/or the editor(s) disclaim responsibility for any injury to people or property resulting from any ideas, methods, instructions or products referred to in the content. |
© 2025 by the authors. Licensee MDPI, Basel, Switzerland. This article is an open access article distributed under the terms and conditions of the Creative Commons Attribution (CC BY) license (https://creativecommons.org/licenses/by/4.0/).
Share and Cite
Geremia, A.; Montineri, A.; Sorce, A.; Xourafa, A.; Buccheri, E.; Catalano, A.; Castellino, P.; Gaudio, A.; D.O.CoV Research. Performance of Risk Scores in SARS-CoV-2 Infection: A Retrospective Study. Int. J. Environ. Res. Public Health 2025, 22, 1166. https://doi.org/10.3390/ijerph22081166
Geremia A, Montineri A, Sorce A, Xourafa A, Buccheri E, Catalano A, Castellino P, Gaudio A, D.O.CoV Research. Performance of Risk Scores in SARS-CoV-2 Infection: A Retrospective Study. International Journal of Environmental Research and Public Health. 2025; 22(8):1166. https://doi.org/10.3390/ijerph22081166
Chicago/Turabian StyleGeremia, Alessandro, Arturo Montineri, Alessandra Sorce, Anastasia Xourafa, Enrico Buccheri, Antonino Catalano, Pietro Castellino, Agostino Gaudio, and D.O.CoV Research. 2025. "Performance of Risk Scores in SARS-CoV-2 Infection: A Retrospective Study" International Journal of Environmental Research and Public Health 22, no. 8: 1166. https://doi.org/10.3390/ijerph22081166
APA StyleGeremia, A., Montineri, A., Sorce, A., Xourafa, A., Buccheri, E., Catalano, A., Castellino, P., Gaudio, A., & D.O.CoV Research. (2025). Performance of Risk Scores in SARS-CoV-2 Infection: A Retrospective Study. International Journal of Environmental Research and Public Health, 22(8), 1166. https://doi.org/10.3390/ijerph22081166