
Assessment of Static Balance Metrics in Community-Dwelling Older Adults Categorized Using the Fall Risk Appraisal Matrix


Abstract
1. Introduction
2. Materials and Methods
2.1. Setting and Sample Size
2.2. Balance Assessment
2.3. Fear of Falling
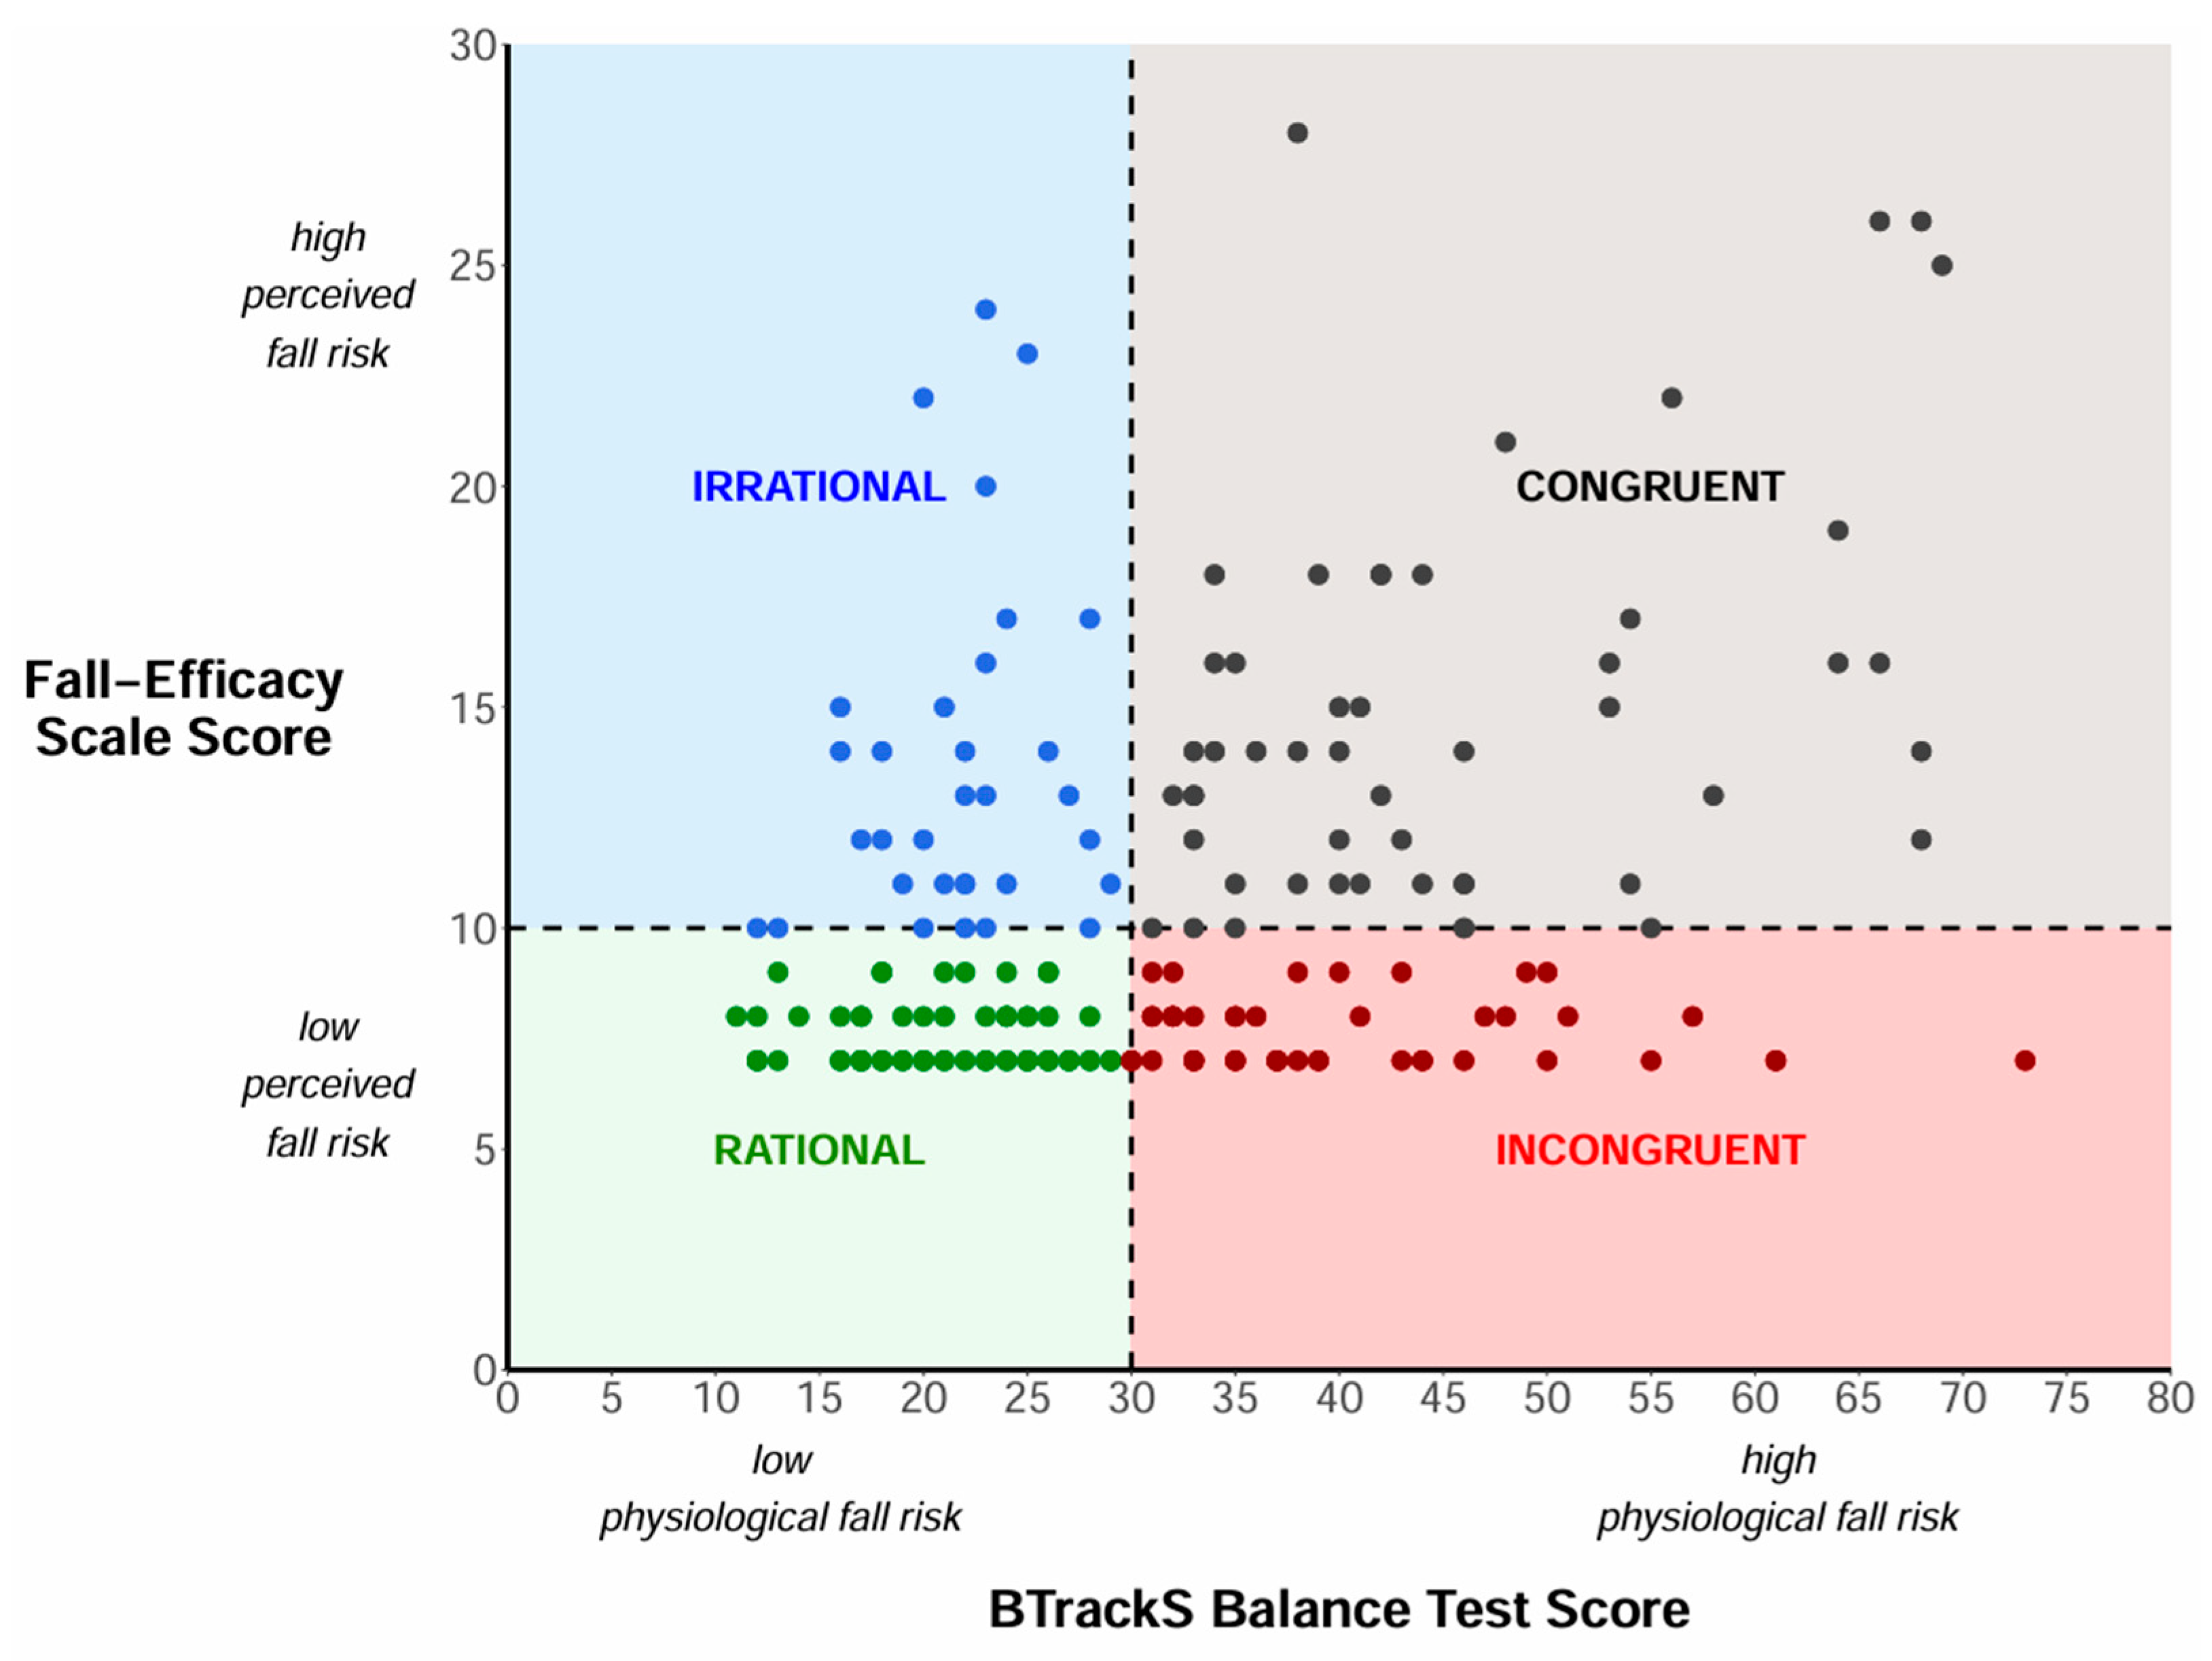
2.4. Fall Risk Appraisal Matrix (FRAM)
2.5. Statistical Analysis
3. Results
4. Discussion
Limitations and Future Directions
5. Conclusions
Author Contributions
Funding
Institutional Review Board Statement
Informed Consent Statement
Data Availability Statement
Acknowledgments
Conflicts of Interest
Abbreviations
| FRAM | Fall Risk Appraisal Matrix |
| FOF | Fear of falling |
| COP | Center of pressure |
| ML | Medial–lateral |
| AP | Anterior–posterior |
| 95% ELL | 95% elliptical sway area |
| RG-AP | Anterior–posterior sway range |
| RG-ML | Medial–lateral sway range |
| VEL | COP sway velocity |
References
- Strini, V.; Schiavolin, R.; Prendin, A. Fall risk assessment scales: A systematic literature review. Nurs. Rep. 2021, 11, 430–443. [Google Scholar] [CrossRef] [PubMed]
- Welch, S.A.; Ward, R.E.; Beauchamp, M.K.; Leveille, S.G.; Travison, T.; Bean, J.F. The short physical performance battery (SPPB): A quick and useful tool for fall risk stratification among older primary care patients. J. Am. Med. Dir. Assoc. 2021, 22, 1646–1651. [Google Scholar] [CrossRef] [PubMed]
- Said, C.M.; Churilov, L.; Shaw, K. Validation and inter-rater reliability of a three item falls risk screening tool. BMC Geriatr. 2017, 17, 273. [Google Scholar] [CrossRef]
- Podsiadlo, D.; Richardson, S. The Timed “Up & Go”: A Test of Basic Functional Mobility for Frail Elderly Persons. J. Am. Geriatr. Soc. 1991, 39, 142–148. [Google Scholar]
- Lohman, M.C.; Crow, R.S.; DiMilia, P.R.; Nicklett, E.J.; Bruce, M.L.; Batsis, J.A. Operationalisation and validation of the Stopping Elderly Accidents, Deaths, and Injuries (STEADI) fall risk algorithm in a nationally representative sample. J. Epidemiol. Community Health 2017, 71, 1191–1197. [Google Scholar] [CrossRef]
- Thiamwong, L.; Sole, M.L.; Ng, B.P.; Welch, G.F.; Huang, H.J.; Stout, J.R. Assessing fall risk appraisal through combined physiological and perceived fall risk measures using innovative technology. J. Gerontol. Nurs. 2020, 46, 41–47. [Google Scholar] [CrossRef]
- Gibbons, C.T.; Amazeen, P.G.; Likens, A.D. Effects of foot placement on postural sway in the anteroposterior and mediolateral directions. Motor Control 2019, 23, 149–170. [Google Scholar] [CrossRef] [PubMed]
- Deschamps, T.; Thomas-Ollivier, V.; Sauvaget, A.; Bulteau, S.; Fortes-Bourbousson, M.; Vachon, H. Balance characteristics in patients with major depression after a two-month walking exercise program: A pilot study. Gait Posture 2015, 42, 590–593. [Google Scholar] [CrossRef]
- Stylianou, A.P.; McVey, M.A.; Lyons, K.E.; Pahwa, R.; Luchies, C.W. Postural sway in patients with mild to moderate parkinson’s disease. Int. J. Neurosci. 2011, 121, 614–621. [Google Scholar] [CrossRef]
- Pieruccini-Faria, F.; Muir-Hunter, S.W.; Montero-Odasso, M. Do depressive symptoms affect balance in older adults with mild cognitive impairment? Results from the “gait and brain study”. Exp. Gerontol. 2018, 108, 106–111. [Google Scholar] [CrossRef]
- Tanaka, H.; Uetake, T. Characteristics of postural sway in older adults standing on a soft surface. J. Hum. Ergol. 2005, 34, 35–40. [Google Scholar]
- Lo, P.Y.; Su, B.L.; You, Y.L.; Yen, C.W.; Wang, S.T.; Guo, L.Y. Measuring the reliability of postural sway measurements for a static standing task: The effect of age. Front. Physiol. 2022, 13, 850707. [Google Scholar] [CrossRef]
- Oliveira, M.R.; Vieira, E.R.; Gil, A.W.O.; Fernandes, K.B.P.; Teixeira, D.C.; Amorim, C.F.; da Silva, R.A. One-legged stance sway of older adults with and without falls. PLoS ONE 2018, 13, e0203887. [Google Scholar] [CrossRef] [PubMed]
- Szczepańska-Gieracha, J.; Cieślik, B.; Chamela-Bilińska, D.; Kuczyński, M. Postural stability of elderly people with cognitive impairments. Am. J. Alzheimer’s Dis. Other Dement. 2016, 31, 241–246. [Google Scholar] [CrossRef] [PubMed]
- Prado, J.M.; Stoffregen, T.A.; Duarte, M. Postural sway during dual tasks in young and elderly adults. Gerontology 2007, 53, 274–281. [Google Scholar] [CrossRef] [PubMed]
- Mignardot, J.B.; Beauchet, O.; Annweiler, C.; Cornu, C.; Deschamps, T. Postural sway, falls, and cognitive status: A cross-sectional study among older adults. J. Alzheimer’s Dis. 2014, 41, 431–439. [Google Scholar] [CrossRef]
- Rugelj, D.; Se, F. Postural sway area of elderly subjects. WSEAS Trans. Signal Process. 2007, 3, 213–219. [Google Scholar]
- Piirtola, M.; Era, P. Force platform measurements as predictors of falls among older people—A review. Gerontology 2006, 52, 1–16. [Google Scholar] [CrossRef]
- Thiamwong, L.; Ng, B.P.; Kwan, R.Y.C.; Suwanno, J. Maladaptive fall risk appraisal and falling in community-dwelling adults aged 60 and Older: Implications for screening. Clin. Gerontol. 2021, 44, 552–561. [Google Scholar] [CrossRef]
- Thiamwong, L.; Xie, R.; Park, J.H.; Choudhury, R.; Malatyali, A.; Li, W.; Eckstrom, E.; Stout, J.R. Levels of accelerometer-based physical activity in older adults with a mismatch between physiological fall risk and fear of falling. J. Gerontol. Nurs. 2023, 49, 41–49. [Google Scholar] [CrossRef]
- Sapmaz, M.; Mujdeci, B. The effect of fear of falling on balance and dual task performance in the elderly. Exp. Gerontol. 2021, 147, 111250. [Google Scholar] [CrossRef] [PubMed]
- Thiamwong, L.; Xie, R.; Park, J.H.; Lighthall, N.; Loerzel, V.; Stout, J. Optimizing a technology-based body and mind intervention to prevent falls and reduce health disparities in low-income populations: Protocol for a clustered randomized controlled trial. JMIR Res. Protoc. 2023, 12, e51899. [Google Scholar] [CrossRef] [PubMed]
- Historical Poverty Thresholds. Available online: https://www.census.gov/data/tables/time-series/demo/income-poverty/historical-poverty-thresholds.html (accessed on 12 January 2025).
- Harris, P.A.; Taylor, R.; Thielke, R.; Payne, J.; Gonzalez, N.; Conde, J.G. Research electronic data capture (REDCap)--a metadata-driven methodology and workflow process for providing translational research informatics support. J. Biomed. Inform. 2009, 42, 377–381. [Google Scholar] [CrossRef]
- BTrackS Assess Balance: Some Common Applications and Use. Available online: https://balancetrackingsystems.com/assess-balance (accessed on 18 January 2025).
- Goble, D.J.; Hearn, M.C.; Baweja, H.S. Combination of BTrackS and Geri-Fit as a targeted approach for assessing and reducing the postural sway of older adults with high fall risk. Clin. Interv. Aging 2017, 12, 351–357. [Google Scholar] [CrossRef] [PubMed]
- Levy, S.S.; Thralls, K.J.; Kviatkovsky, S.A. Validity and reliability of a portable Balance Tracking System, BTrackS, in older adults. J. Geriatr. Phys. Ther. 2018, 41, 102–107. [Google Scholar] [CrossRef]
- Kempen, G.I.; Yardley, L.; van Haastregt, J.C.; Zijlstra, G.A.; Beyer, N.; Hauer, K.; Todd, C. The Short FES-I: A shortened version of the falls efficacy scale-international to assess fear of falling. Age Ageing 2008, 37, 45–50. [Google Scholar] [CrossRef]
- Suarez, J.R.M.; Lafontant, K.; Blount, A.; Park, J.H.; Thiamwong, L. Recreating Fall Risk Appraisal matrix using R to support fall prevention programs. JAMIA Open 2024, 7, ooae088. [Google Scholar] [CrossRef]
- Hamed, K.; Roaldsen, K.S.; Halvarsson, A. “Fear of falling serves as protection and signifies potential danger”: A qualitative study to conceptualise the phrase “fear of falling” in women with osteoporosis. Osteoporos. Int. 2021, 32, 2563–2570. [Google Scholar] [CrossRef]
- Yardley, L. Fear of falling: Links between imbalance and anxiety. Rev. Clin. Gerontol. 2004, 13, 195–201. [Google Scholar] [CrossRef]
- Mahler, M.; Sarvimäki, A. Fear of falling from a daily life perspective; Narratives from later life. Scand. J. Caring Sci. 2012, 26, 38–44. [Google Scholar] [CrossRef]
- Ellmers, T.J.; Wilson, M.R.; Norris, M.; Young, W.R. Protective or harmful? A qualitative exploration of older people’s perceptions of worries about falling. Age Ageing 2022, 51, afac067. [Google Scholar] [CrossRef] [PubMed]
- Azevedo, T.M.; Volchan, E.; Imbiriba, L.A.; Rodrigues, E.C.; Oliveira, J.M.; Oliveira, L.F.; Lutterbach, L.G.; Vargas, C.D. A freezing-like posture to pictures of mutilation. Psychophysiology 2005, 42, 255–260. [Google Scholar] [CrossRef] [PubMed]
- Carpenter, M.G.; Frank, J.S.; Silcher, C.P.; Peysar, G.W. The influence of postural threat on the control of upright stance. Exp. Brain Res. 2001, 138, 210–218. [Google Scholar] [CrossRef] [PubMed]
- Adkin, A.L.; Frank, J.S.; Carpenter, M.G.; Peysar, G.W. Fear of falling modifies anticipatory postural control. Exp. Brain Res. 2002, 143, 160–170. [Google Scholar] [CrossRef]
- Binda, S.M.; Culham, E.G.; Brouwer, B. Balance, muscle strength, and fear of falling in older adults. Exp. Aging Res. 2003, 29, 205–219. [Google Scholar] [CrossRef]
- Davis, J.R.; Campbell, A.D.; Adkin, A.L.; Carpenter, M.G. The relationship between fear of falling and human postural control. Gait Posture 2009, 29, 275–279. [Google Scholar] [CrossRef]
- Weber, P.C.; Cass, S.P. Clinical assessment of postural stability. Am. J. Otol. 1993, 14, 566–569. [Google Scholar]

| Category | Variables | Rational (N = 68) | Irrational (N = 32) | Incongruent (N = 47) | Congruent (N = 56) | Total (N = 203) |
|---|---|---|---|---|---|---|
| Sex | Female | 62 | 31 | 35 | 48 | 176 |
| Male | 6 | 1 | 12 | 8 | 27 | |
| Age (years) | mean ± SD | 73.4 ± 6.5 | 75.1 ± 8.1 | 75.4 ± 7.8 | 76.4 ± 7.0 | 75.0 ± 7.2 |
| Range | 62–89 | 61–87 | 61–96 | 62–92 | 61–96 | |
| BMI (kg/m2) | mean ± SD | 28.4 ± 5.4 | 30.5 ± 8.3 | 30.7 ± 6.2 | 31.7 ± 6.0 | 30.2 ± 6.4 |
| General Health | Poor | 0 | 3 | 0 | 0 | 3 |
| Fair | 3 | 8 | 6 | 17 | 34 | |
| Good | 34 | 15 | 22 | 28 | 99 | |
| Very good | 28 | 6 | 14 | 11 | 59 | |
| Excellent | 3 | 0 | 5 | 0 | 8 | |
| Education | Lower than high school | 9 | 7 | 7 | 6 | 29 |
| High school | 37 | 12 | 23 | 25 | 97 | |
| College or above | 22 | 13 | 17 | 25 | 77 | |
| Financial Status | Much less than adequate | 8 | 4 | 1 | 3 | 16 |
| Less than adequate | 10 | 9 | 8 | 9 | 36 | |
| Just enough | 38 | 16 | 30 | 35 | 119 | |
| More than enough | 9 | 3 | 7 | 8 | 27 | |
| Much more than enough | 3 | 0 | 1 | 1 | 5 | |
| Living Status | Alone | 43 | 18 | 26 | 34 | 121 |
| With partner/spouse | 17 | 7 | 10 | 8 | 42 | |
| With family/friends | 8 | 6 | 11 | 10 | 35 | |
| Other | 0 | 1 | 0 | 4 | 5 |
| Balance Variable | Rational | Irrational | Incongruent | Congruent | ||||
|---|---|---|---|---|---|---|---|---|
| Median (IQR) | p-Value | Median (IQR) | p-Value | Median (IQR) | p-Value | Median (IQR) | p-Value | |
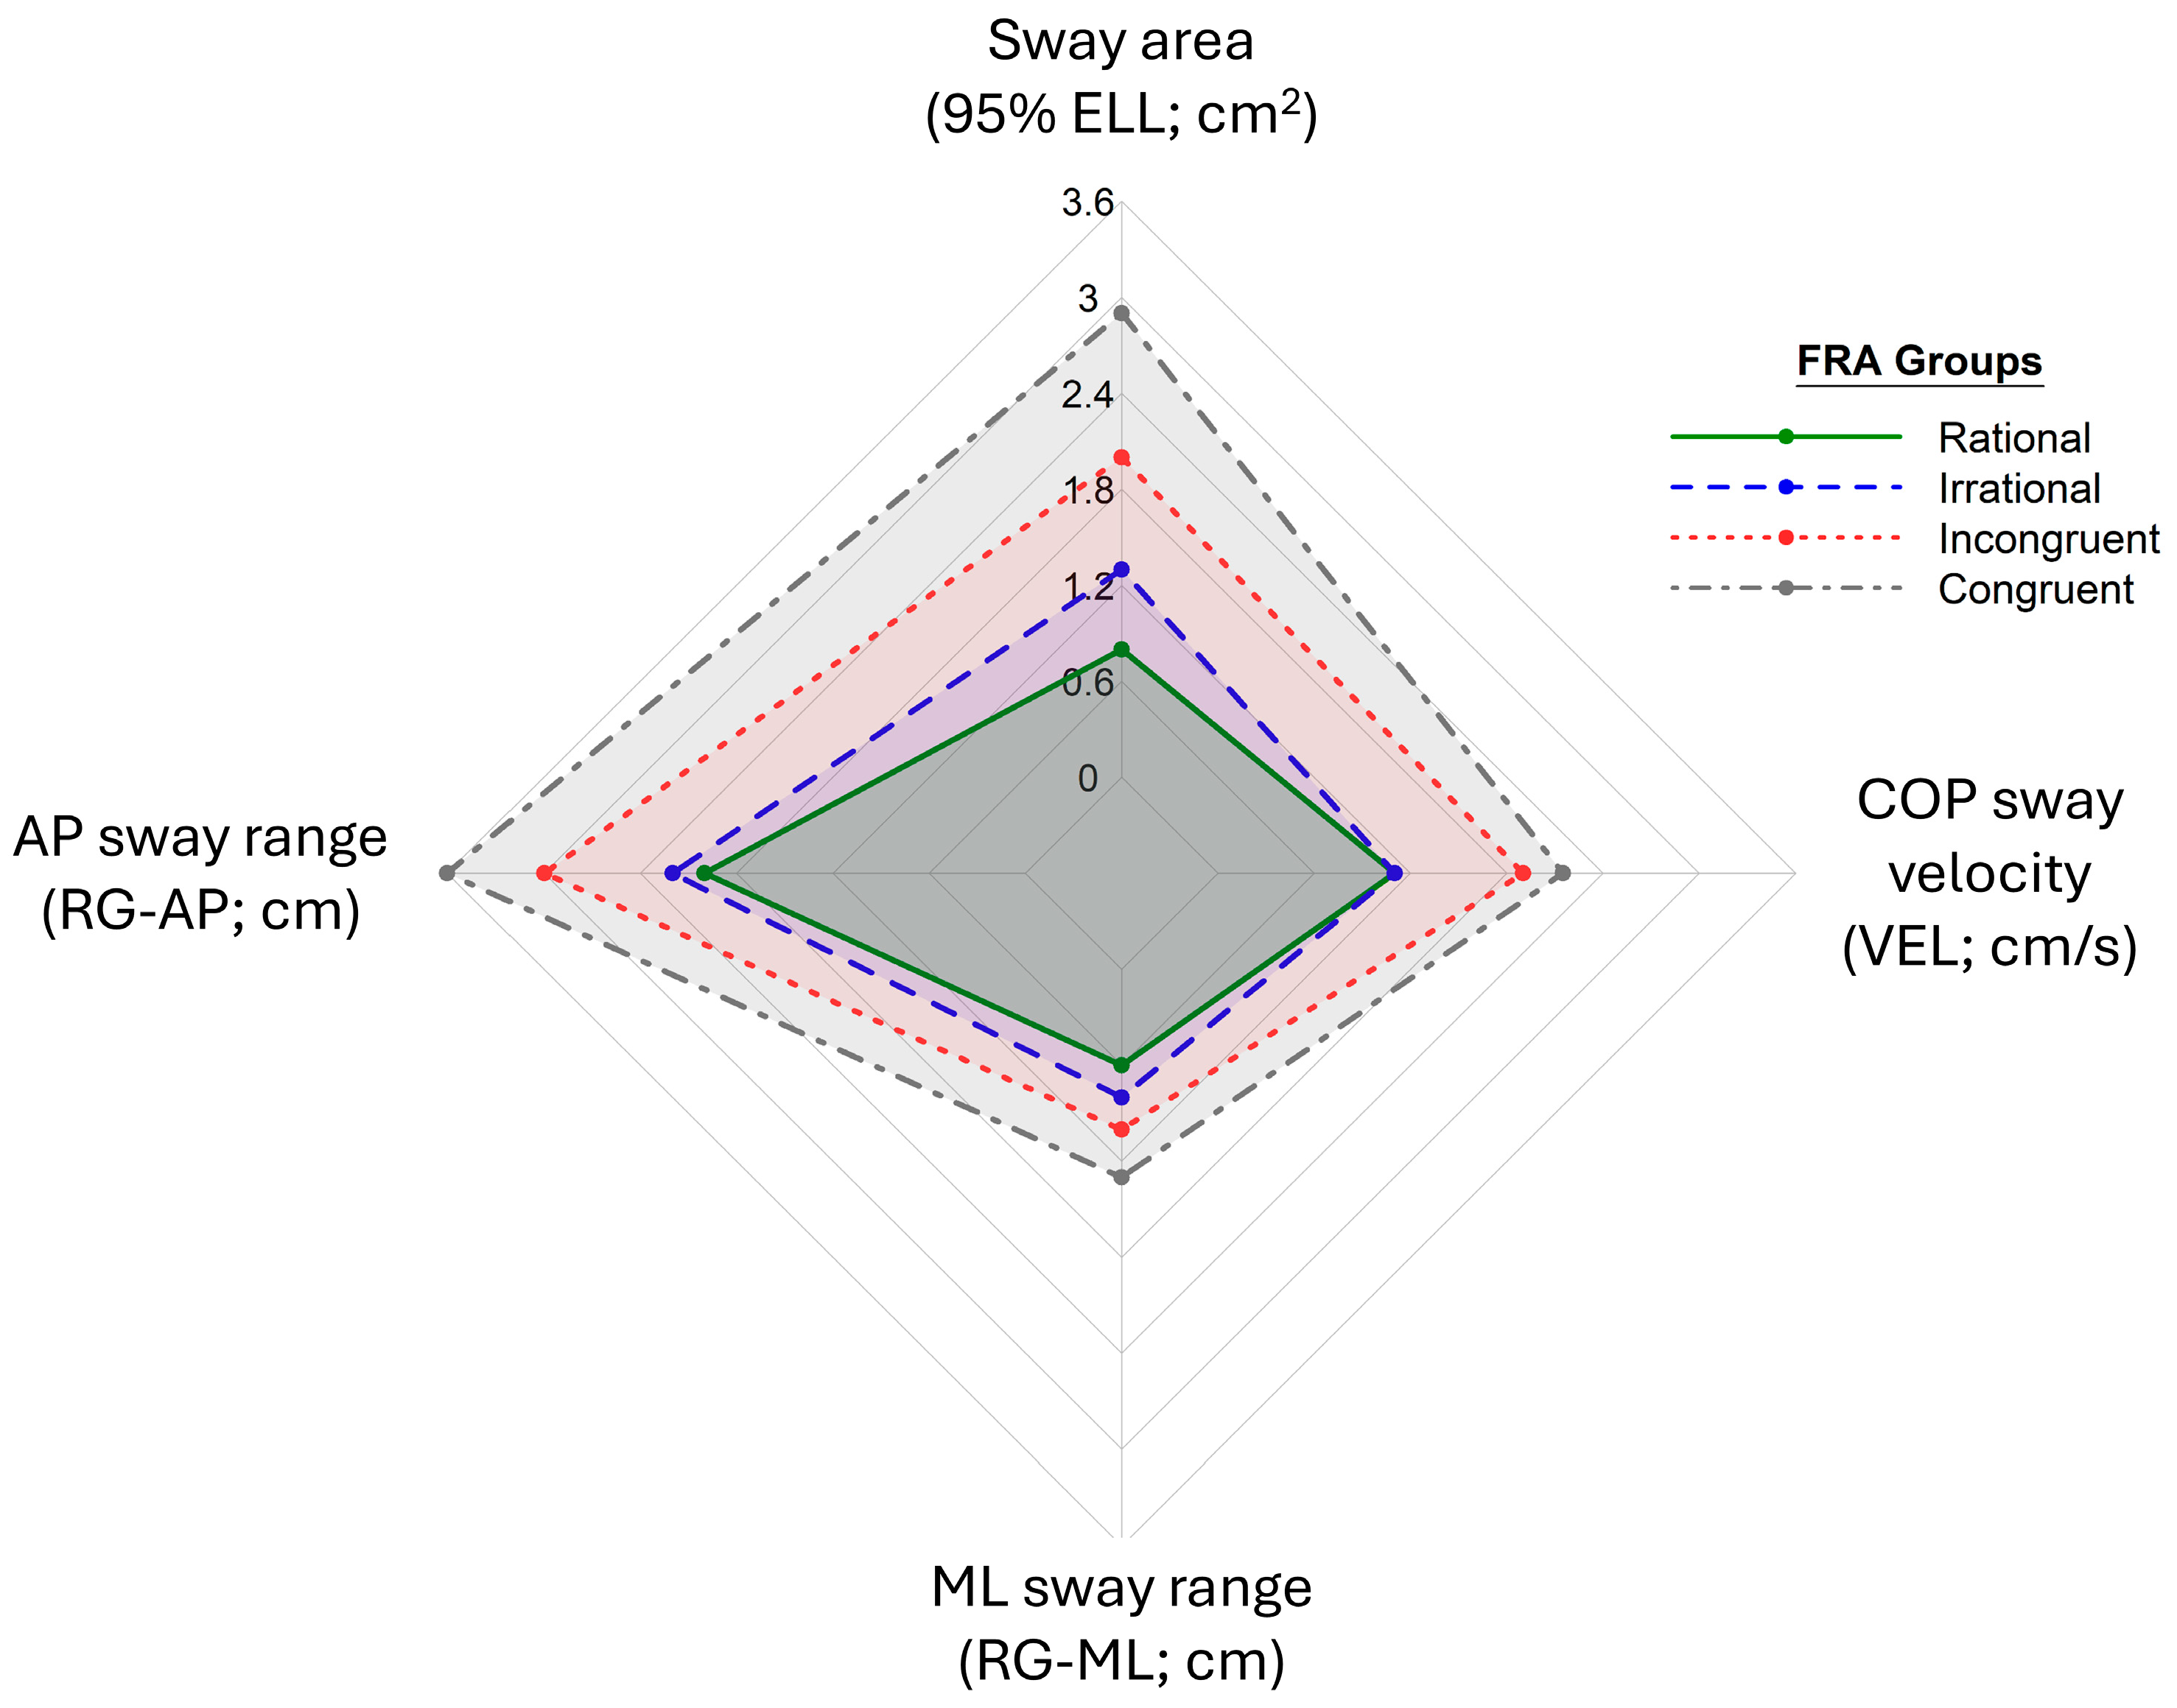
| Sway area (95% ELL; cm2) | 0.8 (0.8) | <0.001 * | 1.3 (1.0) | 0.003 * | 2.0 (1.4) | <0.001 * | 2.9 (4.5) | <0.001 * |
| AP sway range (RG-AP; cm) | 2.0 (0.9) | <0.001 * | 2.2 (0.6) | 0.054 | 3.0 (1.3) | <0.001 * | 3.6 (2.1) | <0.001 * |
| ML sway range (RG-ML; cm) | 0.6 (0.3) | <0.001 * | 0.8 (0.4) | <0.001 * | 1.0 (0.5) | <0.001 * | 1.3 (1.2) | <0.001 * |
| COP sway velocity (VEL; cm/s) | 1.1 (0.4) | <0.001 * | 1.1 (0.2) | <0.001 * | 1.9 (0.8) | <0.001 * | 2.2 (0.8) | <0.001 * |
| Group Comparison | Variable | Sway Area (95% ELL; cm2) | AP Sway Range (RG-AP; cm) | ML Sway Range (RG-ML; cm) | COP Sway Velocity (VEL; cm/s) |
|---|---|---|---|---|---|
| Rational– Irrational | Percent change (%) | +63% | +10% | +33% | +0% |
| p-Value | 0.067 | 1.000 | 0.111 | 1.000 | |
| Effect size (r) | 0.178 | 0.062 | 0.165 | 0.037 | |
| Rational– Incongruent | Percent change (%) | +150% | +50% | +66% | +73% |
| p-Value | <0.001 * | <0.001 * | <0.001 * | <0.001 * | |
| Effect size (r) | 0.432 | 0.424 | 0.407 | 0.583 | |
| Rational– Congruent | Percent change (%) | +263% | +80% | +77% | +100% |
| p-Value | <0.001 * | <0.001 * | <0.001 * | <0.001 * | |
| Effect size (r) | 0.641 | 0.574 | 0.551 | 0.706 | |
| Irrational– Incongruent | Percent change (%) | +35% | +36% | +25% | +73% |
| p-Value | 0.038 | <0.001 * | 0.056 | <0.001 * | |
| Effect size (r) | 0.191 | 0.293 | 0.182 | 0.448 | |
| Irrational– Congruent | Percent change (%) | +123% | +64% | +63% | +100% |
| p-Value | <0.001 * | <0.001 * | <0.001 * | <0.001 * | |
| Effect size (r) | 0.350 | 0.407 | 0.289 | 0.539 | |
| Incongruent– Congruent | Percent change (%) | +45% | +20% | +30% | +16% |
| p-Value | 0.091 | 0.582 | 0.655 | 1.000 | |
| Effect size (r) | 0.170 | 0.116 | 0.112 | 0.085 |
Disclaimer/Publisher’s Note: The statements, opinions and data contained in all publications are solely those of the individual author(s) and contributor(s) and not of MDPI and/or the editor(s). MDPI and/or the editor(s) disclaim responsibility for any injury to people or property resulting from any ideas, methods, instructions or products referred to in the content. |
© 2025 by the authors. Licensee MDPI, Basel, Switzerland. This article is an open access article distributed under the terms and conditions of the Creative Commons Attribution (CC BY) license (https://creativecommons.org/licenses/by/4.0/).
Share and Cite
Suarez, J.R.M.; Park, J.-H.; Thiamwong, L. Assessment of Static Balance Metrics in Community-Dwelling Older Adults Categorized Using the Fall Risk Appraisal Matrix. Int. J. Environ. Res. Public Health 2025, 22, 1079. https://doi.org/10.3390/ijerph22071079
Suarez JRM, Park J-H, Thiamwong L. Assessment of Static Balance Metrics in Community-Dwelling Older Adults Categorized Using the Fall Risk Appraisal Matrix. International Journal of Environmental Research and Public Health. 2025; 22(7):1079. https://doi.org/10.3390/ijerph22071079
Chicago/Turabian StyleSuarez, Jethro Raphael M., Joon-Hyuk Park, and Ladda Thiamwong. 2025. "Assessment of Static Balance Metrics in Community-Dwelling Older Adults Categorized Using the Fall Risk Appraisal Matrix" International Journal of Environmental Research and Public Health 22, no. 7: 1079. https://doi.org/10.3390/ijerph22071079
APA StyleSuarez, J. R. M., Park, J.-H., & Thiamwong, L. (2025). Assessment of Static Balance Metrics in Community-Dwelling Older Adults Categorized Using the Fall Risk Appraisal Matrix. International Journal of Environmental Research and Public Health, 22(7), 1079. https://doi.org/10.3390/ijerph22071079