
Nicotine Dependence in a Banned Market: Biomarker Evidence from E-Cigarette Users in São Paulo, Brazil

 ,
,  , , , , and
Abstract
1. Introduction
2. Materials and Methods
2.1. Study Design and Procedures
2.2. Questionnaire Information
2.3. Nicotine and Cotinine Determination in Oral Fluid
2.4. Data Analysis and Statistics
3. Results
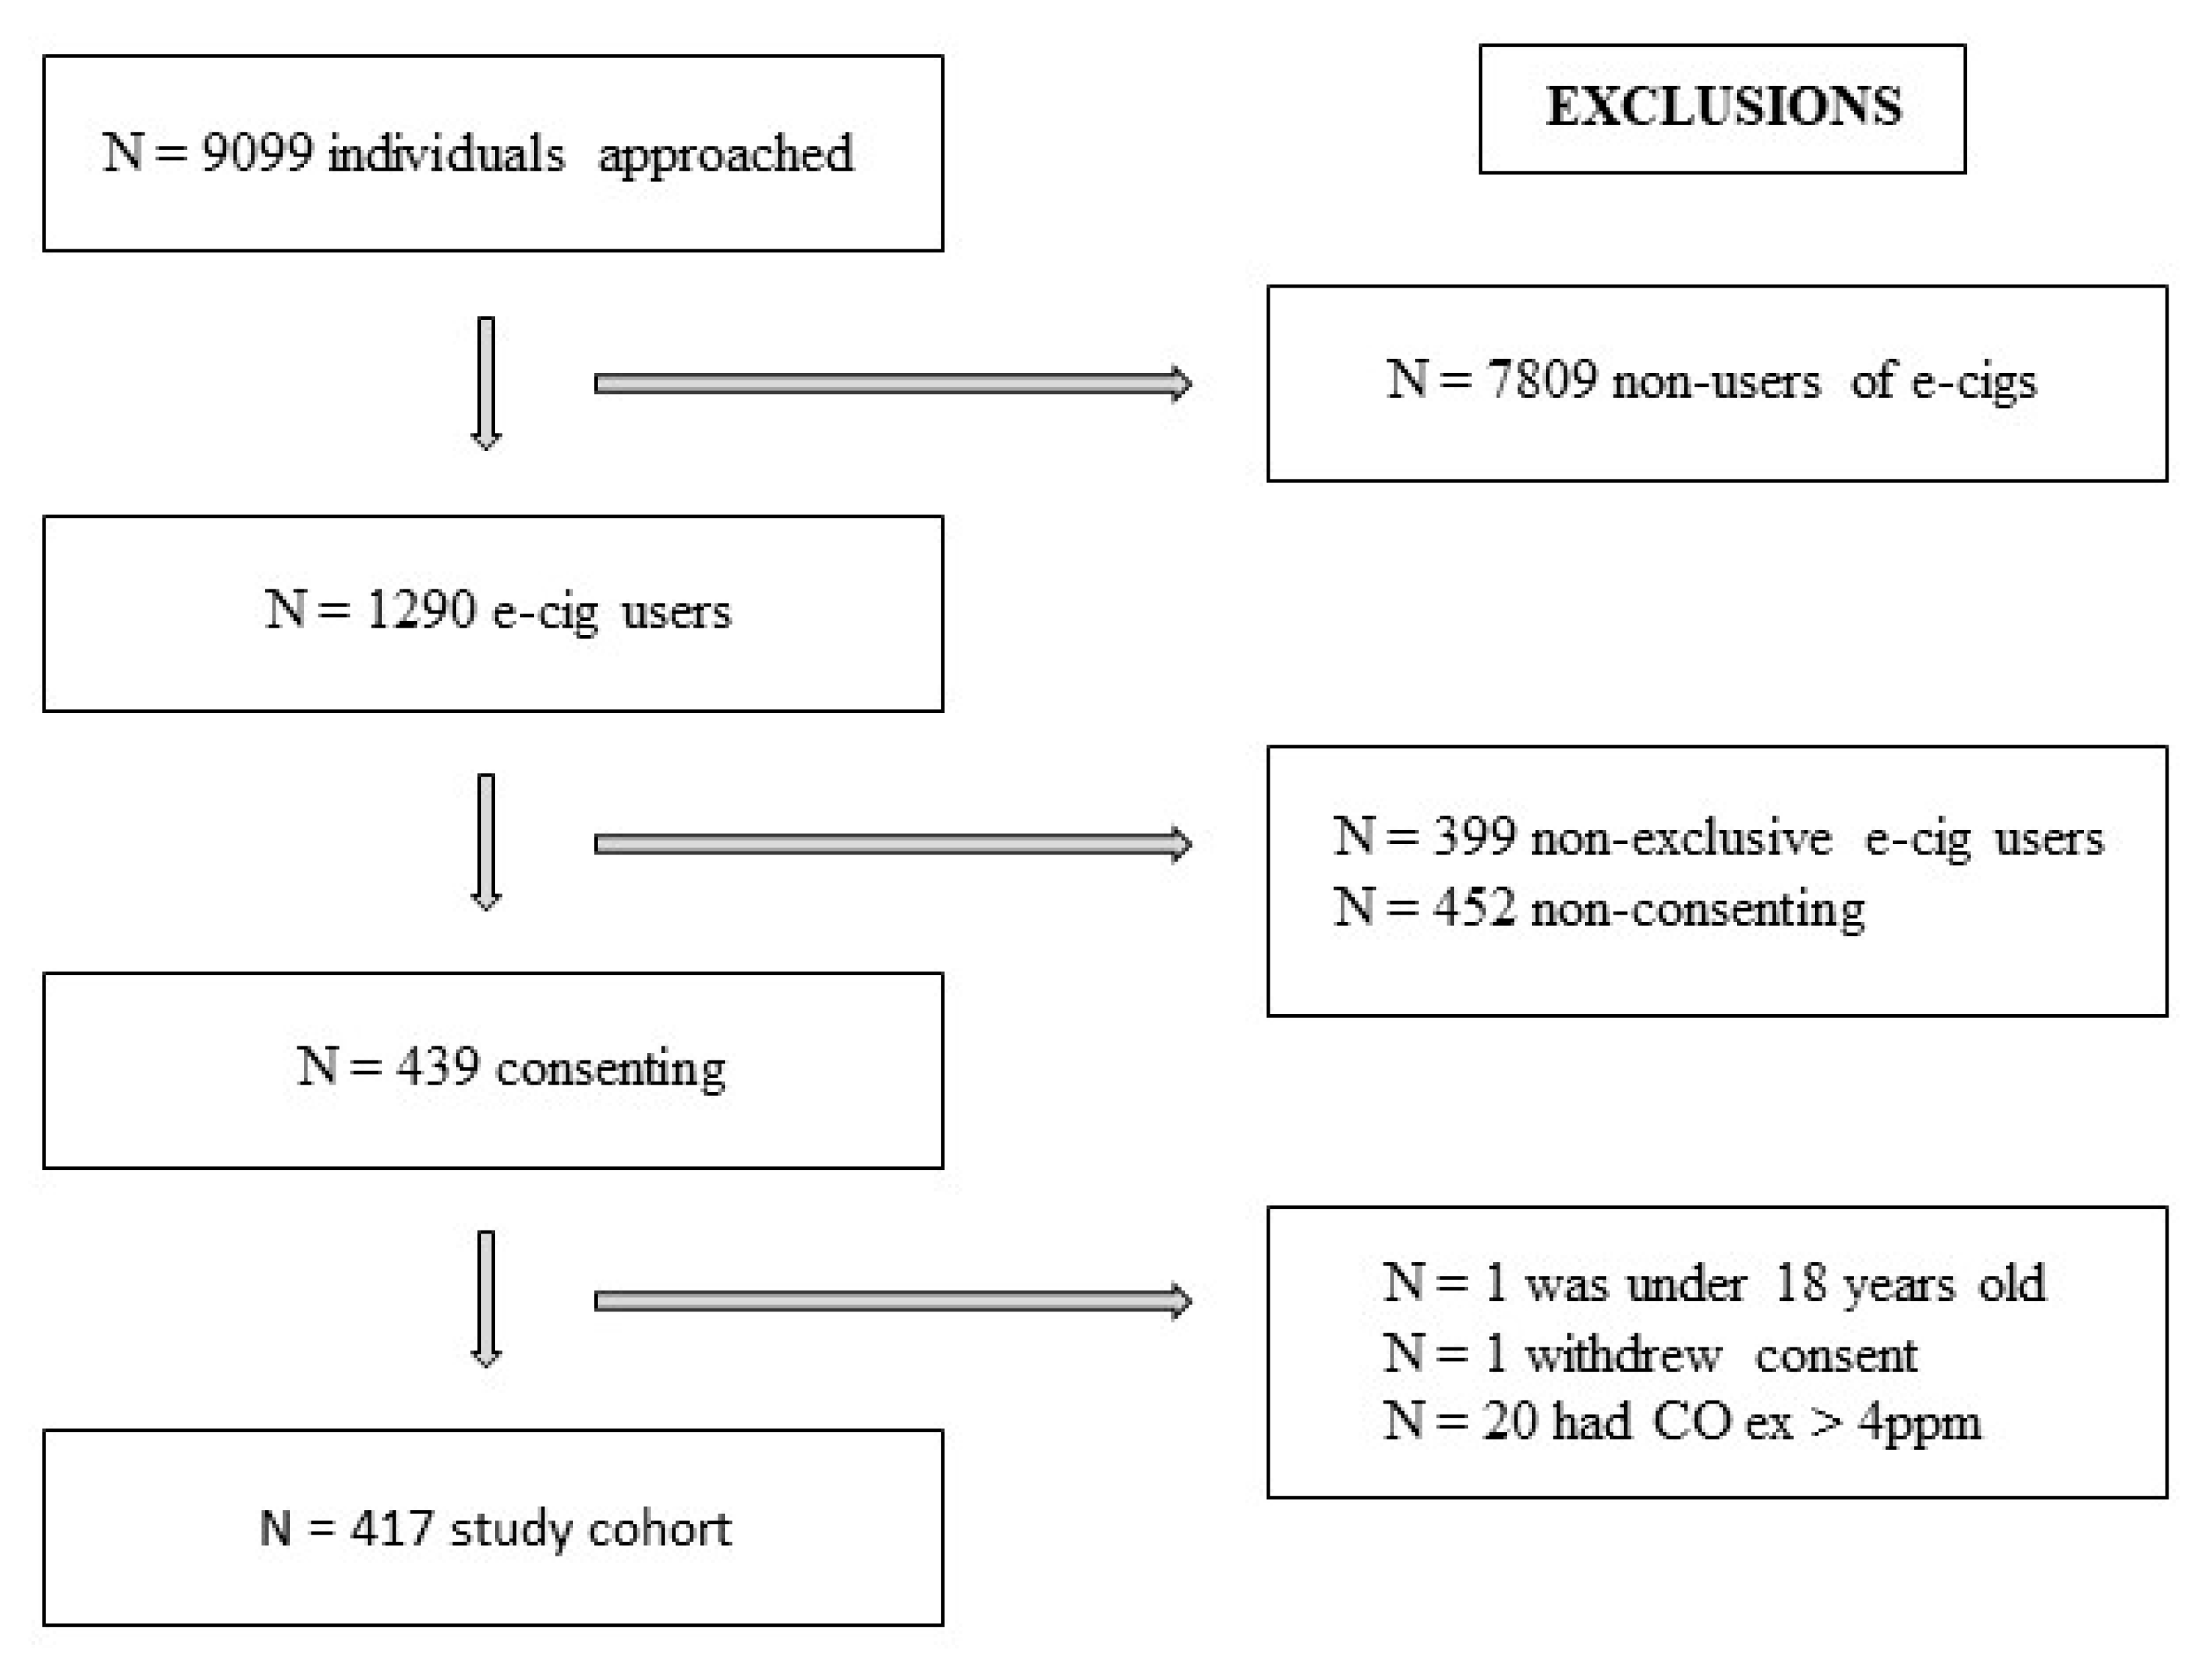
3.1. Screening
3.2. Sociodemographic Characteristics and Smoking History
3.3. E-Cigarette Consumption and Biomarker Concentrations
3.4. Nicotine and Cotinine Concentrations in Oral Fluid
3.5. Participants’ Perception of Nicotine Addiction
3.6. Subgroup Analysis of E-Cigarette Users with Nicotine Concentrations Above 400 ng/mL
3.7. Participant Perception of Health and Social Impact, Addiction, Associated Risks, Attempts to Quit Vaping, Future Perspectives, and Government Regulations
4. Discussion
Study Limitations
5. Conclusions
Supplementary Materials
Author Contributions
Funding
Institutional Review Board Statement
Informed Consent Statement
Data Availability Statement
Acknowledgments
Conflicts of Interest
Abbreviations
| LC-MS/MS | Liquid Chromatography–Tandem Mass Spectrometry |
| ANVISA | National Health Surveillance Agency |
| VIGITEL | Surveillance of Risk and Protective Factors for Chronic Diseases by Telephone Survey |
| BMI | Body Mass Index |
References
- Resolução Diretoria Colegiada da Agência Nacional de Vigilância Sanitária do (ANVISA) Ministério da Saúde do Brasil. RDC Resolução-RDC n. 46/2009, de 28 de Agosto de 2009. Proíbe a Comercialização, a Importação e a Propaganda de Quaisquer Dispositivos Eletrônicos Para Fumar, Conhecidos Como Cigarro Eletrônico. Brasília, 2009. Available online: https://bvsms.saude.gov.br/bvs/saudelegis/anvisa/2009/res0046_28_08_2009.html (accessed on 12 January 2025).
- Secretaria de Vigilância em Saúde e Ambiente Departamento de Análise Epidemiológica e Vigilância de Doenças Não Transmissíveis. Vigitel Brasil 2006–2023: Tabagismo e Consumo Abusivo de Álcool:–Brasília: Ministério da Saúde, 2023. 70p. ISBN 978-65-5993-525-3. Available online: https://www.gov.br/saude/pt-br/centrais-de-conteudo/publicacoes/svsa/vigitel/vigitel-brasil-2006-2023-tabagismo-e-consumo-abusivo-de-alcool/view (accessed on 12 January 2025).
- Scholz, J.R.; Valente, G.V.; Hashimoto, A.; Marques, G.; Nagamine, E.; Abe, T.M.O. Cotinine Urinary level in Eletronic Cigarettes Users. Serie cases in São Paulo, Brazil. In Proceedings of the Society for Research on Nicotine & Tobacco, Edinburgh, Scotland, 20–23 March 2024; POS3-40. p. 202. [Google Scholar]
- Kim, S. Overview of Cotinine Cutoff Values for Smoking Status Classification. Int. J. Environ. Res. Public Health 2016, 13, 1236. [Google Scholar] [CrossRef] [PubMed] [PubMed Central]
- Fu, M.; Martínez-Sánchez, J.M.; Agudo, A.; Pascual, J.A.; Ariza, C.; Moncada, A.; Fernández, E.; DCOT Study Investigators. Nicotine dependence and salivary cotinine concentration in daily smokers. Eur. J. Cancer Prev. 2012, 21, 96–102. [Google Scholar] [CrossRef]
- Pierce, J.P.; Leas, E.C.; Strong, D.R. Biochemical Validation of Dependence on JUUL and Other E-Cigarettes Among Youth. Pediatrics 2023, 151, e2022059158. [Google Scholar] [CrossRef]
- Issa, J.S.; Abe, T.M.O.; Pereira, A.C.; Megid, M.C.; Shimabukuro, C.E.; Valentin, L.S.O.; da C Ferreira, M.M.; Nobre, M.R.C.; Lancarotte, I.; Barretto, A.C.P. The effect of São Paulo’s smoke-free legislation on carbon monoxide concentration in hospitality venues and their workers. Tob. Control 2011, 20, 156–162. [Google Scholar] [CrossRef]
- Salivate SARSTEDT AG & Co. Available online: https://www.sarstedt.com/en/products/diagnostic/salivasputum/product/51.1534/ (accessed on 15 January 2025).
- Novalen, M.; Chenoweth, M.J.; Zhao, B.; Hawk, L.W., Jr.; Tyndale, R.F. Stability of Varenicline Concentration in Saliva Over 21 Days at Three Storage Temperatures. Nicotine Tob. Res. 2022, 24, 270–274. [Google Scholar] [CrossRef] [PubMed]
- American Academy of Forensic Sciences. Standard practices for method validation in Forensic Toxicology. 2019. Available online: https://www.aafs.org/sites/default/files/media/documents/036_Std_e1.pdf (accessed on 15 January 2025).
- Resolução Diretoria Colegiada da Agência Nacional de Vigilância Sanitária do (ANVISA) Ministério da Saúde do Brasil. RDC Resolução-RDC n. 855/2024, de 23 de Abril de 2024. Proíbe a Fabricação, a Importação, a Comercialização, a Distribuição, o Armazenamento, o Transporte e a Propaganda de Dispositivos Eletrônicos. Available online: https://www.in.gov.br/en/web/dou/-/resolucao-da-diretoria-colegiada-rdc-n-855-de-23-de-abril-de-2024-555721206 (accessed on 12 January 2025).
- Scholz, J.R.; Malta, D.C.; Fagundes Júnior, A.A.P.; Pavanello, R.; Bredt Júnior, G.L.; Rocha, M.S. Brazilian Society of Cardiology Position Statement on the Use of Electronic Nicotine Delivery Systems—2024. Arq. Bras. Cardiol. 2024, 121, e20240063. [Google Scholar] [CrossRef] [PubMed]
- Sreeramareddy, C.T.; Acharya, K.; Manoharan, A. Electronic cigarettes use and ‘dual use’ among the youth in 75 countries: Estimates from Global Youth Tobacco Surveys (2014–2019). Sci. Rep. 2022, 12, 20967. [Google Scholar] [CrossRef]
- Brasil. Ministério da Saúde. Portaria Nº 2.436, de 21 de Setembro de 2017. Aprova a Política Nacional de Atenção Básica, Estabelecendo a Revisão de Diretrizes Para a Organização da Atenção Básica, no Âmbito do Sistema Único de Saúde (SUS). Available online: https://bvsms.saude.gov.br/bvs/saudelegis/gm/2017/prt2436_22_09_2017.html (accessed on 20 January 2025).
- Prochaska, J.; Vogel, E.; Benowitz, N. Nicotine delivery and cigarette equivalents from vaping a JUULpod. Tob. Control 2021, 31, e88–e93. [Google Scholar] [CrossRef]
- O’Connor, R.J.; Giovino, G.A.; Kozlowski, L.T.; Shiffman, S.; Hyland, A.; Bernert, J.T.; Caraballo, R.S.; Cummings, K.M. Changes in nicotine intake and cigarette use over time in two nationally representative cross-sectional samples of smokers. Am. J. Epidemiol. 2006, 164, 750–759. [Google Scholar] [CrossRef]
- Yildiz, D. Nicotine, its metabolism and an overview of its biological effects. Toxicon 2024, 43, 619–632. [Google Scholar] [CrossRef]
- Schroeder, M.J.; Hoffman, A.C. Electronic cigarettes and nicotine clinical pharmacology. Tob. Control 2014, 23, ii30–ii35. [Google Scholar] [CrossRef] [PubMed]
- Göney, G.; Cok, I.; Tamer, U.; Burgaz, S.; Şengezer, T. Urinary cotinine levels of electronic cigarette (e-cigarette) users. Toxicol. Mech. Methods 2016, 26, 441–445. [Google Scholar] [CrossRef]
- Etter, J. A longitudinal study of cotinine in long-term daily users of e-cigarettes. Drug Alcohol Depend. 2016, 160, 218–221. [Google Scholar] [CrossRef]
- Marsot, A.; Simon, N. Nicotine and Cotinine Levels With Electronic Cigarette. Int. J. Toxicol. 2016, 35, 179–185. [Google Scholar] [CrossRef]
- Bowen, A.; Xing, C. Nicotine Salt Formulations for Aerosol Devices and Methods Thereof; Pax Labs, Inc.: San Francisco, CA, USA, 2015. Available online: https://patents.google.com/patent/US9215895B2/e (accessed on 15 January 2025).
- Jackler, R.; Ramamurthi, D. Nicotine arms race: JUUL and the high-nicotine product market. Tob. Control 2019, 28, 623–628. [Google Scholar] [CrossRef]
- Zhang, H.; Han, S.; Fan, L.; Liu, G.; Zhang, Y.; Chen, H.; Hou, H.; Hu, Q. The Difference of Addictive Behavior of Free-Base Nicotine and Nicotine Salts in Mice Base on an Aerosol Self-Administration Model. Nicotine Tob. Res. 2024, 26, 1626–1635. [Google Scholar] [CrossRef]
- Soar, K.; Kimber, C.; McRobbie, H.J.; Dawkins, L. Nicotine absorption from e-cigarettes over 12 months. Addict. Behav. 2019, 91, 102–105. [Google Scholar] [CrossRef]
- Wong, L.P.; Mohd Salim, S.N.; Alias, H.; Aghamohammadi, N.; Hoe, V.C.W.; Isahak, M.; Ali Mohd, M. The Association Between E-Cigarette Use Behaviors and Saliva Cotinine Concentration Among Healthy E-Cigarette Users in Malaysia. J. Addict. Nurs. 2020, 31, 102–109. [Google Scholar] [CrossRef] [PubMed]
- Dai, H.D.; Michaud, T.L.; Guenzel, N.; Morgan, M.; Cohen, S.M. Biomarker Assessment of Nicotine Exposure Among Adolescent E-Cigarette Users: 2018–2019. Pediatrics 2024, 153, e2023062424. [Google Scholar] [CrossRef] [PubMed]
- Peters, F.T.; Drummer, O.H.; Musshoff, F. Validation of new methods. Forensic Sci. Int. 2007, 165, 216–224. [Google Scholar] [CrossRef]
- LeBeau, M.A. ANSI/ASB standard 036 for method validation in forensic toxicology has replaced SWGTOX’s version. J. Anal. Toxicol. 2020, 44, 414. [Google Scholar] [CrossRef] [PubMed]
- Almeida, A.M.; Castel-Branco, M.M.; Falcão, A.C. Linear regression for calibration lines revisited: Weighting schemes for bioanalytical methods. J. Chromatogr. B. 2002, 774, 215–222. [Google Scholar] [CrossRef]


| Overall | Smoking History | p * | ||
|---|---|---|---|---|
| Never Smokers | Former Smokers | |||
| Gender, n (%) | N = 403 | N = 230 | N = 173 | 0.021 a |
| Male | 211 (52.4) | 109 (47.4) | 102 (59.0) | |
| Female | 192 (47.6) | 121 (52.6) | 71 (41.0) | |
| Age, years | N = 403 | N = 230 | N = 173 | <0.001 b |
| Mean ± SD | 28.0 ± 9.4 | 25.5 ± 7.8 | 31.3 ± 10.3 | |
| Age range, n (%) | N = 403 | N = 230 | N = 173 | <0.001 a |
| ≤25 years | 207 (51.4) | 147 (63.9) | 60 (34.7) | |
| 26–35 years | 111 (27.5) | 54 (23.5) | 57 (32.9) | |
| 36–45 years | 63 (15.6) | 22 (9.6) | 41 (23.7) | |
| ≥46 years | 22 (5.5) | 7 (3.0) | 15 (8.7) | |
| Race, n (%) | N = 399 | N = 228 | N = 171 | 0.094 c |
| White | 273 (68.4) | 157 (68.9) | 116 (67.8) | |
| Black | 30 (7.5) | 11 (4.8) | 19 (11.1) | |
| Asian | 7 (1.8) | 5 (2.2) | 2 (1.2) | |
| Multiracial | 89 (22.3) | 55 (24.1) | 34 (19.9) | |
| Years spent in education, n (%) | N = 399 | N = 229 | N = 170 | 0.180 a |
| ≤9 years | 14 (3.5) | 6 (2.6) | 8 (4.7) | |
| 10–15 years | 169 (42.4) | 105 (45.9) | 64 (37.6) | |
| ≥16 years | 215 (53.9) | 117 (51.1) | 98 (57.6) | |
| Monthly earning income, n (%) | N = 352 | N = 202 | N = 150 | 0.125 a |
| ≤BRL 1000.00 | 3 (0.9) | 2 (1.0) | 1 (0.7) | |
| BRL 1001.00–2500.00 | 54 (15.3) | 36 (17.8) | 18 (12.0) | |
| BRL 2501.00–5000.00 | 98 (27.8) | 62 (30.7) | 36 (24.0) | |
| BRL 5001.00–10,000.00 | 89 (25.3) | 50 (24.8) | 39 (26.0) | |
| ≥BRL 10,000.00 | 108 (30.7) | 52 (25.7) | 56 (37.3) | |
| Mean body mass index (BMI), kg/m2 | 21.81 ± 4.58 | 20.8 ± 4.21 | 22.15 ± 4.9 | |
| Presence of clinical conditions, n (%) | N = 400 | N = 228 | N = 172 | 0.895 c |
| Yes | 71 (17.8) | 42 (18.4) | 29 (16.9) | |
| Allergy | 17 (23.9) | 11 (26.2) | 6 (20.7) | 0.593 a |
| Asthma | 16 (22.5) | 6 (14.3) | 10 (34.5) | 0.045 a |
| Hypertension | 12 (16.9) | 5 (11.9) | 7 (24.1) | 0.209 c |
| Diabetes mellitus | 5 (7.0) | 2 (4.8) | 3 (10.3) | 0.393 c |
| Other | 26 (36.6) | 18 (42.9) | 8 (27.6) | 0.189 a |
| Presence of mental disorders, n (%) | N = 398 | N = 227 | N = 171 | 0.536 c |
| Yes | 125 (31.4) | 67 (29.5) | 58 (33.9) | |
| Anxiety | 94 (75.2) | 48 (71.6) | 46 (79.3) | 0.322 a |
| Depression | 39 (31.2) | 16 (23.9) | 23 (39.7) | 0.058 a |
| Bipolar disorder | 8 (6.4) | 5 (7.5) | 3 (5.2) | 0.724 a |
| Personality disorder | 4 (3.2) | 3 (4.5) | 1 (1.7) | 0.623 c |
| Schizophrenia | 1 (0.8) | 1 (1.5) | 0 (0.0) | 1.000 c |
| Other | 6 (4.8) | 5 (7.5) | 1 (1.7) | 0.215 c |
| Overall | Smoking History | p * | ||
|---|---|---|---|---|
| Never Smokers | Former Smokers | |||
| Introduction to e-cigarettes, n (%) | N = 399 | N = 227 | N = 172 | |
| By friends and/or family | 264 (66.2) | 156 (68.7) | 108 (62.8) | 0.215 a |
| Self-interest | 74 (18.5) | 32 (14.1) | 42 (24.4) | 0.009 a |
| Through advertising | 65 (16.3) | 40 (17.6) | 25 (14.5) | 0.408 a |
| Other | 14 (3.5) | 10 (4.4) | 4 (2.3) | 0.264 a |
| Reasons for use, n (%) | N = 402 | N = 230 | N = 172 | |
| Out of curiosity | 163 (40.5) | 125 (54.3) | 38 (22.1) | <0.001 a |
| Influence of friends and/or family | 116 (28.9) | 86 (37.4) | 30 (17.4) | <0.001 a |
| Tobacco smoking cessation | 71 (17.7) | 0 (0) | 71 (40.1) | <0.001 a |
| Alternative to traditional cigarettes | 59 (14.7) | 16 (7.0) | 43 (25.0) | <0.001 a |
| Advertising | 16 (4.0) | 8 (3.5) | 8 (4.7) | 0.552 a |
| Other | 65 (16.2) | 38 (16.5) | 27 (15.7) | 0.824 a |
| Product type, n (%) | N = 401 | N = 229 | N = 172 | |
| Disposable | 297 (74.1) | 175 (76.4) | 122 (70.9) | 0.215 a |
| Rechargeable | 100 (24.9) | 55 (24.0) | 45 (26.2) | 0.623 a |
| E-liquid vaporization | 42 (10.5) | 21 (9.2) | 21 (12.2) | 0.325 a |
| Heated tobacco | 3 (0.7) | 1 (0.4) | 2 (1.2) | 0.579 b |
| Consumption duration, n (%) | N = 396 | N = 226 | N = 170 | 0.013 a |
| ≤1 year | 154 (38.8) | 102 (44.7) | 52 (30.8) | |
| 2–3 years | 172 (43.3) | 92 (40.4) | 80 (47.3) | |
| ≥4 years | 71 (17.9) | 34 (14.9) | 37 (21.9) | |
| Last consumption, n (%) | N = 397 | N = 228 | N = 169 | 0.116 b |
| 30 min ago | 197 (49.6) | 99 (43.4) | 98 (58.0) | |
| 31–60 min ago | 51 (12.8) | 33 (14.5) | 18 (10.7) | |
| 61–90 min ago | 16 (4.0) | 7 (3.1) | 9 (5.3) | |
| 90–120 min ago | 9 (2.3) | 6 (2.6) | 3 (1.8) | |
| >2 h ago | 16 (4.0) | 12 (5.3) | 4 (2.4) | |
| ~12 h ago | 16 (4.0) | 10 (4.4) | 6 (3.6) | |
| ~24 h ago | 25 (6.3) | 18 (7.9) | 7 (4.1) | |
| ~48 h ago | 64 (16.1) | 40 (17.5) | 24 (14.2) | |
| Last week | 2 (0.5) | 2 (0.9) | 0 (0.0) | |
| Last month | 1 (0.3) | 1 (0.4) | 0 (0.0) | |
| Place of purchase, n (%) | N = 398 | N = 227 | N = 171 | |
| Internet | 102 (25.6) | 54 (23.8) | 48 (28.1) | 0.333 a |
| Tobacco shop | 278 (69.8) | 161 (70.9) | 117 (68.4) | 0.590 a |
| Abroad | 9 (2.3) | 2 (0.9) | 7 (4.1) | 0.042 b |
| Gift from friends and/or family | 36 (9.0) | 22 (9.7) | 14 (8.2) | 0.604 a |
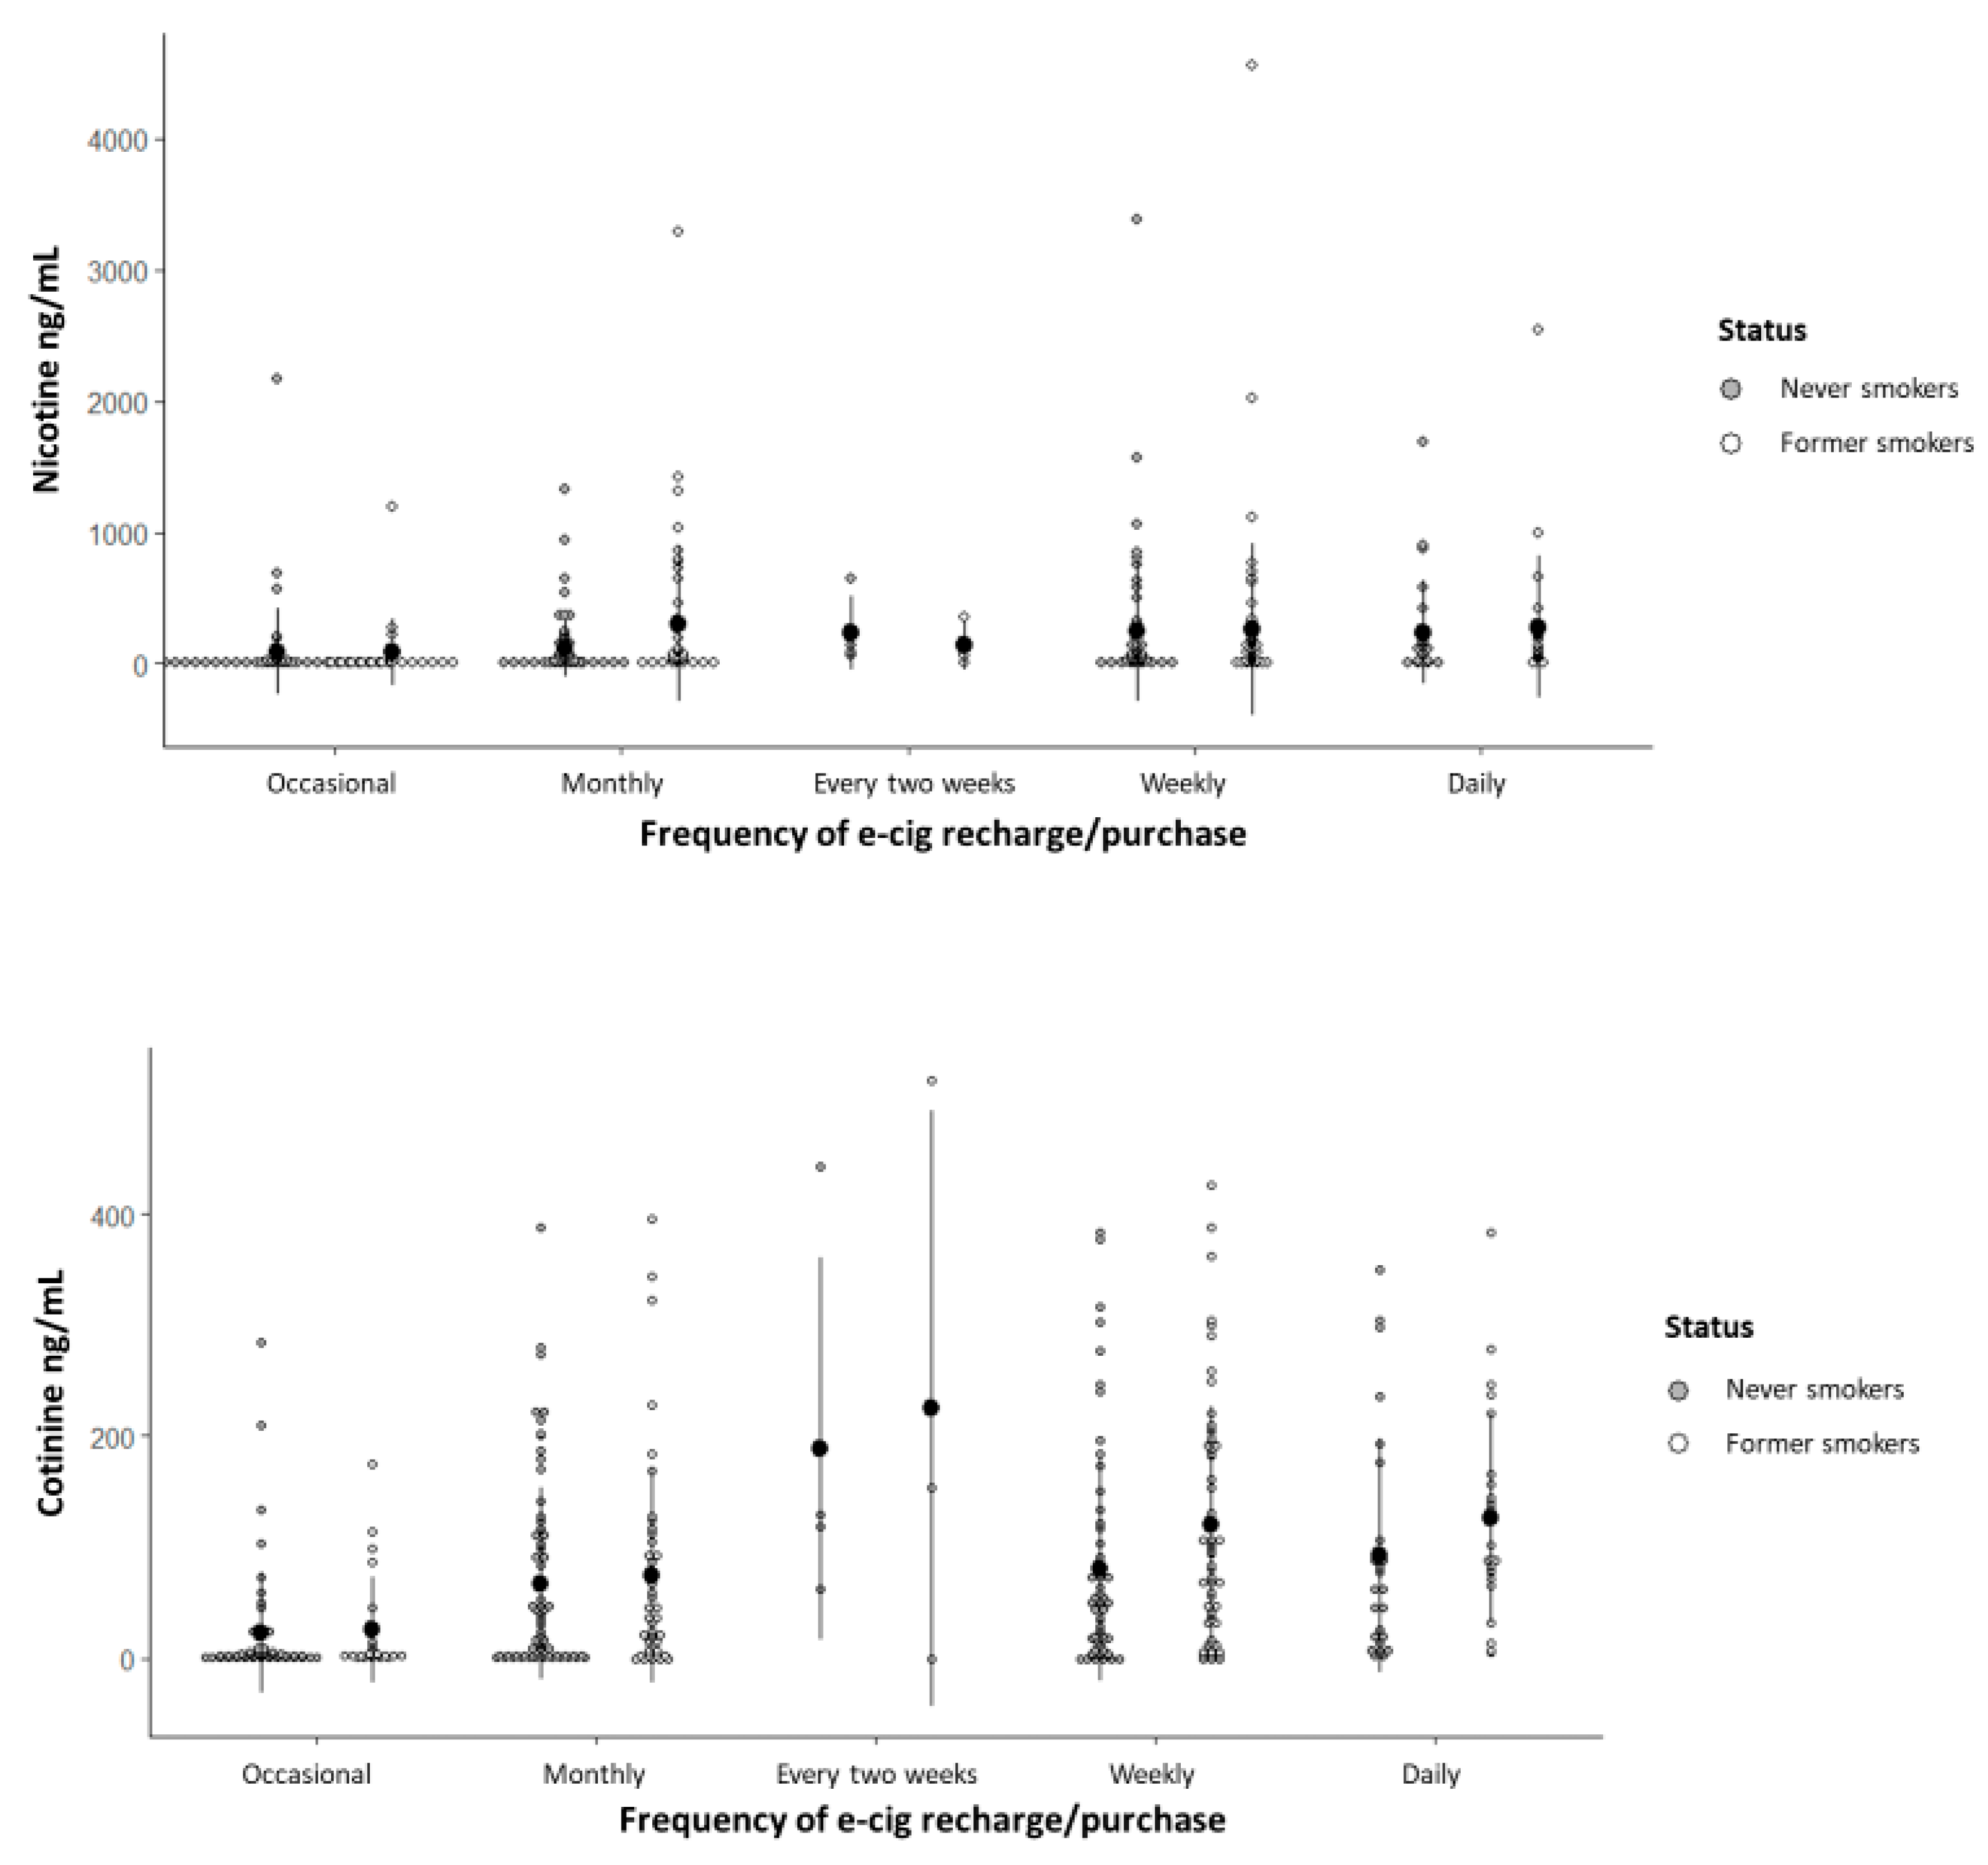
| Recharge/purchase frequency, n (%) | N = 396 | N = 226 | N = 170 | 0.029 a |
| Daily | 54 (13.6) | 29 (12.8) | 25 (14.7) | |
| Weekly | 128 (32.3) | 60 (26.5) | 68 (40.0) | |
| Every two weeks | 9 (2.3) | 5 (2.2) | 4 (2.4) | |
| Monthly | 127 (32.1) | 79 (35.0) | 48 (28.2) | |
| Occasional | 78 (19.7) | 53 (23.5) | 25 (14.7) | |
| Monthly expenses, n (%) | N = 395 | N = 225 | N = 170 | <0.001 b |
| ≤BRL 50.00 | 57 (14.4) | 36 (16.0) | 21 (12.4) | |
| BRL 51.00–100.00 | 109 (27.6) | 77 (34.2) | 32 (18.8) | |
| BRL 101.00–300.00 | 162 (41.0) | 88 (39.1) | 74 (43.5) | |
| BRL 301.00–500.00 | 47 (11.9) | 14 (6.2) | 33 (19.4) | |
| BRL 501.00–1000.00 | 16 (4.1) | 8 (3.6) | 8 (4.7) | |
| ≥BRL 1000.00 | 2 (0.5) | 0 (0.0) | 2 (1.2) | |
| None (provided by friends and/or family) | 2 (0.5) | 2 (0.9) | 0 (0.0) | |
| Knowledge of nicotine content, n (%) | N = 400 | N = 228 | N = 172 | 0.091 a |
| No knowledge | 215 (53.8) | 130 (57.0) | 85 (49.4) | |
| Aware of nicotine content | 153 (38.3) | 77 (33.8) | 76 (44.2) | |
| Unaware of nicotine content | 32 (8.0) | 21 (9.2) | 11 (6.4) | |
| Nicotine form, n (%) | N = 400 | N = 228 | N = 172 | |
| Nicotine salt | 110 (27.5) | 58 (25.4) | 52 (30.2) | 0.288 a |
| Nicotine free-base products | 50 (12.5) | 22 (9.6) | 28 (16.3) | 0.047 a |
| No knowledge | 217 (54.3) | 132 (57.9) | 85 (49.4) | 0.092 a |
| No nicotine | 29 (7.3) | 20 (8.8) | 9 (5.2) | 0.177 a |
| Nicotine salt concentration, n (%) | N = 110 | N = 58 | N = 52 | 0.929 b |
| 3 mg/mL | 1 (0.9) | 1 (1.7) | 0 (0.0) | |
| 20 mg/mL | 18 (16.4) | 10 (17.2) | 8 (15.4) | |
| 35 mg/mL | 24 (21.8) | 11 (19.0) | 13 (25.0) | |
| 50 mg/mL | 58 (52.7) | 31 (53.4) | 27 (51.9) | |
| Unknown | 9 (8.2) | 5 (8.6) | 4 (7.7) | |
| Nicotine free-base concentration, n (%) | N = 50 | N = 22 | N = 28 | 0.193 b |
| 3 mg/mL | 30 (60.0) | 15 (68.2) | 15 (53.6) | |
| 6 mg/mL | 16 (32.0) | 5 (22.7) | 11 (39.3) | |
| 12 mg/mL | 1 (2.0) | 1 (4.5) | 0 (0.0) | |
| 18 mg/mL | 0 (0.0) | 0 (0.0) | 0 (0.0) | |
| >20 mg/mL | 1 (2.0) | 1 (4.5) | 0 (0.0) | |
| Unknown | 2 (4.0) | 0 (0.0) | 2 (7.1) | |
| Nicotine, ng/mL | N = 362 | N = 208 | N = 154 | 0.023 c |
| Mean ± SD | 194.90 ± 466.49 | 158.99 ± 373.86 | 243.39 ± 565.88 | |
| Median (IQR) | 38.50 (6.00–148.50) | 25.00 (5.00–137.75) | 62.00 (9.75–178.50) | |
| Cotinine, ng/mL | N = 362 | N = 208 | N = 154 | 0.001 c |
| Mean ± SD | 76.90 ± 98.70 | 64.52 ± 91.85 | 93.61 ± 105.27 | |
| Median (IQR) | 36.00 (3.00–111.00) | 20.00 (2.25–91.00) | 67.00 (8.00–140.25) | |
| Participants’ Perception of Nicotine Addiction | p * | |||||
|---|---|---|---|---|---|---|
| None | Mild | Moderate | Severe | Unsure | ||
| Gender, n (%) | N = 154 | N = 88 | N = 94 | N = 70 | N = 9 | 0.883 a |
| Male | 83 (53.9) | 45 (51.1) | 47 (50.0) | 36 (51.4) | 6 (66.7) | |
| Female | 71 (46.1) | 43 (48.9) | 47 (50.0) | 34 (48.6) | 3 (33.3) | |
| Age, years | N = 154 | N = 88 | N = 94 | N = 70 | N = 9 | 0.458 b |
| Mean ± SD | 27.01 ± 9.48 | 28.16 ± 8.75 | 28.15 ± 10.06 | 28.49 ± 9.03 | 29.44 ± 9.89 | |
| Median (IQR) | 24.00 (20.00–30.25) | 26.00 (21.00–34.75) | 24.00 (21.00–32.25) | 26.00 (21.00–34.25) | 25.00 (21.50–40.00) | |
| Age range, n (%) | N = 154 | N = 88 | N = 94 | N = 70 | N = 9 | 0.806 c |
| ≤25 years | 87 (56.5) | 41 (46.6) | 52 (55.3) | 34 (48.6) | 5 (55.6) | |
| 26–35 years | 39 (25.3) | 27 (30.7) | 21 (22.3) | 21 (30.0) | 1 (11.1) | |
| 36–45 years | 22 (14.3) | 16 (18.2) | 14 (14.9) | 11 (15.7) | 2 (22.2) | |
| ≥46 years | 6 (3.9) | 4 (4.5) | 7 (7.4) | 4 (5.7) | 1 (11.1) | |
| Body mass index, kg/m2 | N = 154 | N = 87 | N = 94 | N = 69 | N = 9 | 0.207 c |
| Mean ± SD | 21.78 ± 4.41 | 21.16 ± 4.09 | 22.13 ± 5.29 | 21.89 ± 4.60 | 24.36 ± 3.60 | |
| Median (IQR) | 20.96 (18.56–25.03) | 20.59 (18.13–23.88) | 21.16 (18.99–24.39) | 21.25 (18.37–24.92) | 24.17 (21.42–27.79) | |
| Smoking history, n (%) | N = 150 | N = 86 | N = 91 | N = 66 | N = 8 | <0.001 a |
| Never smokers | 107 (71.3) | 50 (58.1) | 37 (40.7) | 30 (45.5) | 4 (50.0) | |
| Former smokers | 43 (28.7) | 36 (41.9) | 54 (59.3) | 36 (54.5) | 4 (50.0) | |
| Consumption duration, n (%) | N = 151 | N = 87 | N = 93 | N = 70 | N = 8 | <0.001 a |
| ≤1 year | 82 (54.3) | 42 (48.3) | 22 (23.7) | 10 (14.3) | 2 (25.0) | |
| 2–3 years | 58 (38.4) | 36 (41.4) | 45 (48.4) | 34 (48.6) | 4 (50.0) | |
| ≥4 years | 11 (7.3) | 9 (10.3) | 26 (28.0) | 26 (37.1) | 2 (25.0) | |
| Recharge/purchase frequency, n (%) | N = 152 | N = 87 | N = 92 | N = 69 | N = 8 | <0.001 a |
| Daily | 11 (7.2) | 13 (14.9) | 17 (18.5) | 16 (23.2) | 1 (12.5) | |
| Frequent ** | 86 (56.6) | 59 (67.8) | 64 (69.6) | 49 (71.0) | 3 (37.5) | |
| Occasional | 55 (36.2) | 15 (17.2) | 11 (12.0) | 4 (5.8) | 4 (50.0) | |
| Last consumption, n (%) | N = 152 | N = 88 | N = 92 | N = 70 | N = 7 | <0.001 a |
| Recent (<24 h ago) | 105 (69.1) | 76 (86.4) | 85 (92.4) | 70 (100.0) | 5 (71.4) | |
| Not recent (>24 h ago) | 47 (30.9) | 12 (13.6) | 7 (7.6) | 0 (0.0) | 2 (28.6) | |
| Presence of anxiety or depression, n (%) | N = 146 | N = 88 | N = 94 | N = 68 | N = 9 | 0.252 a |
| No | 111 (76.0) | 66 (75.0) | 64 (68.1) | 44 (64.7) | 8 (88.9) | |
| Yes | 35 (24.0) | 22 (25.0) | 30 (31.9) | 24 (35.3) | 1 (11.1) | |
| Nicotine, ng/mL | N = 139 | N = 79 | N = 82 | N = 65 | N = 9 | <0.001 b |
| Mean ± SD | 127.68 ± 310.46 | 219.89 ± 493.33 | 201.55 ± 532.08 | 324.48 ± 589.12 | 26.67 ± 41.29 | |
| Median (IQR) | 10.00 (0.00–80.00) | 44.00 (9.00–142.00) | 69.50 (14.75–190.25) | 99.00 (38.00–362.00) | 0.00 (0.00–62.50) | |
| Cotinine, ng/mL | N = 139 | N = 79 | N = 82 | N = 65 | N = 9 | <0.001 b |
| Mean ± SD | 37.72 ± 74.43 | 81.28 ± 92.61 | 103.17 ± 102.23 | 127.15 ± 112.81 | 45.44 ± 96.75 | |
| Median (IQR) | 4.00 (0.00–35.00) | 46.00 (15.00–107.00) | 72.50 (19.75–155.75) | 96.00 (41.00–194.00) | 6.00 (2.00–45.00) | |
Disclaimer/Publisher’s Note: The statements, opinions and data contained in all publications are solely those of the individual author(s) and contributor(s) and not of MDPI and/or the editor(s). MDPI and/or the editor(s) disclaim responsibility for any injury to people or property resulting from any ideas, methods, instructions or products referred to in the content. |
© 2025 by the authors. Licensee MDPI, Basel, Switzerland. This article is an open access article distributed under the terms and conditions of the Creative Commons Attribution (CC BY) license (https://creativecommons.org/licenses/by/4.0/).
Share and Cite
Scholz, J.R.; D’Amico, E.C.; Takitane, J.; Sinagawa, D.M.; Castaldelli-Maia, J.M.; dos Santos, M.F.; de Oliveira, R.A.; Marques, G.V.; Lima, E.N.; Rodriguez, D.F.L.; et al. Nicotine Dependence in a Banned Market: Biomarker Evidence from E-Cigarette Users in São Paulo, Brazil. Int. J. Environ. Res. Public Health 2025, 22, 960. https://doi.org/10.3390/ijerph22060960
Scholz JR, D’Amico EC, Takitane J, Sinagawa DM, Castaldelli-Maia JM, dos Santos MF, de Oliveira RA, Marques GV, Lima EN, Rodriguez DFL, et al. Nicotine Dependence in a Banned Market: Biomarker Evidence from E-Cigarette Users in São Paulo, Brazil. International Journal of Environmental Research and Public Health. 2025; 22(6):960. https://doi.org/10.3390/ijerph22060960
Chicago/Turabian StyleScholz, Jaqueline Ribeiro, Elaine Cristine D’Amico, Juliana Takitane, Daniele Mayumi Sinagawa, João Mauricio Castaldelli-Maia, Marcelo Filonzi dos Santos, Rodrigo Alves de Oliveira, Guilherme Vinicius Marques, Eric Nagamine Lima, Diana Fernanda Lasso Rodriguez, and et al. 2025. "Nicotine Dependence in a Banned Market: Biomarker Evidence from E-Cigarette Users in São Paulo, Brazil" International Journal of Environmental Research and Public Health 22, no. 6: 960. https://doi.org/10.3390/ijerph22060960
APA StyleScholz, J. R., D’Amico, E. C., Takitane, J., Sinagawa, D. M., Castaldelli-Maia, J. M., dos Santos, M. F., de Oliveira, R. A., Marques, G. V., Lima, E. N., Rodriguez, D. F. L., Ziotti, S., Leyton, V., & Megid, M. C. (2025). Nicotine Dependence in a Banned Market: Biomarker Evidence from E-Cigarette Users in São Paulo, Brazil. International Journal of Environmental Research and Public Health, 22(6), 960. https://doi.org/10.3390/ijerph22060960