

COVID-19 in Rural Ontario Communities: Exploring Women’s Mental Health During a Pandemic


Abstract
1. Introduction
1.1. Rural Ontario and COVID-19
1.2. Gender and Rural Environments
1.3. International Rural Geographies and COVID-19
1.4. Gender and COVID-19
1.5. Mental Health and COVID-19
2. Materials and Methods
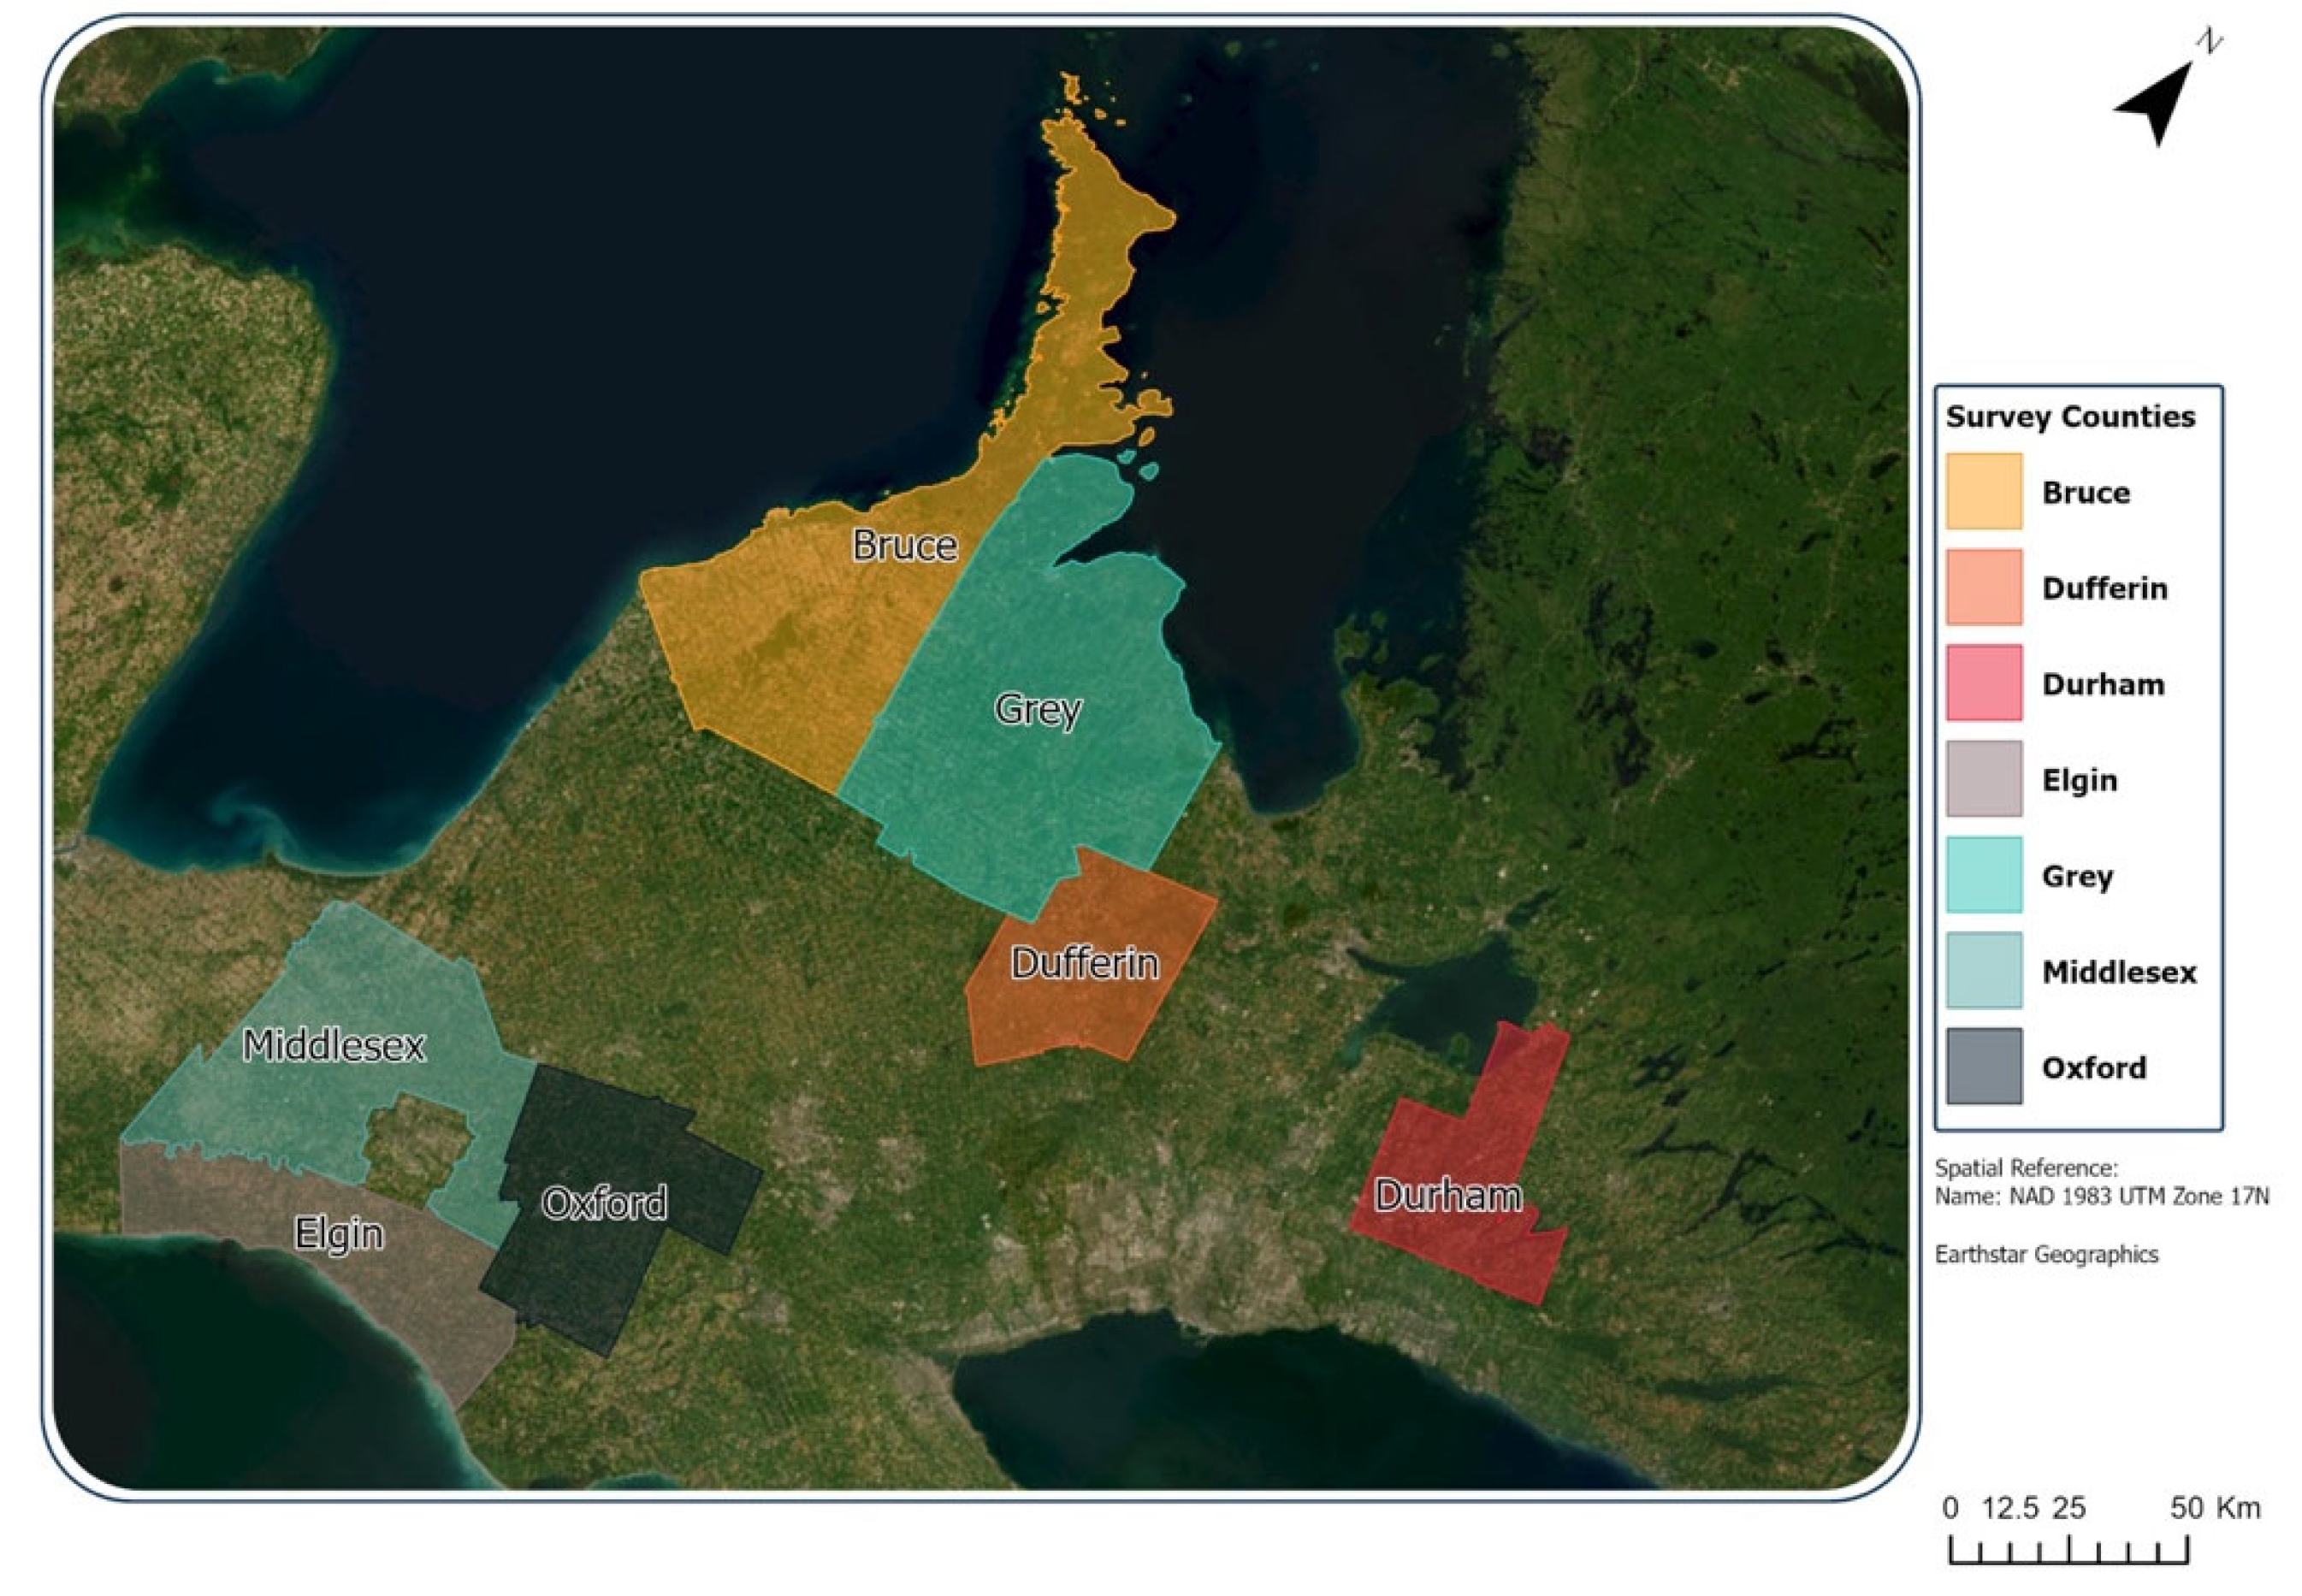
2.1. Study Area and Sample
2.2. Data Sources
2.2.1. Survey Data
2.2.2. Census Data
2.2.3. COVID-19 Data
2.3. Statistical Methods
2.3.1. Data Cleaning and Summary Statistics
2.3.2. Data Visualization
2.3.3. Statistical Models
2.3.4. Spatial Approaches
3. Results
3.1. Study Population
3.2. Survey Responses
3.3. Key Findings
4. Discussion
Limitations
5. Conclusions
Author Contributions
Funding
Institutional Review Board Statement
Informed Consent Statement
Data Availability Statement
Acknowledgments
Conflicts of Interest
References
- Dozois, D.J.A. Mental Health Research Canada Anxiety and depression in Canada during the COVID-19 pandemic: A national survey. Can. Psychol. Psychol. Can. 2021, 62, 136–142. [Google Scholar] [CrossRef]
- Daly, Z.; Slemon, A.; Richardson, C.G.; Salway, T.; McAuliffe, C.; Gadermann, A.M.; Thomson, K.C.; Hirani, S.; Jenkins, E.K. Associations between periods of COVID-19 quarantine and mental health in Canada. Psychiatry Res. 2021, 295, 113631. [Google Scholar] [CrossRef] [PubMed]
- Cannon, C.E.; Ferreira, R.; Buttell, F.; Anderson, C. Sociodemographic Predictors of Depression in US Rural Communities During COVID-19: Implications for Improving Mental Healthcare Access to Increase Disaster Preparedness. Disaster Med. Public Health Prep. 2023, 17, e208. [Google Scholar] [CrossRef]
- Xia, Y.; Ma, H.; Moloney, G.; Velásquez García, H.A.; Sirski, M.; Janjua, N.Z.; Vickers, D.; Williamson, T.; Katz, A.; Yiu, K.; et al. Geographic concentration of SARS-CoV-2 cases by social determinants of health in metropolitan areas in Canada: A cross-sectional study. Can. Med. Assoc. J. 2022, 194, E195–E204. [Google Scholar] [CrossRef]
- Deacon, L.; Sarapura, S.; Caldwell, W.; Epp, S.; Ivany, M.; Papineau, J. COVID-19, mental health, and rurality: A pilot study. Can. Geogr. Géographe Can. 2023, 67, 460–469. [Google Scholar] [CrossRef]
- Chen, I.; Bougie, O. Women’s Issues in Pandemic Times: How COVID-19 Has Exacerbated Gender Inequities for Women in Canada and around the World. J. Obstet. Gynaecol. Can. 2020, 42, 1458–1459. [Google Scholar] [CrossRef]
- Caldarulo, M.; Olsen, J.; Frandell, A.; Islam, S.; Johnson, T.P.; Feeney, M.K.; Michalegko, L.; Welch, E.W. COVID-19 and gender inequity in science: Consistent harm over time. PLoS ONE 2022, 17, e0271089. [Google Scholar] [CrossRef]
- Laster Pirtle, W.N.; Wright, T. Structural Gendered Racism Revealed in Pandemic Times: Intersectional Approaches to Understanding Race and Gender Health Inequities in COVID-19. Gend. Soc. 2021, 35, 168–179. [Google Scholar] [CrossRef]
- Mental Health Commission of Canada. The Impact of COVID-19 on Rural and Remote Mental Health and Substance Use; Health Canada: Ottowa, ON, Canada, 2021; Available online: https://mentalhealthcommission.ca/wp-content/uploads/2021/10/The-Impact-of-COVID-19-on-Rural-and-Remote-Mental-Health-and-Substance-Use.pdf.pdf (accessed on 15 June 2024).
- The Chief Public Health Officer of Canada. From Risk to Resilience: An Equity Approach to COVID-19; Public Health Agency of Canada: Ottawa, ON, Canada, 2020; Available online: https://www.canada.ca/content/dam/phac-aspc/documents/corporate/publications/chief-public-health-officer-reports-state-public-health-canada/from-risk-resilience-equity-approach-covid-19/cpho-covid-report-eng.pdf (accessed on 7 April 2025).
- Moin, J.S.; Vigod, S.N.; Plumptre, L.; Troke, N.; Papanicolas, I.; Wodchis, W.P.; Anderson, G. Utilization of physician mental health services by birthing parents with young children during the COVID-19 pandemic: A population-based, repeated cross-sectional study. CMAJ Open 2023, 11, E1093–E1101. [Google Scholar] [CrossRef]
- Moin, J.S.; Vigod, S.N.; Plumptre, L.; Troke, N.; Asaria, M.; Papanicolas, I.; Wodchis, W.P.; Brail, S.; Anderson, G. Sex differences among children, adolescents and young adults for mental health service use within inpatient and outpatient settings, before and during the COVID-19 pandemic: A population-based study in Ontario, Canada. BMJ Open 2023, 13, e073616. [Google Scholar] [CrossRef]
- Moyser, M. Gender Differences in Mental Health During the COVID-19 Pandemic; Statistics Canada: Ottawa, ON, Canada, 2020; Available online: https://www150.statcan.gc.ca/n1/en/pub/45-28-0001/2020001/article/00047-eng.pdf?st=fZ4s0vGO (accessed on 6 May 2024).
- Toulany, A.; Kurdyak, P.; Stukel, T.A.; Strauss, R.; Fu, L.; Guan, J.; Fiksenbaum, L.; Cohen, E.; Guttmann, A.; Vigod, S.; et al. Sociodemographic Differences in Physician-Based Mental Health and Virtual Care Utilization and Uptake of Virtual Care Among Children and Adolescents During the COVID-19 Pandemic in Ontario, Canada: A Population-Based Study. Can. J. Psychiatry 2023, 68, 904–915. [Google Scholar] [CrossRef] [PubMed]
- Houston, C.; Birnbaum, R.; Bala, N.; Deveau, K. Ontario family justice in “lockdown”: Early pandemic cases and professional experience. Fam. Court. Rev. 2022, 60, 241–258. [Google Scholar] [CrossRef] [PubMed]
- Mohanty, J.; Chokkanathan, S.; Alberton, A.M. COVID-19–related stressors, family functioning and mental health in Canada: Test of indirect effects. Fam. Relat. 2022, 71, 445–462. [Google Scholar] [CrossRef]
- Brophy, J.T.; Keith, M.M.; Hurley, M.; McArthur, J.E. Sacrificed: Ontario Healthcare Workers in the Time of COVID-19. New Solut. J. Environ. Occup. Health Policy 2021, 30, 267–281. [Google Scholar] [CrossRef]
- Mandal, A.; Purkey, E. Psychological Impacts of the COVID-19 Pandemic on Rural Physicians in Ontario: A Qualitative Study. Healthcare 2022, 10, 455. [Google Scholar] [CrossRef]
- Nadon, L.; De Beer, L.T.; Morin, A.J.S. Should Burnout Be Conceptualized as a Mental Disorder? Behav. Sci. 2022, 12, 82. [Google Scholar] [CrossRef]
- Myran, D.T.; Cantor, N.; Pugliese, M.; Hayes, T.; Talarico, R.; Kurdyak, P.; Qureshi, D.; Tanuseputro, P. Sociodemographic changes in emergency department visits due to alcohol during COVID-19. Drug Alcohol. Depend. 2021, 226, 108877. [Google Scholar] [CrossRef]
- Li, B.; Sood, S.; Johnston, C. Impact of COVID-19 on Small Businesses in Canada, Fourth Quarter of 2021; Statistics Canada: Ottawa, ON, Canada, 2022; Available online: https://www150.statcan.gc.ca/n1/en/pub/45-28-0001/2021001/article/00043-eng.pdf?st=Sffscto1 (accessed on 15 June 2024).
- Karatayev, V.A.; Anand, M.; Bauch, C.T. Local lockdowns outperform global lockdown on the far side of the COVID-19 epidemic curve. Proc. Natl. Acad. Sci. USA 2020, 117, 24575–24580. [Google Scholar] [CrossRef]
- Amini, M.M. An Examination of Gender Differences in Social and Democratic Values in CANADA; Statistics Canada: Ottawa, ON, Canada, 2023; Available online: https://www150.statcan.gc.ca/n1/pub/75-006-x/2023001/article/00005-eng.htm (accessed on 28 March 2025).
- Van Laar, C.; Van Rossum, A.; Kosakowska-Berezecka, N.; Bongiorno, R.; Block, K. MANdatory—Why men need (and are needed for) gender equality progress. Front. Psychol. 2024, 15, 1263313. [Google Scholar] [CrossRef]
- Yu, S. Uncovering the hidden impacts of inequality on mental health: A global study. Transl. Psychiatry 2018, 8, 98. [Google Scholar] [CrossRef]
- Panazzola, P.; Leipert, B. Exploring mental health issues of rural senior women residing in southwestern Ontario, Canada: A secondary analysis photovoice study. Rural. Remote Health 2013, 13, 2320. [Google Scholar] [CrossRef] [PubMed]
- Michalski, C.A.; Diemert, L.M.; Helliwell, J.F.; Goel, V.; Rosella, L.C. Relationship between sense of community belonging and self-rated health across life stages. SSM Popul. Health 2020, 12, 100676. [Google Scholar] [CrossRef] [PubMed]
- Cuadros, D.F.; Branscum, A.J.; Mukandavire, Z.; Miller, F.D.; MacKinnon, N. Dynamics of the COVID-19 epidemic in urban and rural areas in the United States. Ann. Epidemiol. 2021, 59, 16–20. [Google Scholar] [CrossRef] [PubMed]
- Glenister, K.M.; Ervin, K.; Podubinski, T. Detrimental Health Behaviour Changes among Females Living in Rural Areas during the COVID-19 Pandemic. Int. J. Environ. Res. Public. Health 2021, 18, 722. [Google Scholar] [CrossRef]
- Kerbage, A.; Matta, M.; Haddad, S.; Daniel, P.; Tawk, L.; Gemayel, S.; Amine, A.; Warrak, R.; Germanos, M.; Haddad, F.; et al. Challenges facing COVID-19 in rural areas: An experience from Lebanon. Int. J. Disaster Risk Reduct. 2021, 53, 102013. [Google Scholar] [CrossRef]
- O’Reilly, A.; Meredith, D.; Foley, R.; McCarthy, J. Continuity, change and new ways of being: An exploratory assessment of farmer’s experiences and responses to public health restrictions during the COVID-19 pandemic in a rural Irish community. Sociol. Rural. 2023, 63, 95–115. [Google Scholar] [CrossRef]
- Lakshmi, N.; Anjana, R.M.; Siddiqui, M.; Sonie, S.; Pearson, E.R.; Doney, A.; Palmer, C.N.A.; Mohan, V.; Pradeepa, R. A Study on the Health and Socioeconomic Impact of COVID-19 Pandemic and Barriers to Self-management of Diabetes during the Lockdown among Rural Residents of South India. J. Diabetol. 2022, 13, 255–261. [Google Scholar] [CrossRef]
- Michaelsen, S.; Nombro, E.; Djiofack, H.; Ferlatte, O.; Vissandjee, B.; Zarowsky, C. Looking at COVID-19 effects on intimate partner and sexual violence organizations in Canada through a feminist political economy lens: A qualitative study. Can. J. Public Health 2022, 113, 867–877. [Google Scholar] [CrossRef]
- Frize, M.; Lhotska, L.; Marcu, L.G.; Stoeva, M.; Barabino, G.; Ibrahim, F.; Lim, S.; Kaldoudi, E.; Marques Da Silva, A.M.; Tan, P.H.; et al. The impact of COVID-19 pandemic on gender-related work from home in STEM fields—Report of the WiMPBME Task Group. Gend. Work Organ. 2021, 28, 378–396. [Google Scholar] [CrossRef]
- Shamseer, L.; Bourgeault, I.; Grunfeld, E.; Moore, A.; Peer, N.; Straus, S.E.; Tricco, A.C. Will COVID-19 result in a giant step backwards for women in academic science? J. Clin. Epidemiol. 2021, 134, 160–166. [Google Scholar] [CrossRef]
- Smith, J. From “nobody’s clapping for us” to “bad moms”: COVID-19 and the circle of childcare in Canada. Gend. Work Organ. 2022, 29, 353–367. [Google Scholar] [CrossRef] [PubMed]
- Bradley, N.L.; DiPasquale, A.M.; Dillabough, K.; Schneider, P.S. Health care practitioners’ responsibility to address intimate partner violence related to the COVID-19 pandemic. Can. Med. Assoc. J. 2020, 192, E609–E610. [Google Scholar] [CrossRef] [PubMed]
- Gadermann, A.C.; Thomson, K.C.; Richardson, C.G.; Gagné, M.; McAuliffe, C.; Hirani, S.; Jenkins, E. Examining the impacts of the COVID-19 pandemic on family mental health in Canada: Findings from a national cross-sectional study. BMJ Open 2021, 11, e042871. [Google Scholar] [CrossRef] [PubMed]
- Montesanti, S.; Ghidei, W.; Silverstone, P.; Wells, L.; Squires, S.; Bailey, A. Examining organization and provider challenges with the adoption of virtual domestic violence and sexual assault interventions in Alberta, Canada, during the COVID-19 pandemic. J. Health Serv. Res. Policy 2022, 27, 169–179. [Google Scholar] [CrossRef]
- Xue, J.; Chen, J.; Chen, C.; Hu, R.; Zhu, T. The Hidden Pandemic of Family Violence During COVID-19: Unsupervised Learning of Tweets. J. Med. Internet Res. 2020, 22, e24361. [Google Scholar] [CrossRef]
- Michaelsen, S.; Djiofack, H.; Nombro, E.; Ferlatte, O.; Vissandjée, B.; Zarowsky, C. Service provider perspectives on how COVID-19 and pandemic restrictions have affected intimate partner and sexual violence survivors in Canada: A qualitative study. BMC Womens Health 2022, 22, 111. [Google Scholar] [CrossRef]
- Shillington, K.J.; Vanderloo, L.M.; Burke, S.M.; Ng, V.; Tucker, P.; Irwin, J.D. Ontario adults’ health behaviors, mental health, and overall well-being during the COVID-19 pandemic. BMC Public Health 2021, 21, 1679. [Google Scholar] [CrossRef]
- Scharf, D.; Oinonen, K. Ontario’s response to COVID-19 shows that mental health providers must be integrated into provincial public health insurance systems. Can. J. Public Health 2020, 111, 473–476. [Google Scholar] [CrossRef]
- Shiraz, M.; Capaldi, C.A.; Ooi, L.L.; Roberts, K.C. Health care barriers and perceived mental health among adults in Canada during the COVID-19 pandemic: A population-based cross-sectional study. Health Promot. Chronic Dis. Prev. Can. 2024, 44, 21–33. [Google Scholar] [CrossRef]
- McKnight, P.E.; Kashdan, T.B. The importance of functional impairment to mental health outcomes: A case for reassessing our goals in depression treatment research. Clin. Psychol. Rev. 2009, 29, 243–259. [Google Scholar] [CrossRef]
- Ahmad, F.; Jhajj, A.K.; Stewart, D.E.; Burghardt, M.; Bierman, A.S. Single item measures of self-rated mental health: A scoping review. BMC Health Serv. Res. 2014, 14, 398. [Google Scholar] [CrossRef] [PubMed]
- Rutter, L.A.; Howard, J.; Lakhan, P.; Valdez, D.; Bollen, J.; Lorenzo-Luaces, L. “I Haven’t Been Diagnosed, but I Should Be”-Insight into Self-diagnoses of Common Mental Health Disorders: Cross-Sectional Study. JMIR Form. Res. 2023, 7, e39206. [Google Scholar] [CrossRef] [PubMed]
- Vaingankar, J.A.; Chong, S.A.; Abdin, E.; Siva Kumar, F.D.; Chua, B.Y.; Sambasivam, R.; Shafie, S.; Jeyagurunathan, A.; Seow, E.; Subramaniam, M. Understanding the relationships between mental disorders, self-reported health outcomes and positive mental health: Findings from a national survey. Health Qual. Life Outcomes 2020, 18, 55. [Google Scholar] [CrossRef]
- Mendlovic, S.; Roe, D.; Markusfeld, G.; Mainz, J.; Kristensen, S.; Goldzweig, G. Exploring the relation between clinician ratings and patient-reported experience and outcomes. Int. J. Qual. Health Care 2022, 34, ii98–ii104. [Google Scholar] [CrossRef]
- Bonsel, J.M.; Itiola, A.J.; Huberts, A.S.; Bonsel, G.J.; Penton, H. The use of patient-reported outcome measures to improve patient-related outcomes—A systematic review. Health Qual. Life Outcomes 2024, 22, 101. [Google Scholar] [CrossRef]
- Xiong, J.; Lipsitz, O.; Nasri, F.; Lui, L.M.W.; Gill, H.; Phan, L.; Chen-Li, D.; Iacobucci, M.; Ho, R.; Majeed, A.; et al. Impact of COVID-19 pandemic on mental health in the general population: A systematic review. J. Affect. Disord. 2020, 277, 55–64. [Google Scholar] [CrossRef]
- Saunders, N.R.; Toulany, A.; Deb, B.; Strauss, R.; Vigod, S.N.; Guttmann, A.; Chiu, M.; Huang, A.; Fung, K.; Chen, S.; et al. Acute mental health service use following onset of the COVID-19 pandemic in Ontario, Canada: A trend analysis. CMAJ Open 2021, 9, E988–E997. [Google Scholar] [CrossRef]
- Myran, D.T.; Cantor, N.; Rhodes, E.; Pugliese, M.; Hensel, J.; Taljaard, M.; Talarico, R.; Garg, A.X.; McArthur, E.; Liu, C.-W.; et al. Physician Health Care Visits for Mental Health and Substance Use During the COVID-19 Pandemic in Ontario, Canada. JAMA Netw. Open 2022, 5, e2143160. [Google Scholar] [CrossRef]
- Webber, C.; Dover, K.; Tanuseputro, P.; Vigod, S.N.; Moineddin, R.; Clarke, A.; Isenberg, S.; Fiedorowicz, J.G.; Jin, Y.; Gandhi, J.; et al. Mental health service use among mothers and other birthing parents during the COVID-19 pandemic in Ontario, Canada. J. Affect. Disord. 2024, 367, 913–922. [Google Scholar] [CrossRef]
- Statistics Canada. Canadian Census Data; University of Toronto CHASS Data Center: Toronto, ON, Canada, 2016. [Google Scholar]
- Chastko, K.; Charbonneau, P.; Martel, L. Population Growth in Canada’s Rural Areas, 2016 to 2021; Statistics Canada: Ottawa, ON, Canada. Available online: https://www12.statcan.gc.ca/census-recensement/2021/as-sa/98-200-x/2021002/98-200-x2021002-eng.cfm (accessed on 15 June 2024).
- NatCen Social Research; Department of Epidemiology and Public Health University College London; National Health Service (NHS) Health Surveyfor England 2018. 2018. Available online: https://doc.ukdataservice.ac.uk/doc/8649/mrdoc/pdf/8649_hse_2018_user_guide.pdf (accessed on 8 May 2024).
- Statistics Canada. Self-Rated Mental Health. Available online: https://www160.statcan.gc.ca/health-sante/mental-health-sante-mentale-eng.htm (accessed on 27 April 2025).
- Ontario Ministry of Health. Management of Cases and Contacts of COVID-19 in Ontario; Ontario Ministry of Health: Toronto, ON, Canada, 2022. [Google Scholar]
- Posit Team. RStudio: Integrated Development Environment for R. Posit Software, PBC. Available online: http://www.posit.co/ (accessed on 15 June 2024).
- Statistics Canada. 2021 Census—Boundary Files; Statistics Canada: Ottawa, ON, Canada, 2022; Available online: https://www12.statcan.gc.ca/census-recensement/2021/geo/sip-pis/boundary-limites/index2021-eng.cfm?year=21 (accessed on 15 June 2024).
- Statistics Canada. Dictionary, Census of Population, 2021: Map Projection; Statistics Canada: Ottawa, ON, Canada, 2023; Available online: https://www12.statcan.gc.ca/census-recensement/2021/ref/dict/az/Definition-eng.cfm?ID=geo031 (accessed on 15 June 2024).
- Josse, J.; Husson, F. missMDA: A Package for Handling Missing Values in Multivariate Data Analysis. J. Stat. Softw. 2016, 70, 1–31. [Google Scholar] [CrossRef]
- Becker, R. Gender and Survey Participation an Event History Analysis of the Gender Effects of Survey Participation in a Probability-based Multi-wave Panel Study with a Sequential Mixed-mode Design. Methods Data Anal. 2022, 16, 3–32. [Google Scholar] [CrossRef]
- Wu, M.-J.; Zhao, K.; Fils-Aime, F. Response rates of online surveys in published research: A meta-analysis. Comput. Hum. Behav. Rep. 2022, 7, 100206. [Google Scholar] [CrossRef]
- Saleh, A.; Bista, K. Examining Factors Impacting Online Survey Response Rates in Educational Research: Perceptions of Graduate Students. J. Multidiscip. Eval. 2017, 13, 63–74. [Google Scholar] [CrossRef]
- Lallukka, T.; Pietiläinen, O.; Jäppinen, S.; Laaksonen, M.; Lahti, J.; Rahkonen, O. Factors associated with health survey response among young employees: A register-based study using online, mailed and telephone interview data collection methods. BMC Public Health 2020, 20, 184. [Google Scholar] [CrossRef]
- Shiyab, W.; Ferguson, C.; Rolls, K.; Halcomb, E. Solutions to address low response rates in online surveys. Eur. J. Cardiovasc. Nurs. 2023, 22, 441–444. [Google Scholar] [CrossRef]
- Austin, P.C. An Introduction to Propensity Score Methods for Reducing the Effects of Confounding in Observational Studies. Multivar. Behav. Res. 2011, 46, 399–424. [Google Scholar] [CrossRef]
- Spitzer, S. Biases in health expectancies due to educational differences in survey participation of older Europeans: It’s worth weighting for. Eur. J. Health Econ. 2020, 21, 573–605. [Google Scholar] [CrossRef]
- Vandecasteele, L.; Ivanova, K.; Sieben, I.; Reeskens, T. Changing attitudes about the impact of women’s employment on families: The COVID-19 pandemic effect. Gend. Work Organ. 2022, 29, 2012–2033. [Google Scholar] [CrossRef]
- Michaud, D.S.; Marro, L.; Denning, A.; Shackleton, S.; Toutant, N.; Cameron-Blake, E.; McNamee, J.P. Implications of the COVID-19 pandemic on self-reported health status and noise annoyance in rural and non-rural Canada. Sci. Rep. 2022, 12, 15945. [Google Scholar] [CrossRef]
- Wang, Y.; Kala, M.P.; Jafar, T.H. Factors associated with psychological distress during the coronavirus disease 2019 (COVID-19) pandemic on the predominantly general population: A systematic review and meta-analysis. PLoS ONE 2020, 15, e0244630. [Google Scholar] [CrossRef]
- Breslau, J.; Marshall, G.N.; Pincus, H.A.; Brown, R.A. Are mental disorders more common in urban than rural areas of the United States? J. Psychiatr. Res. 2014, 56, 50–55. [Google Scholar] [CrossRef] [PubMed]
- Cortina, J.; Hardin, S. The Geography of Mental Health, Urbanicity, and Affluence. Int. J. Environ. Res. Public. Health 2023, 20, 5440. [Google Scholar] [CrossRef] [PubMed]
- Ryan, S.C.; Sugg, M.M.; Runkle, J.D.; Matthews, J.L. Spatial Analysis of Greenspace and Mental Health in North Carolina: Consideration of Rural and Urban Communities. Fam. Community Health 2023, 46, 181–191. [Google Scholar] [CrossRef] [PubMed]
- Gruebner, O.; Khan, M.M.H.; Lautenbach, S.; Müller, D.; Kraemer, A.; Lakes, T.; Hostert, P. A spatial epidemiological analysis of self-rated mental health in the slums of Dhaka. Int. J. Health Geogr. 2011, 10, 36. [Google Scholar] [CrossRef]
- Hoffman, R.M.; Ryus, C.; Tiyyagura, G.; Jubanyik, K. Intimate partner violence screening during COVID-19. PLoS ONE 2023, 18, e0284194. [Google Scholar] [CrossRef]
- Bacchus, L.J.; Bullock, L.; Sharps, P.; Burnett, C.; Schminkey, D.; Buller, A.M.; Campbell, J. ‘Opening the door’: A qualitative interpretive study of women’s experiences of being asked about intimate partner violence and receiving an intervention during perinatal home visits in rural and urban settings in the USA. J. Res. Nurs. 2016, 21, 345–364. [Google Scholar] [CrossRef]
- Gupta, J.; Falb, K.L.; Lehmann, H.; Kpebo, D.; Xuan, Z.; Hossain, M.; Zimmerman, C.; Watts, C.; Annan, J. Gender norms and economic empowerment intervention to reduce intimate partner violence against women in rural Côte d’Ivoire: A randomized controlled pilot study. BMC Int. Health Hum. Rights 2013, 13, 46. [Google Scholar] [CrossRef]
- Barros, C.; Sacau-Fontenla, A. New Insights on the Mediating Role of Emotional Intelligence and Social Support on University Students’ Mental Health during COVID-19 Pandemic: Gender Matters. Int. J. Environ. Res. Public Health 2021, 18, 12935. [Google Scholar] [CrossRef]
- Shangguan, C.; Zhang, L.; Wang, Y.; Wang, W.; Shan, M.; Liu, F. Expressive Flexibility and Mental Health: The Mediating Role of Social Support and Gender Differences. Int. J. Environ. Res. Public Health 2022, 19, 456. [Google Scholar] [CrossRef]
- Tuite, A.; Thampi, N. Impacts of the COVID-19 Pandemic on Women in Canada: 1.1 The Impact of COVID-19 on Women’s Health; Royal Society of Canada: Ottawa, ON, Canada, 2022. [Google Scholar]
- Standing Committee on the Status of Women: Evidence 007. Available online: https://www.ourcommons.ca/Content/Committee/432/FEWO/Evidence/EV11009206/FEWOEV07-E.PDF (accessed on 15 June 2024).
- Gladu, M. Challenges Faced by Women Living in Rural, Remote, and Northern Communities in Canada; House of Commons: Ottawa, ON, Canada, 2021; Available online: https://www.ourcommons.ca/Content/Committee/432/FEWO/Reports/RP11410631/feworp09/feworp09-e.pdf (accessed on 25 March 2025).
- Boyd, A.; Van De Velde, S.; Vilagut, G.; De Graaf, R.; O׳Neill, S.; Florescu, S.; Alonso, J.; Kovess-Masfety, V. Gender differences in mental disorders and suicidality in Europe: Results from a large cross-sectional population-based study. J. Affect. Disord. 2015, 173, 245–254. [Google Scholar] [CrossRef]
- Chaplin, T.M.; Hong, K.; Bergquist, K.; Sinha, R. Gender Differences in Response to Emotional Stress: An Assessment Across Subjective, Behavioral, and Physiological Domains and Relations to Alcohol Craving. Alcohol. Clin. Exp. Res. 2008, 32, 1242–1250. [Google Scholar] [CrossRef] [PubMed]
- Chan, K.; Xue, H.; Carlson, J.; Gray, J.M.; Bailey, J.; Vines, R. Impact of COVID-19 on lifestyle and mental wellbeing in a drought-affected rural Australian population. Rural. Remote Health 2022, 22, 7231. [Google Scholar] [CrossRef] [PubMed]
- Neill, E.; Meyer, D.; Toh, W.L.; Rheenen, T.E.; Phillipou, A.; Tan, E.J.; Rossell, S.L. Alcohol use in Australia during the early days of the COVID-19 pandemic: Initial results from the COLLATE project. Psychiatry Clin. Neurosci. 2020, 74, 542–549. [Google Scholar] [CrossRef] [PubMed]
- Emery, R.L.; Johnson, S.T.; Simone, M.; Loth, K.A.; Berge, J.M.; Neumark-Sztainer, D. Understanding the impact of the COVID-19 pandemic on stress, mood, and substance use among young adults in the greater Minneapolis-St. Paul area: Findings from project EAT. Soc. Sci. Med. 2021, 276, 113826. [Google Scholar] [CrossRef]
- Statistics Canada. Alcohol and Cannabis Use During the Pandemic: Canadian Perspectives Survey Series 6; Government of Canada: Statistics Canada: Ottawa, ON, Canada, 2021; Available online: https://www150.statcan.gc.ca/n1/en/daily-quotidien/210304/dq210304a-eng.pdf?st=0eQrLJOZ (accessed on 15 June 2024).
- CBC News. Why Watching Alcohol Intake Is Advised, But Closing Liquor Stores Would Be a Problem; CBC News: London, UK, 2020; Available online: https://www.cbc.ca/news/canada/london/alcohol-covid-19-1.5509925 (accessed on 15 June 2024).
- Sathiyamoorthy, A.; Schwartz, N.; Hobin, E. COVID-19 Stressors and Cannabis and Alcohol Use in the Canadian Territories. Univ. Tor. J. Public Health 2024, 4. [Google Scholar] [CrossRef]
- Shi, Y.; Macrae, K.; De Groh, M.; Thompson, W.; Stockwell, T. Mortality and hospitalizations fully attributable to alcohol use before versus during the COVID-19 pandemic in Canada. Can. Med. Assoc. J. 2025, 197, E87–E95. [Google Scholar] [CrossRef]
- Friesen, E.L.; Yu, W.; Buajitti, E.; Selby, P.; Rosella, L.; Kurdyak, P. Clarifying rural-urban disparities in alcohol-related emergency department visits and hospitalizations in Ontario, Canada: A spatial analysis. J. Rural. Health 2023, 39, 223–232. [Google Scholar] [CrossRef]
- Domestic Violence Death Review Committee. Domestic Violence Death Review Committee: 2019–2020 Annual Report; Ontario Ministry of the Solicitor General: Toronto, ON, Canada, 2024; Available online: https://www.ontario.ca/document/domestic-violence-death-review-committee-2019-2020-annual-report (accessed on 15 June 2024).
- Statistics Canada. Trends in Police-Reported Family Violence and Intimate Partner Violence in Canada, 2022 Released at 8:30 A.M. Eastern Time; Statistics Canada: Ottawa, ON, Canada, 2023; Available online: https://www150.statcan.gc.ca/n1/en/daily-quotidien/231121/dq231121b-eng.pdf?st=lok5XmOV (accessed on 5 April 2025).
- Allan, J.; Kleinschafer, J.; Saksena, T.; Rahman, A.; Lawrence, J.; Lock, M. A comparison of rural Australian First Nations and Non-First Nations survey responses to COVID-19 risks and impacts: Implications for health communications. BMC Public Health 2022, 22, 1276. [Google Scholar] [CrossRef]
- Quintero Arias, C.; Rony, M.; Jensen, E.; Patel, R.; O’Callaghan, S.; Koziatek, C.A.; Doran, K.M.; Anthopolos, R.; Thorpe, L.E.; Elbel, B.; et al. Food insecurity in high-risk rural communities before and during the COVID-19 pandemic. Heliyon 2024, 10, e31354. [Google Scholar] [CrossRef]
- Visser, J.; Wangu, J. Women’s dual centrality in food security solutions: The need for a stronger gender lens in food systems’ transformation. Curr. Res. Environ. Sustain. 2021, 3, 100094. [Google Scholar] [CrossRef]
- Jordanova, K.E.; Suresh, A.; Canavan, C.R.; D’cruze, T.; Dev, A.; Boardman, M.; Kennedy, M.A. Addressing food insecurity in rural primary care: A mixed-methods evaluation of barriers and facilitators. BMC Prim. Care 2024, 25, 163. [Google Scholar] [CrossRef] [PubMed]
- McCollum, G.; Allgood, A.; Agne, A.; Cleveland, D.; Gray, C.; Ford, E.; Baral, S.; Mugavero, M.; Hall, A.G. Associations Between Social Networks and COVID-19 Vaccine Uptake in 4 Rural Alabama Counties: Survey Findings. Public Health Rep. 2024, 139, 691–698. [Google Scholar] [CrossRef] [PubMed]
- Rahilly, E.P. Trans-Affirmative Parenting: Raising Kids Across the Gender Spectrum; New York University Press: New York, NY, USA, 2020; ISBN 978-1-4798-2055-9. [Google Scholar]
- Glick, J.L.; Theall, K.; Andrinopoulos, K.; Kendall, C. For data’s sake: Dilemmas in the measurement of gender minorities. Cult. Health Sex. 2018, 20, 1362–1377. [Google Scholar] [CrossRef] [PubMed]
- Huisman, D.M. Social Power and Communicating Social Support: How Stigma and Marginalization Affect Our Ability to Help; Routledge: London, UK; Taylor & Francis Group: New York, NY, USA, 2023; ISBN 978-1-00-080476-8. [Google Scholar]
- Ghorbanian, A.; Aiello, B.; Staples, J. Under-Representation of Transgender Identities in Research: The Limitations of Traditional Quantitative Survey Data. Transgender Health 2022, 7, 261–269. [Google Scholar] [CrossRef]
- Rodríguez, M.; Camacho, J.A. Rural–urban differences in the perceived impact of COVID-19 on mental health by European women. Arch. Womens Ment. Health 2024, 27, 547–555. [Google Scholar] [CrossRef]
- Nott; Hawthorn A networked approach to addressing COVID-19 in rural and remote Australia. Rural Remote Health 2023, 23, 8132. [CrossRef]


| Bruce | Dufferin | Elgin | Grey | Middlesex b | North Durham c | Oxford | Overall | |||||||||
|---|---|---|---|---|---|---|---|---|---|---|---|---|---|---|---|---|
| Sample N: 2459 N (%) | Census N: 73,396 N (%) | Sample N: 2157 N (%) | Census N: 66,257 N (%) | Sample N: 2150 N (%) | Census N: 94,752 N (%) | Sample N: 3763 N (%) | Census N: 100,905 N (%) | Sample N: 2779 N (%) | Census N: 78,239 N (%) | Sample N: 1663 N (%) | Census N: 55,704 N (%) | Sample N: 3218 N (%) | Census N: 121,781 N (%) | Sample N: 18,189 N (%) | Census N: 591,034 N (%) | |
| Gender/Sex d | ||||||||||||||||
| Man | 896 (36.4%) | 698 (32.4%) | 712 (33.1%) | 1312 (34.9%) | 958 (34.5%) | 525 (31.6%) | 1110 (34.5%) | 6211 (34.1%) | ||||||||
| Woman | 1563 (63.6%) | 1459 (67.6%) | 1438 (66.9%) | 2451 (65.1%) | 1821 (65.5%) | 1138 (68.4%) | 2108 (65.5%) | 11,978 (65.9%) | ||||||||
| Male | 36,355 (49.5%) | 32,775 (49.5%) | 46,735 (49.3%) | 49,770 (49.3%) | 38,930 (49.8%) | 27,485 (49.3%) | 60,155 (49.4%) | 292,205 (49.4%) | ||||||||
| Female | 37,040 (50.5%) | 33,480 (50.5%) | 48,020 (50.7%) | 51,135 (50.7%) | 39,305 (50.2%) | 28,225 (50.7%) | 61,625 (50.6%) | 298,830 (50.6%) | ||||||||
| Age | ||||||||||||||||
| 18–69 e | 1627 (66.2%) | 45,280 (78.1%) | 1591 (73.8%) | 42,705 (85.5%) | 1618 (75.3%) | 58,800 (81.6%) | 2351 (62.5%) | 62,160 (77.2%) | 2037 (73.3%) | 48,750 (82.0%) | 1182 (71.1%) | 31,520 (71.4%) | 2377 (73.9%) | 75,915 (81.7%) | 12,783 (70.3%) | 642,130 (79.9%) |
| 70+ | 815 (33.1%) | 12,730 (21.9%) | 550 (25.5%) | 7270 (14.5%) | 518 (24.1%) | 13,290 (18.4%) | 1379 (36.6%) | 18,390 (12.8%) | 729 (26.2%) | 10,710 (18.0%) | 472 (28.4%) | 12,610 (28.6%) | 813 (25.3%) | 16,970 (18.3%) | 5276 (29.0%) | 144,350 (20.1%) |
| Visible Minority Status | ||||||||||||||||
| Not Visible Minority (i.e., white) | 1743 (70.9%) | 69,355 (96.2%) | 1573 (72.9%) | 55,095 (84.1%) | 1583 (73.6%) | 89,145 (95.4%) | 2709 (72.0%) | 94,985 (95.8%) | 2064 (74.3%) | 74,535 (96.6%) | 1284 (77.2%) | 51,590 (93.8%) | 2408 (74.8%) | 111,035 (92.3%) | 13,364 (73.5%) | 545,740 (93.7%) |
| Visible Minority | 198 (8.1%) | 2745 (3.8%) | 209 (9.7%) | 10,390 (15.9%) | 194 (9.0%) | 4275 (4.6%) | 283 (7.5%) | 4175 (4.2%) | 208 (7.5%) | 2655 (3.4%) | 124 (7.5%) | 3405 (6.2%) | 240 (7.5%) | 9230 (7.7%) | 1456 (8.0%) | 36,875 (6.3%) |
| Highest Educational Attainment | ||||||||||||||||
| High School or Less | 560 (22.8%) | 27,050 (45.1%) | 445 (20.6%) | 25,800 (48.5%) | 465 (21.6%) | 40,155 (52.6%) | 941 (25.0%) | 41,735 (49.8%) | 553 (19.9%) | 27,770 (44.0%) | 330 (19.8%) | 21,280 (45.7%) | 2408 (74.8%) | 51,975 (52.9%) | 4062 (22.3%) | 235,765 (49.0%) |
| Undergraduate Degree or Some College | 1477 (60.1%) | 30,020 (50.0%) | 1284 (59.5%) | 24,675 (46.3%) | 1369 (63.7%) | 33,555 (43.9%) | 2143 (56.9%) | 37,450 (44.7%) | 1756 (63.2%) | 31,645 (50.2%) | 1006 (60.5%) | 22,670 (48.7%) | 1942 (60.3%) | 42,780 (43.5%) | 10,977 (60.3%) | 222,795 (46.3%) |
| Graduate Degree or Certificate | 292 (11.9%) | 2970 (4.9%) | 319 (14.8%) | 2775 (5.2%) | 215 (10.0%) | 2690 (3.5%) | 497 (13.2%) | 4580 (5.47) | 351 (12.6%) | 3655 (5.8%) | 259 (15.6%) | 2640 (5.7%) | 351 (10.9%) | 3505 (3.6%) | 1787 (9.8%) | 22,815 (4.7%) |
| Men (N = 6211) | Women (N = 11,978) | p-Value | |
|---|---|---|---|
| How old are you? | |||
| 18–29 years | 184 (3.0%) | 583 (4.9%) | <0.001 |
| 30–39 years | 486 (7.8%) | 1475 (12.3%) | |
| 40–49 years | 527 (8.5%) | 1583 (13.2%) | |
| 50–59 years | 876 (14.1%) | 2243 (18.7%) | |
| 60–69 years | 1740 (28.0%) | 3086 (25.8%) | |
| 70–79 years | 1712 (27.6%) | 2197 (18.3%) | |
| 80+ years | 647 (10.4%) | 720 (6.0%) | |
| Missing | 39 (0.6%) | 91 (0.8%) | |
| What is your highest level of education completion? | |||
| Grade 13 or less | 1449 (23.4%) | 2646 (22.1%) | <0.001 |
| Trades certificate | 697 (11.2%) | 400 (3.3%) | |
| Undergraduate degree/College diploma | 2822 (45.4%) | 7058 (58.9%) | |
| Post-graduate degree (e.g., Master’s, PhD, MD) | 850 (13.7%) | 1434 (12%) | |
| Missing | 393 (6.3%) | 440 (3.7%) | |
| Which of the following best describes your primary source of economic support? | |||
| Unemployed | 75 (1.2%) | 312 (2.6%) | <0.001 |
| Employed Part-Time | 148 (2.4%) | 899 (7.5%) | |
| Employed Full-Time or Self-Employed | 2550 (41.1%) | 5027 (42.0%) | |
| Not in Work Force (Student, Social Assistance or Retired) | 3204 (51.6%) | 5117 (42.7%) | |
| Missing | 234 (3.8%) | 623 (5.2%) | |
| Do you identify with any of the ethnicities listed below? | |||
| Asian Identity | 95 (1.5%) | 105 (0.9%) | 0.001 |
| Black Identity | 16 (0.3%) | 50 (0.4%) | |
| Indigenous Identity | 48 (0.8%) | 105 (0.9%) | |
| White Identity | 4672 (75.2%) | 8692 (72.6%) | |
| Other Identity | 359 (5.8%) | 678 (5.7%) | |
| Missing | 1021 (16.4%) | 2348 (19.6%) | |
| Have you lived in the community for less than three years? | |||
| Yes | 806 (13.0%) | 1616 (13.5%) | 0.326 |
| No | 5352 (86.2%) | 10,243 (85.5%) | |
| Missing | 53 (0.9%) | 119 (1.0%) | |
| Did you experience trouble securing housing when you moved to the area? | |||
| Yes | 130 (2.1%) | 309 (2.6%) | 0.067 |
| No | 690 (11.1%) | 1321 (11.0%) | |
| Missing | 5391 (86.8%) | 10,348 (86.4%) | |
| Where did you move from? | |||
| Greater Toronto Region (GTA) | 241 (3.9%) | 453 (3.8%) | 0.895 |
| Elsewhere in Ontario (excluding GTA) | 487 (7.8%) | 1010 (8.4%) | |
| Within Canada (excluding Ontario) | 32 (0.5%) | 67 (0.6%) | |
| The United States | 5 (0.1%) | 11 (0.1%) | |
| Elsewhere | 21 (0.3%) | 43 (0.4%) | |
| Missing | 5425 (87.3%) | 10,394 (86.8%) | |
| Which of the following best describes your housing situation? | |||
| Own | 5464 (88.0%) | 10,195 (85.1%) | <0.001 |
| Rent | 541 (8.7%) | 1283 (10.7%) | |
| Retirement or Long-Term Care | 14 (0.2%) | 22 (0.2%) | |
| Other | 28 (0.5%) | 55 (0.5%) | |
| Missing | 164 (2.6%) | 423 (3.5%) | |
| In addition to yourself, how many people currently live in your home? | |||
| 0 | 308 (5.0%) | 546 (4.6%) | <0.001 |
| 1 | 1572 (25.3%) | 2722 (22.7%) | |
| 2 | 2769 (44.6%) | 4679 (39.1%) | |
| 3 | 657 (10.6%) | 1667 (13.9%) | |
| 4 | 518 (8.3%) | 1408 (11.8%) | |
| More than four | 321 (5.2%) | 823 (6.9%) | |
| Missing | 66 (1.1%) | 133 (1.1%) | |
| Do you have children or dependants at home? | |||
| No | 4749 (76.5%) | 8167 (68.2%) | <0.001 |
| Yes | 1388 (22.3%) | 3655 (30.5%) | |
| Missing | 74 (1.2%) | 156 (1.3%) | |
| Do you access childcare services (e.g., daycare)? | |||
| No | 1123 (18.1%) | 2861 (23.9%) | 0.142 |
| Yes | 262 (4.2%) | 753 (6.3%) | |
| Missing | 4826 (77.7%) | 8364 (69.8%) | |
| Have you experienced difficulty securing daycare services? | |||
| Yes | 99 (1.6%) | 394 (3.3%) | <0.001 |
| No | 173 (2.8%) | 382 (3.2%) | |
| Missing | 5939 (95.6%) | 11,202 (93.5%) | |
| Location | |||
| Bruce | 896 (14.4%) | 1563 (13.0%) | 0.014 |
| Dufferin | 698 (11.2%) | 1459 (12.2%) | |
| Elgin | 712 (11.5%) | 1438 (12.0%) | |
| Grey | 1312 (21.1%) | 2451 (20.5%) | |
| Middlesex * | 958 (15.4%) | 1821 (15.2%) | |
| North Durham + | 525 (8.5%) | 1138 (9.5%) | |
| Oxford | 1110 (17.9%) | 2108 (17.6%) | |
| Prior to COVID-19 | Since the Start of COVID-19 (After 1 March 2020) | |||||
|---|---|---|---|---|---|---|
| Man (N = 6211) | Woman (N = 11,978) | p-Value | Man (N = 6211) | Woman (N = 11,978) | p-Value | |
| How would you rate your mental health? | ||||||
| Excellent | 1892 (30.5%) | 2928 (24.4%) | <0.001 | 1185 (19.1%) | 1238 (10.3%) | <0.001 |
| Good | 3168 (51.0%) | 6140 (51.3%) | 2660 (42.8%) | 4014 (33.5%) | ||
| Average | 672 (10.8%) | 1780 (14.9%) | 1105 (17.8%) | 2826 (23.6%) | ||
| Satisfactory | 279 (4.5%) | 740 (6.2%) | 697 (11.2%) | 2088 (17.4%) | ||
| Poor | 82 (1.3%) | 213 (1.8%) | 409 (6.6%) | 1562 (13.0%) | ||
| Not applicable | 10 (0.2%) | 11 (0.1%) | 35 (0.6%) | 54 (0.5%) | ||
| Missing | 108 (1.7%) | 166 (1.4%) | 120 (1.9%) | 196 (1.6%) | ||
| Overall (All Surveyed Counties) | |||||||
|---|---|---|---|---|---|---|---|
| Pre-Pandemic Odds Ratios | Mid-Pandemic Odds Ratio | ||||||
| Poor Mental Health | Not Poor Mental Health | Poor Mental Health | Not Poor Mental Health | ||||
| Woman | 208 | 11,424 | Woman | 1551 | 10,047 | ||
| Man | 80 | 5982 | Man | 405 | 5555 | ||
| OR (95% CI) | 1.34 (1.04, 1.75) | OR (95% CI) | 2.12 (1.89, 2.38) | ||||
| Bruce County | |||||||
| Poor Mental Health | Not Poor Mental Health | Poor Mental Health | Not Poor Mental Health | ||||
| Woman | 21 | 1497 | Woman | 139 | 1372 | ||
| Man | 14 | 840 | Man | 42 | 810 | ||
| OR (95% CI) | 0.84 (0.43, 1.70) | OR (95% CI) | 1.95 (1.38, 2.81) | ||||
| Dufferin County | |||||||
| Poor Mental Health | Not Poor Mental Health | Poor Mental Health | Not Poor Mental Health | ||||
| Woman | 18 | 1403 | Woman | 179 | 1238 | ||
| Man | 11 | 655 | Man | 39 | 623 | ||
| OR (95% CI) | 0.76 (0.36, 1.68) | OR (95% CI) | 2.30 (1.62, 3.34) | ||||
| Elgin County | |||||||
| Poor Mental Health | Not Poor Mental Health | Poor Mental Health | Not Poor Mental Health | ||||
| Woman | 36 | 1365 | Woman | 233 | 1165 | ||
| Man | 10 | 679 | Man | 62 | 624 | ||
| OR (95% CI) | 1.77 (0.90, 3.81) | OR (95% CI) | 2.01 (1.50, 2.72) | ||||
| Grey County | |||||||
| Poor Mental Health | Not Poor Mental Health | Poor Mental Health | Not Poor Mental Health | ||||
| Woman | 47 | 2319 | Woman | 256 | 2100 | ||
| Man | 12 | 1242 | Man | 70 | 1181 | ||
| OR (95% CI) | 2.08 (1.13, 4.13) | OR (95% CI) | 2.05 (1.57, 2.72) | ||||
| Middlesex County | |||||||
| Poor Mental Health | Not Poor Mental Health | Poor Mental Health | Not Poor Mental Health | ||||
| Woman | 26 | 1750 | Woman | 256 | 1517 | ||
| Man | *** | 927 | Man | 63 | 866 | ||
| OR (95% CI) *** | N/A | OR (95% CI) | 2.31 (1.75, 3.11) | ||||
| North Durham (Partially Durham County) | |||||||
| Poor Mental Health | Not Poor Mental Health | Poor Mental Health | Not Poor Mental Health | ||||
| Woman | 19 | 1088 | Woman | 152 | 953 | ||
| Man | 6 | 501 | Man | 40 | 466 | ||
| OR (95% CI) | 1.43 (0.60, 4.01) | OR (95% CI) | 1.85 (1.30, 2.70) | ||||
| Oxford County | |||||||
| Poor Mental Health | Not Poor Mental Health | Poor Mental Health | Not Poor Mental Health | ||||
| Woman | 41 | 2002 | Woman | 336 | 1702 | ||
| Man | 23 | 1058 | Man | 89 | 985 | ||
| OR (95% CI) | 0.94 (0.56, 1.60) | OR (95% CI) | 2.18 (1.71, 2.81) | ||||
| Overall (All Surveyed Counties) | |||||
|---|---|---|---|---|---|
| Pre-Pandemic Odds Ratios | Mid-Pandemic Odds Ratio | ||||
| Poor Mental Health | Not Poor Mental Health | Poor Mental Health | Not Poor Mental Health | ||
| Adjusted OR (95% CI) | 1.09 (0.84, 1.43) | Adjusted OR (95% CI) | 1.77 (1.58, 2.00) | ||
| Bruce County | |||||
| Poor Mental Health | Not Poor Mental Health | Poor Mental Health | Not Poor Mental Health | ||
| Adjusted OR (95% CI) | 0.74 (0.37, 1.52) | Adjusted OR (95% CI) | 1.55 (1.09, 2.27) | ||
| Dufferin County | |||||
| Poor Mental Health | Not Poor Mental Health | Poor Mental Health | Not Poor Mental Health | ||
| Adjusted OR (95% CI) | 0.67 (0.31, 1.53) | Adjusted OR (95% CI) | 1.96 (1.37, 2.87) | ||
| Elgin County | |||||
| Poor Mental Health | Not Poor Mental Health | Poor Mental Health | Not Poor Mental Health | ||
| Adjusted OR (95% CI) | 1.48 (0.74, 3.25) | Adjusted OR (95% CI) | 1.78 (1.31, 2.44) | ||
| Grey County | |||||
| Poor Mental Health | Not Poor Mental Health | Poor Mental Health | Not Poor Mental Health | ||
| Adjusted OR (95% CI) | 1.63 (0.88, 3.26) | Adjusted OR (95% CI) | 1.69 (1.27, 2.26) | ||
| Middlesex County | |||||
| Poor Mental Health | Not Poor Mental Health | Poor Mental Health | Not Poor Mental Health | ||
| Adjusted OR (95% CI) | N/A*** | Adjusted OR (95% CI) | 2.18 (1.62, 2.96) | ||
| North Durham (Partial Durham County) | |||||
| Poor Mental Health | Not Poor Mental Health | Poor Mental Health | Not Poor Mental Health | ||
| Adjusted OR (95% CI) | 1.01 (0.40, 2.93) | Adjusted OR (95% CI) | 1.40 (0.96, 2.07) | ||
| Oxford County | |||||
| Poor Mental Health | Not Poor Mental Health | Poor Mental Health | Not Poor Mental Health | ||
| Adjusted OR (95% CI) | 0.77 (0.46, 1.34) | Adjusted OR (95% CI) | 1.93 (1.50, 2.50) | ||
| Prior to COVID-19 | Since the Start of COVID-19 (After 1 March 2020) | |||||
|---|---|---|---|---|---|---|
| Men (N = 6211) | Women (N = 11,978) | p-Value | Man (N = 6211) | Woman (N = 11,978) | p-Value | |
| How often did you spend time with friends and/or family? | ||||||
| More than 2x/week | 2387 (38.4%) | 5380 (44.9%) | <0.001 | 739 (11.9%) | 998 (8.3%) | <0.001 |
| 1–2 times/week | 2351 (37.9%) | 4306 (35.9%) | 1326 (21.3%) | 2139 (17.9%) | ||
| 1–2x/month | 1297 (20.9%) | 2035 (17.0%) | 3058 (49.2%) | 6075 (50.7%) | ||
| Never or not at all | 58 (0.9%) | 73 (0.6%) | 870 (14.0%) | 2280 (19.0%) | ||
| Missing | 118 (1.9%) | 184 (1.5%) | 218 (3.5%) | 486 (4.1%) | ||
| How often did you consume alcohol? | ||||||
| More than 2x/week | 1787 (28.8%) | 1886 (15.7%) | <0.001 | 1975 (31.8%) | 2572 (21.5%) | <0.001 |
| 1–2 times/week | 1626 (26.2%) | 2893 (24.2%) | 1403 (22.6%) | 2422 (20.2%) | ||
| 1–2x/month | 1381 (22.2%) | 3524 (29.4%) | 1189 (19.1%) | 2730 (22.8%) | ||
| Never or not at all | 1282 (20.6%) | 3450 (28.8%) | 1461 (23.5%) | 3850 (32.1%) | ||
| Missing | 135 (2.2%) | 225 (1.9%) | 183 (2.9%) | 404 (3.4%) | ||
| How often did you consume marijuana? | ||||||
| More than 2x/week | 313 (5.0%) | 445 (3.7%) | <0.001 | 391 (6.3%) | 623 (5.2%) | 0.008 |
| 1–2 times/week | 166 (2.7%) | 244 (2.0%) | 182 (2.9%) | 311 (2.6%) | ||
| 1–2x/month | 293 (4.7%) | 570 (4.8%) | 299 (4.8%) | 575 (4.8%) | ||
| Never or not at all | 5329 (85.8%) | 10,546 (88.0%) | 5177 (83.4%) | 10,177 (85.0%) | ||
| Missing | 110 (1.8%) | 173 (1.4%) | 162 (2.6%) | 292 (2.4%) | ||
| How often did you consume opioids? | ||||||
| More than 2x/week | 33 (0.5%) | 75 (0.6%) | 0.293 | 39 (0.6%) | 75 (0.6%) | 0.887 |
| 1–2 times/week | 12 (0.2%) | 15 (0.1%) | 14 (0.2%) | 24 (0.2%) | ||
| 1–2x/month | 17 (0.3%) | 48 (0.4%) | 22 (0.4%) | 51 (0.4%) | ||
| Never or not at all | 6050 (97.4%) | 11,680 (97.5%) | 5972 (96.2%) | 11,532 (96.3%) | ||
| Missing | 99 (1.6%) | 160 (1.3%) | 164 (2.6%) | 296 (2.5%) | ||
Disclaimer/Publisher’s Note: The statements, opinions and data contained in all publications are solely those of the individual author(s) and contributor(s) and not of MDPI and/or the editor(s). MDPI and/or the editor(s) disclaim responsibility for any injury to people or property resulting from any ideas, methods, instructions or products referred to in the content. |
© 2025 by the authors. Licensee MDPI, Basel, Switzerland. This article is an open access article distributed under the terms and conditions of the Creative Commons Attribution (CC BY) license (https://creativecommons.org/licenses/by/4.0/).
Share and Cite
Norton, A.; Rosella, L.; Adams, M.; Deacon, L. COVID-19 in Rural Ontario Communities: Exploring Women’s Mental Health During a Pandemic. Int. J. Environ. Res. Public Health 2025, 22, 937. https://doi.org/10.3390/ijerph22060937
Norton A, Rosella L, Adams M, Deacon L. COVID-19 in Rural Ontario Communities: Exploring Women’s Mental Health During a Pandemic. International Journal of Environmental Research and Public Health. 2025; 22(6):937. https://doi.org/10.3390/ijerph22060937
Chicago/Turabian StyleNorton, Amanda, Laura Rosella, Matthew Adams, and Leith Deacon. 2025. "COVID-19 in Rural Ontario Communities: Exploring Women’s Mental Health During a Pandemic" International Journal of Environmental Research and Public Health 22, no. 6: 937. https://doi.org/10.3390/ijerph22060937
APA StyleNorton, A., Rosella, L., Adams, M., & Deacon, L. (2025). COVID-19 in Rural Ontario Communities: Exploring Women’s Mental Health During a Pandemic. International Journal of Environmental Research and Public Health, 22(6), 937. https://doi.org/10.3390/ijerph22060937