
Predicting Low Birth Weight in Big Cities in the United States Using a Machine Learning Approach


Abstract
1. Introduction
2. Methods
3. Results
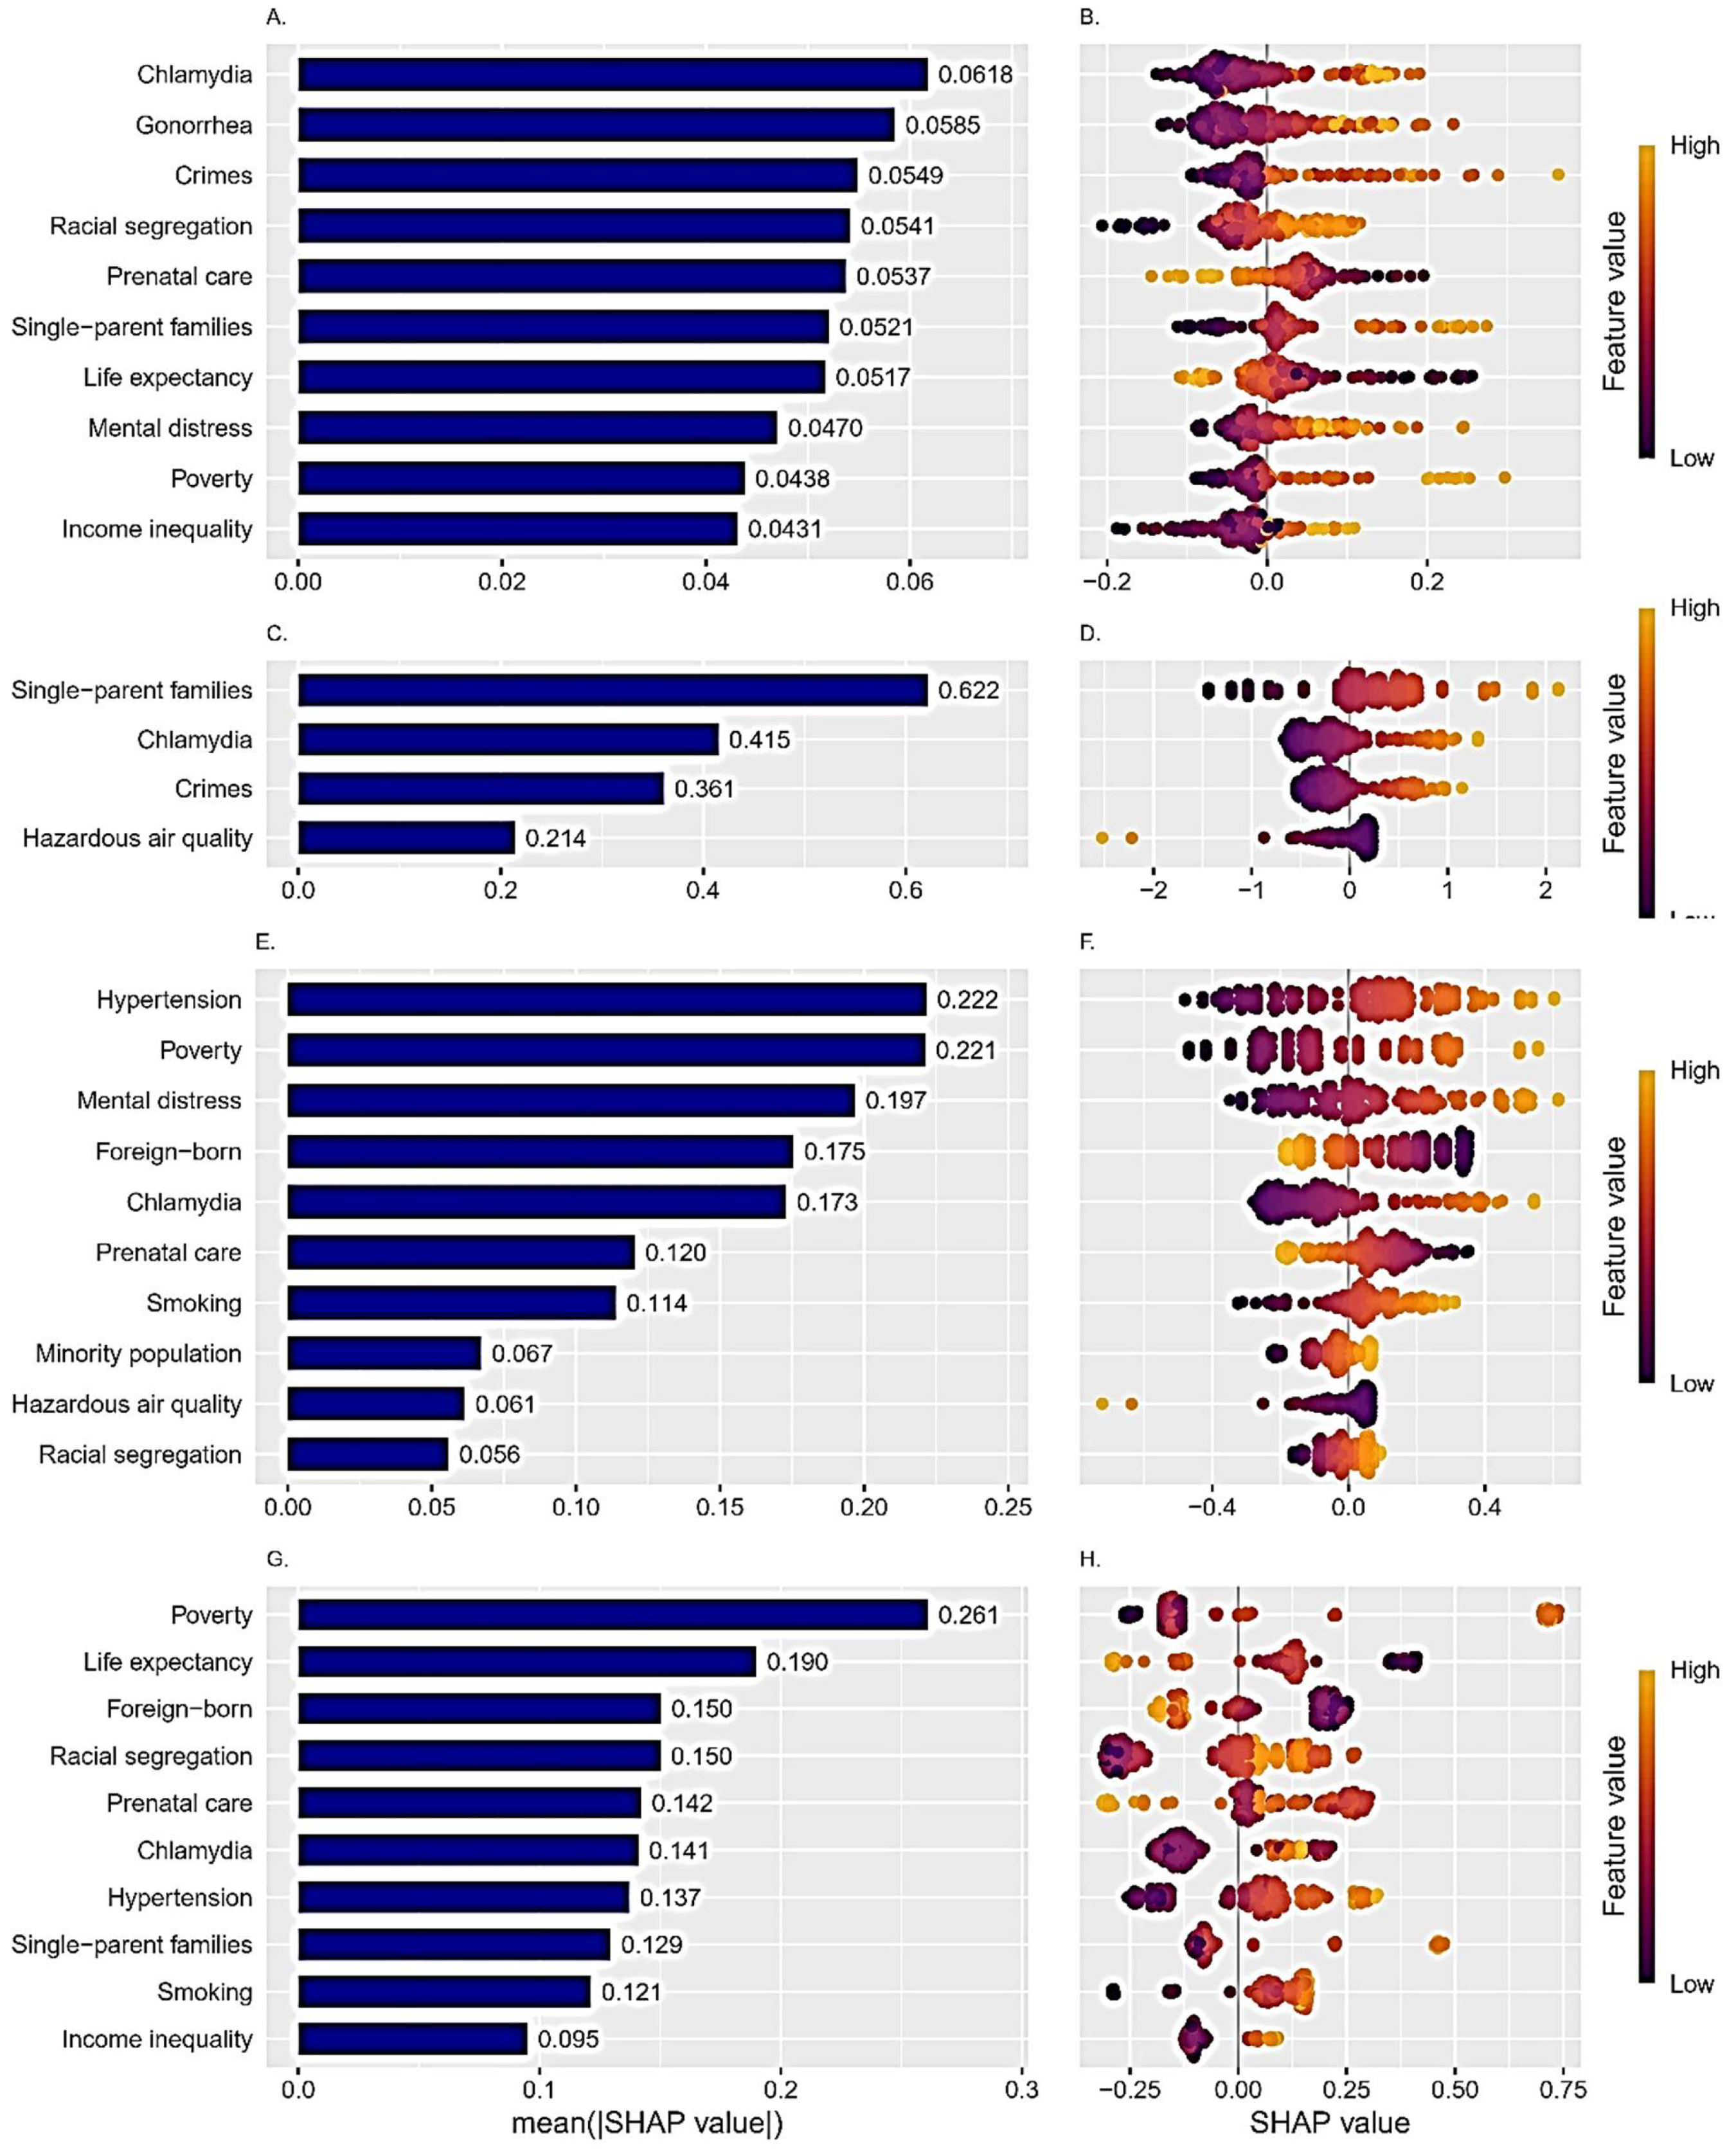
Importance of the Predictors
4. Discussion
5. Conclusions
Supplementary Materials
Funding
Institutional Review Board Statement
Informed Consent Statement
Data Availability Statement
Conflicts of Interest
References
- UNICEF. The United Nations Children’s Fund Data. Monitoring the Situation of Children and Women. 2025. Available online: https://data.unicef.org/topic/nutrition/low-birthweight/ (accessed on 27 May 2025).
- Zheng, S.; Cao, Y.; Strasser, S.; Wei, H. Prevalence and risk factors of low birth weight in the United States: An analysis of 2016–2021 data. Am. J. Hum. Biol. 2024, 36, e24016. [Google Scholar] [CrossRef] [PubMed]
- Ely, D.M.; Driscoll, A.K. Infant mortality in the United States, 2021: Data from the period linked birth/infant death file. Natl. Vital Stat. Rep. 2023, 72, 1–19. [Google Scholar]
- Amadou, C.; Ancel, P.Y.; Zeitlin, J.; Ribet, C.; Zins, M.; Charles, M.A. Long-term health in individuals born preterm or with low birth weight: A cohort study. Pediatr. Res. 2025, 97, 577–585. [Google Scholar] [CrossRef]
- Bianchi, M.E.; Restrepo, J.M. Low Birthweight as a Risk Factor for Non-communicable Diseases in Adults. Front. Med. 2021, 8, 793990. [Google Scholar] [CrossRef]
- Kumar, M.; Saadaoui, M.; Al Khodor, S. Infections and Pregnancy: Effects on Maternal and Child Health. Front. Cell. Infect. Microbiol. 2022, 12, 873253. [Google Scholar] [CrossRef]
- Cutland, C.L.; Lackritz, E.M.; Mallett-Moore, T.; Bardají, A.; Chandrasekaran, R.; Lahariya, C.; Nisar, M.I.; Tapia, M.D.; Pathirana, J.; Kochhar, S.; et al. Low birth weight: Case definition & guidelines for data collection, analysis, and presentation of maternal immunization safety data. Vaccine 2017, 35, 6492–6500. [Google Scholar] [CrossRef]
- Kong, L.; Nilsson, I.A.K.; Gissler, M.; Lavebratt, C. Associations of Maternal Diabetes and Body Mass Index With Offspring Birth Weight and Prematurity. JAMA Pediatr. 2019, 173, 371–378. [Google Scholar] [CrossRef]
- Liu, Y.; Li, N.; An, H.; Li, Z.; Zhang, L.; Li, H.; Zhang, Y.; Ye, R. Impact of gestational hypertension and preeclampsia on low birthweight and small-for-gestational-age infants in China: A large prospective cohort study. J. Clin. Hypertens. 2021, 23, 835–842. [Google Scholar] [CrossRef]
- Bekkar, B.; Pacheco, S.; Basu, R.; DeNicola, N. Association of Air Pollution and Heat Exposure With Preterm Birth, Low Birth Weight, and Stillbirth in the US: A Systematic Review. JAMA Netw. Open 2020, 3, 208243. [Google Scholar] [CrossRef]
- Bandyopadhyay, A.; Jones, H.; Parker, M.; Marchant, E.; Evans, J.; Todd, C.; Rahman, M.A.; Healy, J.; Win, T.L.; Rowe, B.; et al. Weighting of risk factors for low birth weight: A linked routine data cohort study in Wales, UK. BMJ Open 2023, 13, e063836. [Google Scholar] [CrossRef]
- Okwaraji, Y.B.; Krasevec, J.; Bradley, E.; Conkle, J.; Stevens, G.A.; Gatica-Domínguez, G.; O Ohuma, E.; Coffey, C.; Fernandez, D.G.E.; Blencowe, H.; et al. National, regional, and global estimates of low birthweight in 2020, with trends from 2000: A systematic analysis. Lancet 2024, 403, 1071–1080. [Google Scholar] [CrossRef] [PubMed]
- Ranjbar, A.; Montazeri, F.; Farashah, M.V.; Mehrnoush, V.; Darsareh, F.; Roozbeh, N. Machine learning-based approach for predicting low birth weight. BMC Pregnancy Childbirth 2023, 23, 803. [Google Scholar] [CrossRef] [PubMed]
- Pollob, S.M.A.I.; Abedin, M.M.; Islam, M.T.; Islam, M.M.; Maniruzzaman, M. Predicting risks of low birth weight in Bangladesh with machine learning. PLoS ONE 2022, 17, e0267190. [Google Scholar] [CrossRef]
- Bai, X.; Zhou, Z.; Su, M.; Li, Y.; Yang, L.; Liu, K.; Yang, H.; Zhu, H.; Chen, S.; Pan, H. Predictive models for small-for-gestational-age births in women exposed to pesticides before pregnancy based on multiple machine learning algorithms. Front. Public Health 2022, 10, 940182. [Google Scholar] [CrossRef]
- Big Cities Health Inventory Data Platform. Big Cities Health Coalition. 2024. Available online: https://bigcitieshealthdata.org/ (accessed on 21 July 2024).
- James, G.; Witten, D.; Hastie, T.; Tibshirani, R. An Introduction to Statistical Learning, 1st ed.; Springer: Cham, Switzerland, 2024; Available online: https://www.statlearning.com (accessed on 5 August 2024).
- Chan, J.Y.-L.; Leow, S.M.H.; Bea, K.T.; Cheng, W.K.; Phoong, S.W.; Hong, Z.-W.; Chen, Y.-L. Mitigating the multicollinearity problem and its machine learning approach: A review. Mathematics 2022, 10, 1283. [Google Scholar] [CrossRef]
- Lindner, T.; Puck, J.; Verbeke, A. Beyond addressing multicollinearity: Robust quantitative analysis and machine learning in international business research. J. Int. Bus. Stud. 2022, 53, 1307–1314. [Google Scholar] [CrossRef]
- Rodríguez-Pérez, R.; Bajorath, J. Interpretation of machine learning models using shapley values: Application to compound potency and multi-target activity predictions. J. Comput. Aided Mol. Des. 2020, 34, 1013–1026. [Google Scholar] [CrossRef]
- Song, H. The unequal consequences of family structures for infant health. Soc. Sci. Res. 2021, 100, 102604. [Google Scholar] [CrossRef]
- Savitsky, B.; Radomislensky, I.; Frid, Z.; Gitelson, N.; Hendel, T. Family Income and Low Birth Weight in Term Infants: A Nationwide Study in Israel. Matern. Child Health J. 2022, 26, 1820–1832. [Google Scholar] [CrossRef]
- Iacono, C.D.; Requena, M.; Stanek, M. Partnership, living arrangements, and low birth weight: Evidence from a population-based study on Spanish mothers. BMC Pregnancy Childbirth 2022, 22, 925. [Google Scholar] [CrossRef]
- Olson-Chen, C.; Balaram, K.; Hackney, D.N. Chlamydia trachomatis and Adverse Pregnancy Outcomes: Meta-analysis of Patients With and Without Infection. Matern. Child Health J. 2018, 22, 812–821. [Google Scholar] [CrossRef] [PubMed]
- He, W.; Jin, Y.; Zhu, H.; Zheng, Y.; Qian, J. Effect of Chlamydia trachomatis on adverse pregnancy outcomes: A meta-analysis. Arch. Gynecol. Obstet. 2020, 302, 553–567. [Google Scholar] [CrossRef] [PubMed]
- Grossman, D.; Khalil, U. Neighborhood crime and infant health. J. Urban Econ. 2022, 130, 103457. [Google Scholar] [CrossRef]
- Santos, A.C.D.; Brentani, A.; Fink, G. Associations between neighborhood violence during pregnancy and birth outcomes: Evidence from São Paulo’s Western Region Birth Cohort. BMC Public Health 2021, 21, 865. [Google Scholar] [CrossRef]
- Messer, L.C.; Kaufman, J.S.; Dole, N.; Herring, A.; Laraia, B.A. Violent crime exposure classification and adverse birth outcomes: A geographically-defined cohort stud. Int. J. Health Geogr. 2006, 5, 22. [Google Scholar] [CrossRef]
- Niu, Z.; Habre, R.; Chavez, T.A.; Yang, T.; Grubbs, B.H.; Eckel, S.P.; Berhane, K.; Toledo-Corral, C.M.; Johnston, J.; Dunton, G.F.; et al. Association Between Ambient Air Pollution and Birth Weight by Maternal Individual- and Neighborhood-Level Stressors. JAMA Netw. Open 2022, 5, e2238174. [Google Scholar] [CrossRef]
- Yitshak-Sade, M.; Novack, L.; Landau, D.; Kloog, I.; Sarov, B.; Hershkovitz, R.; Karakis, I. Relationship of ambient air pollutants and hazardous household factors with birth weight among Bedouin-Arabs. Chemosphere 2016, 160, 314–322. [Google Scholar] [CrossRef]
- Niemesh, G.T.; Shester, K.L. Racial residential segregation and black low birth weight, 1970–2010. Reg. Sci. Urban Econ. 2020, 83, 103542. [Google Scholar] [CrossRef]
- Diabelková, J.; Rimárová, K.; Urdzík, P.; Dorko, E.; Houžvičková, A.; Andraščíková, Š.; Drabiščák, E.; Škrečková, G. Risk factors associated with low birth weight. Cent. Eur. J. Public Health 2022, 30, S43–S49. [Google Scholar] [CrossRef]
- Hidalgo-Lopezosa, P.; Jimenez-Ruz, A.; Carmona-Torres, J.M.; Hidalgo-Maestre, M.; Rodriguez-Borrego, M.A.; Lopez-Soto, P.T. Sociodemographic factors associated with preterm birth and low birth weight: A cross-sectional study. Women Birth 2019, 32, e538–e543. [Google Scholar] [CrossRef]
- Rebouças, P.; Paixão, E.S.; Ramos, D.; Pescarini, J.; Pinto-Junior, E.P.; Falcão, I.R.; Ichihara, M.Y.; Sena, S.; Veiga, R.; Ribeiro, R.; et al. Ethno-racial inequalities on adverse birth and neonatal outcomes: A nationwide, retrospective cohort study of 21 million Brazilian newborns. Lancet Reg. Health Am. 2024, 37, 100833. [Google Scholar] [CrossRef]
- Scifres, C.M. Short- and Long-Term Outcomes Associated with Large for Gestational Age Birth Weight. Obstet. Gynecol. Clin. N. Am. 2021, 48, 325–337. [Google Scholar] [CrossRef]


| Variables | Mean (SD) | City with Highest Value Mean (SD) | City with Lowest Value Mean (SD) |
|---|---|---|---|
| Health/morbidity-related: | |||
| Low birth weight, percent | 9.11 (1.89) | Detroit 14.2 (0.83) | Seattle 6.51 (0.27) |
| Prenatal care, percent | 73.38 (9.21) | Oakland 89.30 (2.05) | Houston 58.4 (1.89) |
| Obesity, percent | 30.60 (6.51) | Detroit 35.5 (1.53) | San Francisco 18.1 (0.93) |
| Diabetes, percent | 10.81 (2.64) | Detroit 18.00 (0.33) | Seattle 6.62 (0.34) |
| Hypertension, percent | 30.14 (5.49) | Detroit 46.30 (0.79) | Austin 22.8 (0.51) |
| Physical inactivity, percent | 25.23 (5.60) | Detroit 36.60 (1.22) | Seattle 13.40 (0.66) |
| Flu vaccinations, percent | 47.0 (6.10) | Minneapolis 56.20 (3.56) | El Paso 32.70 (1.93) |
| New chlamydia cases, rate per 100,000 | 737.98 (261.75) | Baltimore 1299.00 (121.00) | San Jose 367.00 (58.50) |
| New gonorrhea cases, rate per 100,000 | 264.92 (139.89) | Baltimore 528.00 (146.00) | El Paso 87.50 (23.00) |
| Binge drinking, percent | 17.65 (2.88) | Washington 22.4 (131.00) | Memphis 11.9 (79.60) |
| Smoking, percent | 18.09 (4.64) | Detroit 29.00 (68.80) | Seattle 10.80 (57.20) |
| Mental distress, percent | 14.11 (2.56) | Detroit 18.6 (1.52) | San Francisco 10.80 (1.45) |
| Life expectancy at birth, years | 77.80 (3.05) | San Jose 82.90 (0.55) | Detroit 72.20 (1.51) |
| Climate/built environment related: | |||
| City parks system, index (0–100) | 55.53 (15.70) | Minneapolis 83.70 (92.44) | Indianapolis 30.20 (1.75) |
| Poor air quality, number of days | 45.36 (20.50) | Long Beach 90.30 (0.80) Los Angeles 90.30 (1.11) | Portland 13.80 (0.83) |
| Hazardous air quality, number of days | 5.33 (8.06) | Long Beach 30.00 (5.38) Los Angeles 30.00 (5.38) | Minneapolis 0.34 (0.34) |
| Social and economic: | |||
| Community social vulnerability to climate disasters, percent | 39.54 (14.18) | Detroit 69.9 (12.20) | Seattle 10.90 (2.47) |
| Housing lead risk, percent | 29.26 (19.77) | Cleveland 63.8 (2.72) | Las Vegas 1.63 (0.12) |
| Uninsured, percent | 11.65 (5.26) | Dallas 24.40 (0.70) | Boston 3.65 (0.30) |
| College graduates, percent | 36.17 (11.77) | Seattle 62.40 (4.07) | Detroit (4.8 (1.87) |
| Poverty level, percent | 18.89 (5.66) | Detroit 35.50 (3.26) | San Jose 9.63 (1.54)) |
| Unemployment, percent | 8.05 (3.38) | Detroit 19.60 (5.06) | Seattle 4.98 (1.00) |
| Per capita household income, dollars | 35,546.27 (12,981.37) | San Francisco 66,946.00 (16,553.00) | Detroit 18,543.00 (3607.00) |
| Income inequality, index (0–100) | 0.49 (0.03) | New York City 0.547 (0.00 | Columbus 0.45 (0.00) |
| Owners occupied housing, percent | 48.15 (7.32) | Louisville 60.5 (0.84) | New York City 32.70 (0.24) |
| Excessive housing cost, percent | 30.04 (4.03) | Los Angeles 42.4 (0.67) | Oklahoma City 22.80 (0.14) |
| Single parent families, percent | 12.89 (3.69) | Detroit 21.50 (1.68) | San Francisco 5.09 (0.34) |
| Teen births, percent | 29.59 (15.57) | Houston 53.1 (16.3) | Seattle 6.15 (3.19) |
| Violent crimes, rate per 100,000 | 890.89 (449.98) | Detroit 2032.00 (116.00) | El Paso 370.00 (55.30) |
| Demographic: | |||
| Population density, per square mile | 6325.13 (5365.88) | New York City 28,250 (668.00) | Oklahoma City 1052 (66.40) |
| Children under 5 years, percent | 22.16 (3.46) | Fort Worth 27.90 (1.03) | San Francisco 13.50 (0.07) |
| Minority population, percent | 60.24 (14.51) | Detroit 90.40 (0.83) | Portland 29.80 (1.70) |
| Foreign-born, percent | 18.51 (9.37) | San Jose 39.80 (1.13) | Cleveland 5.34 (0.55) |
| White-Black Racial segregation, Index 0–100 | 47.58 (9.30) | Memphis 61.50 (1.28) | Portland 25.70 (2.20) |
| Model | Tuning Parameter | Value |
|---|---|---|
| K-nearest neighbors | K (number of neighbors) | 45 |
| Best subset selection | Number of predictors | 4 |
| Lasso | Λ (penalty term) | 0.125 |
| Random forest | Number of predictors at each split time. | 5 |
| XGBoost | Maximum depth of a tree | 4 |
| Minimum number of observations in a split | 27 | |
| Gamma (minimum loss reduction in the split) | 0 | |
| Eta (learning rate) | 0.05 | |
| Maximum number of iterations | 1400 | |
| Fraction of predictors in each tree | 0.3 | |
| Fraction of observations in each tree | 0.5 |
Disclaimer/Publisher’s Note: The statements, opinions and data contained in all publications are solely those of the individual author(s) and contributor(s) and not of MDPI and/or the editor(s). MDPI and/or the editor(s) disclaim responsibility for any injury to people or property resulting from any ideas, methods, instructions or products referred to in the content. |
© 2025 by the author. Licensee MDPI, Basel, Switzerland. This article is an open access article distributed under the terms and conditions of the Creative Commons Attribution (CC BY) license (https://creativecommons.org/licenses/by/4.0/).
Share and Cite
Treister-Goltzman, Y. Predicting Low Birth Weight in Big Cities in the United States Using a Machine Learning Approach. Int. J. Environ. Res. Public Health 2025, 22, 934. https://doi.org/10.3390/ijerph22060934
Treister-Goltzman Y. Predicting Low Birth Weight in Big Cities in the United States Using a Machine Learning Approach. International Journal of Environmental Research and Public Health. 2025; 22(6):934. https://doi.org/10.3390/ijerph22060934
Chicago/Turabian StyleTreister-Goltzman, Yulia. 2025. "Predicting Low Birth Weight in Big Cities in the United States Using a Machine Learning Approach" International Journal of Environmental Research and Public Health 22, no. 6: 934. https://doi.org/10.3390/ijerph22060934
APA StyleTreister-Goltzman, Y. (2025). Predicting Low Birth Weight in Big Cities in the United States Using a Machine Learning Approach. International Journal of Environmental Research and Public Health, 22(6), 934. https://doi.org/10.3390/ijerph22060934