Abstract
Cancers are problematic for health systems globally, including in Antigua and Barbuda, where understanding the changing extent of common cancers is key to implementing effective prevention and control strategies. This study aimed to assess the relationship between treatment rates and drug treatment costs along with characteristics affecting these costs for patients with female breast, cervical, colorectal and prostate cancers in Antigua and Barbuda from 2017 to 2021. A retrospective observational study design was used. Estimates of age-standardized treatment rates and drug treatment costs were determined using direct standardization and a micro-costing approach, respectively. Linear regression was used to evaluate the relationship between age-standardized treatment rates and drug treatment costs. Model independent variables were assessed for multicollinearity and residuals examined for variance and normality. With a sum of 242 cases identified for this study, each cancer type showed evidence of strong positive correlations and significant associations between treatment costs and age-standardized treatment rates. The mean cost (USD) of drug treatment was highest for female breast (USD 25,009.63) and colorectal (USD 13,317.16) cancers and lowest for prostate (USD 12,528.10) and cervical (USD 5121.41) cancers, with several variables showing significance in the respective final models. An association existed between age-standardized treatment rates and drug treatment costs for the cancers studied. These results offer a basis for encouraging strategies in obtaining affordably priced cancer medicines in Antigua and Barbuda.
1. Introduction
The burden of cancer is still an important challenge for institutions of public health in most countries [1,2]. Global estimates suggest that there were 20 million new cancer cases and approximately 10 million cancer-related deaths in 2022, with a combined age-standardized incidence rate of 212.5 and 186.2 for men and women, respectively, and age-standardized mortality rates for men and women were 109.7 and 76.8 per 100,000, respectively [1]. Compared to 2020, when the age-standardized mortality rate was 100.7 per 100,000 for both sexes and 120.8 and 84.2 per 100,000 for men and women, respectively, recent changes highlight the increasing burden that cancer incidence and mortality impose on all countries, especially those in low- and low-middle-income countries (LMICs) such as those in Latin America and the Caribbean [2,3].
GLOBOCAN reports on cancer incidence and mortality have consistently listed female breast, prostate, cervical and colorectal cancers within the top-ten-ranked cancers based on incidence and deaths globally [1,2,4]. These four cancers contribute to the considerable burdens on health systems given their demand for effective preventive measures such as vaccinations, improved screening and diagnostic tools, and advances in therapeutic care, among other measures [3]. Taken together, the demands exacted by these four cancers are problematic for countries such as Antigua and Barbuda.
In Antigua and Barbuda, Simon et al. [5] reported that of 492 histologically confirmed new cases of cancer diagnosed in the period 2001–2005, prostate, female breast, cervical and colorectal had some of the highest incidence rates [5]. Recent findings by Bovell et al. [6], while showing a change in incidence of these cancers, also highlight an upward trend based on existing distribution patterns of these conditions [6]. Generally, the findings of these studied cancers on Antigua and Barbuda suggest that there is a need for a greater understanding of the changing extent and profile of these diseases. This becomes important if the country’s health system is to develop and prioritize interventions at the national level that could lend to improvements for persons affected by the named cancers.
Currently, there is a scarcity of data and limited research on the relationship between cancer treatment rates and associated treatment costs in Antigua and Barbuda [5,7]. Notwithstanding, recent studies by Bovell et al. [8,9,10] suggest that the annual direct medical costs related to the treatment of cervical, colorectal and prostate cancers in Antigua and Barbuda amounts to roughly USD 112,863.76, USD 613,650.01 and USD 1,566,642.66, respectively [8,9,10]. In a manuscript in progress, Bovell et al. [11] posits that the annual direct medical cost for the treatment of female breast cancer is approximately USD 2,458,305.82 [11].
Addressing the gap in cancer treatment rates vis treatment costs is important to furthering our understanding of the magnitude of the burden of these four cancers in the country. In this regard, the study will add value given (i) the need to comprehend the extent of the financial challenges that cancer drugs places on the local healthcare system [12], (ii) the need for enhanced support of cancer drug costs or price constraint measures [13,14], (iii) the need for optimizing cancer care resource allocation [15], (iv) the need to ensure that there is equitable access to essential cancer drugs across all levels of the population, including among the most vulnerable groups [15,16], and (v) the need for insights into initiatives that can lend to cancer drugs affordability and an overall enhancement in cancer care at both the public health and clinical practice levels locally [12,13]. This study, therefore, aimed to investigate the relationship between treatment rates and drug treatment costs while also examining what patient population-specific socio-demographics, clinical or socio-economic characteristics affect the drug treatment costs for patients with female breast, cervical, colorectal and prostate cancers in the population of Antigua and Barbuda.
2. Materials and Methods
2.1. Study Design, Area and Population
This was a retrospective observational study that utilized some data and results reported in the article “Incidence, trends and patterns of female breast, cervical, colorectal, and prostate cancers in Antigua and Barbuda, 2017–2021: a retrospective study” [6] to conduct an evaluation of the healthcare provider’s treatment costs linked to diagnosed cancer cases of men and women > 18 years who received systemic therapy for female breast, cervical, colorectal, and prostate (androgen deprivation therapy) cancers between 1 January 2017 and 31 December 2021 [6]. Use of some of this study data and results further expands our understanding of the burden of the four cancers beyond that obtained from our initial examination of their epidemiology while also providing insights into an area of cancer treatment where resource allocation is paramount [17,18].
For this study, we did not consider any cases with a recurring cancer [6].
2.2. Sample Size
In accordance with the previously published data referenced in the study [6], we initially attempted to utilize information from all cases diagnosed with each of the four cancers: female breast cancer (n = 163), cervical cancer (n = 40), colorectal cancer (n = 79) and prostate cancer (n = 109) [6]. However, to ensure adherence to the study’s objective and due to limitations in the availability of complete or detailed prescription records for the systemic drugs used for the diagnosed cases, we had to consider a reduced number of cases for each cancer type. Resultantly, the actual number of cases used were female breast cancer (n = 105), cervical cancer (n = 27), colorectal cancer (n = 40) and prostate cancer (n = 70).
2.3. Data Collection
Collection of study data on the malignant cases of our four cancers is stated elsewhere [6]. Information on cancer cases previously categorized according to the International Classification of Diseases, 10th edition (ICD-10) codes, (C61 for prostate cancer, C50 for breast, C53 for cervical cancer, and C18, C19, C20 for colon and rectal cancer) were obtained by record abstraction using patient files from Urology, Oncology, and Pathology departments of the Sir Lester Bird Medical Centre (SLBMC), The Cancer Centre Eastern Caribbean (TCCEC), and the Medical Benefits Scheme (MBS) [6]. Cancer deaths data were obtained from the Ministry of Health, Health Information Division, Antigua and Barbuda (HID) [6].
2.4. Data and Cost Variables
Drug treatment (treatment) cost data were based on the chemotherapy drugs, identified as being used to treat each case of the listed cancers, that is, whether a case completed all or part of their cycles of therapy or drug regimen. Treatment costs were aggregated at the patient level. That is, through our use of a micro-costing approach, the costs of chemotherapy drugs were quantified and valued for each patient based on their cancer type [8]. For prostate cancer, this was the cost of androgen deprivation drugs.
The direct medical costs related to the drugs used for systemic therapy were based on market prices and obtained from private pharmaceutical suppliers and distributors of oncology and oncology-related products to the Sir Lester Bird Medical Centre and/or the Medical Benefits Scheme [19]. Drug treatment costs were considered a dependent variable of interest and were computed as follows:
where —summation, n = 1 is the first case per cancer type, i = the upper limit of the number of cases per cancer type (summation runs from case number 1 to the ith case), d is number of drugs prescribed for use by each cancer case, p is the unit costs per drug used, c is the number of cycles of treatment recommended, tc is the summation of total treatment costs for all diagnosed cancer cases that received systemic treatment.
Baseline characteristics were collected under the broad headings of demographic characteristics, which included age at diagnosis, age in five-year age categories, sex (colorectal cancer), parish (area of residence), year of presentation, vital status; clinical characteristics, which included clinical stage of cancer (disease stage), histological grade and morphological type, and evidence of noncommunicable disease; and socio-economic characteristics, which included employment status and estimated monthly income at presentation. To understand the data obtained in relation to the chemotherapeutic drugs used in the treatment of these four cancers, studies were consulted, and general discussions were held with healthcare experts involved in the treatment and management of patients with these cancers at the SLBMC. Our expert guidance suggested that all persons diagnosed with any of the four cancers were clinically staged according to AJCC 8th edition guidelines (FIGO staging guidelines for cervical cancer), in the same year they were diagnosed and had access to chemotherapy drug treatment (androgen deprivation drugs for prostate cancer) according to the local guidelines [8,9].
2.5. Data Management
For convenience of analyses of the baseline characteristics of these cancers, age was classified as both a continuous variable and in 5-year age categories (for example 30–34, 35–39…55–59, 60–64 and so on); sex was defined as male and female (for colorectal cancer only); parish or area of residence was defined as other parishes (Barbuda, St. George, St Mary, St. Paul, St. Peter and St. Phillip) and St. John, according to the country’s internal boundaries; cancer type was defined based on the four cancer types under study; vital status was categorized into alive and died; estimates of disease stage based on an approach discussed by Hennis et al. [20] were categorized into two broad categories of early-stage (clinical stages 1 and 2) and late-stage (clinical stages 3 and 4); histological grade was presented as grade 1 (well differentiated), grade 2 (moderately differentiated), and grade 3 (poorly differentiated) where appropriate; evidence of noncommunicable disease was defined as no and yes; year of diagnosis/presentation was presented as two groups, namely 2017–2019 and 2020–2021; employment status at presentation was presented in two categories, employed and not employed [6]. Drug treatment cost estimates were treated as a categorical variable (based on 5-year age groups) in part 1 of our analysis and a continuous variable in part 2 of the study’s analysis. Costs were reported in 2021 USD. This was calculated following adjustment of country consumer price index (CPI) of 2021 and US dollars (USD) 2021 exchange rate (1 USD = 2.7169 XCD) [9,21,22] as below:
Vd is value in 2021 USD, bp is base year price, Cp21 is consumer price index in 2021, Cpb is consumer price index in base year, CPI in 2021 = 95.27; CPI in based year = 95.27 [23].
2.6. Data Analysis
Analysis was divided into two parts. In part 1, we investigated the observed relationship between chemotherapy drug treatment costs (androgen deprivation drugs for prostate cancer), the dependent variable, and age-standardized treatment rates across 5-year age categories, the independent variable, for each cancer type by using simple linear regression and Pearson’s correlation [24]. This helped us to both quantify and measure the strength and direction of the relationship between chemotherapy drug treatment costs and age-standardized treatment rates [24]. In the second part of the analysis, we used linear regression modelling to examine the relationship between chemotherapy drug treatment costs (androgen deprivation drugs for prostate cancer), dependent variable, and the demographics (age at diagnosis, age in five-year age categories, sex (colorectal cancer), parish (area of residence), year of presentation, vital status), clinical (clinical stage of cancer (disease stage), histological grade and morphological type, and evidence of noncommunicable disease) and socio-economic characteristics of each cancer type under study. We used descriptive statistics to summarize baseline demographic, clinical and socio-economic characteristics of the cancer cases for each cancer type [6]. Continuous variables were summarized using mean, median and range [25]. Categorical variables are presented as frequencies and percentages [25].
To determine the age-standardized treatment rates for cases of cancer that were treated with chemotherapeutic drugs (androgen deprivation drugs for prostate cancer), we added the midyear population for each year in the study period, broken down into sixteen (16) 5-year age groups, to give the 5-year population at risk stratified by 5-year age groups for the entire period 2017–2021. Age-standardized cancer-specific treatment rates based on cases who received chemotherapy drugs (androgen deprivation drugs for prostate cancer) were then calculated and presented. To achieve this, we first used Microsoft Excel to derive estimates of crude treatment rates per 100,000 persons of population, calculated by dividing the number of cancer-specific cases that received drug treatment by the number of persons in the Antigua and Barbuda population at risk and multiplying the results by 100,000 [20] (e.g., for prostate cancer, this was males; colorectal cancer, males and females combined) [26]. Cancer-specific total and stratified age-standardized treatment rates and respective 95% confidence intervals (CIs) were then computed using the direct standardization method [20] and involved use of the Segi World Standard Population [6,27]. Linear regression and correlation expressed by scatter plots were used to examine the relationship between each cancer-specific drug treatment cost and the corresponding age-standardized treatment rates. Pearson’s correlation coefficient and 95% CI were derived, and a regression line was used to define the fitted values of the data.
In the second part of the analysis, cancer-specific linear regression was used to identify the association between each study characteristic and the drug treatment costs (chemotherapy/androgen deprivation drugs costs). p-value ≤ 0.05 was used to identify significant variables in the univariate analysis [25]. Based on exploratory analysis done by way of data visualization [28] and through the use of Tukey’s ladder of powers along with its corresponding graphical representation of the same [29,30] (Supplementary File S1, Supplementary Materials), treatment costs reported in 2021 USD were square rooted to meet normality assumptions for colorectal and prostate cancers only [25,28,31] and resultant model estimates, including 95% confidence intervals (CI) that were back-transformed to original costs by squaring said estimates for reporting purposes [25,31]. Normality assumption was confirmed through data visualizations [28] and the application of Tukey’s ladder of powers, along with its graphical representation [29,30], for the treatment costs of female breast and cervical cancers (Supplementary File S1). Further visual assessment of normality was checked using histogram plots for each cancer type. The mean treatment costs and corresponding 95% confidence interval for each level of independent variables were determined. Cancer-specific variables that showed statistically significant mean drug treatment costs (p ≤ 0.05) were marginally significant but clinically relevant or were found to be clinically relevant based on the literature. Even if found not to be statistically significant, they were considered for inclusion in the respective fully adjusted multivariable linear regression model [32]. These were as follows: (i) Clinical relevance based on the literature: age at presentation, estrogen receptor status, disease stage, family history status known, distant metastases and evidence of a noncommunicable disease at presentation for female breast cancer; age at presentation and disease stage for cervical cancer; age at presentation, radiation therapy status known, had cardiovascular disease at presentation, and evidence of noncommunicable disease other than cancer at presentation for colorectal cancer; age at presentation, year at presentation, family history status known, disease stage, and primary tumor status for prostate cancer [33]. (ii) Statistical significance: histological grade, disease subtypes and HER2 receptor status for female breast cancer; had diabetes at presentation, had hypertension at presentation, and had cardiovascular disease at presentation for cervical cancer; age at presentation, disease stage, tumor dimensions (cm), and number of tracked payments for colorectal cancer; Prostate-Specific Antigen (PSA) level (ng/mL) and distant metastases for prostate cancer. Variables deemed collinear were excluded from further analyses. Using multivariable linear regression modelling, inclusive of stepwise regression, and identifying the best subset of variables, based on either their statistical significance or clinical relevance, the final cancer-specific models depicting the relationship between treatment costs and our selected variables were constructed on the basis of the study’s hypothesis [25]. Model fitting involved entering all selected variables in the model and omitting each variable in turn from the model while noting their resulting p-value from corresponding F-tests [34]. The model with all other variables included, except the ones with the highest p-values obtained from the F-test, was run as before. This process was repeated until the p-value for each remaining variable was assessed. Variables that were omitted through the above process were added to the model in succession if their inclusion contributed to the model’s overall p-value being ≤0.05. The models depicting the best subset of variables with an overall p-value ≤ 0.05 were selected as the final model with treatment costs adjusted for the covariates in the model. Each cancer-specific model was checked for multicollinearity by evaluating the variance inflation factor (VIF) of their independent variables [35]. Given the inherent limitations of our dataset, we considered a VIF of <10 to be acceptable for our models [35,36]. The residuals of each of the final models were assessed for normality and homoscedasticity using the skewness and kurtosis test for normality followed by White’s test [37,38]. Robust standard errors were used to correct for unreliable standard errors for cancer models that showed evidence of heteroscedasticity (p-value < 0.05) or non-constant variance of residuals [37,39]. Aside from correcting unreliable standard errors, the application of robust standard errors allowed us to address issues of possible omitted variable biases resulting from our choice of variables in the final models [39]. Further, we incorporated propensity score matching to check and report on evidence of selection and/or omitted variable biases. To avoid making our models overly complex and appear causal, we refrained from using additional statistical techniques to adjust models for omitted variable biases [40]. All analyses were conducted using Microsoft Excel version 2501 and the STATA 17/SE-Standard Edition (Statistical Corporation, College Station, TX, USA).
2.7. Ethical Considerations
We received ethical approval for this study from the Antigua and Barbuda Institutional Review Board, Ministry of Health (AL-04/052022-ANUIRB), the Institutional Review Board of the Sir Lester Bird Medical Centre and the University of KwaZulu-Natal Biomedical Research Ethics Committee (BREC/00004531/2022) [6]. There was no need for us to contact patients for this study [6,41]. All patient information used was de-identified and anonymized [41].
3. Results
3.1. Descriptive Information
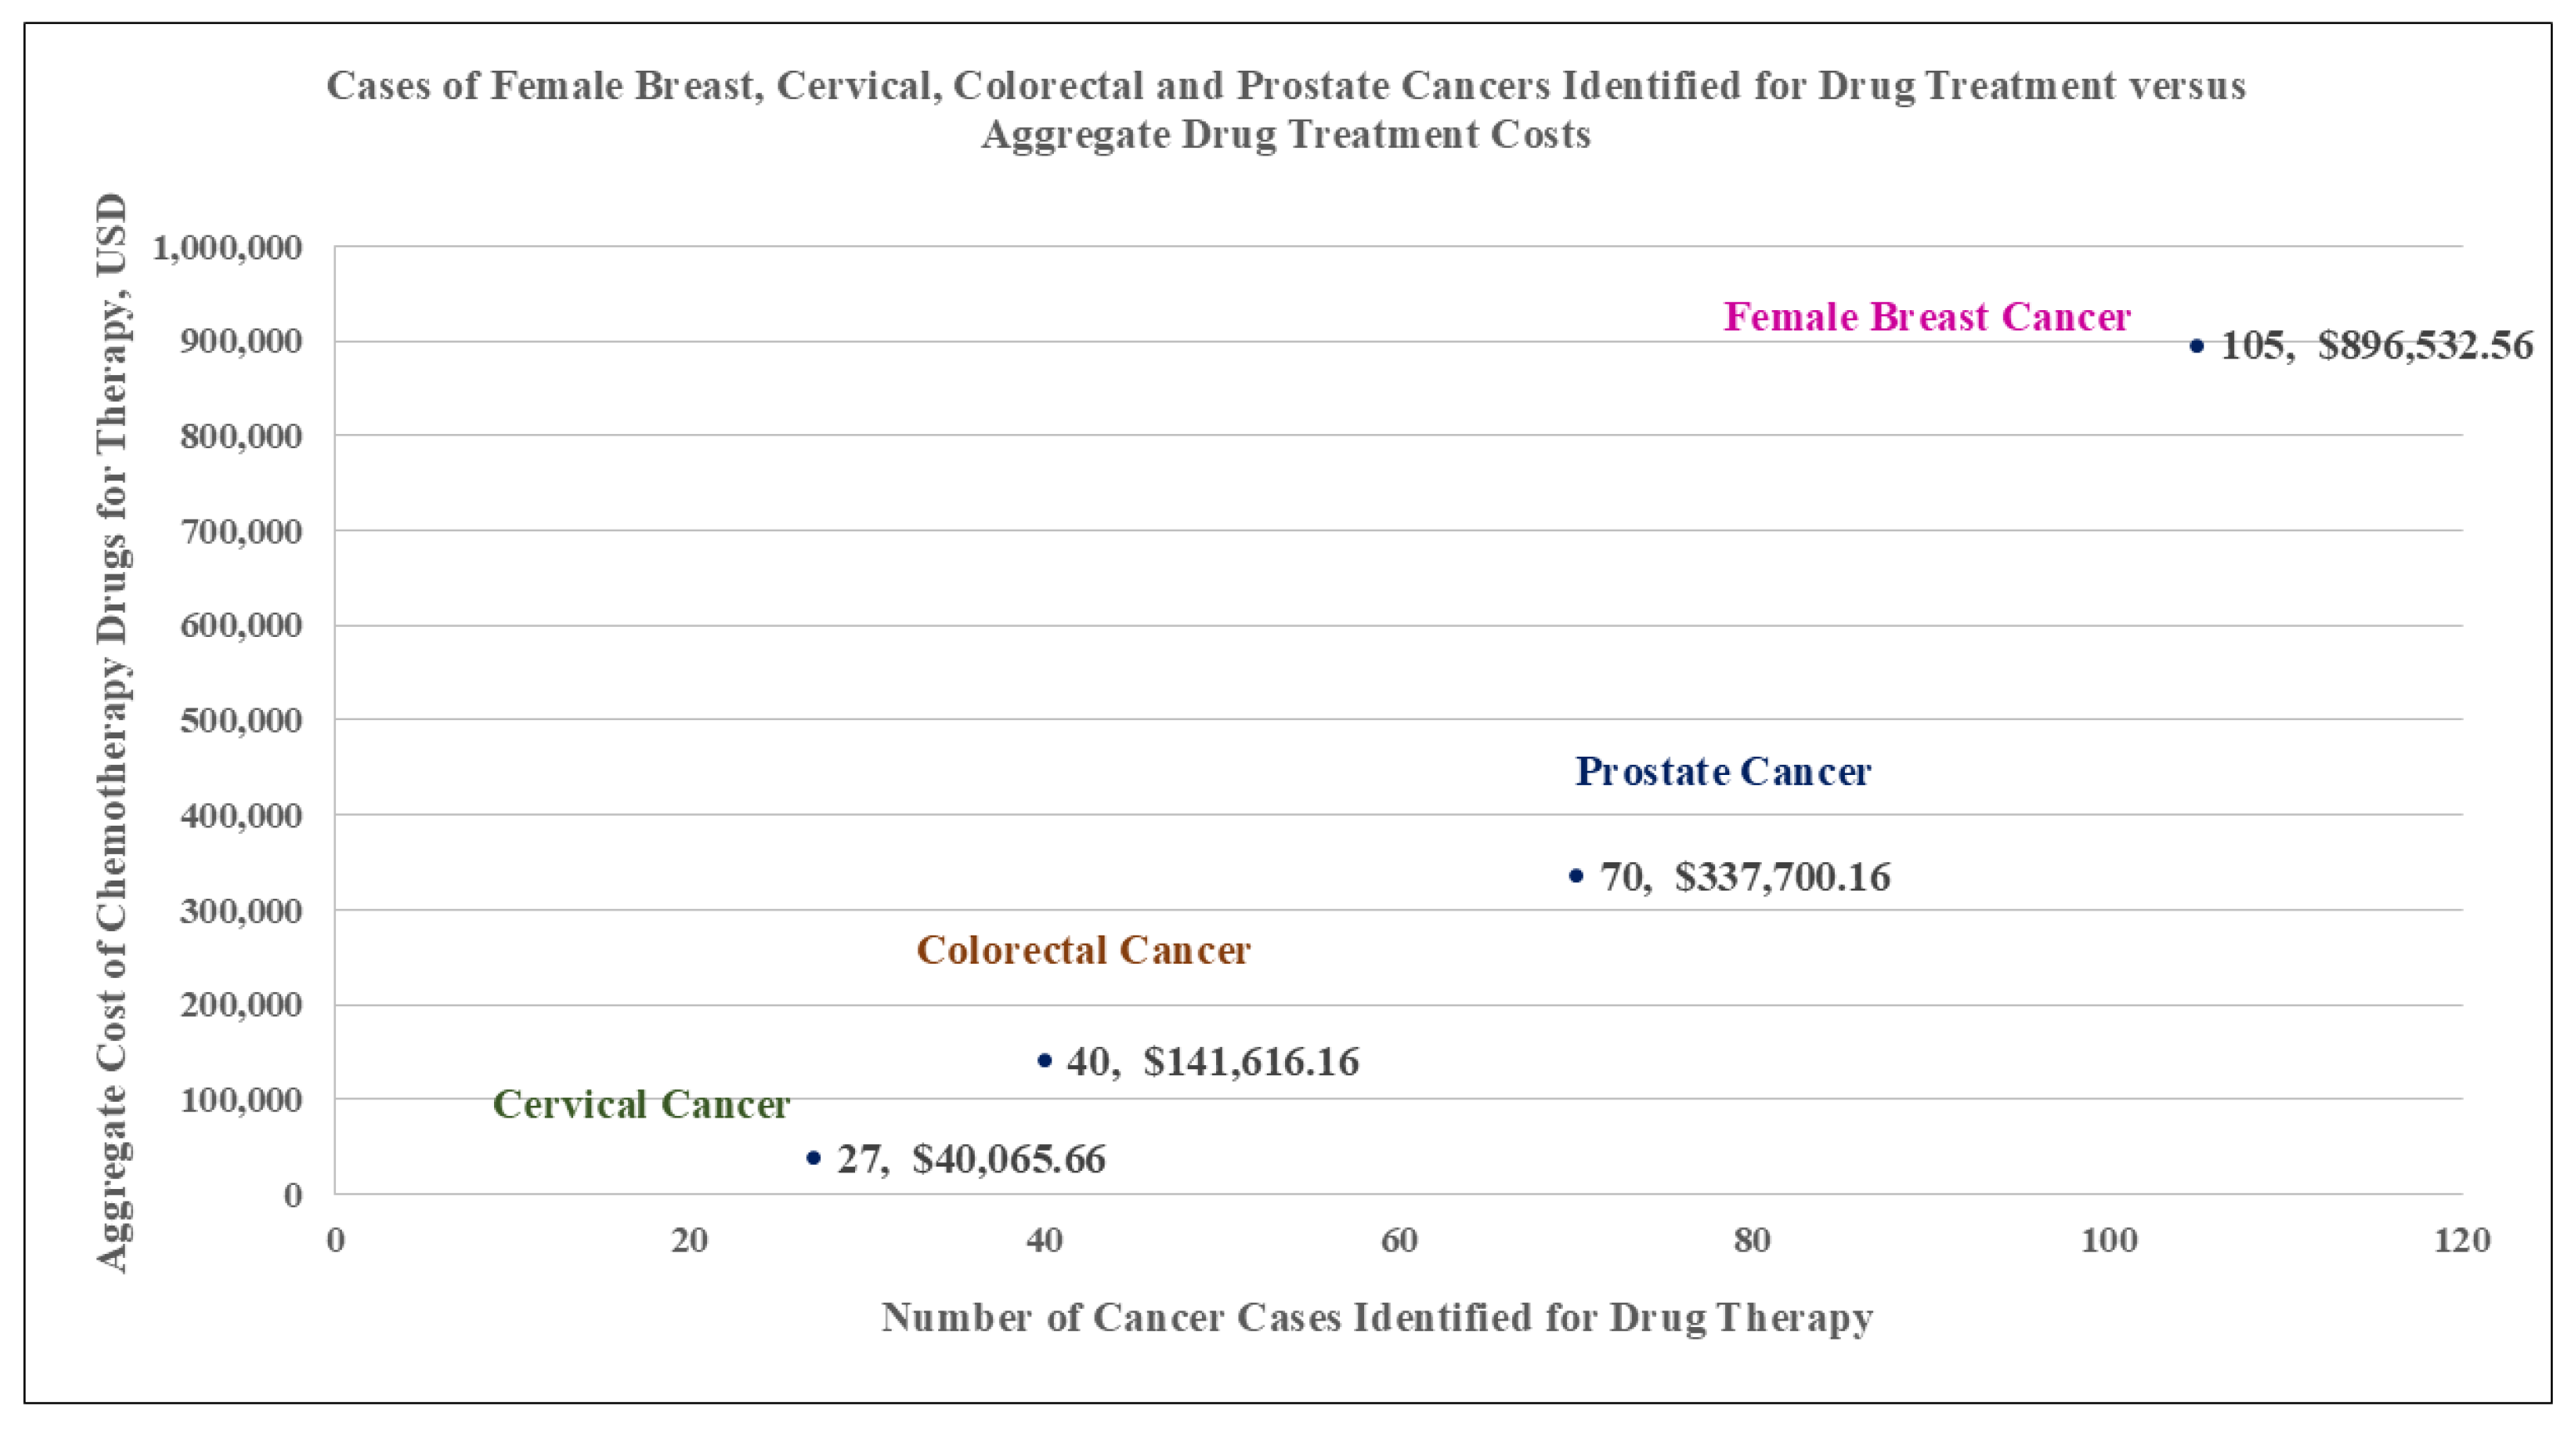
Based on the data obtained from our study sites, a total of 242 cases were considered eligible for this study. Female breast cancer accounted for 43% of cases (n = 105), cervical cancer 11% (n = 27), colorectal cancer 16% (n = 40), and prostate cancer 29% (n = 70) of cases (Table 1). By cancer type, the median age in years at presentation was 57 for female breast cancer, 51 for cervical cancer, and 68 years for both colorectal cancer and prostate cancer.

Table 1.
Baseline characteristics of cases identified for treatment by each cancer type under study (2017–2021).
Cases varied across 5-year age groups with the highest of 21% for female breast cancer cases found between ages 55 and 59 years. For cervical cancer, highs of 19% were seen in age groups 45–49 years and 55–59 years, respectively; among cases of colorectal cancer, highs of 20% were found in age groups 65–69 years and ≥75 years, with the highest of 23% observed in age group 70–74 years; for prostate cancer, the highest of 23% was observed in age group 65–69, with the second highest of 21% observed in age group 70–74 years. Across years in the study period, the period 2017–2019 accounted for 55% and 56% of cases of female breast and cervical cancer, respectively. For colorectal and prostate cancers, the period 2020–2021 accounted for 73% and 59% of cases, respectively. Except for colorectal cancer, where an equal number of cases resided in the parish of St. John and other parishes combined, across the three remaining cancers, St. John accounted for more than 50% of all cases when compared to the other parishes combined (Table 1). Late-stage disease accounted for more than 50% of cancer cases, all cancers except female breast cancer, that saw an almost equal number of cases in both categories of disease stage. Across cancer type, most cases were employed at the time of presentation, except for colorectal cancer, where there was an equal number of cases in both categories of employment status at presentation. Estimated monthly income at presentation was >USD 552 for 79% and 59% of cases of female breast and cervical cancers, respectively. Colorectal and prostate cancers, 60% and 64% of cases, respectively, had estimated monthly incomes at presentation of ≤USD 552. There were variations in the mean total costs for drugs used in chemotherapy (androgen deprivation therapy for prostate cancer). For female breast cancer, this was USD 8566.24 (SD, USD 19,759.81), cervical cancer USD 1075.76 (SD, USD 1979.31), colorectal cancer USD 3549.93 (SD, USD 4787.15) and prostate cancer USD 4824.29 (SD, USD 2797.22).
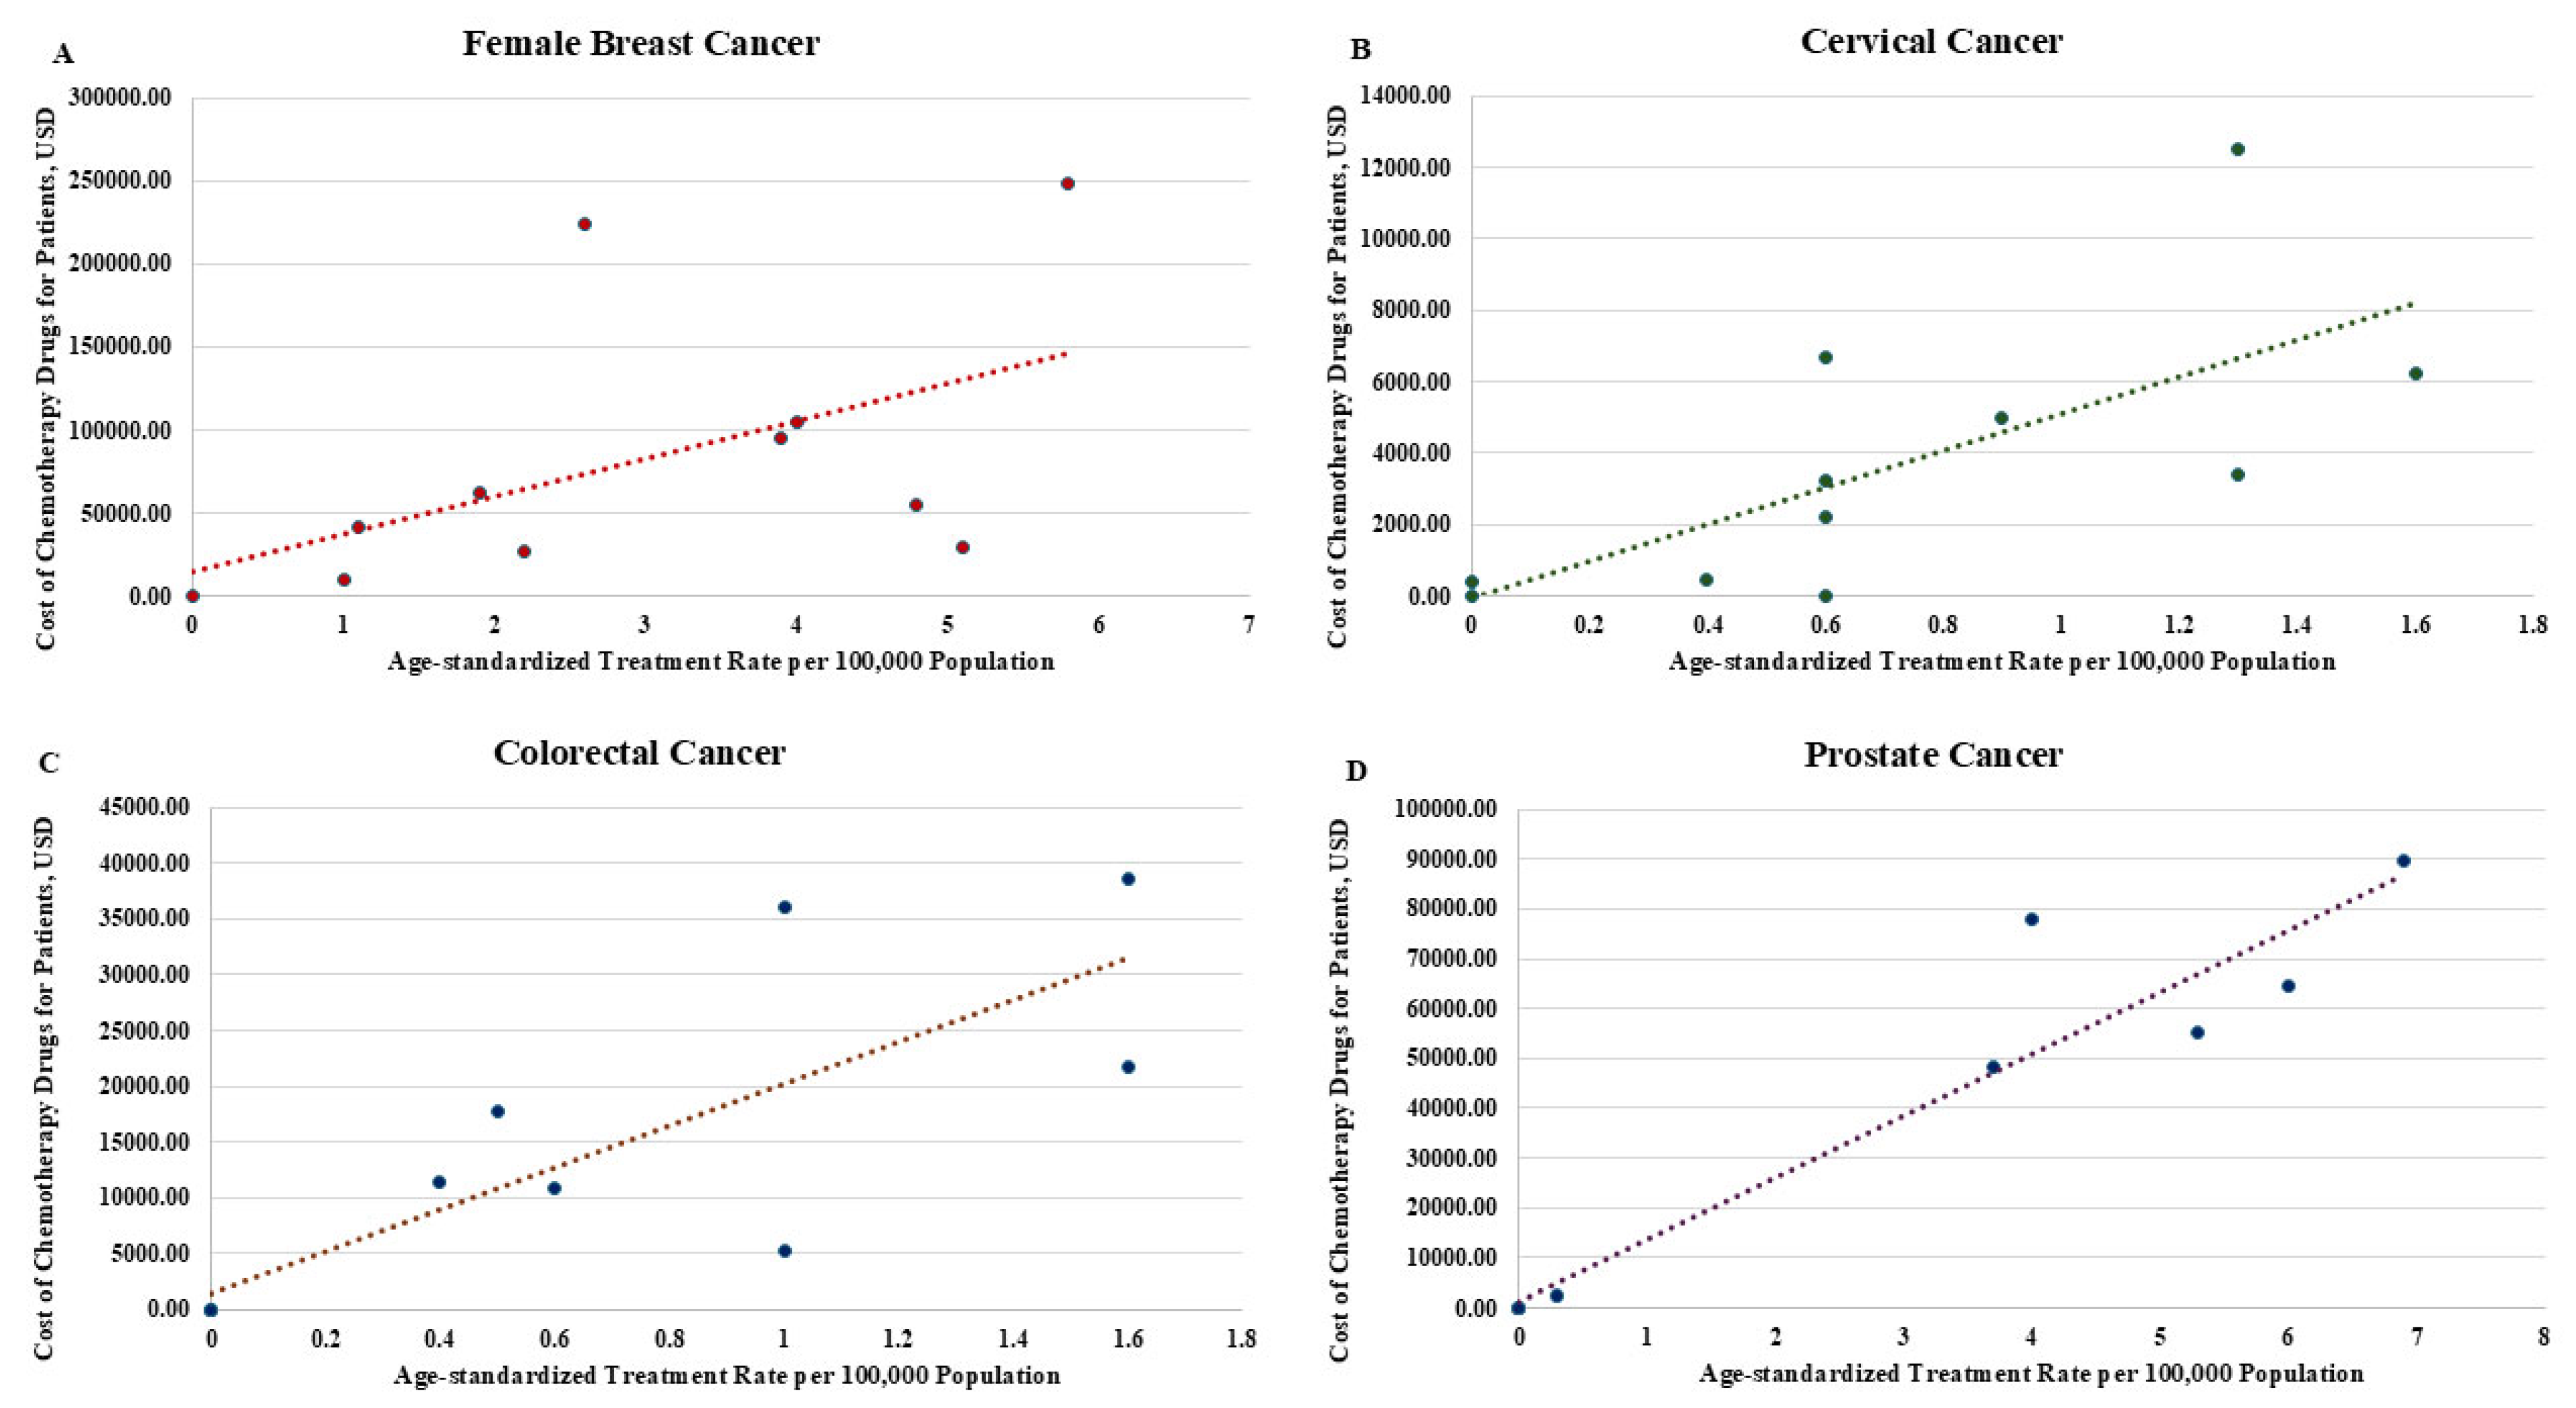
Figure 1 shows the aggregate count of cancer-specific cases treated and corresponding aggregate drug treatment costs (Figure 1). Table 2 shows both drug treatment costs and age-standardized treatment rates for each cancer type across 5-year age categories (Table 2). The results of linear regression and correlation used to assess the relationship between drug treatment costs and age-standardized treatment rates, by cancer type and apportioned across 5-year age categories, suggest that for each cancer type, there was a significant association between treatment costs and age-standardized treatment rates. That is, for female breast cancer, the results showed the mean cost of drug treatment can be expected to increase by USD 25,009.63 (95% CI 9038.46–40,980.81; p = 0.005, Pearson R = 0.67, 95% CI 0.29–0.87) for each unitary increase in age-standardized treatment rate (Figure 2A); for cervical cancer, the mean cost of drug treatment was USD 5121.41 (95% CI 2772.31–7470.51; p < 0.001; Pearson R = 0.78, 95% CI 0.47–0.92) for each unitary increase in age-standardized treatment rates (Figure 2B); for colorectal cancer, the mean cost of drug treatment was USD 13,317.16 (95% CI 6694.51–22,195.04; p < 0.001; Pearson R = 0.89, 95% CI 0.71–0.96) for each unitary increase in age-standardized treatment rates (Figure 2C); for prostate cancer, the mean cost of drug treatment was USD 12,528.10 (95% CI 10,667.81–14,388.40; p < 0.001; Pearson R = 0.97, 95% CI 0.91–0.99) for each unitary increase in age-standardized treatment rate (Figure 2D).
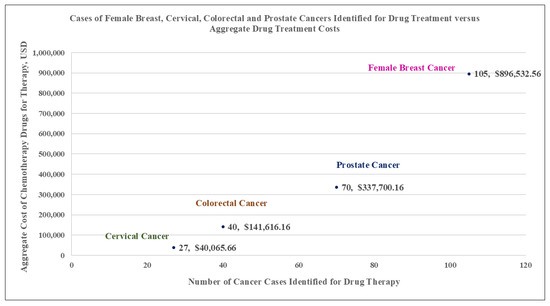
Figure 1.
Graph showing the aggregate number of cancer cases versus the aggregate drug treatment costs per cancer type.
Table 2.
Age-standardized treatment rates (per 100,000 population) and aggregate cost of drug treatment (USD) broken down by age categories for each cancer type.
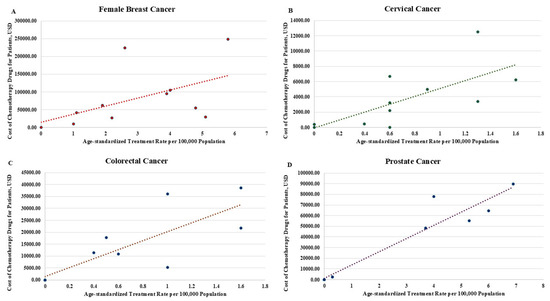
Figure 2.
Scatter plots with fitted values showing the association between drug treatment cost (chemotherapy/androgen deprivation therapy) and age-standardized treatment rates (cases treated per 100,000 population) by cancer type: (A) female breast cancer; (B) cervical cancer; (C) colorectal cancer; and (D) prostate cancer. Dotted lines indicate the fitted values of the regression line.
3.2. Univariate Linear Regression
Univariate linear regression revealed that, for female breast cancer, histological grade (mean cost ranging from low of USD 5452.75 for patients with histological grade not stated to USD 24,034.13 for those diagnosed with grade 3 disease, when compared to grade 1 disease, respectively) and disease subtypes of triple-negative and HER2-enriched breast cancer (mean cost USD 14,838.73, 95% CI 7669.63–22,007.83 when compared to Luminal A/Luminal B subtype), and HER2 receptor-positive breast cancer (mean cost USD 24,188.26, 95% CI 16,739.28–31,637.24 when compared to HER2 receptor-negative breast cancer) were significantly associated with drug treatment costs (Table 3). Estrogen receptor-positive status (mean cost USD 6548.34, 95% CI 2094.05–11,002.63 compared to estrogen receptor-negative status) showed marginal significance, p-value < 0.1. None of the other characteristics showed any significant (p ≤ 0.05) or marginally significant (p < 0.1) relationship with drug treatment costs (Table 3). For cervical cancer, had diabetes at presentation (yes) (mean cost 5225.04, 95% CI 2882.75–7567.34 compared to had diabetes at presentation (no)), had hypertension at presentation (yes) (mean cost USD 3575.78, 95% CI 1822.01–5329.55 compared to had hypertension at presentation (no)), and had cardiovascular disease at presentation (yes) (mean cost USD 4127.28, 95% CI 2131.45–6123.12 compared to had cardiovascular disease at presentation (no)) showed significant association with drug treatment costs. Age at presentation appeared to be marginally associated with drug treatment costs (mean cost USD 3383.94, 95% CI 792.68–5975.20; p-value 0.06) (Table 3). Concerning colorectal cancer, characteristics found to be significantly associated with drug treatment costs were age at presentation (mean cost USD 18,716.98, 95% CI 5294.02–42,791.06), late-stage disease (mean cost USD 3260.41, 95% CI 1635.39–5440.54 when compared to early-stage disease), tumor dimensions (range from mean cost USD 732.24, 95% CI 105.06–1924.58 for dimensions not stated to mean cost USD 3620.43, 95% CI 1369.00–6945.56 for dimensions > 5 cm when compared to tumor dimensions ≤ 5 cm), radiation therapy status known (yes) (mean cost USD 2452.23, 95% CI 1288.81–3986.66 when compared to radiation therapy status known (no)), number of tracked payments for care >10 (mean cost USD 1143.79, 95% CI 340.40–2419.66 compared to number of tracked payments ≤ 10). Additionally, had cardiovascular disease at presentation (yes) (mean cost USD 574.08, 95% CI 12.04–2640.93 compared to had cardiovascular disease at presentation (no)) appeared to be marginally significant to drug treatment costs. None of the other characteristics showed any significant or marginally significant relationship with drug treatment costs. Regarding prostate cancer, variables showing a significant relationship with drug treatment costs were PSA level (range from mean cost USD 3148.33, 95% CI 1957.18–4622.64 for PSA level 10–20ng/mL, to mean cost USD 5070.86, 95% CI 4285.01–5922.84 for PSA level > 20ng/mL, when compared to PSA level < 10ng/mL) and distant metastases (determined) (mean cost USD 5949.04, 95% CI 4604.98–7466.69 compared to distant metastases (undetermined)). A marginally significant relationship was observed for year at presentation (2020/2021) (mean cost USD 3897.50, 95% CI 3151.70–4722.44 compared to year at presentation (2017/2019)); family history status known (yes) (mean cost USD 4113.94, 95% CI 3443.34–4842.77 compared to family history status known (no)); late-stage disease (mean cost USD 4902.80, 95% CI 4036.06–5853.78 compared to early-stage disease); and primary tumor status (determined) (mean cost USD 5201.29, 95% CI 4076.82–6462.55, compared to primary tumor status (undetermined)).
Table 3.
Showing the results of univariate linear regression analysis.
3.3. Multivariable Linear Regression
Multivariable linear regression by cancer type and involving characteristics that were statistically significant, marginally significant or clinically relevant revealed that for female breast cancer, HER2 receptor-positive breast cancer was associated with an increase in mean costs to USD 29,283.06 (95% CI 6299.87–52,266.25) when compared to HER2 receptor-negative breast cancer; histological grade 3 disease was associated with a reduction in mean costs to USD 26,282.45 (95% CI 2701.76–49,863.11) when compared to histological grade 1 disease (Table 4). None of the other variables or categories of variables in the final model were found to be statistically significant, even though, overall, the model with the selected subset of variables was significant (F statistic 5.08, p < 0.001) (Table 4). Assessing for multicollinearity showed that all independent variables in our model had an acceptable VIF < 10. Disease subtypes and estrogen receptor status had VIF > 5 but <6.5, while the remaining independent variables had VIF < 2 (Supplementary File S2). Our assessment of the histogram of residuals and skewness and kurtosis test (p < 0.001) suggests that our model residuals show non-normality. This was further confirmed by the results of White’s test (p = 0.004), which suggest heteroscedasticity in our model. Subjecting our model to robust standard errors suggests that the values of the model coefficients might be less than significant (Table 5). Notwithstanding, the results of propensity score matching point to a reasonably well-balanced model with substantial overlap between groups based on their propensity scores (Supplementary File S3).
Table 4.
Showing the multivariable cost models (results of multivariable linear regression).
Table 5.
Results of the application of robust standard error on the final models.
Significant characteristics in the final model for cervical cancer, had diabetes at presentation (yes) were associated with a reduction in mean costs to USD 4322.97 (95% CI 1724.10–6921.84) when compared to had diabetes at presentation (no); had hypertension at presentation (yes) was associated with a reduction in mean costs to USD 3080.04 (95% CI 350.91–5817.17) compared to had hypertension at presentation (no); had cardiovascular disease at presentation (yes) was associated with a reduction in mean costs to USD 3185.53 (95% CI 144.36–6226.70) when compared to had cardiovascular disease at presentation (no) (Table 4). Age at presentation was not significant in the final model, despite a reduction in mean costs to USD 1535.59 (95% CI −597.34–3668.51) for every one-year increase in age at presentation (Table 4). Evaluating for multicollinearity showed that all independent variables had VIF < 2 (Supplementary File S2). Our assessment of the histogram of residuals and skewness and kurtosis test (p = 0.132) suggests that our model residuals show strong evidence of normality. The results of White’s test (p = 0.008) suggest evidence of heteroscedasticity in our model. Subjecting our model to robust standard errors suggests that there is no general change in the values of the model coefficients (Table 5), even though the results of propensity score matching point to a model that has some evidence of omitted variable biases (Supplementary File S3).
Regarding colorectal cancer, all variables selected for inclusion in the final model showed statistical significance. Age at presentation was significant in the final model with reduced mean costs to USD 13,931.08 (95% CI 2488.01–34,662.99); late-stage disease was significantly associated with an increase in mean cost to USD 16,594.59 (95% CI 3671.15–39,037.86) when compared to early-stage disease; cases with tumor dimensions >5 cm and those with non-stated dimensions were significantly associated with an increase in mean costs to USD 10,455.06 (95% CI 1293.84–28,402.36) and USD 8047.88 (95% CI 414.12–25,303.27), respectively, when compared to cases with tumor dimensions of ≤5 cm; cases with radiation therapy status known (yes) were significantly associated with an increase in mean costs to 20,471.89 (95% CI 5858.37–43,940.54) when compared to cases with radiation therapy status known (no); cases with had cardiovascular disease at presentation (yes) were significantly associated with an increase in mean costs to USD 8460.32 (95% CI 346.70–27,340.62) when compared to cases with had cardiovascular disease at presentation (no); tracked payment >10 were significantly associated with an increase in mean costs to USD 11,006.11 (95% CI 1023.36–31,623.51) when compared to tracked payments ≤10 (Table 4). Overall, the multivariable model with the selected variables appears to fit the available data (F statistic 4.38, p-value = 0.002). Evaluating for multicollinearity showed that all independent variables had VIF < 2 (Supplementary File S2). Our assessment of the histogram of residuals and skewness and kurtosis test (p = 0.147) suggests that our model residuals show strong evidence of normality. The results of White’s test (p = 0.308) suggest evidence of homoscedasticity in our model. Subjecting our model to robust standard errors suggests that there is no general change in the values of the model coefficients (Table 5). The results of propensity score matching point to a model where most variables in the model are balanced, even though obvious differences exist in the variables radiation therapy status known and had cardiovascular disease (Supplementary File S3).
In respect to prostate cancer, of the subset of variables included in the final model, those showing statistical significance were PSA level > 20 ng/mL with reduced mean cost to USD 2735.29 (95% CI 60.37–9377.99) when compared to PSA level not stated, and distant metastases (determined) also with reduced mean costs to USD 2758.35 (95% CI 28.62–9938.10) when compared to distant metastases (undetermined) (Table 4). Characteristics observed to be marginally statistically significant in the multivariable linear model were age at presentation with an increase in mean costs to USD 1709.00 (95% CI 21.34–7621.29) for every one-year increase in age at presentation; late-stage disease with a reduction in mean costs to USD 1817.32 (95% CI 4.45–7631.77) when compared to early-stage disease; PSA level ≤ 20 ng/mL with reduced mean costs to USD 1619.26 (95% CI 6.50–6892.32) when compared to PSA level not stated (Table 4). Year at presentation and family history status known did not show statistical significance or marginal statistical significance in the final model (p-value > 0.05 and p-value > 0.10). Overall, the model with age at presentation, year at presentation, family history status known, disease stage, PSA level (ng/mL) and distant metastases appeared to best represent the available data (F statistic 2.62, p-value = 0.013). Evaluating for multicollinearity showed that all independent variables had VIF < 3 (Supplementary File S2). Our assessment of the histogram of residuals and skewness and kurtosis test (p = 0.008) suggests that our model residuals show some evidence of non-normality. However, the results of White’s test (p = 0.356) suggest evidence of the residuals like homoscedasticity in our model showing that variance of the residuals is constant and our model satisfies the assumption of homoscedasticity. Subjecting our model to robust standard errors suggests that there is no general change in the values of the model coefficients (Table 5). The results of propensity score matching point to a model where most variables in the model are balanced, even though there is evidence of differences in the variable family (Supplementary File S3).
4. Discussion
To our knowledge, this is the first study in Antigua and Barbuda to use available patient data to evaluate the drug treatment costs of four common cancers [19]. It provides valid evidence of the relationship between age-standardized treatment rates and drug treatment costs for female breast, prostate, cervical, and colorectal cancers in Antigua and Barbuda from 2017 to 2021. We found that higher age-standardized treatment rates and corresponding drug treatment costs exist for female breast and prostate cancers when compared to those of cervical and colorectal cancers, respectively, with strong positive correlations suggestive of a strong relationship between cancer treatment rates and associated drug treatment costs. Even though the focus of our study was on drug treatment and cancer cases identified for drug treatment of these four prominent cancers, the results agree with the suggestion of dominance of male prostate cancer and female breast cancer, as reported by Simon et al. [5] and Razzaghi et al. [42], an observation that hints at their dominance in terms of incidence and demand for resources. This study also revealed that many variations exist in terms of the socio-demographics, clinical, pathological or socio-economic characteristics, influencing drug treatment costs by cancer type [43]. The final multivariable linear regression model showed that for female breast cancer, drug treatment costs are associated with the clinical/pathological characteristics of the patient population. We found that having grade 3 (poorly differentiated) disease was significantly associated with drug treatment costs when compared to grade 1 (well differentiated) disease. Additionally, HER2 receptor-positive cancer was also significantly associated with higher drug treatment costs when compared to HER2 receptor-negative breast cancer. Even though the final model showed statistical significance with disease stage, disease subtype and estrogen receptor status, these characteristics were not found to be significant in the model. Surprisingly, age was not a characteristic evident in the final model. This characteristic, though a risk factor for cancer incidence as detailed in previous studies, appears to not be a characteristic that shows a relationship with drug treatment costs among female breast cancer patients, as was evident in univariate linear regression and in the multivariable stepwise regression process containing age based on clinical relevance.
For cervical cancer, only clinical comorbidity characteristics, had diabetes at presentation (yes), had hypertension at presentation (yes) and had cardiovascular disease at presentation (yes) were found to be significantly associated with drug treatment costs. Surprisingly, age at presentation, though included in the final model since it showed marginal significance in univariate linear regression, was not found to be significant in the final model. For colorectal cancer, the characteristics which were significantly associated with drug treatment costs in the final multivariable linear regression model were age at presentation, late-stage disease when compared to early-stage, greatest tumor dimensions > 5 cm and not stated, when compared to tumor dimensions ≤ 5 cm, radiation therapy status known (yes), had cardiovascular disease (yes) and number of tracked payments made to hospital of >10. For the male-specific cancer, prostate cancer, the final multivariable linear regression model showed that age at presentation, PSA level (ng/mL) and distant metastases (determined) were significantly associated with drug treatment costs. The characteristics year at presentation and family history status known (yes), though present in the final model, did not show significance, though, overall, the model comprising the combined six characteristics was significant.
Whilst the available literature examining the factors that impact drug treatment costs on the cancers studied is varied in terms of the characteristics considered, study design, methodologies adopted, and populations involved, some important observations that are reflected in our study’s findings are worth explaining. Cancer stage and age are major determinants of drug treatment received and their associated costs [44]. That is to say, the costs of drugs used in advanced stages of disease could be significant contributors to treatment costs [44], especially if some of the drug agents used are pricey, as is the case with many anticancer drugs developed over the past several years. In the case of drug treatment for colorectal cancer, characteristics such as disease stage could easily be associated with the drug treatment costs based on this simple observation, as alluded to in previous studies [45], with suggestions of increasing costs due to escalating prices in the choice of drug regimen required to treat patients based on the disease stage or on disease progression [46,47,48]. One study identified that, with the advent of many high-priced colorectal cancer drugs over the past several years, there is a need for a review of the value of care since few of the drugs used in treatment are considered cost-effective [48]. In prostate cancer care, the findings of disease stage and distant metastases being characteristics that are significantly associated with drug treatment costs appear consonant with observations made in other studies. For instance, in Araujo et al. [49], it was pointed out that disease stage is a risk factor for increased costs with cancer treatment, while metastases could have financial implications for both patients and healthcare providers due to the required chronicity of therapy, including either chemotherapy or immunotherapy, both of which could last for several months or more [49]. Further, the finding that PSA level and age are significantly associated with drug treatment costs, while being consistent with observations in previous studies, suggests that both disease risk and drug treatment opportunities could be associated with the extent of PSA testing and an aging male population [50]. Furthermore, the noted association of both age and a chronic comorbid condition such as hypertension, diabetes or a cardiovascular disease, with drug treatment costs showing significance, as was evident for cervical and colorectal cancers, concurs with observations in previous studies [51]. Several studies point to the fact that with age comes the risk of at least one meaningful chronic condition, and that multimorbidity in itself could increase treatment complexity by requiring the need for altering the drug treatment routine from the oncologist perspective [52,53]. This could mean that for affected patients, the potential exists for the prolongation of chemotherapy drug treatment, with a corresponding increased risk of hospitalization and/or chemotherapy-induced toxicity and a resultant greater drug treatment cost burden given changes in regimen sequences [51,53]. The association between the number of tracked payments made for care showing significance in the multivariable linear regression model depicting drug treatment costs for colorectal cancer is suggestive of possible increases in hospitalization stays and/or hospital visits on account of ill health by patients receiving drug treatment [51]. This observation is consistent with those of other studies, which highlight the effect of age, the disease process and post-operative drug treatment on the burden of hospitalizations associated with colorectal cancer [51]. Studies have shown that tumor size in colorectal cancer has value in determining the prognosis and mode of clinical management, among other things [54]. This means that, in addition to being associated with poorer outcomes for patients so diagnosed, larger-sized colorectal cancer tumors invariably affect treatment costs given the need for multidrug therapy as part of the drug treatment regimen [54,55]. Moreover, radiation therapy status’s significant association with drug treatment costs in the final colorectal cancer multivariable regression model could be indirectly related to tumor size and its corresponding effect on drug treatment costs, especially for patients with difficult curative surgical control [56], who require adjustments to the choice and sequence of their drug regimen [56], including the use of more advanced cytotoxic drugs based on their demonstration of clinical benefits [48].
Understanding that cancer drugs contribute considerably to the burden of cancer care [57], and that drug treatment remains key to obtaining optimal outcomes such as cure or improvement in quality of life [52], our study showed that differences in drug treatment costs across cancer types varied by several notable characteristics. In this way, and where the named cancers are concerned, it may serve to encourage healthcare stakeholders to ensure that a clear basis exists for the adoption of more cost-effective drug treatment options for patients [19]. This could include a careful review of the available cancer management guidelines for assigning patients to specific treatment regimens for possible impacts on costs [58], particularly in cases where it appears that the care team is solely focused on the acute problems while neglecting the link of any underlying clinical, pathological or chronic comorbidity characteristics to the cost burden of drug treatment or the outcomes of drug treatment [58].
While this study did not report on distinctions in the classes of drugs used in treating the named cancers, it could serve to help in addressing any underlying challenges that prevent the healthcare provider from accessing affordable cancer care drugs [57]. This could include engaging pharmaceutical companies and suppliers on the high prices of drugs that affect both treatment costs and quality of care parameters [57]. Additionally, this study also provides a basis for enhancing the development and dissemination of several health system interventions and policies that consider the interlinks between an aging population, chronic comorbidity, cancer drug therapy and needed resource allocation [51,53].
Aside from the above, future studies exploring other aspects of cancer treatment or disease management, including the costs of surgery, diagnosis, and palliation, either individually or collectively, would be helpful in providing comparative perspectives on the costs of our studied cancers. In addition, with gains made in emerging cancer therapies in recent years, future studies could also look at their effect on treatment costs versus efficacy and survival [59,60].
Moreover, incorporating the following could lead to meaningful reductions in systemic drug treatment costs for our four studied cancers at the national and healthcare provider levels in Antigua and Barbuda: the use of (i) smart procurement practices, which includes having access to negotiated and affordably priced chemotherapy drugs, and strict adherence to the local drug tender process [13]; (ii) minimization of overtreatment of cancer patients by using predictive biomarkers to ensure that patients receive the appropriate drug treatment and/or by detecting early markers of treatment failure [13]; (iii) identifying the correct patient for drug treatment through the use of rigorous selection criteria or an algorithm [13]; (iv) access to essential chemotherapy drugs through the Organization of Eastern Caribbean States Pooled Procurement Service [61]; and (v) access to essential subsidized chemotherapy drugs through the Pan American Health Organization (PAHO) Strategic Fund [62].
In addition to contributing to the existing literature on the treatment burden of four common cancers, a notable strength of our study is the use of cancer data taken from records held at the SLBMC, MBS, and TCCEC. These sites are known to contribute to the largest collection of evidence pointing to the estimated proportion of cases of the four common cancers identified for drug treatment on the island [6]. The results are noteworthy because they indicate a confluence of clinical and/or pathological characteristics in patients with the studied cancer types that seem to contribute to both the choice of drugs and drug regimen used in systemic care [63]. Further, and considering our application of regression diagnostics in our study, we are confident that there is an acceptable level of correlation among the independent variables in our models. This strongly supports the validity of our models and indicates the reasonably high reliability of our estimates. An additional strength is that the data and estimates derived from this study can bridge the gap caused by the absence of a local cancer registry while also emphasizing the need to have one established [5,7].
This study has inherent limitations, which need mentioning. Given this study’s use of correlation and notwithstanding our method of regression analysis and use of some diagnostic statistical techniques, our study did not seek to identify or imply causation. This meant that we could not reasonably make certain generalizations regarding our findings. Because this study used retrospective data with most variables ‘already locked in’, it could have easily been affected by a priori recording or recall bias if the information contained in patient charts/records was not accurately described, interpreted, defined or recorded at the time when certain entries were made [64,65]. Additionally, the use of retrospective data meant that information on several socio-demographic and/or socio-economic characteristics, such as ethnicity, religious beliefs, educational level, body mass index, smoking status, alcohol use, length of hospitalizations, area of employment, and insurance status, that could potentially impact drug treatment parameters based on the literature, were not assessed [66]. Their absence could easily have had the unintended consequences of an underrepresentation of variables in our final multivariable linear regression models [65]. This, along with our choice of selected variables for our respective final models, could have affected our resultant study estimates, notwithstanding our use of robust standard errors to mitigate the effect of selection and omitted variable biases [39]. Further, an absence of data from people who accessed cancer care outside of the named study sites could have had a bearing on the sample sizes for each of the studied cancers. Further studies involving a more expanded study period with a possibly larger number of cases and different study design could address this limitation [67].
Additionally, the inherent small cancer-specific sample sizes in our study may have impacted on our results and/or estimates, particularly when running our regression models. While it is possible that the results could be attributed to chance, the restrictions imposed by our sample sizes may have caused significant variability in our estimates, biased estimates or incomplete models. Despite these challenges, we felt it was important to report our findings not solely based on statistical significance but, more importantly, for their relevance to clinical practice and public health [32]. Therefore, we presented the magnitude of effects or estimates without making definitive comparisons or speaking to the generalizability of our findings [68]. A future study that employs a prospective design and incorporates a larger sample size and considers a larger pool of variables, various assumptions and parameters in the regression models could enhance the robustness of our study findings [32,68]. Such a study could focus on a more homogenous group (e.g., women of African ancestry with cancer in Antigua and Barbuda) and could be expanded to include additional variables that potentially affect the relationship between exposure and outcome. Moreover, integrating cancer-specific country data into a wider study that involves other countries of a similar demographic composition in the Caribbean could achieve a larger sample size, help reduce sample bias, sampling error and increase statistical power [32,68].
5. Conclusions
This study revealed that there is a significant observed relationship between age-standardized treatment rates and drug treatment costs for female breast, cervical, colorectal and prostate cancers in Antigua and Barbuda. Drug treatment costs exhibit a relationship with a confluence of clinical, pathological or chronic comorbidity characteristics depending on which of the four cancers is in focus. In addition to indicating the need for further studies in investigating drug treatment costs in these common cancers, the result of this report implies a need for enhanced policies and greater advocacy in demanding affordable and sustainably priced medicines used directly in treatment practices related to the burden of the named four cancers in Antigua and Barbuda.
Supplementary Materials
The following supporting information can be downloaded at: https://www.mdpi.com/article/10.3390/ijerph22060930/s1, Supplementary File S1: Tables and graphs showing the results of applying Tukey’s ladder of powers to treatment costs data as a way of assessing for normality; Supplementary File S2: Results of the performing variable inflation factor (VIF) to assess final models for multicollinearity: VIF of <10 considered acceptable; Supplementary File S3: Graphs showing the visualizations of propensity scores for each of the four cancer types studied.
Author Contributions
Conceptualization and design, A.A.N.B., T.G.G. and J.N.; methodology, A.A.N.B.; software, A.A.N.B.; validation, A.A.N.B.; formal analysis, A.A.N.B.; investigation, A.A.N.B.; resources, A.A.N.B.; data curation, A.A.N.B.; writing—original draft preparation, A.A.N.B.; writing—reviewing and editing, A.A.N.B., J.N. and T.G.G.; visualization, A.A.N.B.; supervision, J.N. and T.G.G. All authors have read and agreed to the published version of the manuscript.
Funding
This study was funded by the University of KwaZulu-Natal, College of Health Science Scholarship, which covers fees and research operational costs, and nothing else. No grant number was allocated. A portion of the data collection was self-funded.
Institutional Review Board Statement
Approval for this study was granted by the Antigua and Barbuda Institutional Review Board, Ministry of Health (AL-04/052022-ANUIRB; approval date 27 May 2022), the Institutional Review Board of Sir Lester Bird Medical Center (in letter dated 16 August 2022), and the Biomedical Research Ethics Committee of the University of KwaZulu-Natal. The study was conducted in accordance with the Declaration of Helsinki and approved by the Biomedical Research Ethics Committee of the University of KwaZulu- Natal (BREC/00004531/2022; approval date 5 September 2022).
Informed Consent Statement
This study did not involve direct contact with cases, and there was no direct risk to persons enrolled in the study. The Antigua and Barbuda Institutional Review Board, Ministry of Health (AL-04/052022-ANUIRB); the Institutional Review Board of Sir Lester Bird Medical Center; and the University of KwaZulu-Natal Biomedical Research Ethics Committee (BREC/00004531/2022) approved this retrospective study and waived the requirement for written informed consent.
Data Availability Statement
All data generated or analyzed during this study are included in the article. Data are fully available without restrictions, and inquiries can be directed to the corresponding author.
Acknowledgments
We wish to acknowledge that some of the data used, and part of the results examined in this paper, were previously reported in the published article “Incidence, trends and patterns of female breast, cervical, colorectal and prostate cancers in Antigua and Barbuda, 2017–2021: a retrospective study” [6]. The focus of this paper was on investigating the relationship between drug treatment costs, drug treatment rates and patient characteristics of female breast, cervical, colorectal, and prostate cancers in Antigua and Barbuda. We gratefully acknowledge the support of the Ministry of Health, Wellness and the Environment, Antigua and Barbuda, for allowing us to undertake this study. We are also thankful for the assistance rendered by the (i) Pathology, Oncology, Urology and Information Technology departments of the Sir Lester Bird Medical Centre, (ii) Medical Benefits Scheme and (iii) Cancer Centre Eastern Caribbean in granting access to available medical records and files and for providing useful insights into their operations. Special thanks to the persons listed below for their broad support and words of guidance throughout the process of undertaking this work: Albert Duncan, Medical Director, Sir Lester Bird Medical Centre (recently deceased); Adrian Rhudd, Consultant Urologist, Sir Lester Bird Medical Centre; Hanybal Yazigi, Consultant Medical Oncologist, Sir Lester Bird Medical Centre; Michael Ozuomba, Chronic Disease Registrar, Ministry of Health, Antigua and Barbuda; Christine Joseph, Assistant to the Medical Director, Sir Lester Bird Medical Centre.
Conflicts of Interest
The authors declare no conflicts of interest. The funders had no role in the design of the study; in the collection, analyses, or interpretation of data; in the writing of the manuscript; or in the decision to publish the results.
Abbreviations
The following abbreviations are used in this manuscript:
| IARC | International Agency for Research on Cancer |
| SLBMC | Sir Lester Bird Medical Centre |
| TCCEC | The Cancer Centre of the Eastern Caribbean |
| MBS | Medical Benefits Scheme |
| ICD-10 | International Classification of Diseases Tenth Edition |
| AJCC 8Ed | American Joint Committee on Cancer Classification Staging Manual Eight Edition |
| FIGO | International Federation of Gynecology and Obstetrics |
| NCD | Noncommunicable Disease |
| PSA | Prostate-Specific Antigen |
References
- Bray, F.; Laversanne, M.; Sung, H.; Ferlay, J.; Siegel, R.L.; Soerjomataram, I.; Jemal, A. Global cancer statistics 2022: GLOBOCAN estimates of incidence and mortality worldwide for 36 cancers in 185 countries. CA Cancer J. Clin. 2024, 74, 229–263. [Google Scholar] [CrossRef] [PubMed]
- Sung, H.; Ferlay, J.; Siegel, R.L.; Laversanne, M.; Soerjomataram, I.; Jemal, A.; Bray, F. Global Cancer Statistics 2020: GLOBOCAN Estimates of Incidence and Mortality Worldwide for 36 Cancers in 185 Countries. CA Cancer J. Clin. 2021, 71, 209–249. [Google Scholar] [CrossRef] [PubMed]
- Torre, L.A.; Bray, F.; Siegel, R.L.; Ferlay, J.; Lortet-Tieulent, J.; Jemal, A. Global cancer statistics, 2012. CA Cancer J. Clin. 2015, 65, 87–108. [Google Scholar] [CrossRef]
- Bray, F.; Ferlay, J.; Soerjomataram, I.; Siegel, R.L.; Torre, L.A.; Jemal, A. Global cancer statistics 2018: GLOBOCAN estimates of incidence and mortality worldwide for 36 cancers in 185 countries. CA Cancer J. Clin. 2018, 68, 394–424. [Google Scholar] [CrossRef]
- Simon, L.; Gaskin, P.; Daniel, G.; Samuel, J.; Goodwin, S. Antigua/Barbuda Cancer Incidence Study. WIMJ Open 2014, 1, 84–87. [Google Scholar] [CrossRef]
- Bovell, A.A.N.; Ramaliba, T.; Goodwin, S.O.; Phillip, J.C.; Ncayiyana, J.; Ginindza, T.G. Incidence, trends and patterns of female breast, cervical, colorectal and prostate cancers in Antigua and Barbuda, 2017–2021: A retrospective study. BMC Cancer 2025, 25, 72. [Google Scholar] [CrossRef]
- Rhudd, A.R. The current state of prostate cancer in Antigua & Barbuda-2021. Ecancermedicalscience 2021, 15, ed112. [Google Scholar] [CrossRef]
- Bovell, A.A.N.; Ngcamphalala, C.; Abbott, D.; Ncayiyana, J.; Ginindza, T.G. Cost Analysis Related to Diagnosis, Treatment and Management of Cervical Cancer in Antigua and Barbuda: A Prevalence-Based Cost-of-Illness Study. Int. J. Environ. Res. Public Health 2024, 21, 1685. [Google Scholar] [CrossRef]
- Bovell, A.A.N.; Ngcamphalala, C.; Rhudd, A.; Ncayiyana, J.; Ginindza, T.G. The Economic Burden of Prostate Cancer in Antigua and Barbuda: A Prevalence-Based Cost-of-Illness Analysis from the Healthcare Provider Perspective. Int. J. Environ. Res. Public Health 2024, 21, 1527. [Google Scholar] [CrossRef]
- Bovell, A.A.N.; Ncayiyana, J.; Ginindza, T.G. Analysis of the Direct Medical Costs of Colorectal Cancer in Antigua and Barbuda: A Prevalence-Based Cost-of-Illness Study. Int. J. Environ. Res. Public Health 2025, 22, 552. [Google Scholar] [CrossRef]
- Bovell, A.A.N.; Ngcamphalala, C.; Brizan-St. Martin, R.; Ncayiyana, J.; Ginindza, T.G. Cost Analysis of Female Breast Cancer in Antigua and Barbuda: A Prevalence-Based Study. Discipline of Public Health Medicine, School of Nursing and Public Health. University of KwaZulu-Natal: Durban, South Africa, 2025; (manuscript in preparation; to be submitted). [Google Scholar]
- Moye-Holz, D.; Vogler, S. Comparison of Prices and Affordability of Cancer Medicines in 16 Countries in Europe and Latin America. Appl. Health Econ. Health Policy 2022, 20, 67–77. [Google Scholar] [CrossRef] [PubMed]
- Dane, A.; van Leeuwen, R.; Hoedemakers, M.; van der Kuy, H.; Sleijfer, S. Combatting the rising costs of cancer drugs; interventions from a university hospital’s perspective. Front. Pharmacol. 2023, 14, 1264951. [Google Scholar] [CrossRef] [PubMed]
- Caffrey, M. Weighing Drug Costs and Patient Values in Cancer Care. Am. J. Manag. Care 2025, 31, SP268–SP271. [Google Scholar]
- Xiang, X.; Li, Y.; Liang, N.; Wang, B.; Wang, H. Assessing healthcare payment reforms’ effects on economic inequities and catastrophic expenditures among cancer patients in ethnic minority regions of China. BMC Med. 2025, 23, 208. [Google Scholar] [CrossRef]
- Lambert, L.K.; Horrill, T.C.; Beck, S.M.; Bourgeois, A.; Browne, A.J.; Cheng, S.; Howard, A.F.; Kaur, J.; McKenzie, M.; Stajduhar, K.I.; et al. Health and healthcare equity within the Canadian cancer care sector: A rapid scoping review. Int. J. Equity Health 2023, 22, 20. [Google Scholar] [CrossRef]
- Wu, Z.; Xia, F.; Lin, R. Global burden of cancer and associated risk factors in 204 countries and territories, 1980–2021: A systematic analysis for the GBD 2021. J. Hematol. Oncol. 2024, 17, 119. [Google Scholar] [CrossRef]
- Zhao, J.; Xu, L.; Sun, J.; Song, M.; Wang, L.; Yuan, S.; Zhu, Y.; Wan, Z.; Larsson, S.; Tsilidis, K.; et al. Global trends in incidence, death, burden and risk factors of early-onset cancer from 1990 to 2019. BMJ Oncol. 2023, 2, e000049. [Google Scholar] [CrossRef]
- Brandão, M.; Morais, S.; Lopes-Conceição, L.; Fontes, F.; Araújo, N.; Dias, T.; Pereira, D.; Borges, M.; Pereira, S.; Lunet, N. Healthcare use and costs in early breast cancer: A patient-level data analysis according to stage and breast cancer subtype. ESMO Open 2020, 5, e000984. [Google Scholar] [CrossRef]
- Hennis, A.J.; Hambleton, I.R.; Wu, S.-Y.; Leske, M.C.; Nemesure, B. Breast cancer incidence and mortality in a Caribbean population: Comparisons with African-Americans. Int. J. Cancer 2009, 124, 429–433. [Google Scholar] [CrossRef]
- Ngcamphalala, C.; Östensson, E.; Ginindza, T.G. The economic burden of prostate cancer in Eswatini. BMC Health Serv. Res. 2022, 22, 483. [Google Scholar] [CrossRef]
- Akari, S.; Mateti, U.V.; Kunduru, B.R. Health-care cost of diabetes in South India: A cost of illness study. J. Res. Pharm. Pract. 2013, 2, 114–117. [Google Scholar] [CrossRef] [PubMed]
- Statistic Division Ministry of Finance the Economy Public Administration Public Broadcasting and Information. Consumer Price Index. Stat Div Minist Financ Antig Barbuda 2022. Available online: https://statistics.gov.ag/wp-content/uploads/2022/01/Monthly-CPI-December-2021.pdf (accessed on 8 March 2024).
- Chow, R.D.; Bradley, E.H.; Gross, C.P. Comparison of Cancer-Related Spending and Mortality Rates in the US vs 21 High-Income Countries. JAMA Health Forum 2022, 3, e221229. [Google Scholar] [CrossRef] [PubMed]
- Avila, F.R.; Spaulding, A.C.; Rinker, B.D.; Huayllani, M.T.; Boczar, D.; Torres-Guzman, R.A.; Maita, K.C.; Ho, O.A.; Forte, A.J. Demographic Characteristics Influence Treatment Costs of Invasive Melanoma in Florida. Ann. Plast. Surg. 2023, 90, 248–254. [Google Scholar] [CrossRef] [PubMed]
- Hennis, A.J.M.; Hambleton, I.R.; Wu, S.-Y.; Skeete, D.H.-A.; Nemesure, B.; Leske, M.C. Prostate Cancer Incidence and Mortality in Barbados, West Indies. Prostate Cancer 2011, 2011, 565230. [Google Scholar] [CrossRef]
- The International Agency for Research on Cancer. Cancer Incidence in Five Continents Volume XI Chapter 7: Age Standardization. Available online: https://www.google.com/url?sa=t&source=web&rct=j&opi=89978449&url=https://publications.iarc.fr/_publications/media/download/3753/609d0d7711047dd76d7f3dbaa25d7f041fcd013e.pdf&ved=2ahUKEwifvMazquuNAxUG1QIHHXsEKtgQFnoECBcQAQ&usg=AOvVaw3TDNCcXIKXlL2M0ZZ-vTqk (accessed on 23 May 2025).
- Ghasemi, A.; Zahediasl, S. Normality tests for statistical analysis: A guide for non-statisticians. Int. J. Endocrinol. Metab. 2012, 10, 486–489. [Google Scholar] [CrossRef]
- Tukey, J.W. Exploratory Data Analysis; Reading, Mass. Addison-Wesley Pub. Co.: New York, NY, USA, 1977; ISBN 0201076160. [Google Scholar]
- StataCorp. Ladder of powers. In Stata Reference Manual; Stata Press: College Station, TX, USA, 2025. [Google Scholar]
- Kirkwood, B.R.; Sterne, J.A. Transformations. In Essential Medical Statistics, 2nd ed.; Blackwell Publishing Ltd.: Malden, MA, USA, 2003; pp. 118–128. ISBN 9780865428713. [Google Scholar]
- Sharma, H. Statistical significance or clinical significance? A researcher’s dilemma for appropriate interpretation of research results. Saudi J. Anaesth. 2021, 15, 431. [Google Scholar] [CrossRef]
- Webber, C.; Jiang, L.; Grunfeld, E.; Groome, P.A. Identifying predictors of delayed diagnoses in symptomatic breast cancer: A scoping review. Eur. J. Cancer Care 2017, 26, e12483. [Google Scholar] [CrossRef]
- Kirkwood, B.R.; Sterne, J.A.C. Regression modelling. In Essential Medical Statistics, 2nd ed.; Blackwell Publishing Ltd.: Malden, MA, USA, 2003; pp. 315–342. ISBN 9780865428713. [Google Scholar]
- Shrestha, N. Detecting Multicollinearity in Regression Analysis. Am. J. Appl. Math. Stat. 2020, 8, 39–42. [Google Scholar] [CrossRef]
- Miles, J. Tolerance and Variance Inflation Factor. In Encyclopedia of Statistics in Behavioral Science; Wiley: New York, NY, USA, 2005. [Google Scholar]
- Su, H.; Berenson, M.L. Comparing Tests of Homoscedasticity in Simple Linear Regression. JSM Math. Stat. 2017, 4, 1017. [Google Scholar]
- StataCorp. Skewness and kurtosis tests for normality. In Stata Reference Manual; Stata Press: College Station, TX, USA, 2025. [Google Scholar]
- Mansournia, M.A.; Nazemipour, M.; Naimi, A.I.; Collins, G.S.; Campbell, M.J. Reflection on modern methods: Demystifying robust standard errors for epidemiologists. Int. J. Epidemiol. 2021, 50, 346–351. [Google Scholar] [CrossRef]
- Cinelli, C.; Hazlett, C. Making Sense of Sensitivity: Extending Omitted Variable Bias. J. R. Stat. Soc. Ser. B Stat. Methodol. 2020, 82, 39–67. [Google Scholar] [CrossRef]
- Ekdahl Hjelm, T.; Matovu, A.; Mugisha, N.; Löfgren, J. Breast cancer care in Uganda: A multicenter study on the frequency of breast cancer surgery in relation to the incidence of breast cancer. PLoS ONE 2019, 14, e0219601. [Google Scholar] [CrossRef] [PubMed]
- Razzaghi, H.; Quesnel-Crooks, S.; Sherman, R.; Joseph, R.; Kohler, B.; Andall-Brereton, G.; Ivey, M.A.; Edwards, B.K.; Mery, L.; Gawryszewski, V.; et al. Leading Causes of Cancer Mortality—Caribbean Region, 2003–2013. MMWR Morb. Mortal. Wkly. Rep. 2016, 65, 1395–1400. [Google Scholar] [CrossRef] [PubMed]
- Hansen, R.P.; Vedsted, P.; Sokolowski, I.; Søndergaard, J.; Olesen, F. Time intervals from first symptom to treatment of cancer: A cohort study of 2,212 newly diagnosed cancer patients. BMC Health Serv. Res. 2011, 11, 284. [Google Scholar] [CrossRef]
- Caglar Bilgin, B.; Kahramanca, S.; Akin, T.; Emre Gokce, I.; Akin, M.; Kucukpinar, T. Factors influencing cost, length of hospital stay and mortality in colorectal cancer. J. BUON Off. J. Balk. Union Oncol. 2015, 20, 1023–1029. [Google Scholar]
- Tramontano, A.C.; Chen, Y.; Watson, T.R.; Eckel, A.; Hur, C.; Kong, C.Y. Racial/ethnic disparities in colorectal cancer treatment utilization and phase-specific costs, 2000-2014. PLoS ONE 2020, 15, e0231599. [Google Scholar] [CrossRef]
- Corral, J.; Castells, X.; Molins, E.; Chiarello, P.; Borras, J.M.; Cots, F. Long-term costs of colorectal cancer treatment in Spain. BMC Health Serv. Res. 2016, 16, 56. [Google Scholar] [CrossRef]
- Corral, M.J.; Clopès, A.; Navarro, M.; Germà, J.R.; Borràs, J.M. Impact on budget of new drugs for colorectal cancer treatment. Med. Clin. 2007, 129, 134–136. [Google Scholar] [CrossRef]
- Schrag, D. The price tag on progress—Chemotherapy for colorectal cancer. N. Engl. J. Med. 2004, 351, 317–319. [Google Scholar] [CrossRef]
- Araújo, J.K.L.; Silva, L.M.D.; Santos, C.A.; Oliveira, I.D.S.; Fialho, G.M.; Giglio, A.D. Assessment of costs related to cancer treatment. Rev. Assoc. Med. Bras. 2020, 66, 1423–1430. [Google Scholar] [CrossRef]
- Zi, H.; He, S.-H.; Leng, X.-Y.; Xu, X.-F.; Huang, Q.; Weng, H.; Zhu, C.; Li, L.-Y.; Gu, J.-M.; Li, X.-H.; et al. Global, regional, and national burden of kidney, bladder, and prostate cancers and their attributable risk factors, 1990–2019. Mil. Med. Res. 2021, 8, 60. [Google Scholar] [CrossRef] [PubMed]
- Plasencia, G.; Gray, S.C.; Hall, I.J.; Smith, J.L. Multimorbidity clusters in adults 50 years or older with and without a history of cancer: National Health Interview Survey, 2018. BMC Geriatr. 2024, 24, 50. [Google Scholar] [CrossRef] [PubMed]
- Culp, M.B.; Soerjomataram, I.; Efstathiou, J.A.; Bray, F.; Jemal, A. Recent Global Patterns in Prostate Cancer Incidence and Mortality Rates. Eur. Urol. 2020, 77, 38–52. [Google Scholar] [CrossRef]
- Ritchie, C.S.; Kvale, E.; Fisch, M.J. Multimorbidity: An issue of growing importance for oncologists. J. Oncol. Pract. 2011, 7, 371–374. [Google Scholar] [CrossRef]
- Zhang, Q.; Li, B.; Zhang, S.; Huang, Q.; Zhang, M.; Liu, G. Prognostic impact of tumor size on patients with metastatic colorectal cancer: A large SEER-based retrospective cohort study. Updates Surg. 2023, 75, 1135–1147. [Google Scholar] [CrossRef]
- Karaca-Mandic, P.; McCullough, J.S.; Siddiqui, M.A.; Van Houten, H.; Shah, N.D. Impact of new drugs and biologics on colorectal cancer treatment and costs. J. Oncol. Pract. 2011, 7, e30s–e37s. [Google Scholar] [CrossRef]
- Xie, Y.-H.; Chen, Y.-X.; Fang, J.-Y. Comprehensive review of targeted therapy for colorectal cancer. Signal Transduct. Target. Ther. 2020, 5, 22. [Google Scholar] [CrossRef]
- Kerr, D.J.; Jani, A.; Gray, S.M. Strategies for Sustainable Cancer Care. Am. Soc. Clin. Oncol. Educ. Book 2016, 35, e11–e15. [Google Scholar] [CrossRef]
- Cherny, N.I.; Sullivan, R.; Dafni, U.; Kerst, J.M.; Sobrero, A.; Zielinski, C.; de Vries, E.G.E.; Piccart, M.J. A standardised, generic, validated approach to stratify the magnitude of clinical benefit that can be anticipated from anti-cancer therapies: The European Society for Medical Oncology Magnitude of Clinical Benefit Scale (ESMO-MCBS). Ann. Oncol. Off. J. Eur. Soc. Med. Oncol. 2015, 26, 1547–1573. [Google Scholar] [CrossRef]
- Choi, H.Y.; Chang, J.-E. Targeted Therapy for Cancers: From Ongoing Clinical Trials to FDA-Approved Drugs. Int. J. Mol. Sci. 2023, 24, 13618. [Google Scholar] [CrossRef]
- Kyle, M.A.; Dusetzina, S.B.; Keating, N.L. Evaluation of Trends in Oncology Drug Spending in Medicare, 2016 to 2020. JAMA Netw. Open 2022, 5, e2221468. [Google Scholar] [CrossRef] [PubMed]
- OECS. OECS Pharmaceutical Procurement Service (PPS) Grows from Strength to Strength. Organ East Caribb States 2017. Available online: https://pressroom.oecs.int/oecs-pharmaceutical-procurement-service-grows-from-strength-to-strength (accessed on 23 May 2025).
- PAHO. PAHO Calls on Latin American and Caribbean Countries to Improve Access to Essential Cancer Medicines and Supplies. Pan Am Heal Organ 2025. Available online: https://www.paho.org/en/news/3-2-2025-paho-calls-latin-american-and-caribbean-countries-improve-access-essential-cancer (accessed on 23 May 2025).
- Li, C.I.; Malone, K.E.; Daling, J.R. Differences in Breast Cancer Stage, Treatment, and Survival by Race and Ethnicity. Arch. Intern. Med. 2003, 163, 49. [Google Scholar] [CrossRef] [PubMed]
- Hansen, R.P.; Olesen, F.; Sørensen, H.T.; Sokolowski, I.; Søndergaard, J. Socioeconomic patient characteristics predict delay in cancer diagnosis: A Danish cohort study. BMC Health Serv. Res. 2008, 8, 49. [Google Scholar] [CrossRef] [PubMed]
- Koo, M.M.; von Wagner, C.; Abel, G.A.; McPhail, S.; Rubin, G.P.; Lyratzopoulos, G. Typical and atypical presenting symptoms of breast cancer and their associations with diagnostic intervals: Evidence from a national audit of cancer diagnosis. Cancer Epidemiol. 2017, 48, 140–146. [Google Scholar] [CrossRef]
- Miller-Kleinhenz, J.M.; Collin, L.J.; Seidel, R.; Reddy, A.; Nash, R.; Switchenko, J.M.; McCullough, L.E. Racial Disparities in Diagnostic Delay Among Women With Breast Cancer. J. Am. Coll. Radiol. 2021, 18, 1384–1393. [Google Scholar] [CrossRef]
- Behnamfar, F.; Azadehrah, M. Factors associated with delayed diagnosis of cervical cancer in Iran—A survey in Isfahan City. Asian Pac. J. Cancer Prev. 2015, 16, 635–639. [Google Scholar] [CrossRef]
- WorldCat. Field Trials of Health Interventions in Developing Countries a Toolbox, 2nd ed.; Smith, P.G., Morrow, R.H., Eds.; Macmillan: London, UK, 1996; pp. 42–71. [Google Scholar]
Disclaimer/Publisher’s Note: The statements, opinions and data contained in all publications are solely those of the individual author(s) and contributor(s) and not of MDPI and/or the editor(s). MDPI and/or the editor(s) disclaim responsibility for any injury to people or property resulting from any ideas, methods, instructions or products referred to in the content. |
© 2025 by the authors. Licensee MDPI, Basel, Switzerland. This article is an open access article distributed under the terms and conditions of the Creative Commons Attribution (CC BY) license (https://creativecommons.org/licenses/by/4.0/).