Abstract
The health risk of schoolchildren who were exposed to airborne fine and ultrafine particles (PM0.1) during the COVID-19 pandemic in the Jambi City (a medium-sized city in Sumatra Island), Indonesia was examined. A questionnaire survey was used to collect information on schoolchildren from selected schools and involved information on personal profiles; living conditions; daily activities and health status. Size-segregated ambient particulate matter (PM) in school environments was collected over a period of 24 h on weekdays and the weekend. The personal exposure of PM of eight selected schoolchildren from five schools was evaluated for a 12-h period during the daytime using a personal air sampler for PM0.1 particles. The schoolchildren spent their time mostly indoors (~88%), while the remaining ~12% was spent in traveling and outdoor activities. The average exposure level was 1.5~7.6 times higher than the outdoor level and it was particularly high for the PM0.1 fraction (4.8~7.6 times). Cooking was shown to be a key parameter that explains such a large increase in the exposure level. The PM0.1 had the largest total respiratory deposition doses (RDDs), particularly during light exercise. The high level of PM0.1 exposure by indoor sources potentially associated with health risks was shown to be important.
1. Introduction
In modern society, air pollution is one the most challenging problems since it can cause severe problems not only for the environment but also for human health. This is particularly true for fine particulate matter (PM2.5), which are particles with an aerodynamic diameter of less than 2.5 µm [1,2]. Previous epidemiological and toxicological studies on PM2.5 have reported a wide range of adverse health effects related to the cardiovascular and respiratory systems, even causing premature mortality [3,4]. Since it is well established that PM2.5 is one of the leading environmental risk factors in the global burden of disease [5] and that the smaller the particle the more harmful its effect to human health, the focus of scientific research in recent years has also begun to shift to tiny particles such as submicron (<1 µm) and ultrafine particles (<0.1 µm or UFPs) sizes [6].
UFPs, also referred to as airborne nanoparticles or PM0.1, are generated from engineering and combustion processes largely from vehicles, biomass burning, etc. Previous studies confirm that PM0.1 is very harmful not only due to its size but also due to its unique physicochemical characteristics [7,8,9,10,11,12,13,14]. PM0.1 can penetrate deeply into the alveolar region, then reach the bloodstream before finally being translocated to sensitive areas of the human body. These particles can also cause oxidative stress, chronic/acute inflammatory disorders or cancer, even at low concentrations [14,15,16], particularly in children [17,18]. Since children’s respiratory and immune systems are still developing, and their respiratory rate is higher than adults, this leads to a higher possible exposure to UFPs [19,20,21]. Due to the short and size-dependent lifetime of UFPs, the distribution of these particles in the atmosphere is extremely nonhomogeneous. Some studies have reported that, the higher the altitude, the higher the number concentration, which makes estimating the concentration levels rather difficult particularly for estimating health effects on humans [11,22]. Furthermore, personal exposure in the breathing zone (PBZ ~30 cm hemisphere around the mouth and nose) allows PM0.1 exposure to be better and more accurately evaluated with respect to actual particle concentration levels and in every microenvironment to which people are exposed. Hence, monitoring and characterizing data on UFPs have become critical, particularly in the case of personal exposure for preparation to achieving “a new normal” of post-COVID-19.
Previous investigations on children’s daily personal exposure to UFPs before the COVID-19 pandemic have been intensively conducted in European and Australian cities/countries [23,24,25,26], while it has also been studied in Bhutan [27], Ghana [28] and China [29]. These studies have identified the home microenvironment to be the most significant contributor to children’s daily exposure to UFPs, with many factors related, but it is mainly due to cooking activities [23,24,27,28,29]. In Southeast Asia (SEA) cities/countries, just one pilot study currently has been conducted [30], but it has still not given sufficient information about daily exposure to UFPs, whereas the ambient PM0.1 levels in most SEA countries were found to be much worse than in Western countries [31], confirming the necessity to extend investigations in the form of personal exposure. In addition, information concerning exposure to UFPs based on the critical sources and exposure status during pandemic conditions are needed; in Indonesia, schoolchildren were allowed back to school at the end of 2021 after spending almost one year online.
Although many previous studies have emphasized the exposure to UFPs in terms of number and surface area [10,11], information on the actual mass of UFPs or PM0.1 remains limited due to the limitation of air sampling tools for PM0.1. On the other hand, the mass concentration is essential for comprehensively understanding the characteristics of UFPs linked not only to doses and mass, but also chemical components. Studies on mass base exposure to size-segregated particles down to the PM0.25 level have largely been conducted on elderly people in the indoor home [32], mail carriers while delivering mail outdoors [33], and the indoors and outdoors of residential homes [34]. However, personal exposure to size-segregated particles down to the PM0.1 level is still scarce, particularly regarding schoolchildren during the COVID-19 pandemic.
Within this context, the objective of this study was to evaluate the exposure to size-segregated particles down to PM0.1 by targeting junior high school students who live in different urban settings (urban and suburban) in the medium-sized city of Jambi, Indonesia. Their health risks are also discussed through their respiratory deposition doses based on personal PM exposure data. A questionnaire survey was used to collect information on schoolchildren from selected schools and included collecting information such as personal profiles, living conditions, daily activities and health status. Size-segregated ambient particles at selected locations in school environments (five schools) were collected for a 24-h period, while the personal exposure of PM to 40 selected schoolchildren from those schools was evaluated during the daytime using a personal air sampler capable of collecting PM0.1 particles.
2. Materials and Methods
2.1. Site Locations and Characteristics
Five public schools in Jambi City, located in Sumatra Island, Indonesia, were selected as target sites for the present study (Figure 1). Jambi City is the capital city of Jambi Province, with a total population of 606,200 people in an area of 205.4 km2 [35]. As shown by the authors [36], the air pollution in the urban area of Jambi City is strongly affected by road vehicles. In addition, from July to October, peatland fires become a key factor concerning air pollution since Jambi City is surrounded by large peatland areas [37]. It also has a significant impact on cross-border pollution in other countries, including Singapore, Malaysia, Southern Thailand, Brunei and the Philippines [38,39,40]. This, however, drastically dropped during the COVID-19 pandemic in the past two years [41].
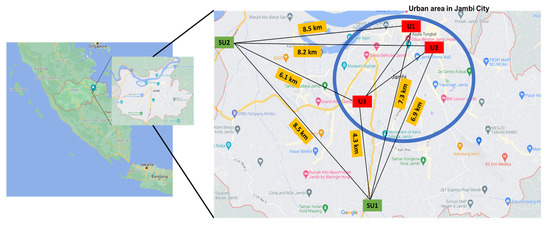
Figure 1.
Study sites and selected schools (U1, U2, U3, SU1, and SU2) in Jambi city, Indonesia.
In Jambi City, there were 26,998 schoolchildren aged 12 to 15, who were educated in 73 junior high schools, which included 26 public and 47 private institutions [42]. Thus, five public schools located on prominent roadsides (RS) with a larger student population than private schools were chosen; three in the urban area (U1, U2 and U3) and two in the suburban area (SU1 and SU2) (Figure 1). Medium-sized cities in Indonesia are generally inter-connected with other cities so that there is a large difference in traffic characteristics between urban areas (the central part of a city) and suburban areas (the outer areas of the city). This may cause a large difference in micro-environments from the PM pollution point of view. Since contributions of each micro-environment experienced by participants to personal exposure is a key issue of this study, different school environments were selected based on different categories, i.e., a central city area, an urban area and a suburban area.
2.2. Questionnaire for Schoolchildren’s Characteristics and Behaviors
A questionnaire survey was conducted to collect information on schoolchildren from the selected schools and included personal information and daily activities via Google Forms (https://forms.gle/DK31RnwKfLcmposV7, accessed on 23 March 2022). Living conditions, daily activities and health status were then analyzed. The questionnaire was administered to a total of 719 children (U1: 12.2%, U2: 21.7%, U3: 33.1%, SU1: 21.7%, and SU2: 11.3%) aged 12–15 years, consisting of 276 males (38.4%) and 443 females (61.6%), where the female ratio was slightly larger than that of schoolchildren overall (~50%). Health outcomes other than respiratory symptoms, e.g., via spirometry tests, were not evaluated in the present study in order to have minimum contact with participants and others under the COVID-19 pandemic conditions.
2.3. Air Sampling in School Environments
Size-segregated ambient PM at selected locations in school environments were collected for 24 h. At two locations, namely, the school gate (SG) and schoolyard (SY), the sampling was conducted simultaneously and repeated three times on weekdays and once on the weekend. In urban school 1 (U1), sampling was conducted two times on weekdays and once on the weekend. Information on the protocol is summarized in Table 1.

Table 1.
Description of selected schools and ambient sampling sites in school environments.
A cascade impactor that was devised using inertial filter technology [43] was used for the air sampling. The air sampler is herein referred as “Ambient Nano-Sampler (ANS)” (Figure 2a). The ANS consists of four impactor stages (PM>10, PM10–2.5, PM2.5–1.0, PM1.0–0.5), an inertial filter (IF) stage (PM0.5–0.1) and a backup filter (PM<0.1) located downstream of the inertial filter stage [44]. It was operated at an airflow rate of 40 L min−1. Two sets of ANS were simultaneously run for 24 h at the SG and SY. Quartz fibrous filters (QFF) (2500 QAT-UP, Pall Corp., New York, USA) with a diameter of 55 mm were used in all impactor and backup filter stages after a pre-treatment procedure described below. The IF stage consisted of a cartridge with a circular nozzle of Ø 5.25 mm containing webbed stainless-steel fibers (fiber diameter, df = 9.8 μm, Nippon Seisen Co. Ltd., Osaka, Japan, felt type, SUS-316) of designed total weight that was packed uniformly.
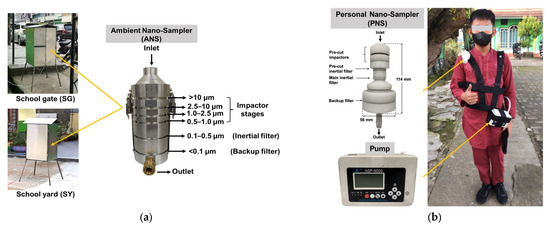
Figure 2.
(a) Ambient Nano-Sampler (ANS) and (b) Personal Nano-Sampler (PNS) and description of use in field samplings.
2.4. Evaluation of Personal Exposure
The personal exposure of schoolchildren to PM was evaluated using a personal air sampler capable of collecting PM0.1 particles. The personal exposure near the breathing zone of each participant was evaluated for 12 h during the daytime. The measurements were designed to start at 7:30 in the morning before the participants traveled to each school and were continued until 7:30 p.m. Eight participants were selected from each school (total 8 × 5 = 40 participants). The participants also answered survey questions while providing written informed consent. They were requested to behave normally and to fill out the time activity diary (TAD) for each 15-min time slot (e.g., 07:00–07:15, 07:15–07:30, 07:30–07:45, etc.).
The participants who were able to complete the measurements numbered 34 and comprised nine boys and 25 girls, i.e., five (U1), eight (U2), six (U3), eight (SU1), and seven (SU2) (details in Table S1). Four students could not complete the sampling because the portable pump had stopped functioning before finishing the sampling, and two others failed for some other reason.
A personal air sampler shown in Figure 2b was used for the exposure measurements. The Personal Nano-Sampler (PNS) was developed and revised by Furuuchi et al. (2010) and Thongyen et al. (2015) [45,46] and is applicable for the evaluation of PM0.1 exposure. The PNS consists of two impactor stages (PM10 or 2.5/1) and two IF stages (PM0.4–1, PM0.1) that are configured in line, and a backup filter located downstream of PM0.1 IF. The first stage of the pre-cut impactor was covered by silicon grease (Dow Corning, 03253589) to a uniform thickness of around 0.2 mm during each sampling. Teflon-bound glass fiber (TBF) filters (TX40HI20-WW Pall Corp., New York, NY, USA) with diameters of 10 and 47 mm were attached on the second pre-cut impactor (PM1–2.5) and used as a backup filter. The pre-cut inertial filter consists of webbed SUS fibers (the same fibers that are used for ANS) packed in a circular nozzle. The main inertial filter consists of five-layer mesh TEM grids (Silver mesh G600HSS, 600 mesh, mesh width df = 5 μm, pitch = 42 μm, mesh thickness t = 8 μm) sandwiched by five spacers with a circular hole diameter of 1.9 mm (spacer thickness = 30 μm) in an aluminum cartridge [46], and it was used for collecting PM0.1–0.4. A portable battery pump (ASP-6000, KOMYO RIKAGAKU KOGYO K.K., Kawasaki, Japan) was connected to the outlet of the PNS unit by a flexible resin tube. The sampling air flow rate was 4.0 L min−1.
2.5. Filter Preparation and Weighing
The QFF filters were pre-baked for 1 h at 350 °C to remove any possible contamination following the guidelines of The Ministry of Environment, Japan [47] for the future chemical analysis. The QFF and TBF filters and IF cartridges were both stored in a weighing chamber (PWS-PM2.5, Tokyo Dylec Corp., Tokyo, Japan) for 48 h at a controlled temperature of 21.5 ± 1.5 °C and relative humidity of 35 ± 5%. The filters were then weighed before and after sampling using an electric microbalance (Sartorius Cubis MSU2.7S-000-DF, minimum digit (MD) = 1 μg) installed inside the weighing chamber.
2.6. Quality Assurance and Quality Control
The pump flow rate was calibrated using a HORIBA VP-4U bubble flow meter. Filters for sampling were accompanied by travel blanks to account for possible contamination during the sampling and transportation. Each filter was placed into a plastic (polyethylene) bag while covered by aluminium foil to avoid any chemical contamination. Each mass of filter samples was subtracted from the mean value of travel blank filter. The sample concentrations below the blank value were excluded from the data. The minimum detection limit (3σ) based on the evaluation of travel blanks was 5 µg (47-mm TBF filter), 2 µg (10-mm TBF filter), and 115 µg (55-mm QFF filter), respectively. These values were somewhat lower than the minimal value of filter samples, or 17 µg (47-mm TBF filter), 4 µg (10-mm TBF filter), and 119 µg (55-mm QFF filter), respectively.
Before the sampling, the participants received a lecture in which the study design including objectives and items for reliable measurements, etc. were outlined to ensure that the data collected for personal exposure were acceptable. The detailed methodology was also provided concerning how to record the details of the TAD and how to wear the PNS. Before the sampling, the participants were requested to learn how to operate the PNS by themselves. In order to immediately respond to any problems during the measurements, the SNS through mobile phones was used for the communication between the surveyors and the participants. Pump batteries were charged after each measurement, and a new measurement was then started after checking for equipment malfunctions.
2.7. Estimation of Respiratory Deposition Doses by Personal Exposure
The respiratory deposition doses (RDDs) were also estimated to determine the total deposition in the respiratory tracts for each size fraction of particles (PM<0.1, PM0.1–0.4, PM0.4–1.0 and PM1.0–2.5) during a day (±12 h). According to the International Commission on Radiological Protection (ICRP), RDDs can be evaluated by Equation (S1) [48]. All particles were assumed to penetrate completely via the nose or mouth into the respiratory tract. The particle deposition fraction (DF) was calculated in three regions of the respiratory tract, i.e., the head airways (DFHD) (Equation (S2)) with the inhalable fraction (IF) calculated by Equation (S3), tracheobronchial (DFTB) (Equation (S4)) and alveolar (DFAL) (Equation (S5)), to determine the RDD values. The ICRP model (1994) [49] has often been used in previous studies for adults, generally in light exercise and seated conditions. The calculation of RDDs for schoolchildren was first used in this study based on previous studies concerning particle deposition in children. Children might have a slightly larger DF [19,20] and have a greater ventilation rate per body weight or lung surface area, which may result in different tissue burdens compared with adults [21]. However, these differences only affected the mouthpiece [50] for increasing tidal volume compared with normal relaxed breathing. Thus, Bennet & Zeman (1998) [50] concluded that the deposition fraction of 2-µm particles is not different in children aged 7–14 years compared with adults, particularly during resting with spontaneous breathing, while a clear difference in DF from adult values was found for children younger than 9 [51]. In addition, the relative contributions to their tidal volume regarding the rib cage and abdomen by the posture of children were essentially the same as that in adults [52]. Person gender and physical activity status determined the values of a tidal volume or VT (m3 breathe–1) and the typical breath frequency or f (breath min–1) [53,54,55]. Therefore, the RDD values were calculated separately for the exposure of male and female students. Two different exposure conditions were assumed, i.e., light exercise and seating. In light exercise, the VT and f values were assumed to be 9.9 × 10⁻⁴ (12.5 × 10⁻⁴) m3 breath−1 and 21 (20) breath min−1 for males and females, respectively. In the seated position, 4.6 × 10⁻⁴ (7.5 × 10⁻⁴) m3 breath−1 and 14 (12) breath min−1 were used for females and males, respectively [48].
2.8. Statistical Analysis
The normal distribution status of the quantitative data was first checked before applying a statistical analysis, using the Shapiro–Wilk test for 7 ≤ number of samples (N) ≤ 50 and the Lilliefors test for 5 ≤ N ≤ 6 [56]. Parametric and non-parametric tests were used to analyze the data by ANS, PNS, and schoolchildren’s characteristics, respectively (Table S2). A ρ-value of less than 0.05 was also considered for all the performed tests.
3. Results and Discussion
3.1. General Characteristics of Schoolchildren
As seen from Table S3, most of the schoolchildren had no severe respiratory problems (68.0%), while 10% or less had respiratory symptoms, i.e., a common cold, a cough, a cough and cold, and breathlessness. Of these students, 13.5% had suffered from COVID-19. During the survey period, on-site schooling in the classroom was allowed for ~4 h per day (~16%) and the schoolchildren wore masks during these periods. In addition, school canteens were still not operational and schoolchildren who had symptoms of COVID-19 were not allowed to come to school. Their parents took them to school mostly using motorcycles (61.5%) or cars (29.5%), while a few of the schoolchildren used public transportation (2.7%) or walked (6.3%). The traveling time between home and school (round-trip) was less than 2.0 h (~4%). Hence, schoolchildren spent their time mostly on indoor activities (19 to 22 h, ~88%) while between 2 and 5 h per day (~12%) were spent on traveling and outdoor activities.
The schoolchildren lived together with their parents and siblings in a house. Most of the residents lived in housing estates that were located far from the roadside (±85.4%) but these locations were surrounded by small roads. Residential occupant numbers were 3–4 (70.5%), 5–8 (25.7%) and >8 (3.8%). Their homes were generally ventilated by the natural wind so that air exchange between outdoors and indoors was not very efficient, particularly for fine particles that were generated indoors [54,57].
Indoor PM emission is associated with human activities, and it contributes significantly to the production of fine and ultrafine particles in indoor air [58,59]. In 60.2% of the surveyed homes, smoke caused by both cigarette smoking and cooking was observed. According to the survey, cooking generally lasted for 2–3 h per day (±91.9%) but some cooking required 4–5 h and >5 h (7.0% and 1.1%), respectively. In most cases, the schoolchildren participated in cooking twice a day; in the morning before going to school around 8–9 A.M., and in the afternoon after coming back from school around 12–1 P.M. The average cooking durations in the morning and afternoon were 1.4 ± 0.6 and 2.3 ± 1.3 h, respectively. Although fewer male children participated in cooking, they spent most of their time in a family room or in a dining room that was in very close proximity to the kitchen. Hence, it is possible that some of the male children were also exposed to cooking activities.
3.2. Mass Concentrations of Ambient PM in School Outdoor Environments
In Table 2, the mass concentration of each size fraction of PM in the school outdoor environments is summarized, and the mass ratio between different PM sizes is shown in Figure 3. The average PM mass concentrations including PM0.1 as well as the peak mass percentage for the PM2.5–10 fraction are consistent with reported observations in other cities in Southeast Asia [60,61,62]. Average PM mass concentrations at the school gate (SG) were larger than those at the schoolyard (SY) for all size ranges and site locations, particularly in the case of the coarsest fraction (>10 µm). However, the difference between SG and SY was larger at suburban sites while the PM distribution was rather uniform at the urban sites. Such tendencies were possibly related, not only to the degree of influence of road traffic, but also to emissions that occurred in the schoolyards as well as those in school surroundings. Since the canteens in schools, the likely sources in the schoolyard area, were closed during the pandemic period and the activities of schoolchildren were restricted to inside the yard, the most likely anthropogenic sources may have been from traffic emissions. The larger difference between SG and SY at the suburban site, therefore, may be attributed to a lower background value in the area and a larger influence by heavier traffic in a neighboring road. In Table 3, the present results are compared with those from a similar case of roadside and schoolyard environments in Medan City in North Sumatra [63] along with roadside values from other cities [36,64]. In the case of Medan City, the PM concentration was quite large because of the much larger amount of traffic, and it increased in the schoolyard probably because, in the survey year (2019), the canteen was normally operated and there were no restrictions on schoolchildren’s activities in the schoolyard. For a detailed and rigorous discussion on the source apportionment, a chemical component analysis is needed. However, this issue will be addressed in the near future. From the results shown here, we conclude that the school outdoor environment was a key area where the schoolchildren stayed for ~4 h per day, and that the air quality was not affected by some unique sources other than that of traffic but, on average, it was similar in both areas and typical of values for other cities in this area.
Table 2.
Daily mean (standard deviation) and minimum–maximum of mass-size segregated particles at school gate (SG) and schoolyard (SY).
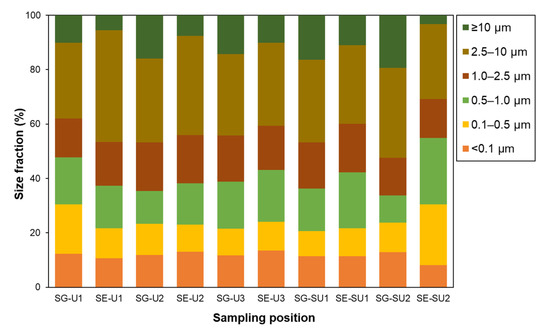
Figure 3.
Average percentage of size fractions (particle size: <0.1 µm, 0.1–0.5 µm, 0.5–1.0 µm, 1.0–2.5 µm, 2.5–10 µm, and ≥10 µm) to total particles (TSP) at SG and SE in each school.
Table 3.
Comparison of PM mass concentration related to school environments and roadsides in the present study and previous studies.
3.3. Schoolchildren’s Personal Exposure
3.3.1. Mass-Size Fractions of PM Exposure
Figure 4 shows the average mass concentration of size-segregated particles down to PM0.1 that the schoolchildren were exposed to for each school. Although, because of individual differences, the actual average duration of exposure measurement was 11.8 ± 0.5 h, the average concentration value may be acceptably regarded as the 12-h time-weighted average (12-h TWA). The exposure to PM0.1 and PM0.4–1 appeared to be dominant-size fractions in most cases, in which the PM0.1 accounted for around 40% of PM≤2.5, i.e., fine particles, with an average PM0.1 exposure of 25.9 ± 10.1 µg m−3. The schoolchildren in suburban areas were exposed to PM0.1 more heavily, exceeding 50 µg m−3 for some children from the SU2. These high levels of PM0.1 are comparable to ambient PM levels during remarkable episodes such as in Chiang Mai city, during the forest fire periods in 2014–2015 in northern Thailand [65] and during the peatland fire season in 2019 in Sumatra, Indonesia [36].
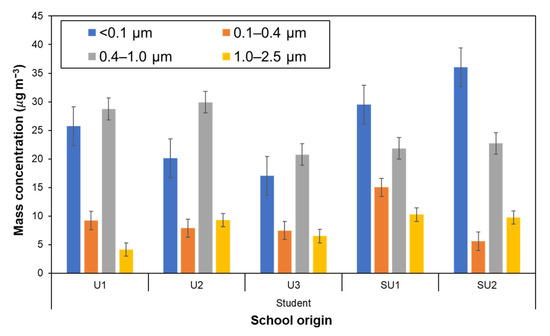
Figure 4.
Average mass concentrations of size-segregated particles down to the PM0.1 fraction to schoolchildren participants by personal exposure.
The exposure of the schoolchildren to all PM size fractions was statistically compared considering the schoolchildren’s school origin and area where they lived (urban or suburban). Concerning the results of normal distribution tests, the ANOVA test was used for the analysis of personal exposure to PM0.1, PM0.1–0.4, and PM0.4–1. Meanwhile, for the exposure to the PM1–2.5 fraction, the Kruskal–Wallis and the Mann–Whitney tests were used, respectively, to evaluate the differences between all schoolchildren based on their school, and between schoolchildren in urban and suburban areas. These results are summarized in Table 4. Large differences in PM0.1 and PM0.1–0.4 with the origin of the school are noted (F > Fcritical, the ANOVA test), while a noticeable difference between areas appeared only in the case of the PM0.1 fraction. From the results listed in Table 5, which were obtained through the post hoc test using αBonferroni-corrected, the largest difference between schools for the PM0.1 was found between U3 (17.0 ± 7.5 µg m−3) and SU1 (29.5 ± 5.7 µg m−3), while the largest difference in PM0.1–0.4 exposure was between SUI (15.0 ± 7.3 µg m−3) and SU2 (5.6 ± 4.2 µg m−3).
Table 4.
Results of statistical tests of personal exposure to mass size-segregated particles to schoolchildren participants with a significance level α = 0.05.
Table 5.
Results of a post hoc test for the personal exposure of schoolchildren participants to PM<0.1 and PM0.1–0.4 with a significance level using αBonferroni-corrected = 0.005 *.
From the above results, it became clear that the exposure level of PM0.1 was quite high and that there was a large difference in the exposure level for the submicron fractions (<1 µm), particularly the PM0.1. Such results can be attributed to the dominant emission sources in each environment where participants lived and also to the amount of PM exposure to the specific activities such as residence time and frequency of opportunities for exposure.
3.3.2. Personal vs. Ambient School Environments of Size-Resolved PM
In Figure 5, the average PM levels for personal exposure (PE) and outdoor school environments are compared for PM0.1, PM1 and PM2.5. The average PE levels are also summarized in Table 6 in comparison with the average outdoor PM levels. The PE level was 1.5~7.6 times higher than the outdoor PM level particularly for the PM0.1 fraction (4.8~7.6 times). The ratio of PE to outdoor levels, PE/SY and PE/SG, had peaks at PM0.1 both for the urban and suburban groups. Since personal exposure depends on behaviors of the participants, such factors that can result in higher levels of PM0.1 exposure need to be analyzed based on the time of activity and the microenvironments of the schoolchildren during the personal exposure measurements. According to the results of the questionnaire survey, indoor and outdoor activities (including transit time), respectively, shared ~88% and ~12%; the large ratios of PE to SY and SG suggest that schoolchildren had opportunities to be exposed to more contaminated microenvironments (MEs) outside school that contained more fine and ultrafine fractions of PMs.
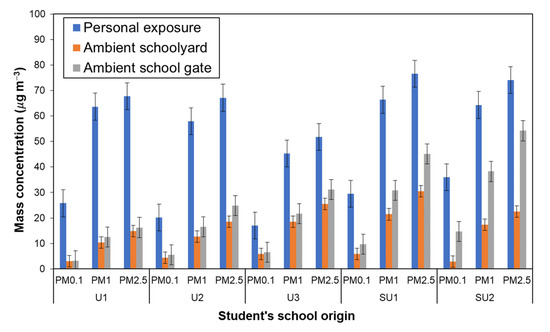
Figure 5.
Size-resolved particle (PM0.1, PM1, and PM2.5) concentrations based on schoolchildren’s school of origin: personal exposure vs. in ambient schoolyard (SY) and school gate (SG).
Table 6.
Average mass concentrations of PMs: personal exposure vs. school environments.
3.4. Schoolchildren’s Exposure Due to Time-Activity and Microenvironments
During the personal exposure measurements, the participating schoolchildren also reported the times of their activities and the corresponding microenvironments (MEs) (Table S4). Most of their activities were at home; in the living room, kitchen/dining room, bedroom, and other rooms in the home (total ~7 h). The transit or commuting time was classified as “go to school,” “back from school”, “go to others” and “back from others” (total ~1 h). “In-classroom”, “outside classroom”, “others (indoor)” and “others (outdoor)” were further categorized to describe differences in school environments (~4 h). These three different categories of environments—during transit, in the school environment and at home—are discussed below as key factors that can attribute to the exposure to PMs.
3.4.1. Schoolchildren’s Exposure during Transit and during School Environments
Previous studies using personal online PM sensors concluded that commuting environments provided the highest opportunity for exposure, particularly to UFPs, and that it occurred in a very short time period per day [23,29]. In the present cases, the schoolchildren’s commuting activity was mostly between home and school accompanied by parents for about 1 h, either using a motorcycle or a car. Such a difference appears to be reasonable because of the direct exposure to a traffic environment during transit by motorcycle. Although the contribution of commuting between the school environment and personal exposure PM levels was not so large, it would appear that on-road exposure is an important factor.
On the other hand, exposure in a school environment contributed less than 10% to the total exposure while schools were fully operative [24,28]. In this study, the influence of the school environment on schoolchildren’s exposure tended to be lower than in normal situations since school activity had just started again after nearly one year of online instruction and accounted for 4 h per day, and school canteens, as the most possible source in the yard area, were still closed. As discussed above, personal exposure levels were 1.5~7.6 times higher than the outdoor PM levels, particularly for PM0.1 (4.8~7.6 times).
3.4.2. Influences of Indoor Home Sources of PM on Personal Exposure
Since it was indicated that activities while schoolchildren were at home were the most important for exposure to PMs, their characteristics in each ME at home and PM concentrations during personal sampling were analyzed. As possible parameters related to indoor sources, the number of occupants, time period of cooking per day and smoking status at home were evaluated, as in the following (Table 7).
Table 7.
Personal exposure to size-resolved airborne particles by the characteristics of schoolchildren.
The average exposure level with smokers at home increased by 8~20% from that without smokers, with the largest increase in the suburban group (29.5% for the average PM2.5). This suggests that home smoking has a certain level of influence. However, the findings indicated that it was not so significant probably because children were normally not close to smoking areas at home. Meanwhile, the exposure level increased nearly linearly with the time cooking, as shown in Figure 6a, in which the average PM concentration of each size category are plotted against the average cooking period for male and female children. As seen from Figure 6b, the PM0.1/PM2.5 ratio also increased linearly with the time of cooking. The maximum PM0.1 concentration and the ratio PM0.1/PM2.5 became around five and three times those for 1 to 5 h of cooking time, respectively. Although each individual average value was less reliable for the cooking time <1 h (n = 2), the mass concentration and fraction of PM0.1 for 1 h were quite similar to those of outdoor environments. The other categories of PM tended to be similar but less sensitive to the cooking period. Although there was a slight difference in tendency between male and female children, the data were not sufficient to allow the differences to be specified. Regarding the number of home occupants, the influence was not clear, with differences of 0.96~0.99 times between 3–4 and 5–8 occupants.

Figure 6.
(a) Average concentrations of PM plotted against the average cooking period for male and female children; (b) the PM0.1/PM2.5 ratios against the cooking period.
From these results, we conclude that the exposure to indoor PM emissions caused by cooking is the most important key parameter that determines the much higher exposure level of PM compared with the outdoor PM concentration. For further discussion, the chemical component analysis will be needed to clarify the contribution of cooking and smoking at home and traffic during commuting.
3.5. Estimated Respiratory Deposition Doses of Each Size-Fraction of Particles
Respiratory deposition doses (RDDs) of schoolchildren calculated using Equation (S1) are summarized in Figure 7 and Table 8. For both categories of activities, the largest total RDDs appeared in the PM<0.1 fraction followed by PM0.4–1 and PM1–2.5, indicating the importance of dosing by fine fraction particles with sizes less than 1 μm. The RDDs during light exercise were larger than those for the seated position, and these were mostly attributed to male students. Such an increase in the RDDs under conditions of light exercise were also reported for PM2.5–10 and PM1.0–2.5 by Kumar & Jain (2021) [54] and Segalin et al. (2017) [32]. This may be explained by an increase in breathing frequency during the light exercise [48]. The larger RDDs for male children can be explained by a larger tidal volume for intake that can increase the deposition of PM in the respiratory tract [32,53]. It should be noted that the largest differences in RDDs between males and females appeared for the PM0.1 fraction (5.9%) and, as seen from Figure 7, such quite large RDDs for PM0.1 were mainly from the deposition of particles in the alveolar region. Since PM0.1 particles contain large amounts of hazardous chemicals per unit particle mass [12,66], possible adverse health influences would be predicted. For a detailed and rigorous discussion concerning the deposition doses to children based on their time-activity and the internal dose of metals (As, Pb, Mn, Cd, Cr) in the human body (e.g., kidney), an extended analysis, such as the use of ExDoM2 [67,68,69], would be needed. However, this issue will be addressed in the near future for schoolchildren’s personal PM0.1 exposure.

Figure 7.
Respiratory deposition doses (RDDs) of PM1.0–2.5, PM0.4–1.0, PM0.1–0.4, and PM<0.1 particles in headways (HD), tracheobronchial (TB), and alveoli (AL) regions during light exercise and seated between female and male schoolchildren.
Table 8.
Descriptive characteristics while sitting or during light exercises and Mean-difference (%) in RDD between the male and female students for different PM size stages. The mean-difference value for RDD is calculated using male student’s RDD as a reference.
4. Conclusions
The health risk for schoolchildren was discussed based on the mass concentration of exposed airborne fine and ultrafine particles (PM0.1) and schoolchildren’s behaviors in their daily life during a period of the COVID-19 pandemic in Jambi City, a medium-sized city in Sumatra Island, Indonesia. The 12-h average personal exposure level in schoolchildren was evaluated to be 1.5~7.6 times higher than that for the outdoor level measured in school environments and it was particularly high for the PM0.1 fraction (4.8~7.6 times). The schoolchildren spent most of their time in indoor (~88%) environments with only ~12% for transit (~1 h) and outdoor activities including schooling (~4 h), suggesting that the indoor environment is the dominant contributor to schoolchildren’s exposure. As one piece of evidence for the contribution of indoor emission, the exposure to indoor PM emission by cooking was found to be the most important parameter that describes the much higher exposure level of PM than the outdoor PM concentrations. Such a contribution appeared to be proportional to the period of cooking at home, particularly for the PM0.1 mass concentration and a mass fraction of PM0.1 to PM2.5. Although there was an influence of surrounding circumstances of targeted schools, such as more influence of heavy vehicle traffic in suburban areas, it contributed only slightly to the increased exposure. Home smoking and a larger exposure experienced by motorcycle commuting also increased the exposure but still had much less influence than cooking. The largest total RDDs of PM0.1, revealed that, particularly during light exercise, particles infiltrated deeper into the alveoli. Overall, the study highlighted the significance of personal PM0.1 exposure, which was identified as more varied based on location than other size-resolved PM. The high levels of PM0.1 exposure in the present study demonstrated the larger importance of sources that are potentially associated with health risks, particularly concerning cooking at home. The findings of this study will aid in improving schoolchildren’s health, particularly with respect to the PM0.1 fraction. This study can also serve as a guide for future directions in assessing population exposure and developing air pollution mitigation strategies such as the better management of ventilation in housing in Indonesia, especially concerning children’s health risks. This is important during such a period of social restriction under the COVID-19 pandemic.
Supplementary Materials
The following supporting information can be downloaded at: https://www.mdpi.com/article/10.3390/ijerph20042947/s1, Investigation of the exposure of schoolchildren to ultrafine particles (PM0.1) during the COVID-19 pandemic in a medium-sized city in Indonesia; Equation (S1): The respiratory deposition doses (RDDs) formula; Equation (S2): The deposition fraction for the head airways region (DFHD) formula; Equation (S3): the inhalable fraction (IF) formula; Equation (S4): The deposition fraction for the tracheobronchial region (DFTB) formula; Equation (S5): The deposition fraction for the alveolar region (DFAL) formula; Table S1: Description of schoolchildren participants for personal exposure measurements; Table S2: Statistical tests used for data analyses; Table S3: General characteristics of schoolchildren from five schools that were observed; Table S4: Time activity and microenvironments of schoolchildren participants during personal exposure sampling.
Author Contributions
Conceptualization, R.A.H. and M.F.; formal analysis, R.A.H. and M.F.; investigation, F.J.A.; resources, R.A.H. and M.H.; writing—original draft preparation, R.A.H.; writing—review and editing, R.A.H., W.P., M.A., A.P.Y., F.J.A., M.H. and M.F.; supervision, M.F.; project administration, M.H. and F.J.A.; funding acquisition, M.H. and M.F. All authors have read and agreed to the published version of the manuscript.
Funding
This research was funded by ADB-AKSI UNJA, grant number 042.05.2.401425/2019 and JSPS KAKENHI Grant Number 21H03618.
Institutional Review Board Statement
The study was conducted in accordance with the Declaration of Helsinki and approved by the Ethics Committee of Faculty of Medical and Health Science, Jambi University, Indonesia (protocol code 3065/UN21.8/PT.01.04/2021 and date of 17 November 2021).
Informed Consent Statement
Informed consent was obtained from all subjects involved in the study.
Data Availability Statement
Not applicable.
Acknowledgments
The authors wish to thank the five research assistants from the Environmental Engineering Dept. students at Jambi University (Fadhil Fairilah Dibsa, Dian Maisura, Salwa Khansa Salsabil, Annisa Shalsabila, and Seputra Efraim Sipayung) who were involved in data collection. The schoolchildren participants and the teachers of five junior-high schools in Jambi city of this study are also gratefully acknowledged for providing valuable information and assistance. Moreover, the authors also wish to thank Milton S. Feather for improving the English in this manuscript.
Conflicts of Interest
The authors declare no conflict of interest.
References
- Newman, J.D.; Bhatt, D.L.; Rajagopalan, S.; Balmes, J.R.; Brauer, M.; Breysse, P.N.; Brown, A.G.M.; Carnethon, M.R.; Cascio, W.E.; Collman, G.W.; et al. Cardiopulmonary Impact of Particulate Air Pollution in High-Risk Populations: JACC State-of-the-Art Review. J. Am. Coll. Cardiol. 2020, 76, 2878–2894. [Google Scholar] [CrossRef] [PubMed]
- WHO Global Air Quality Guidelines. Particulate Matter (PM2.5 and PM10), Ozone, Nitrogen Dioxide, Sulfur Dioxide and Carbon Monoxide; World Health Organization: Geneva, Switzerland, 2021; pp. 2–3. [Google Scholar]
- Pope, C.A.; Dockery, D.W. Health effects of fine particulate air pollution: Lines that connect. J. Air Waste Manag. 2006, 56, 709–742. [Google Scholar] [CrossRef] [PubMed]
- Lelieveld, J.; Pozzer, A.; Pöschl, U.; Fnais, M.; Haines, A.; Münzel, T. Loss of life expectancy from air pollution compared to other risk factors: A worldwide perspective. Cardiovasc. Res. 2020, 116, 1910–1917. [Google Scholar] [CrossRef] [PubMed]
- Hammer, M.S.; Van Donkelaar, A.; Li, C.; Lyapustin, A.; Sayer, A.M.; Hsu, N.C.; Levy, R.C.; Garay, M.J.; Kalashnikova, O.V.; Kahn, R.A.; et al. Global Estimates and Long-Term Trends of Fine Particulate Matter Concentrations (1998–2018). Environ. Sci. Technol. 2020, 54, 7879–7890. [Google Scholar] [CrossRef]
- Kumar, P.; Morawska, L.; Birmili, W.; Paasonen, P.; Hu, M.; Kulmala, M.; Harrison, R.M.; Norford, L.; Britter, R. Ultrafine particles in cities. Environ. Int. 2014, 66, 1–10. [Google Scholar] [CrossRef]
- Li, N.; Georas, S.; Alexis, N.; Fritz, P.; Xia, T.; Williams, M.A.; Horner, E.; Nel, A. A work group report on ultrafine particles (AAAAI) why ambient ultrafine and engineered nanoparticles should receive special attention for possible adverse health outcomes in humans. J. Allergy Clin. Immun. 2016, 138, 386–396. [Google Scholar] [CrossRef]
- Stone, V.; Miller, M.R.; Clift, M.J.D.; Elder, A.; Mills, N.L.; Møller, P.; Schins, R.P.F.; Vogel, U.; Kreyling, W.G.; Jensen, K.A.; et al. Nanomaterials versus ambient ultrafine particles: An opportunity to exchange toxicology knowledge. Environ. Health Perspect. 2017, 125, 106002. [Google Scholar] [CrossRef]
- Clifford, S.; Mazaheri, M.; Salimi, F.; Ezz, W.N.; Yeganeh, B.; Low-Choy, S.; Walker, K.; Mengersen, K.; Marks, G.B.; Morawska, L. Effects of exposure to ambient ultrafine particles on respiratory health and systemic inflammation in children. Environ. Int. 2018, 114, 167–180. [Google Scholar] [CrossRef]
- Costabile, F.; Gualtieri, M.; Ancona, C.; Canepari, S.; Decesari, S. Ultrafine particle features associated with pro-inflammatory and oxidative responses: Implications for health studies. Atmosphere 2020, 11, 414. [Google Scholar] [CrossRef]
- Kwon, H.S.; Ryu, M.H.; Carlsten, C. Ultrafine particles: Unique physicochemical properties relevant to health and disease. Exp. Mol. Med. 2020, 52, 318–328. [Google Scholar] [CrossRef]
- Schraufnagel, D.E. The health effects of ultrafine particles. Exp. Mol. Med. 2020, 52, 311–317. [Google Scholar] [CrossRef]
- Marval, J.; Tronville, P. Ultrafine particles: A review about their health effects, presence, generation, and measurement in indoor environments. Build. Environ. 2022, 216, 108992. [Google Scholar] [CrossRef]
- Oberdörster, G. Toxicology of ultrafine particles: In vivo studies. Philos. Trans. R. Soc. London. Ser. A Math. Phys. Eng. Sci. 2000, 358, 2719–2740. [Google Scholar] [CrossRef]
- Maier, K.L.; Alessandrini, F.; Beck-Speier, I.; Hofer, T.P.J.; Diabaté, S.; Bitterle, E.; Stöger, T.; Jakob, T.; Behrendt, H.; Horsch, M.; et al. Health effects of ambient particulate matter-Biological mechanisms and inflammatory responses to in vitro and in vivo particle exposures. Inhal. Toxicol. 2008, 20, 319–337. [Google Scholar] [CrossRef] [PubMed]
- Donaldson, K.; Tran, L.; Jimenez, L.A.; Duffin, R.; Newby, D.E.; Mills, N.; MacNee, W.; Stone, V. Combustion-derived nanoparticles: A review of their toxicology following inhalation exposure. Part. Fibre Toxicol. 2005, 2, 10. [Google Scholar] [CrossRef]
- Burtscher, H.; Schüepp, K. The occurrence of ultrafine particles in the specific environment of children. Paediatr. Respir. Rev. 2012, 13, 89–94. [Google Scholar] [CrossRef] [PubMed]
- García-Hernández, C.; Ferrero, A.; Estarlich, M.; Ballester, F. Exposure to ultrafine particles in children until 18 years of age: A systematic review. Indoor Air. 2020, 30, 7–23. [Google Scholar] [CrossRef]
- Schiller-Scotland, C.F.; Hlawa, R.; Gebhart, J.; Wönne, R.; Heyder, J. Total deposition of aerosol particles in the respiratory tract of children during spontaneous and controlled mouth breathing. J. Aerosol Sci. 1992, 19, 709–715. [Google Scholar] [CrossRef]
- Rissler, J.; Gudmundsson, A.; Nicklasson, H.; Swietlicki, E.; Wollmer, P.; Löndahl, J. Deposition efficiency of inhaled particles (15–5000 nm) related to breathing pattern and lung function: An experimental study in healthy children and adults. Part. Fibre Toxicol. 2017, 14, 10. [Google Scholar] [CrossRef]
- Ginsberg, G.L.; Asgharian, B.; Kimbell, J.S.; Ultman, J.S.; Jarabek, A.M. Modeling approaches for estimating the dosimetry of inhaled toxicants in children. J. Toxicol. Env. Health Part A 2008, 71, 166–195. [Google Scholar] [CrossRef]
- Oberdörster, G.; Oberdörster, E.; Oberdörster, J. Nanotoxicology: An Emerging Discipline Evolving from Studies of Ultrafine Particles. Environ. Health Perspect. 2005, 113, 823–839. [Google Scholar] [CrossRef]
- Buonanno, G.; Marini, S.; Morawska, L.; Fuoco, F.C. Individual dose and exposure of Italian children to ultrafine particles. Sci. Total Environ. 2012, 438, 271–277. [Google Scholar] [CrossRef]
- Mazaheri, M.; Clifford, S.; Jayaratne, R.; Megat Mokhtar, M.A.; Fuoco, F.; Buonanno, G.; Morawska, L. School children’s personal exposure to ultrafine particles in the urban environment. Environ. Sci. Technol. 2014, 48, 113–120. [Google Scholar] [CrossRef]
- Paunescu, A.C.; Attoui, M.; Bouallala, S.; Sunyer, J.; Momas, I. Personal measurement of exposure to black carbon and ultrafine particles in schoolchildren from PARIS cohort (Paris, France). Indoor Air 2016, 27, 766–779. [Google Scholar] [CrossRef]
- Pañella, P.; Casas, M.; Donaire-Gonzalez, D.; Garcia-Esteban, R.; Robinson, O.; Valentín, A.; Gulliver, J.; Momas, I.; Nieuwenhuijsen, M.; Vrijheid, M.; et al. Ultrafine particles and black carbon personal exposures in asthmatic and non-asthmatic children at school age. Indoor Air 2017, 27, 891–899. [Google Scholar] [CrossRef]
- Wangchuk, T.; Mazaheri, M.; Clifford, S.; Dudzinska, M.R.; He, C.; Buonanno, G.; Morawska, L. Children’s personal exposure to air pollution in rural villages in Bhutan. Environ. Res. 2015, 140, 691–698. [Google Scholar] [CrossRef]
- Nyarku, M.; Buonanno, G.; Ofosu, F.; Jayaratne, R.; Mazaheri, M.; Morawska, L. Schoolchildren’s personal exposure to ultrafine particles in and near Accra, Ghana. Environ. Int. 2019, 133, 105223. [Google Scholar] [CrossRef]
- Mazaheri, M.; Lin, W.; Clifford, S.; Yue, D.; Zhai, Y.; Xu, M.; Rizza, V.; Morawska, L. Characteristics of school children’s personal exposure to ultrafine particles in Heshan, Pearl River Delta, China–A pilot study. Environ. Int. 2019, 132, 105134. [Google Scholar] [CrossRef]
- Tran, P.T.M.; Ngoh, J.R.; Balasubramanian, R. Assessment of the integrated personal exposure to particulate emissions in urban micro-environments: A pilot study. Aerosol Air Qual. Res. 2020, 20, 341–357. [Google Scholar] [CrossRef]
- Phairuang, W.; Amin, M.; Hata, M.; Furuuchi, M. Airborne Nanoparticles (PM0.1) in Southeast Asian Cities: A Review. Sustainability 2022, 14, 10074. [Google Scholar] [CrossRef]
- Segalin, B.; Kumar, P.; Micadei, K.; Fornaro, A.; Gonçalves, F.L.T. Size–segregated particulate matter inside residences of elderly in the Metropolitan Area of São Paulo, Brazil. Atmos. Environ. 2017, 148, 139–151. [Google Scholar] [CrossRef]
- Wu, C.; Li, Y.-R.; Kuo, I.-C.; Hsu, S.-C.; Lin, L.-Y.; Su, T.-C. Investigating the association of cardiovascular effects with personal exposure to particle components and sources. Sci. Total Environ. 2012, 431, 176–182. [Google Scholar] [CrossRef] [PubMed]
- Rohra, H.; Tiwari, R.; Khare, P.; Taneja, A. Indoor-outdoor association of particulate matter and bounded elemental composition within coarse, quasi-accumulation and quasi-ultrafine ranges in residential areas of northern India. Sci. Total Environ. 2018, 631, 1383–1397. [Google Scholar] [CrossRef] [PubMed]
- Statistics of Jambi. Social and Population. 2022. Available online: https://jambikota.bps.go.id (accessed on 30 November 2022).
- Amin, M.; Handika, R.A.; Putri, R.M.; Phairuang, W.; Hata, M.; Tekasakul, P.; Furuuchi, M. Size-Segregated Particulate Mass and Carbonaceous Components in Roadside and Riverside Environments. Appl. Sci. 2021, 11, 10214. [Google Scholar] [CrossRef]
- Handika, R.A.; Lestari, R.A.; Saputra, R. Comparing contributors and PM10 dispersion around Tugu Juang and in governor office area of Jambi City, Indonesia. IOP Conf. Ser. Earth Environ. Sci. 2019, 391, 012050. [Google Scholar] [CrossRef]
- Sharma, R.; Balasubramanian, R. Size-fractionated Particulate Matter in Indoor and Outdoor Environments during the 2015 Haze in Singapore: Potential Human Health Risk Assessment. Aerosol Air Qual. Res. 2018, 18, 904–917. [Google Scholar] [CrossRef]
- Vadrevu, K.P.; Lasko, K.; Giglio, L.; Justice, C. Analysis of Southeast Asian pollution episode during June 2013 using satellite remote sensing datasets. Environ. Pollut. 2014, 195, 245–256. [Google Scholar] [CrossRef] [PubMed]
- Heil, A.; Goldammer, G. Smoke-Haze Pollution: A Review of the 1997 Episode in Southeast Asia. Reg. Environ. Chang. 2001, 2, 24–37. [Google Scholar] [CrossRef]
- Ministry of Environment & Forestry Indonesia. Karhutla Monitoring System. 2022. Available online: https://sipongi.menlhk.go.id/ (accessed on 25 October 2022).
- Ministry of Education, Culture, Research, and Technology Indonesia. Data Pokok Pendidikan. 2022. Available online: https://dapo.kemdikbud.go.id/pd (accessed on 29 October 2022).
- Otani, Y.; Eryu, K.; Furuuchi, M.; Tajima, N.; Tekasakul, P. Inertial Classification of Nanoparticles with Fibrous Filters. Aerosol Air Qual. Res. 2007, 7, 343–352. [Google Scholar] [CrossRef]
- Furuuchi, M.; Eryu, K.; Nagura, M.; Hata, M.; Kato, T.; Tajima, N.; Sekiguchi, K.; Ehara, K.; Seto, T.; Otani, Y. Development and performance evaluation of air sampler with inertial filter for nanoparticle sampling. Aerosol Air Qual. Res. 2010, 10, 185–192. [Google Scholar] [CrossRef]
- Furuuchi, M.; Choosong, T.; Hata, M.; Otani, Y.; Tekasakul, P.; Takizawa, M.; Nagura, M. Development of a personal sampler for evaluating exposure to ultrafine particles. Aerosol Air Qual. Res. 2010, 10, 30–37. [Google Scholar] [CrossRef]
- Thongyen, T.; Hata, M.; Toriba, A.; Ikeda, T.; Koyama, H.; Otani, Y.; Furuuchi, M. Development of PM0.1 personal sampler for evaluation of personal exposure to aerosol nanoparticles. Aerosol Air Qual. Res. 2015, 15, 180–187. [Google Scholar] [CrossRef]
- Ministry of Environment of Japan. Chapter 4. Carbonaceous Component Analysis Method 483 (Thermal Optical Reflectance Method). In Fine Particles (PM2.5) Component 484 Measurement Manual, 3rd ed.; Ministry of Environment of Japan: Tokyo, Japan, 2019. Available online: https://www.env.go.jp/air/osen/pm/ca/manual.html (accessed on 17 November 2022). (In Japanese)
- Hinds, W.C. Aerosol Technology: Properties, Behaviour and Measurement of Airborne Particles, 2nd ed.; John Wiley & Sons: New York, NY, USA, 1999; pp. 483–485. [Google Scholar]
- ICRP. Human Respiratory Tract Model for Radiological Protection; ICRP Publication 66. Ann, ICRP 24; ICRP: Stockholm, Sweden, 1994; pp. 1–3. [Google Scholar]
- Bennett, W.D.; Zeman, K.L. Deposition of fine particles in children spontaneously breathing at rest. Inhal. Toxicol. 1998, 10, 831–842. [Google Scholar]
- Isaacs, K.K.; Martonen, T.B. Particle deposition in children’s lungs: Theory and experiment. J. Aerosol Med. 2005, 18, 337–353. [Google Scholar] [CrossRef] [PubMed]
- Tabachnik, E.; Muller, N.; Toye, B.; Levinson, H. Measurement of ventilation in children using the respiratory inductive plethysmograph. J. Pediatr. 1981, 99, 895–899. [Google Scholar] [CrossRef]
- Sousa, N.A.; Segalin, B.; Busse, A.L.; Filho, W.J.; Fornaro, A.; Goncalves, F.L.T. Indoor/outdoor particulate matter and health risk in a nursing community home in Sao Paulo, Brazil. Atmos. Pollut. Res. 2021, 12, 101188. [Google Scholar] [CrossRef]
- Kumar, S.; Jain, M.K. Interrelationship of Indoor Particulate Matter and Respiratory Dust Depositions of Women in the Residence of Dhanbad City, India. Environ. Sci. Pollut. Res. 2021, 29, 4668–4689. [Google Scholar] [CrossRef]
- Jain, S. Exposure to in-vehicle respirable particulate matter in passenger vehicles under different ventilation conditions and seasons. Sustain. Environ. Res. 2017, 27, 87–94. [Google Scholar] [CrossRef]
- Razali, N.M.; Wah, Y.B. Normalization of the Kolmogorov–Smirnov and Shapiro–Wilk tests of normality. J. Stat. Mod. Anal. 2011, 2, 21–33. [Google Scholar]
- Morawska, L.; Ayoko, G.A.; Bae, G.N.; Buonanno, G.; Chao, C.Y.H.; Clifford, S.; Fu, S.C.; Hänninen, O.; He, C.; Isaxon, C.; et al. Airborne particles in indoor environment of homes, schools, offices and aged care facilities: The main routes of exposure. Environ. Int. 2017, 108, 75–83. [Google Scholar] [CrossRef]
- Braniš, M.; Řezáčová, P.; Domasová, M. The effect of outdoor air and indoor human activity on mass concentrations of PM10, PM2.5, and PM1 in a classroom. Environ. Res. 2005, 99, 143–149. [Google Scholar] [CrossRef] [PubMed]
- Nazaroff, W.W. Indoor particle dynamics. Indoor Air. 2004, 14, 175–183. [Google Scholar] [CrossRef] [PubMed]
- Boongla, Y.; Chanonmuang, P.; Hata, M.; Furuuchi, M.; Phairuang, W. The characteristics of carbonaceous particles down to the nanoparticle range in Rangsit city in the Bangkok Metropolitan Region, Thailand*. Environ. Pollut. 2021, 272, 115940. [Google Scholar] [CrossRef]
- Jamhari, A.A.; Latif, M.T.; Wahab, M.I.A.; Hassan, H.; Othman, M.; Abd Hamid, H.H.; Tekasakul, P.; Phairuang, W.; Hata, M.; Furuchi, M.; et al. Seasonal variation and size distribution of inorganic and carbonaceous components, source identification of size-fractioned urban air particles in Kuala Lumpur, Malaysia. Chemosphere 2022, 287, 132309. [Google Scholar] [CrossRef] [PubMed]
- Kurotsuchi, Y.; Sekiguchi, K.; Konno, S.; Huyen, T.T.; Fujitani, Y.; Matsumi, Y.; Kumagai, K.; Dung, N.T.; Thuy, L.B.; Thuy, N.T.T.; et al. Size-segregated chemical compositions of particulate matter including PM0.1 in northern Vietnam, a highly polluted area where notable seasonal episodes occur. Atmos. Pollut. Res. 2022, 13, 101478. [Google Scholar] [CrossRef]
- Putri, R.M.; Amin, M.; Suciari, T.F.; Al, M.; Faisal, F.; Auliani, R.; Ikemori, F.; Wada, M.; Hata, M.; Tekasakul, P.; et al. Site-specific variation in mass concentration and chemical components in ambient nanoparticles (PM0.1) in North Sumatra Province-Indonesia. Atmos. Pollut. Res. 2021, 12, 101062. [Google Scholar] [CrossRef]
- Tran, T.D.; Nguyen, P.M.; Nghiem, D.T.; Le, T.H.; Tu, M.B.; Alleman, L.Y.; Nguyen, V.M.; Pham, D.T.; Ha, N.M.; Dang, M.N.; et al. Assessment of air quality in school environments in Hanoi, Vietnam: A focus on mass-size distribution and elemental composition of indoor-outdoor ultrafine/fine/coarse particles. Atmosphere 2020, 11, 519. [Google Scholar] [CrossRef]
- Phairuang, W.; Suwattiga, P.; Chetiyanukornkul, T.; Hongtieab, S.; Limpaseni, W.; Ikemori, F.; Hata, M.; Furuuchi, M. The influence of the open burning of agricultural biomass and forest fires in Thailand on the carbonaceous components in size-fractionated particles. Environ. Pollut. 2019, 247, 238–247. [Google Scholar] [CrossRef]
- Möller, W.; Felten, K.; Sommerer, K.; Scheuch, G.; Meyer, G.; Meyer, P.; Häussinger, K.; Kreyling, W.G. Deposition, retention, and translocation of ultrafine particles from the central airways and lung periphery. Am. J. Resp. Crit. Care 2008, 177, 426–432. [Google Scholar] [CrossRef]
- Chalvatzaki, E.; Chatoutsidou, S.E.; Martins, V.; Diapouli, T.E.; Manousakas, M.; Almeida, S.M.; Eleftheriadis, K.; Lazaridis, M. Assessment of the personal dose received by school children due to PM10 air pollution in lisbon. Aerosol Air Qual. Res. 2020, 20, 1384–1397. [Google Scholar] [CrossRef]
- Chalvatzaki, E.; Lazaridis, M. Development and application of a dosimetry model (ExDoM2) for calculating internal dose of specific particle-bound metals in the human body. Inhal. Toxicol. 2015, 27, 308–320. [Google Scholar] [CrossRef]
- Aleksandropoulou, V.; Lazaridis, M. Development and application of a model (ExDoM) for calculating the respiratory tract dose and retention of particles under variable exposure conditions. Air Qual. Atmos. Health 2013, 6, 13–26. [Google Scholar] [CrossRef]
Disclaimer/Publisher’s Note: The statements, opinions and data contained in all publications are solely those of the individual author(s) and contributor(s) and not of MDPI and/or the editor(s). MDPI and/or the editor(s) disclaim responsibility for any injury to people or property resulting from any ideas, methods, instructions or products referred to in the content. |
© 2023 by the authors. Licensee MDPI, Basel, Switzerland. This article is an open access article distributed under the terms and conditions of the Creative Commons Attribution (CC BY) license (https://creativecommons.org/licenses/by/4.0/).