
Characteristics and Risk Assessment of Environmentally Persistent Free Radicals (EPFRs) of PM2.5 in Lahore, Pakistan

 ,
, 
 and
and
Abstract
1. Introduction
2. Methods and Materials
2.1. Site and Sampling Information
2.2. EPFRs Analysis
2.3. Oxidative Potential Analysis
2.4. Other Analysis
2.5. Atmospheric EPFR Exposure Evaluation
2.6. Statistical Analysis
3. Results and Discussions
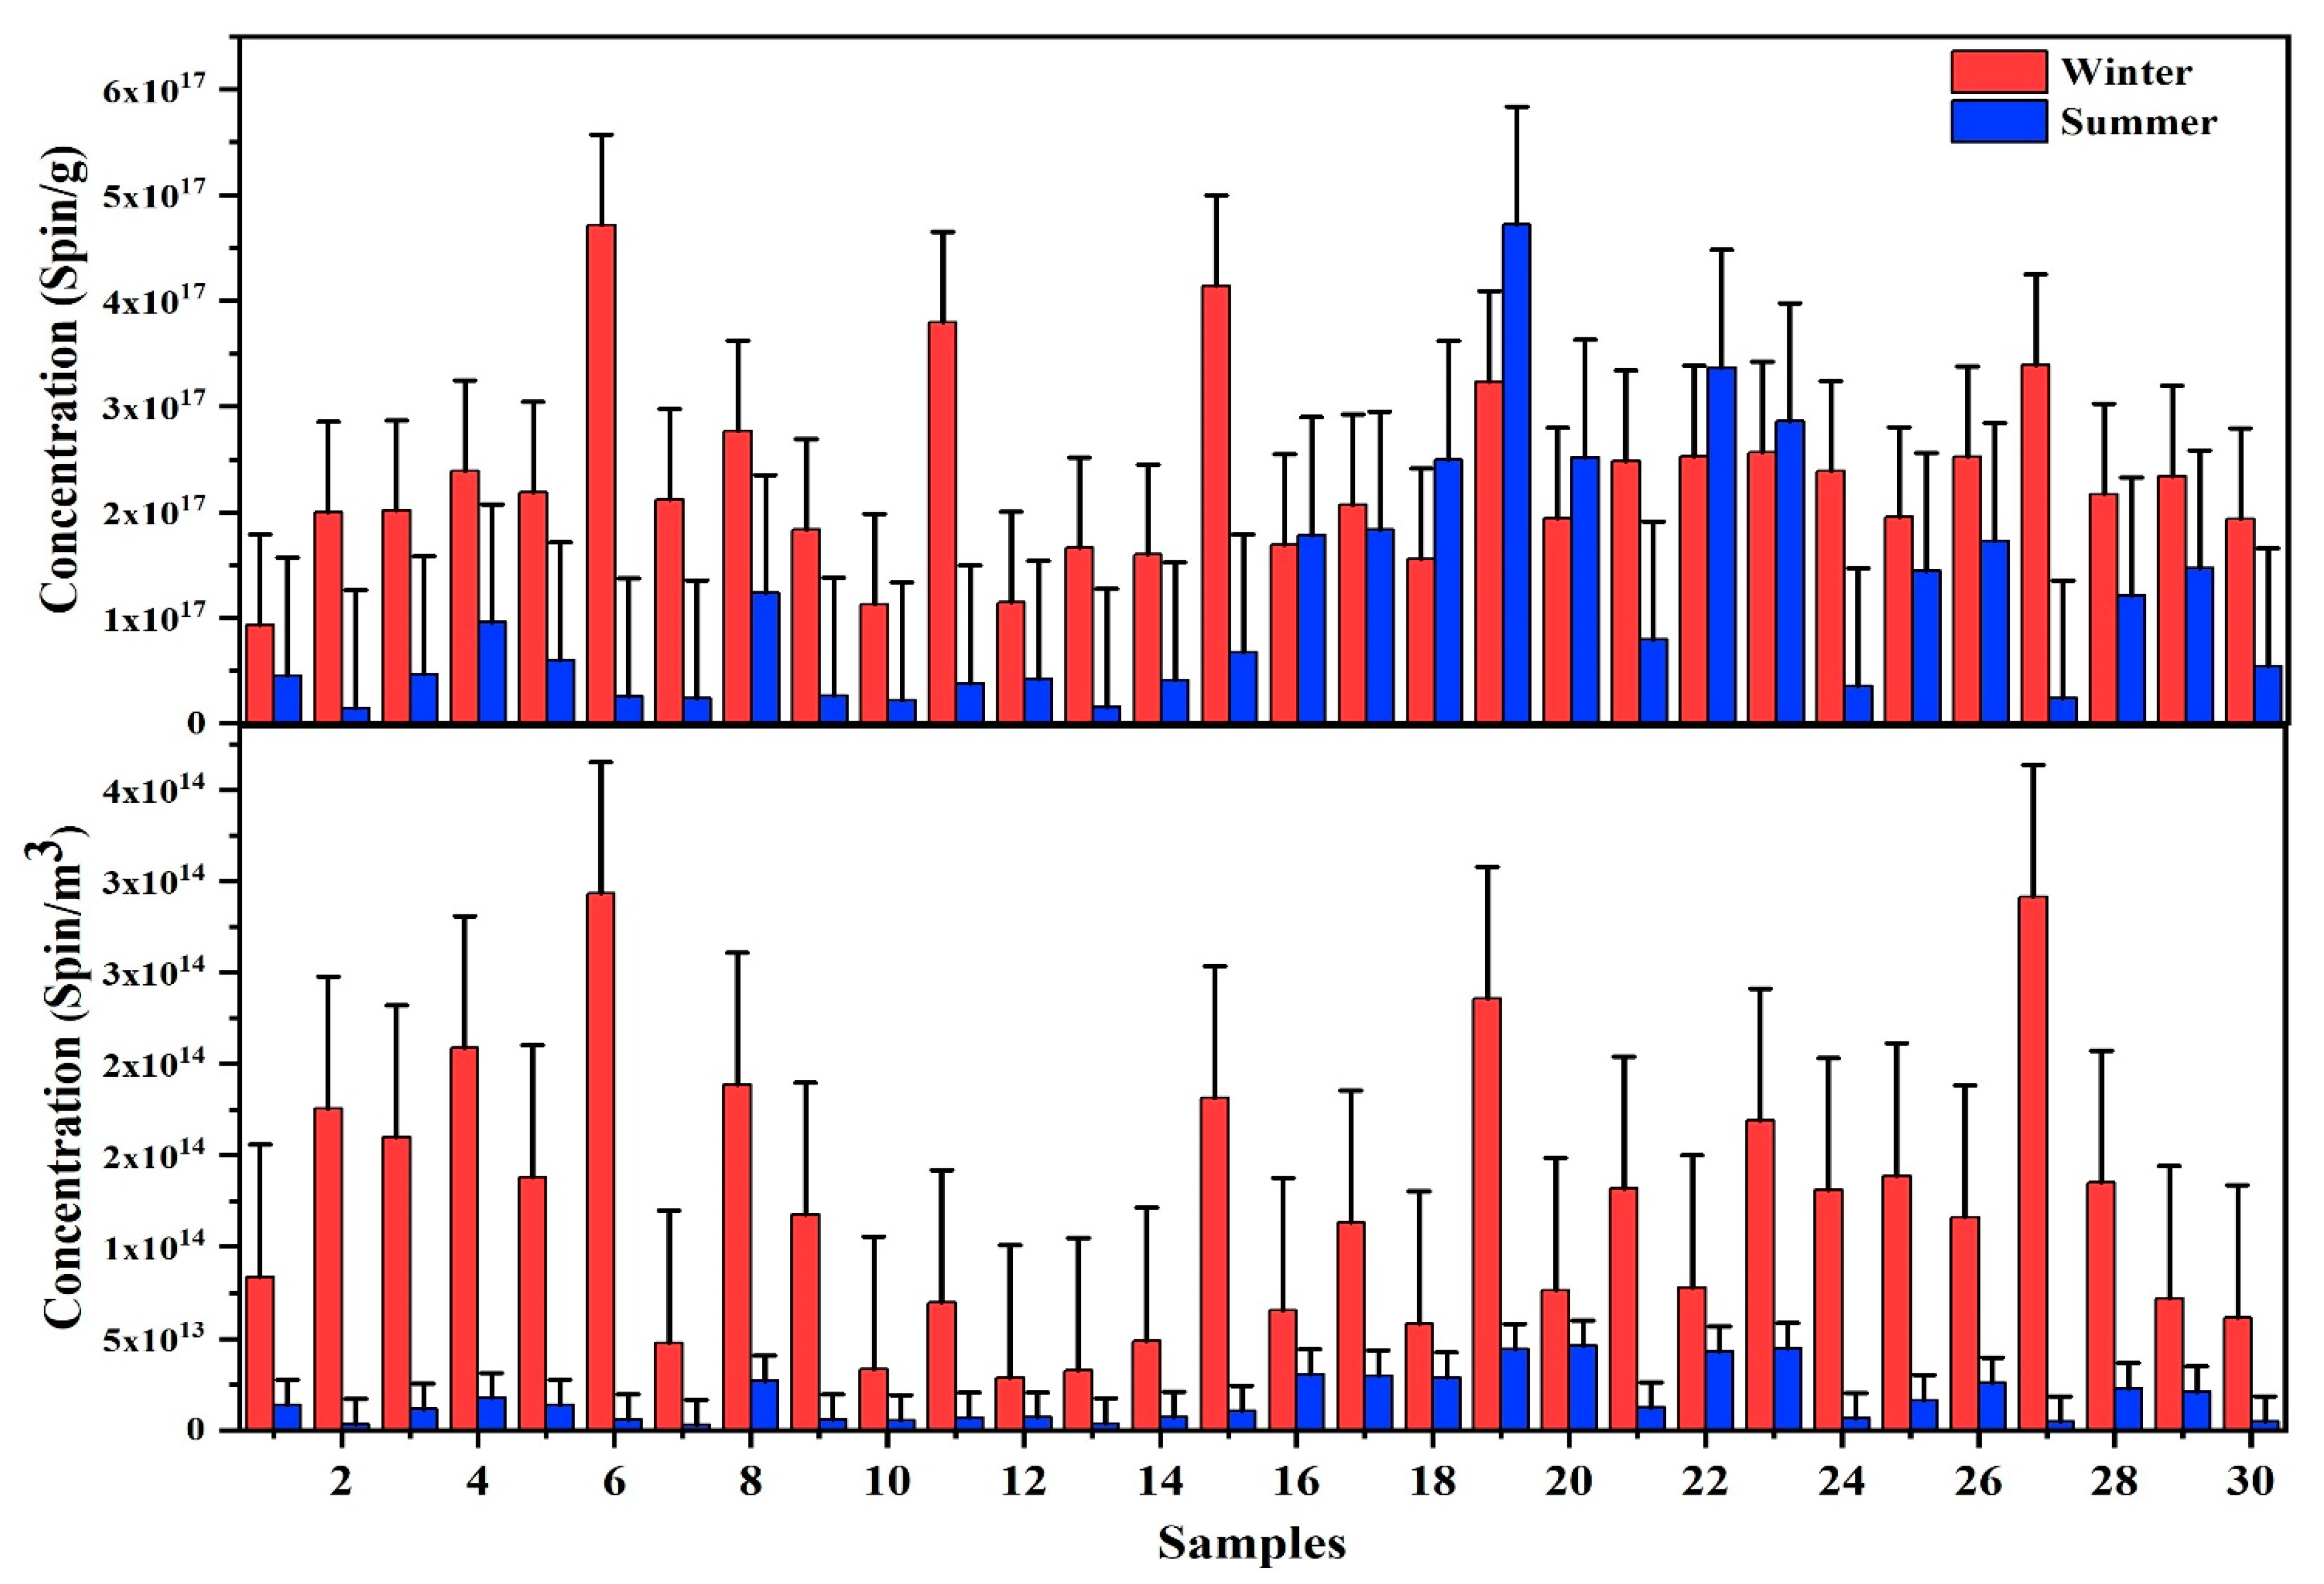
3.1. PM2.5 Mass and EPFRs Concentrations
3.2. Carbonaceous Species
3.3. Metal Elements
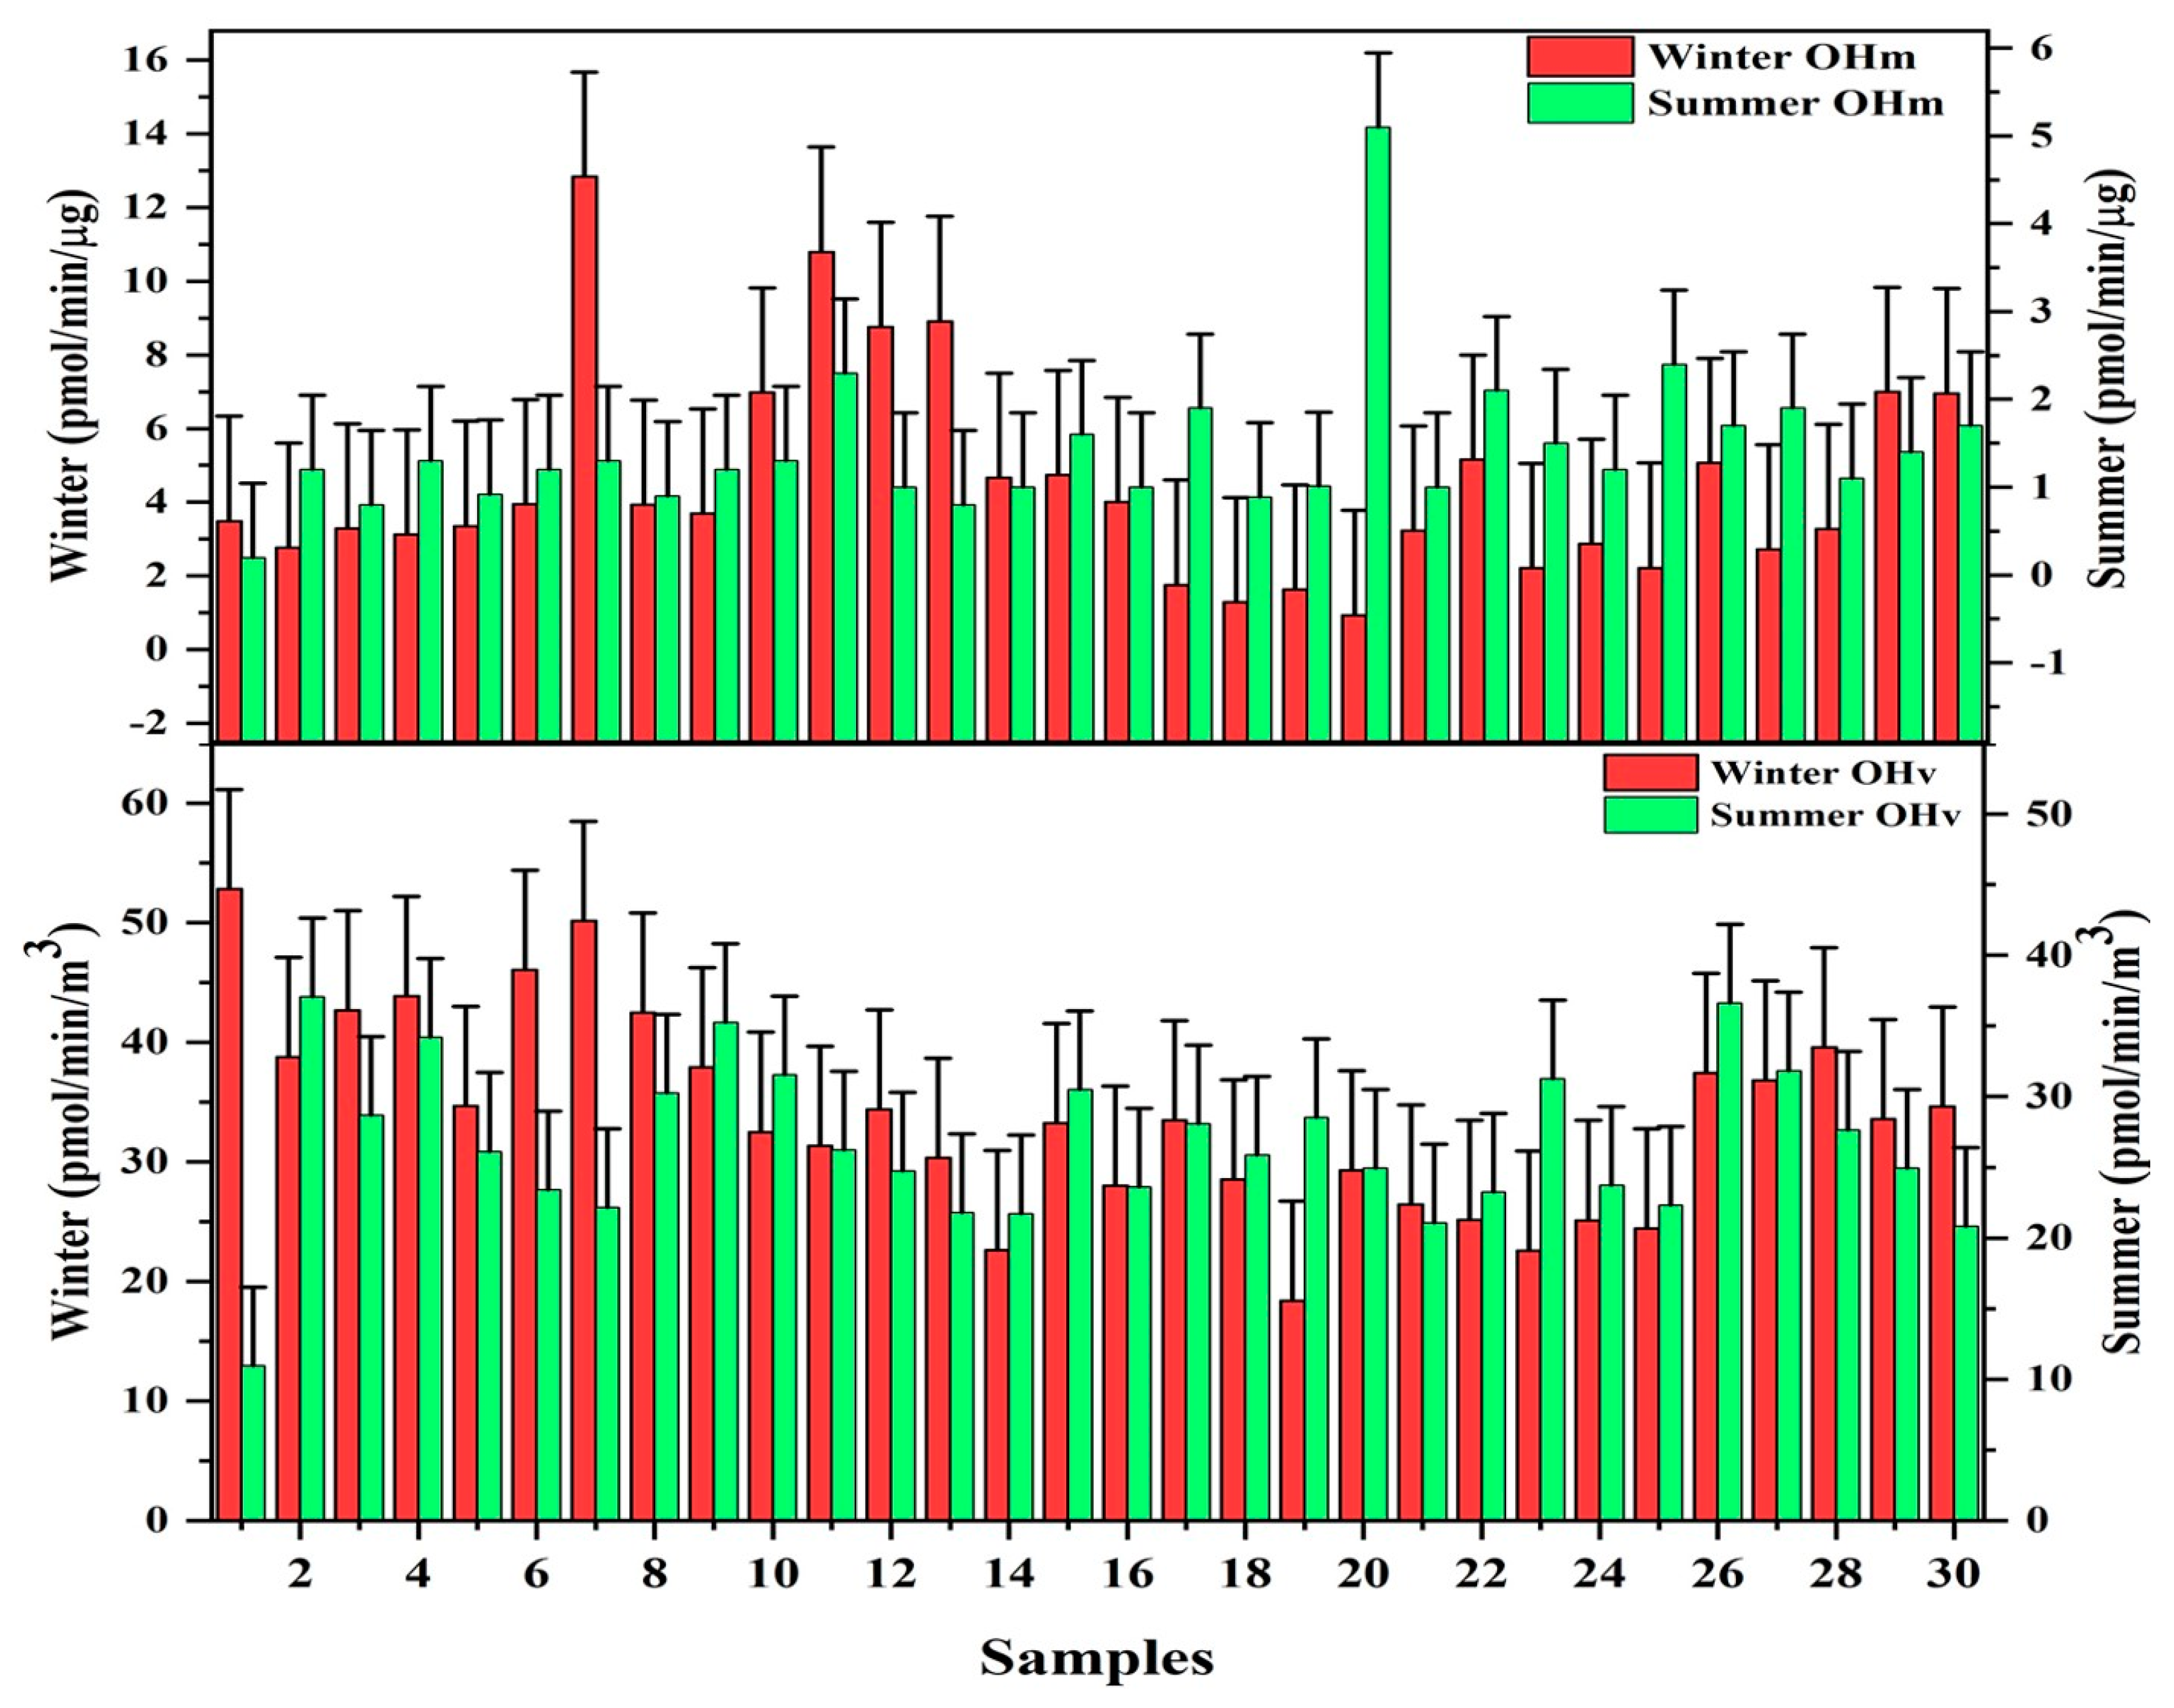
3.4. Hydroxyl Radical (•OH) Generation (Oxidative Potential)
4. Correlation Analysis
4.1. EPFRs Correlation with Carbonaceous Species
4.2. Correlation between •OHv and PM2.5 Components
5. Health Effects
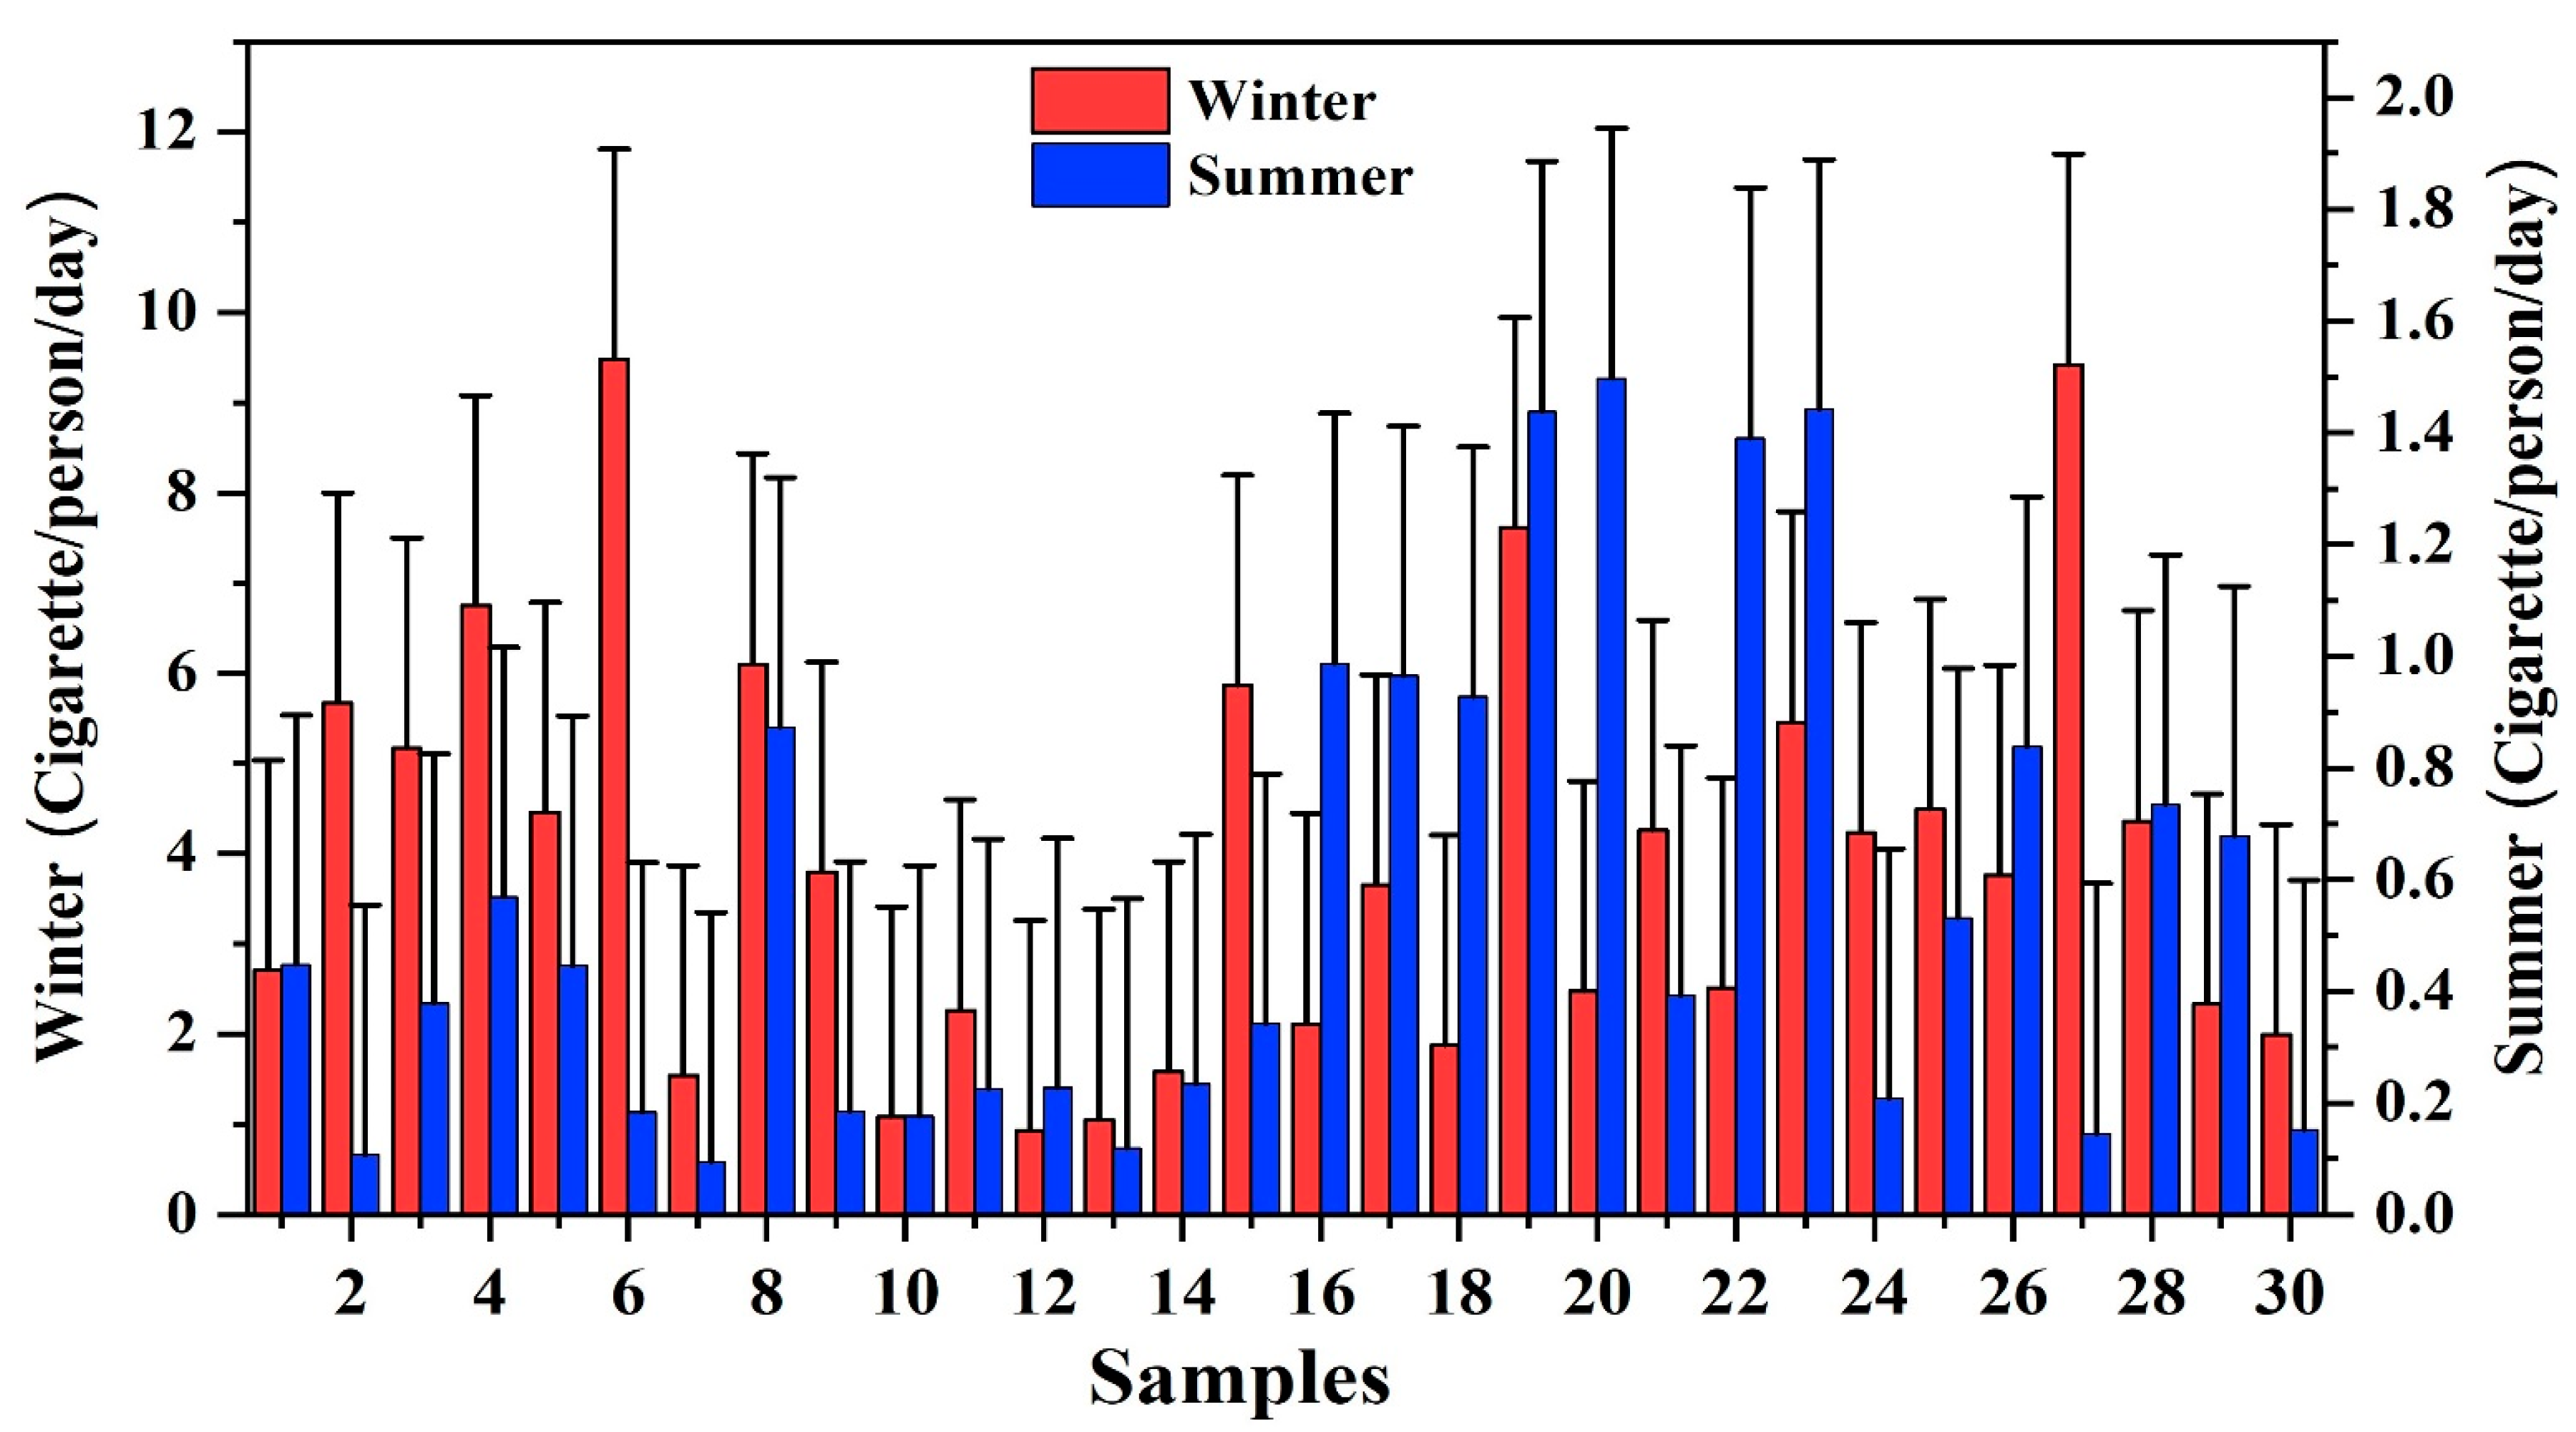
Atmospheric EPFRs Exposure Risk
6. Limitations of the Study
7. Conclusions
Author Contributions
Funding
Institutional Review Board Statement
Informed Consent Statement
Data Availability Statement
Acknowledgments
Conflicts of Interest
References
- Cohen, A.J.; Brauer, M.; Burnett, R.; Anderson, H.R.; Frostad, J.; Estep, K.; Balakrishnan, K.; Brunekreef, B.; Dandona, L.; Dandona, R.; et al. Estimates and 25-year trends of the global burden of disease attributable to ambient air pollution: An analysis of data from the Global Burden of Diseases Study 2015. Lancet 2017, 389, 1907–1918. [Google Scholar] [CrossRef] [PubMed]
- Yue, X.; Unger, N.; Harper, K.; Xia, X.G.; Liao, H.; Zhu, T.; Xiao, J.F.; Feng, Z.Z.; Li, J. Ozone and haze pollution weaken net primary productivity in China. Atmos. Chem. Phys. 2017, 17, 6073–6089. [Google Scholar] [CrossRef]
- Geng, G.; Zheng, Y.; Zhang, Q.; Xue, T.; Zhao, H.; Tong, D.; Zheng, B.; Li, M.; Liu, F.; Hong, C.; et al. Drivers of PM2.5 air pollution deaths in China 2002–2017. Nat. Geosci. 2021, 14, 645–650. [Google Scholar] [CrossRef]
- Hamanaka, R.B.; Mutlu, G.M. Particulate Matter Air Pollution: Effects on the Cardiovascular System. Front. Endocrinol. 2018, 9, 680–694. [Google Scholar] [CrossRef] [PubMed]
- Zhang, H.H.; Li, Z.; Liu, Y.; Xinag, P.; Cui, X.Y.; Ye, H.; Hu, B.L.; Lou, L.P. Physical and chemical characteristics of PM2.5 and its toxicity to human bronchial cells BEAS-2B in the winter and summer. J. Zhejiang Univ. Sci. B. 2018, 19, 317–326. [Google Scholar] [CrossRef] [PubMed]
- Siregar, S.; Idiawati, N.; Lestari, P.; Berekute, A.K.; Pan, W.C.; Yu, K.P. Chemical Composition, Source Appointment and Health Risk of PM2.5 and PM2.5-10 during Forest and Peatland Fires in Riau, Indonesia. Aerosol Air Qual. Res. 2022, 22, 220015. [Google Scholar] [CrossRef]
- Liu, M.X.; Huang, X.; Song, Y.; Xu, T.; Wang, S.; Wu, Z.; Hu, M.; Zhang, L.; Zhang, Q.; Pan, Y.; et al. Rapid SO2 emission reductions significantly increase tropospheric ammonia concentrations over the North China Plain. Atmos. Chem. Phys. 2018, 18, 17933–17943. [Google Scholar] [CrossRef]
- Nemmar, A.; Holme, J.A.; Rosas, I.; Schwarze, P.E.; Alfaro-Moreno, E. Recent advances in particulate matter and nanoparticle toxicology: A review of the in vivo and in vitro studies. Biomed. Res. Int. 2013, 2013, 279371. [Google Scholar] [CrossRef]
- Vejerano, E.P.; Rao, G.; Khachatryan, L.; Cormier, S.A.; Lomnicki, S. Environmentally persistent free radicals: Insights on a new class of pollutants. Environ. Sci. Technol. 2018, 52, 2468–2481. [Google Scholar] [CrossRef]
- Arangio, A.M.; Tong, H.; Socorro, J.; Pöschl, U.; Shiraiwa, M. Quantification of Environmentally Persistent Free Radicals and Reactive Oxygen Species in Atmospheric Aerosol Particles. Atmos. Chem. Phys. 2016, 16, 13105–13119. [Google Scholar] [CrossRef]
- Shaltout, A.A.; Boman, J.; Shehadeh, Z.F.; Al-Malawi, D.R.; Hemeda, O.M.; Morsy, M.M. Spectroscopic investigation of PM2.5 collected at industrial, residential and traffic sites in Taif, Saudi Arabia. J. Aerosol Sci. 2015, 79, 97–108. [Google Scholar] [CrossRef]
- dela Cruz, A.L.; Cook, R.L.; Lomnicki, S.M.; Dellinger, B. Effect of low temperature thermal treatment on soils contaminated with pentachlorophenol and environmentally persistent free radicals. Environ. Sci. Technol. 2012, 46, 5971–5978. [Google Scholar] [CrossRef] [PubMed]
- Gehling, W.; Khachatryan, L.; Dellinger, B. Hydroxyl radical generation from environmentally persistent free radicals (EPFRs) in PM2.5. Environ. Sci. Technol. 2014, 48, 4266–4272. [Google Scholar] [CrossRef] [PubMed]
- Park, J.; Park, E.H.; Schauer, J.J.; Yi, S.M.; Heod, J. Reactive oxygen species (ROS) activity of ambient fine particles (PM2.5) was measured in Seoul, Korea. Environ. Int. 2018, 117, 276–283. [Google Scholar] [CrossRef] [PubMed]
- Guo, C.; Richmond-Bryant, J. A critical review of environmentally persistent free radical (EPFR) solvent extraction methodology and retrieval efficiency. Chemosphere 2021, 284, 131353. [Google Scholar] [CrossRef]
- Al-Kindi, S.G.; Brook, R.D.; Biswal, S.; Rajagopalan, S. Environmental determinants of cardiovascular disease: Lessons learned from air pollution. Nat. Rev. Cardiol. 2020, 17, 656–672. [Google Scholar] [CrossRef]
- Shou, Y.; Huang, Y.; Zhu, X.; Liu, C.; Hu, Y.; Wang, H. A review of the possible associations between ambient PM2.5 exposures and the development of Alzheimer’s disease. Ecotoxicol. Environ. Saf. 2019, 174, 344–352. [Google Scholar] [CrossRef]
- Simkovich, S.; Goodman, D.; Roa, C.; Crocker, M.E.; Gianella, G.E.; Kirenga, B.J.; Wise, R.; Checkley, W. The health and social implications of household air pollution and respiratory diseases. Npj Prim. Care Respir. Med. 2019, 29, 12. [Google Scholar] [CrossRef]
- Harmon, A.C.; Hebert, V.Y.; Cormier, S.A.; Subramanian, B.; Reed, J.R.; Backes, W.L.; Dugas, T.R. Particulate matter containing environmentally persistent free radicals induces AhR-dependent cytokine and reactive oxygen species production in human bronchial epithelial cells. PLoS ONE 2018, 13, e0205412. [Google Scholar] [CrossRef]
- Thangavel, P.; Park, D.; Lee, Y.C. Recent insights into particulate matter (PM2.5) mediated toxicity in humans: An overview. Int. J. Environ. Res. Public Health 2022, 19, 7511. [Google Scholar] [CrossRef]
- Kumar, P.; Gupta, N.C. Firework-Induced Particulate and Heavy Metal Emissions During the Diwali Festival in Delhi, India. (International Perspectives). J. Environ. Health 2018, 81, E1–E8. [Google Scholar]
- Yang, X.; Eziz, M.; Hayrat, A.; Ma, X.; Yan, W.; Qian, K.; Li, J.; Liu, Y.; Wang, Y. Heavy metal pollution and risk assessment of surface dust in the arid NW China. Int. J. Environ. Res. Public Health 2022, 19, 13296. [Google Scholar] [CrossRef] [PubMed]
- Morakinyo, O.M.; Mokgobu, M.I.; Mukhola, M.S.; Hunter, R.P. Health outcomes of exposure to biological and chemical components of inhalable and respirable particulate matter. Int. J. Environ. Res. Public Health 2016, 13, 592. [Google Scholar] [CrossRef] [PubMed]
- Kim, M.S.; Park, M.J.; Yang, J.H.; Lee, S.H. Human health risk assessment for toxic trace elements in the Yaro Mine and reclamation options. Int. J. Environ. Res. Public. Health 2019, 16, 5077. [Google Scholar] [CrossRef]
- Cheng, M.; Tang, G.; Lv, B.; Li, X.; Wu, X.; Wang, Y.; Wang, Y. Source apportionment of PM2.5 and visibility in Jinan, China. J. Environ. Sci. 2021, 102, 207–215. [Google Scholar] [CrossRef]
- Wu, Y.; Lu, B.; Zhu, X.; Wang, A.; Yang, M.; Gu, S.; Wang, X.; Leng, P.; Zierold, K.M.; Li, X.; et al. Seasonal variations, source apportionment, and health risk assessment of heavy metals in PM2.5 in Ningbo, China. Aerosol Air Qual. Res. 2019, 19, 2083–2092. [Google Scholar] [CrossRef]
- Sierra-Hernándeza, M.R.; Gabrielli, P.; Beaudon, E.; Wegner, A.; Thompson, L.G. Atmospheric depositions of natural and anthropogenic trace elements on the Guliya ice cap (northwestern Tibetan Plateau) during the last 340 years. Atmos. Environ. 2018, 176, 91–102. [Google Scholar] [CrossRef]
- Morillas, H.; Marcaida, I.; Maguregui, M.; Upasen, S.; Gallego-Cartagena, E.; Madariaga, J.M. Identification of metals and metalloids as hazardous elements in PM2.5 and PM10 collected in a coastal environment affected by diffuse contamination. J. Cleaner Prod. 2019, 226, 369–378. [Google Scholar] [CrossRef]
- Soleimani, M.; Amini, N.; Sadeghian, B.; Wang, D.; Fang, L. Heavy metals and their source identification in particulate matter (PM2.5) in Isfahan City, Iran. J. Environ. Sci. 2018, 72, 166–175. [Google Scholar] [CrossRef]
- Witkowska, D.; Słowik, J.; Chilicka, K. Heavy metals and human health: Possible exposure pathways and the competition for protein binding sites. Molecules 2021, 26, 6060. [Google Scholar] [CrossRef] [PubMed]
- Chen, Q.; Wang, M.; Wang, Y.; Zhang, L.; Xue, J.; Sun, H.; Mu, Z. Rapid determination of environmentally persistent free radicals (EPFRs) in atmospheric particles with a quartz sheet-based approach using electron paramagnetic resonance (EPR) spectroscopy. Atmos. Environ. 2018, 184, 140–145. [Google Scholar] [CrossRef]
- Xiong, Q.; Yu, H.; Wang, R.; Wei, J.; Verma, V. Rethinking the dithiothreitol (DTT) based PM oxidative potential: Measuring DTT consumption versus ROS generation. Environ. Sci. Technol. 2017, 51, 6507–6514. [Google Scholar] [CrossRef]
- Ahmad, M.; Cheng, S.; Yu, Q.; Qin, W.; Zhang, Y.; Chen, J. Chemical and source characterization of PM2.5 in the summertime in severely polluted Lahore, Pakistan. Atmos. Res. 2020, 234, 104715–104723. [Google Scholar] [CrossRef]
- Ahmad, M.; Yu, Q.; Chen, J.; Cheng, S.; Qin, W.; Zhang, Y. Chemical characteristics, oxidative potential, and sources of PM2.5 in wintertime in Lahore and Peshawar, Pakistan. J. Environ. Sci. 2021, 102, 148–158. [Google Scholar] [CrossRef] [PubMed]
- Gehling, W.; Dellinger, B. Environmentally persistent free radicals and their lifetimes in PM2.5. Environ. Sci. Technol. 2013, 47, 8172–8178. [Google Scholar] [CrossRef]
- EPA 600/6-87/008; Recommendations for and Documentation of Biological Values for Use in Risk Assessment, PB-179874. US Environmental Protection Agency: Cincinnati, OH, USA, 1988.
- Baum, S.L.; Anderson, I.G.M.; Baker, R.R.; Murphy, D.M.; Rowlands, C.C. Electron spin resonance and spin trap investigation of free radicals in cigarette smoke: Development of a quantification procedure. Anal. Chim. Acta. 2003, 481, 1–13. [Google Scholar] [CrossRef]
- Khanum, F.; Chaudhry, M.N.; Kumar, P. Characterization of five-year observation data of fine particulate matter in the metropolitan area of Lahore. Air Qual. Atmos. Health 2017, 10, 725–736. [Google Scholar] [CrossRef] [PubMed]
- Tursumbayeva, M.; Kerimray, A.; Karaca, F.; Permadi, D.A. Planetary boundary layer and its relationship with PM2.5 concentrations in Almaty, Kazakhstan. Aerosol Air Qual. Res. 2022, 22, 210294. [Google Scholar] [CrossRef]
- Hopke, P.K.; Dai, Q.; Li, L.; Feng, Y. Global Review of Recent Source Apportionments for Airborne Particulate Matter. Sci. Total Environ. 2020, 740, 140091. [Google Scholar] [CrossRef] [PubMed]
- Pak-EPA. National Environmental Quality Standards for Ambient Air, Drinking Water andNoise. 2010. Available online: https://environment.gov.pk/SiteImage/Misc/files/Rules/SRO2010NEQSAirWaterNoise.pdf (accessed on 15 November 2022).
- Krzyzanowski, M.; Cohen, A. Update of WHO air quality guidelines. Air Qual. Atmos. Health 2008, 1, 7–13. [Google Scholar] [CrossRef]
- Yang, L.; Liu, G.; Zheng, M.; Jin, R.; Zhu, Q.; Zhao, Y.; Wu, X.; Xu, Y. Highly elevated levels and particle-size distribution of environmentally persistent free radicals in the haze-associated atmosphere. Environ. Sci. Technol. 2017, 51, 7936–7944. [Google Scholar] [CrossRef]
- Chen, Q.; Sun, H.; Mu, Z.; Wang, Y.; Li, Y.; Zhang, L.; Wang, M.; Zhang, Z. Characteristics of environmentally persistent free radicals in PM2.5: Concentrations, species, and sources in Xi’an, Northwestern China. Environ. Pollut. 2019, 247, 18–26. [Google Scholar] [CrossRef] [PubMed]
- Wang, S.Y.; Ye, J.H.; Soong, R.; Wu, B.; Yu, L.; Simpson, A.J.; Chan, A.W.H. Relationship between chemical composition and oxidative potential of secondary organic aerosol from polycyclic aromatic hydrocarbons. Atmos. Chem. Phys. 2018, 18, 3987–4003. [Google Scholar] [CrossRef]
- Tahri, M.; Benchrif, A.; Bounakhla, M.; Benyaich, F.; Noac, Y. Seasonal variation and risk assessment of PM2.5 and PM2.5–10 in the ambient air of Kenitra, Morocco. Environ. Sci. 2017, 19, 1427–1436. [Google Scholar] [CrossRef] [PubMed]
- Lemou, A.; Rabhi, L.; Merabet, H.; Ladji, R.; Nicolas, J.B.; Bonnaire, N.; Mustapha, M.A.; Dilmi, R.; Sciare, J.; Mihalopoulos, N.; et al. Chemical characterization of fine particles (PM2.5) at a coastal site in the South Western Mediterranean during the ChArMex experiment. Environ. Sci. Pollut. Res. 2020, 27, 20427–20445. [Google Scholar] [CrossRef] [PubMed]
- Mehmood, T.; Tianle, Z.; Ahmad, I.; Li, X.; Shen, F.; Akram, W.; Dong, L. Variations of PM2.5, PM10 mass concentration and health assessment in Islamabad, Pakistan. IOP Conf. Ser. Earth Environ. Sci. 2018, 133, 012031. [Google Scholar] [CrossRef]
- Mukherjee, A.; Agrawal, M. Assessment of local and distant sources of urban PM2.5 in the middle Indo-Gangetic Plain of India using statistical modeling. Atmos. Res. 2018, 213, 275–287. [Google Scholar] [CrossRef]
- Javed, W.; Wexler, A.S.; Murtaza, G.; Ahmad, H.R.; Basra, S.M. Spatial, temporal, and size distribution of particulate matter and its chemical constituents in Faisalabad, Pakistan. Atmósfera 2015, 28, 99–116. [Google Scholar] [CrossRef]
- Kumar, S.; Nath, S.; Bhatti, M.S.; Yadav, S. Chemical characteristics of fine and coarse particles during wintertime over two urban cities in North India. Aerosol Air Qual. Res. 2018, 18, 1573–1590. [Google Scholar] [CrossRef]
- Zeb, B.; Alam, K.; Sorooshian, A.; Blaschke, T.; Ahmad, I.; Shahid, I. On the morphology and composition of particulate matter in an urban environment. Aerosol Air Qual. Res. 2018, 18, 1431–1447. [Google Scholar] [PubMed]
- Alam, K.; Rahman, N.; Khan, H.U.; Haq, B.S.; Rahman, S. Particulate Matter and Its Source Apportionment in Peshawar, Northern Pakistan. Aerosol Air Qual. Res. 2015, 15, 634–647. [Google Scholar] [CrossRef]
- Chen, Q.; Wang, M.; Sun, H.; Wang, X.; Wang, Y.; Li, Y.; Zhang, L.; Mu, Z. Enhanced health risks from exposure to environmentally persistent free radicals and the oxidative stress of PM2.5 from Asian dust storms in Erenhot, Zhangbei and Jinan, China. Environ. Int. 2018, 121, 260–268. [Google Scholar] [CrossRef] [PubMed]
- Qian, R.; Zhang, S.; Peng, C.; Zhang, L.; Yang, F.; Tian, M.; Huang, R.; Wang, Q.; Chen, Q.; Yao, X.; et al. Characteristics and potential exposure risks of environmentally persistent free radicals in PM2.5 in the three gorges reservoir area, Southwestern China. Chemosphere 2020, 252, 126425–126434. [Google Scholar] [CrossRef] [PubMed]
- Guo, X.; Zhang, N.; Hu, X.; Ding, Z.; Chen, Y.; Lian, H.Z. Characteristics and potential inhalation exposure risks of PM2.5–bound environmental persistent free radicals in Nanjing, a mega–city in China. Atmos. Environ. 2020, 224, 117355–117361. [Google Scholar] [CrossRef]
- Jan, F.A.; Khan, S.; Ishaq, M.; Naeem, M.; Ahmed, I.; Hussain, S. Brick kiln exhaust as a source of polycyclic aromatic hydrocarbons (PAHs) in the surrounding soil and plants: A case study from the city of Peshawar, Pakistan. Arabian J. Geosci. 2013, 7, 13–19. [Google Scholar] [CrossRef]
- Hasan, F.; Khachatryan, L.; Lomnicki, S. Comparative studies of environmentally persistent free radicals on total particulate matter collected from electronic and tobacco cigarettes. Environ. Sci. Technol. 2020, 54, 5710–5718. [Google Scholar] [CrossRef]
- Qi, M.; Jiang, L.; Liu, Y.; Xiong, Q.; Sun, C.; Li, X.; Zhao, W.; Yang, X. Analysis of the characteristics and sources of carbonaceous aerosols in PM2.5 in the Beijing, Tianjin, and Langfang Region, China. Int. J. Environ. Res. Public Health 2018, 15, 1483. [Google Scholar] [CrossRef]
- Chen, J.M.; Chen, B.; Higuchi, K.; Liu, J.; Chan, D.; Worthy, D.; Tans, P.; Black, A. Boreal ecosystems sequestered more carbon in warmer years. Geophys. Res. Lett. 2006, 33, L10803. [Google Scholar] [CrossRef]
- Saarikoski, S.K.; Sillanpää, M.K.; Saarnio, K.M.; Hillamo, R.E.; Pennanen, A.S.; Salonen, R.O. Impact of biomass combustion on urban fine particulate matter in central and northern Europe. Water Air Soil Pollut. 2008, 191, 265–277. [Google Scholar] [CrossRef]
- Drozd, G.T.; Zhao, Y.; Saliba, G.; Frodin, B.; Maddox, C.; Chang, M.O.; Maldonado, H.; Sarder, S.; Weber, R.J.; Robinson, A.L.; et al. Detailed speciation of intermediate volatility and semivolatile organic compound emissions from gasoline vehicles: Effects of cold-starts and implications for secondary organic aerosol formation. Environ. Sci. Technol. 2019, 53, 12959. [Google Scholar] [CrossRef]
- Tomaz, S.; Cui, T.; Chen, Y.; Sexton, K.G.; Roberts, J.M.; Warneke, C.; Yokelson, R.J.; Surratt, J.D.; Turpin, B.J. Photochemical cloud processing of primary wildfire emissions as a potential source of secondary organic aerosol. Environ. Sci. Technol. 2018, 52, 11027–11037. [Google Scholar] [CrossRef] [PubMed]
- Crooks, M.; Cannolly, P.; McFiggans, G. A parameterization for the co-condensation of semi-volatile organics into multiple aerosol particle modes. Geosci. Model Dev. 2018, 11, 3261–3278. [Google Scholar] [CrossRef]
- Wang, L.; Slowik, J.G.; Tong, Y.; Duan, J.; Gu, Y.; Rai, P.; Qi, L.; Stefenelli, G.; Baltensperger, U.; Huang, R.J.; et al. Characteristics of wintertime VOCs in urban Beijing: Composition and source apportionment. Atmos. Environ. X 2021, 9, 100100. [Google Scholar] [CrossRef]
- Cabada, J.C.; Rees, S.; Takahama, S.; Khlystov, A.; Pandis, S.N.; Davidson, C.I. Mass size distribution and size-resolved the chemical composition of fine particulate matter at the Pittsburgh supersite. Atmos. Environ. 2004, 38, 3127–3141. [Google Scholar] [CrossRef]
- Safai, P.D.; Raju, M.P.; Rao, P.S.P.; Pandithurai, G. Characterization of carbonaceous aerosols over the urban tropical location and a new approach to evaluate their climatic importance. Atmos. Environ. 2014, 92, 493–500. [Google Scholar] [CrossRef]
- Schneidemesser, E.; Stone, E.A.; Quraishi, T.A.; Shafer, M.M.; Schauer, J.J. Toxic Metals in the Atmosphere in Lahore, Pakistan. Sci. Total Environ. 2010, 408, 1640–1648. [Google Scholar] [CrossRef]
- Moryani, H.T.; Kong, S.; Du, J.; Bao, J. Health risk assessment of heavy metals accumulated on PM2.5 fractioned road dust from two cities of Pakistan. Int. J. Environ. Res. Public Health 2020, 17, 7124–7144. [Google Scholar] [CrossRef]
- May, G.J.; Davidson, A.; Monahov, B. Lead batteries for utility energy storage: A review. J. Energy Storage 2018, 15, 145–157. [Google Scholar] [CrossRef]
- Ali, H.; Khan, E.; Ilahi, I. Environmental chemistry and ecotoxicology of hazardous heavy metals: Environmental persistence, toxicity, and bioaccumulation. J. Chem. 2019, 2019, 6730305. [Google Scholar] [CrossRef]
- Adamiec, E.; Jarosz-Krzemińska, E.; Wieszała, R. Heavy metals from non-exhaust vehicle emissions in urban and motorway road dusts. Environ. Monit. Assess. 2016, 188, 369. [Google Scholar] [CrossRef]
- Begum, B.A.; Hopke, P.K.; Markwitz, A. Air Pollution by Fine Particulate Matter in Bangladesh. Atmos. Pollut. Res. 2013, 4, 75–86. [Google Scholar] [CrossRef]
- Alias, N.F.; Khan, M.F.; Sairi, N.A.; Zain, S.M.; Suradi, H.; Rahim, H.A.; Banerjee, T.; Bari, M.A.; Othman, M.; Latif, M.T. Characteristics, emission sources, and risk factors of heavy metals in PM2. 5 from southern Malaysia. ACS Earth Space Chem. 2020, 4, 1309–1323. [Google Scholar] [CrossRef]
- Pillarisetti, A.; Pillarisetti, A.; Mehta, S.; Smith, K.R. HAPIT, the Household Air Pollution Intervention Tool, to evaluate the health benefits and cost-effectiveness of clean cooking interventions. In Broken Pumps and Promises: Incentivizing Impact in Environmental Health; Thomas, E., Ed.; Springer International Press: Cham, Switzerland, 2016; pp. 147–169. [Google Scholar]
- Li, X.Y.; Kaung, X.M.; Yan, C.Q.; Ma, S.; Paulson, S.E.; Zhu, T.; Zhang, Y.H.; Zheng, M. Oxidative Potential by PM2.5 in the North China Plain: Generation of hydroxyl radical. Environ. Sci. Technol. 2019, 53, 512–520. [Google Scholar] [CrossRef] [PubMed]
- Rao, L.; Zhang, L.; Wang, X.; Xie, T.; Zhou, S.; Lu, S.; Liu, X.; Lu, H.; Xiao, K.; Wang, W.; et al. Oxidative Potential Induced by Ambient Particulate Matters with Acellular Assays: A Review. Processes 2020, 8, 1410. [Google Scholar] [CrossRef]
- Mazuryk, O.; Stochel, G.; Brindell, M. Variations in reactive oxygen species generation by urban airborne particulate matter in lung epithelial cells—Impact of inorganic fraction. Front. Chem. 2020, 8, 581758. [Google Scholar] [CrossRef] [PubMed]
- Tan, Z.; Fuchs, H.; Lu, K.; Hofzumahaus, A.; Bohn, B.; Broch, S.; Dong, H.; Gomm, S.; Häseler, R.; He, L.; et al. Radical chemistry at a rural site (Wangdu) in the North China Plain: Observation and model calculations of OH, HO2, and RO2 radicals. Atmos. Chem. Phys. 2017, 17, 663–690. [Google Scholar] [CrossRef]
- Stolarek, R.; Bialasiewicz, P.; Krol, M.; Nowak, D. Breath analysis of hydrogen peroxide as a diagnostic tool. Clin. Chim. Acta. 2010, 411, 1849–1861. [Google Scholar] [CrossRef] [PubMed]
- Yan, C.; Zheng, M.; Shen, G.; Cheng, Y.; Ma, S.; Sun, J.; Cui, M.; Zhang, F.; Han, Y.; Chen, Y. Characterization of carbon fractions in carbonaceous aerosols from typical fossil fuel combustion sources. Fuel 2019, 254, 115620. [Google Scholar] [CrossRef]
- Li, Y.; Wu, A.; Wu, Y.; Xu, J.; Zhao, Z.; Tong, M.; Shengji, L. Morphological characterization and chemical composition of PM2.5 and PM10 collected from four typical Chinese restaurants. Aerosol Sci. Technol. 2019, 53, 1–17. [Google Scholar] [CrossRef]
- Zhuang, Y.; Li, R.; Yang, H.; Chen, D.; Chen, Z.; Gao, B.; He, B. Understanding the temporal and spatial distribution of crop residue burning in China from 2003 to 2017 Using MODIS Data. Remo. Sens. 2018, 10, 390. [Google Scholar] [CrossRef]
- Kumar, A.; Singh, S.; Kumar, N.; Singh, N.; Kumar, K.; Chourasiya, S. Assessment of carbonaceous fractions in ambient aerosols at high altitude and lowland urban locations of Kumaon Province, Indian Himalaya. SN Appl. Sci. 2021, 83, s42452. [Google Scholar] [CrossRef]
- Phairuang, W.; Suwattiga, P.; Chetiyanukornkul, T.; Hongtieab, S.; Limpaseni, W.; Ikemori, F.; Hata, M.; Furuuchi, M. The influence of the open burning of agricultural biomass and forest fires in Thailand on the carbonaceous components in size-fractionated particles. Environ. Pollut. 2019, 247, 238–247. [Google Scholar] [CrossRef]
- Tomoki, M.; Kimitaka, K.; Yuzo, M.; Ryuichi, W.; Yoshiyuki, T.; Nobuko, S.; Akira, T. Secondary formation of oxalic acid and related organic species from biogenic sources in a larch forest at the northern slope of Mt. Fuji. Atmos. Environ. 2017, 166, 255–262. [Google Scholar] [CrossRef]
- Lakey, P.S.J.; Berkemeier, T.; Tong, H.J.; Arangio, A.M.; Lucas, K.; Pöschl, U.; Shiraiwa, M. Chemical exposure-response relationship between air pollutants and reactive oxygen species in the human respiratory tract. Sci. Rep. 2016, 6, 32916. [Google Scholar] [CrossRef] [PubMed]
- Zhao, Q.; Huo, J.; Yang, X.; Fu, Q.; Duan, Y.; Liu, Y.; Lin, Y.; Zhang, Q. Chemical characterization and source identification of submicron aerosols from a year-long real-time observation at a rural site of Shanghai using an Aerosol Chemical Speciation Monitor. Atmos. Res. 2020, 246, 105154. [Google Scholar] [CrossRef]
- Charron, A.; Polo-Rehn, L.; Besombes, J.L.; Golly, B.; Buisson, C.; Chanut, H.; Marchand, N.; Guillaud, G.; Jaffrezol, J.L. Identification and quantification of particulate tracers of exhaust and non-exhaust vehicle emissions. Atmos. Chem. Phys. 2019, 19, 5187–5207. [Google Scholar] [CrossRef]
- Mousavi, A.; Sowlat, M.H.; Sioutas, C. Diurnal and seasonal trends and source apportionment of redox-active metals in Los Angeles using a novel online metal monitor and Positive Matrix Factorization (PMF). Atmos. Environ. 2018, 174, 15–24. [Google Scholar] [CrossRef]
- Boisa, N.; Elom, N.; Dean, J.R.; Deary, M.E.; Bird, G.; Entwistle, J.A. Development and application of an inhalation bioaccessibility method (IBM) for lead in the PM10 size fraction of soil. Environ. Int. 2014, 70, 132–142. [Google Scholar] [CrossRef] [PubMed]
- Reed, J.R.; Cawley, G.F.; Ardoin, T.G.; Dellinger, B.; Lomnicki, S.M.; Hasan, F.; Kiruri, L.W.; Backes, W.L. Environmentally persistent free radicals inhibit cytochrome P450 activity in rat liver microsomes. Toxicol. Appl. Pharmacol. 2014, 277, 200–209. [Google Scholar] [CrossRef] [PubMed]


| Winter | Summer | |||||
|---|---|---|---|---|---|---|
| Mean ± Stdv | Range | R | Mean ± Stdv | Range | R | |
| TC | 76.3 ± 46.9 | 16.3–171.2 | 0.82 ** | 23.2 ± 8.1 | 6.6–42.9 | 0.06 |
| OC | 50.7 ± 30.5 | 11.9–110.1 | 0.79 ** | 14.6 ± 5.6 | 4.5–29.7 | 0.34 |
| EC | 26.5 ± 18.0 | 4.5–64.9 | 0.80 ** | 8.6 ± 3.4 | 2.1–15.0 | −0.23 |
| WSOC | 35.2 ± 14.9 | 14.7–69.9 | 0.75 ** | 7.4 ± 1.6 | 3.4–11.1 | −0.32 |
| SOC | 15.7 ± 11.3 | 0.1–43.7 | 0.45 * | 6.0 ± 4.5 | 0.3–22.4 | 0.65 ** |
| OC1 | 30.6 ± 24.0 | 4.0–89.0 | 0.84 ** | 0.4 ± 0.6 | 0.0–3.2 | 0.76 ** |
| OC2 | 158.1 ± 39.9 | 59.6–101.5 | −0.67 ** | 5.3 ± 2.2 | 2.0–12.5 | 0.57 ** |
| OC3 | 39.1 ± 26.6 | 5.6–90.8 | 0.74 ** | 5.3 ± 2.0 | 2.2–10.5 | 0.14 |
| OC4 | 117.5 ± 29.5 | 79.2–194.4 | −0.50 ** | 3.6 ± 2.1 | 0.2–9.6 | 0.02 |
| EC1 | 43.4 ± 52.1 | 3.5–201.0 | 0.52 ** | 0.9 ± 0.7 | 0.0–3.1 | −0.06 |
| EC2 | 166.3 ± 159.7 | 1.3–499.0 | −0.13 | 5.4 ± 2.6 | 0.3–11.9 | −0.26 |
| EC3 | 14.4 ± 30.8 | 0.0–132.5 | 0.54 ** | 2.2 ± 1.2 | 0.1–4.5 | −0.09 |
| EPFRs (spin/m3) | 1.2 × 10¹⁴ ± 7.2 × 10¹³ | 2.9 × 10¹³–2.9 × 10¹⁴ | 1.7 × 10¹³ ± 1.4 × 10¹³ | 2.9 × 10¹²–4.6 × 10¹³ | ||
| EPFRs (spin/g) | 2.3 × 10¹⁷ ± 8.6 × 10¹⁶ | 9.3 × 10¹⁶–4.7 × 10¹⁷ | 1.1 × 10¹⁷ ± 1.1 × 10¹⁷ | 1.4 × 10¹⁶–4.7 × 10¹⁷ | ||
| g-value | 2.0030 | 2.0027–2.0032 | 2.0029 | 2.0026–2.0033 | ||
| City | Season | PM2.5 | Reference |
|---|---|---|---|
| Lahore | Summer | 170 µg/m3 | [33] |
| Lahore | Winter | 191 µg/m3 | [48] |
| Varanasi | Winter | 229.7 µg/m3 | [49] |
| Faisalabad | Winter | 209 µg/m3 | [50] |
| Amritsar | Winter | 147.6 µg/m3 | [51] |
| Delhi | Winter | 357.3 µg/m3 | [51] |
| Peshawar | Winter | 286 µg/m3 | [52] |
| Peshawar | Winter | 172 µg/m3 | [53] |
| Lahore | Winter | 522.2 µg/m3 | This Study |
| Lahore | Summer | 162.5 µg/m3 | This Study |
| Winter | Summer | |
|---|---|---|
| OC | 0.40 * | 0.27 |
| EC | 0.22 | −0.20 |
| WSOC | 0.33 | 0.45 * |
| SOC | 0.62 ** | 0.15 |
| Cr | −0.12 | 0.51 ** |
| Mn | 0.55 ** | 0.32 |
| Fe | 0.54 ** | 0.31 |
| Ni | −0.12 | 0.49 ** |
| Cu | 0.34 | −0.20 |
| Zn | 0.34 | 0.41 * |
| As | 0.35 | 0.59 ** |
| Cd | −0.12 | 0.48 ** |
| Pb | 0.16 | 0.49 ** |
Disclaimer/Publisher’s Note: The statements, opinions and data contained in all publications are solely those of the individual author(s) and contributor(s) and not of MDPI and/or the editor(s). MDPI and/or the editor(s) disclaim responsibility for any injury to people or property resulting from any ideas, methods, instructions or products referred to in the content. |
© 2023 by the authors. Licensee MDPI, Basel, Switzerland. This article is an open access article distributed under the terms and conditions of the Creative Commons Attribution (CC BY) license (https://creativecommons.org/licenses/by/4.0/).
Share and Cite
Ahmad, M.; Chen, J.; Yu, Q.; Tariq Khan, M.; Weqas Ali, S.; Nawab, A.; Phairuang, W.; Panyametheekul, S. Characteristics and Risk Assessment of Environmentally Persistent Free Radicals (EPFRs) of PM2.5 in Lahore, Pakistan. Int. J. Environ. Res. Public Health 2023, 20, 2384. https://doi.org/10.3390/ijerph20032384
Ahmad M, Chen J, Yu Q, Tariq Khan M, Weqas Ali S, Nawab A, Phairuang W, Panyametheekul S. Characteristics and Risk Assessment of Environmentally Persistent Free Radicals (EPFRs) of PM2.5 in Lahore, Pakistan. International Journal of Environmental Research and Public Health. 2023; 20(3):2384. https://doi.org/10.3390/ijerph20032384
Chicago/Turabian StyleAhmad, Mushtaq, Jing Chen, Qing Yu, Muhammad Tariq Khan, Syed Weqas Ali, Asim Nawab, Worradorn Phairuang, and Sirima Panyametheekul. 2023. "Characteristics and Risk Assessment of Environmentally Persistent Free Radicals (EPFRs) of PM2.5 in Lahore, Pakistan" International Journal of Environmental Research and Public Health 20, no. 3: 2384. https://doi.org/10.3390/ijerph20032384
APA StyleAhmad, M., Chen, J., Yu, Q., Tariq Khan, M., Weqas Ali, S., Nawab, A., Phairuang, W., & Panyametheekul, S. (2023). Characteristics and Risk Assessment of Environmentally Persistent Free Radicals (EPFRs) of PM2.5 in Lahore, Pakistan. International Journal of Environmental Research and Public Health, 20(3), 2384. https://doi.org/10.3390/ijerph20032384