
Trends and Drivers of Unmet Need for Family Planning in Currently Married Tanzanian Women between 1999 and 2016

 , ,
, ,  , and
, and
Abstract
1. Introduction
2. Materials and Methods
2.1. Data Sources
2.2. Study Setting
2.3. Outcome Variable
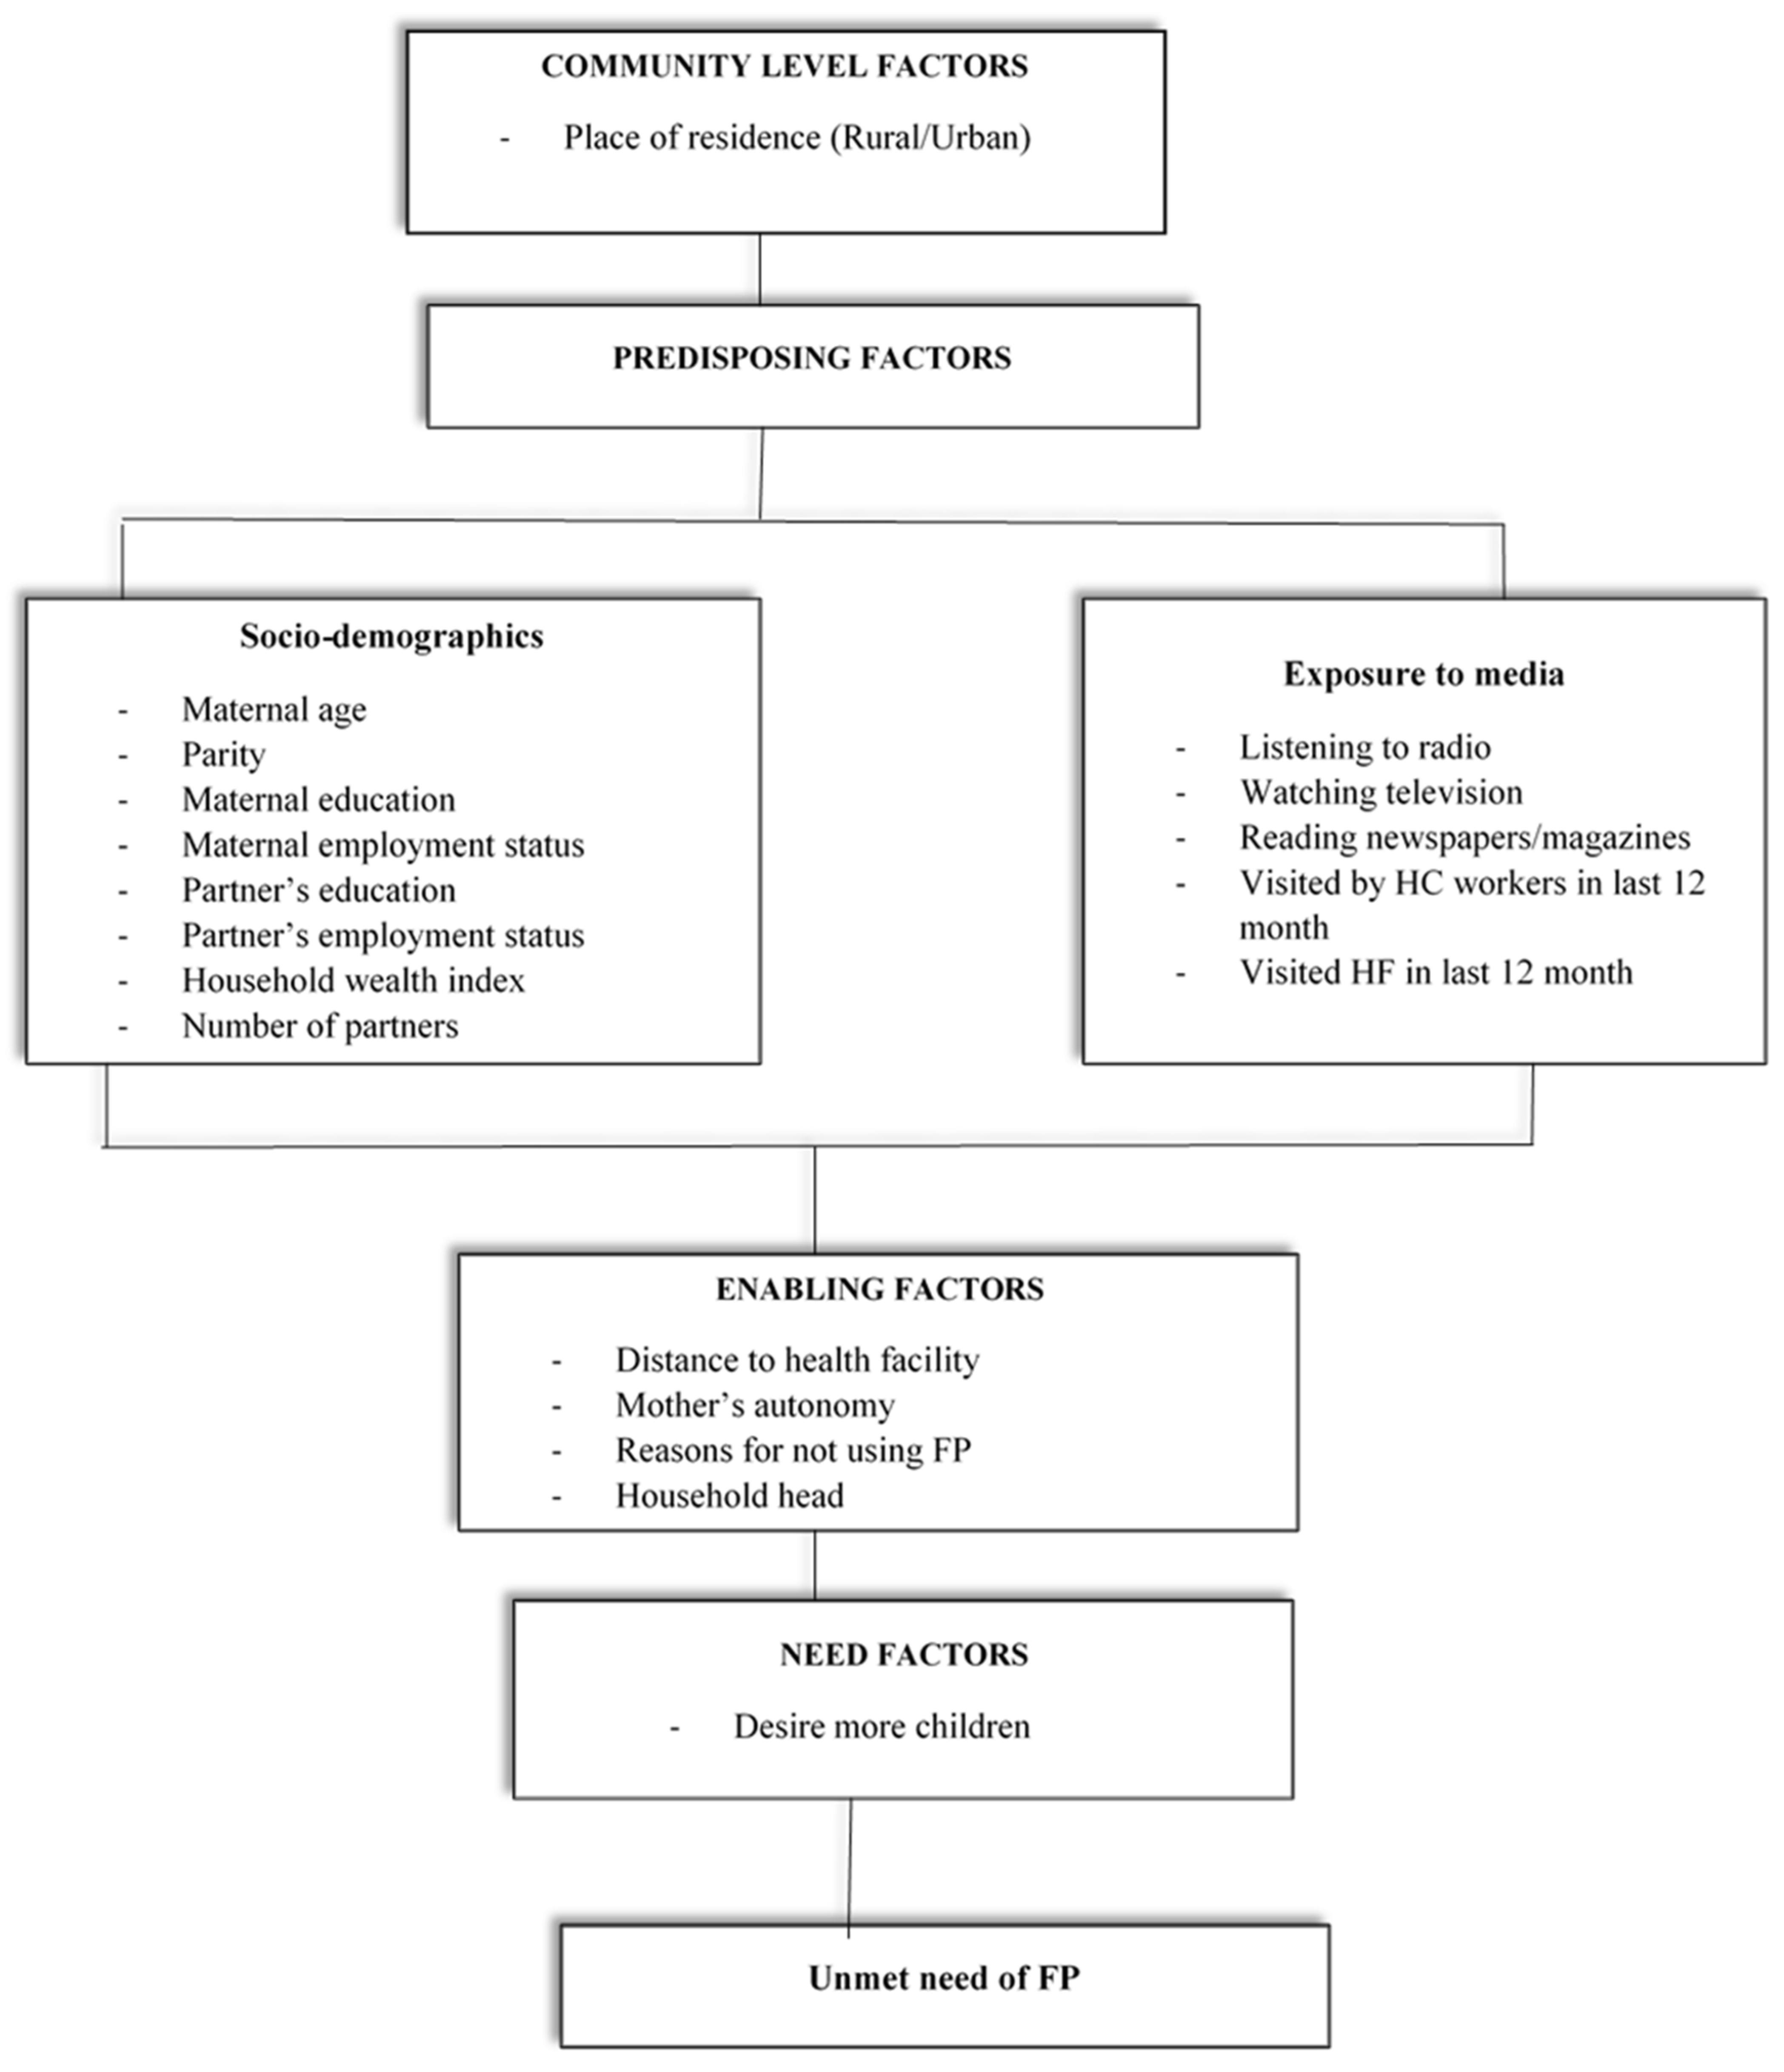
2.4. Exposure Variables
2.5. Statistical Analysis
3. Results
3.1. Characteristics of Study Participants
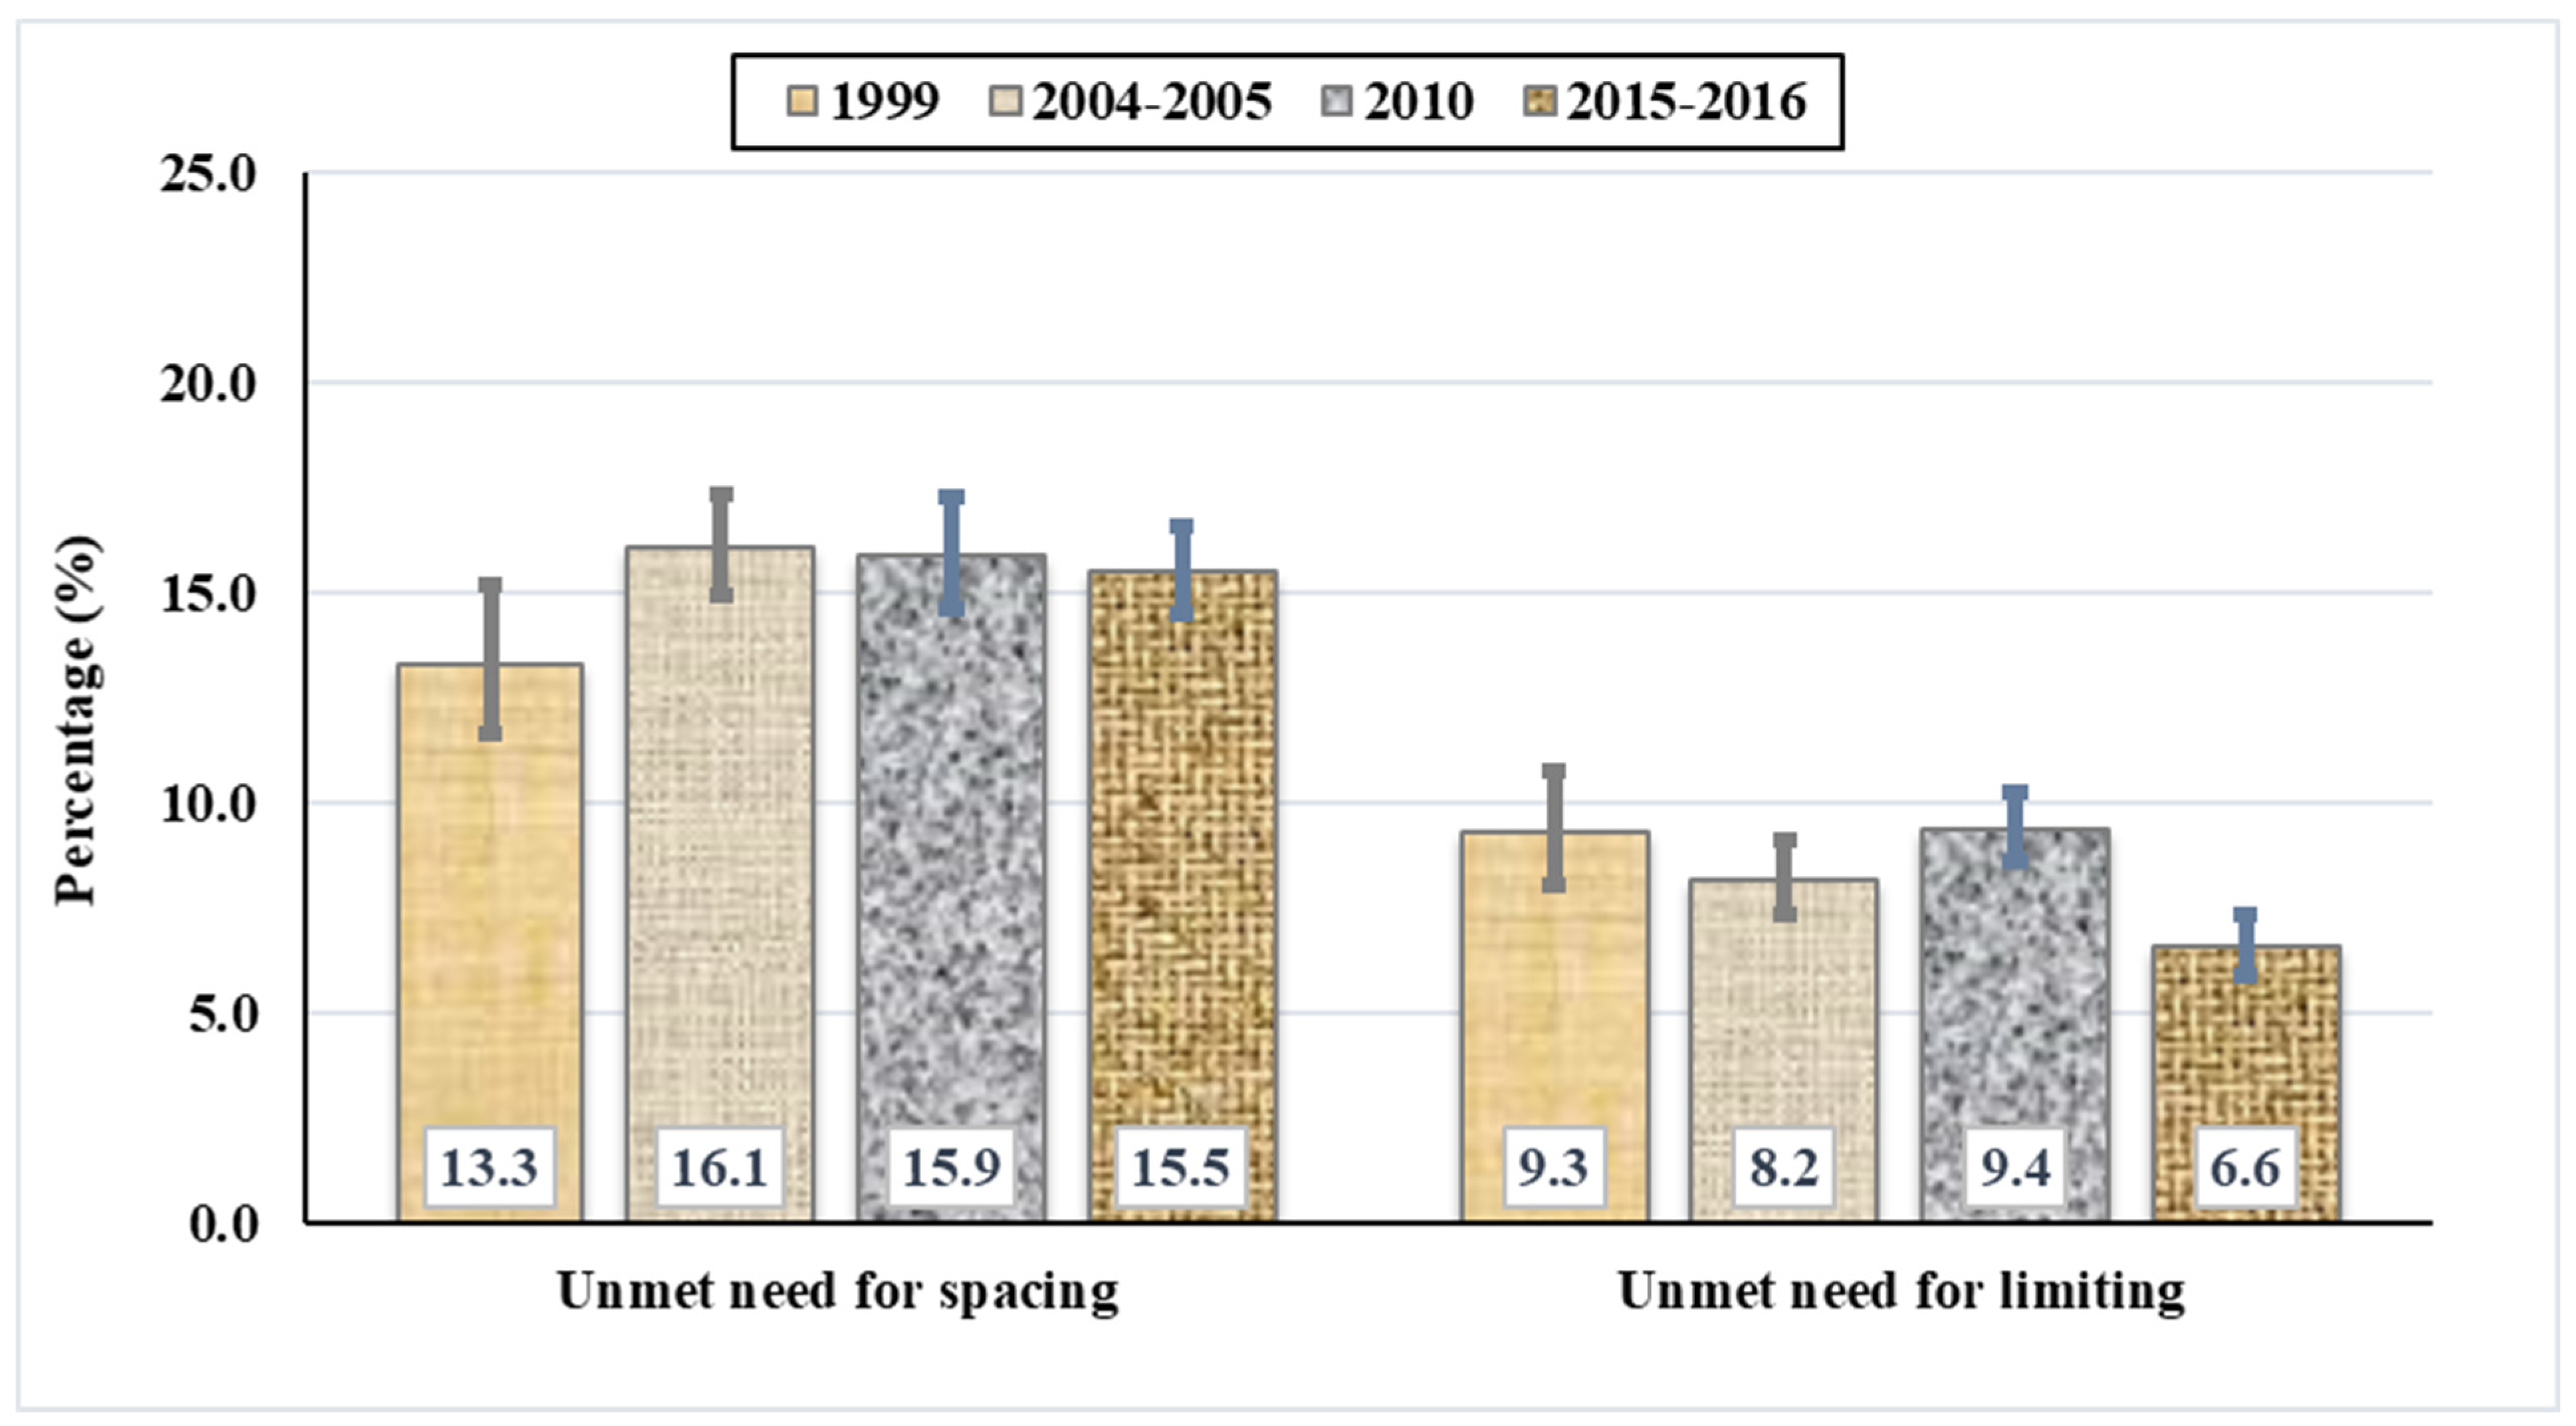
3.2. Prevalence of Unmet Need for FP among Married Tanzanian Women
3.3. Trends in Unmet Need for FP in Tanzania, 1999–2016
3.4. Factors Associated with Unmet Need for Spacing among Married Tanzanian Women
3.5. Factors Associated with Unmet Need for Limiting among Married Tanzanian Women
4. Discussion
4.1. Implications on Practice and Policy
4.2. Limitations and Strengths
5. Conclusions
Author Contributions
Funding
Institutional Review Board Statement
Informed Consent Statement
Data Availability Statement
Acknowledgments
Conflicts of Interest
References
- Brown, W.; Druce, N.; Bunting, J.; Radloff, S.; Koroma, D.; Gupta, S.; Siems, B.; Kerrigan, M.; Kress, D.; Darmstadt, G.L. Developing the “120 by 20” goal for the Global FP2020 Initiative. Stud. Fam. Plan. 2014, 45, 73–84. [Google Scholar] [CrossRef]
- World Health Organisation (WHO). Family Planning/Contraception Methods; WHO: Geneva, Switzerland, 2020. [Google Scholar]
- Bradley, S.E.; Croft, T.N.; Fishel, J.D.; Westoff, C.F. Revised definition of unmet need, currently married women. In Revising Unmet Need for Family Planning; ICF International: Calverton, MD, USA, 2012. [Google Scholar]
- Moore, Z.; Pfitzer, A.; Gubin, R.; Charurat, E.; Elliott, L.; Croft, T. Missed opportunities for family planning: An analysis of pregnancy risk and contraceptive method use among postpartum women in 21 low-and middle-income countries. Contraception 2015, 92, 31–39. [Google Scholar] [CrossRef]
- Cleland, J.; Bernstein, S.; Ezeh, A.; Faundes, A.; Glasier, A.; Innis, J. Family planning: The unfinished agenda. Lancet 2006, 368, 1810–1827. [Google Scholar] [CrossRef]
- World Health Organization (WHO). Family Planning/Contraceptive Use—Factsheet; World Health Organization: Geneva, Switzerland, 2018. [Google Scholar]
- World Health Organisation (WHO). Contraception; World Health Organization: Geneva, Switzerland, 2014. [Google Scholar]
- Ministry of Health, Community Development, Gender, Elderly and Children (Dar es Salaam); Ministry of Health (Zanzibar); National Bureau of Statistics (Dar es Salaam); Office of Chief Government Statistician (Zanzibar); ICF. Tanzania Demographic and Health Survey and Malaria Indicator Survey (TDHS-MIS) 2015–16; ICF: Rockville, MD, USA, 2016.
- World Health Organization. Trends in Maternal Mortality 2000 to 2017: Estimates by WHO, UNICEF, UNFPA, World Bank Group and the United Nations Population Division; World Health Organization: Geneva, Switzerland, 2019. [Google Scholar]
- Pile, J.M.; Simbakalia, C. Tanzania Case Study: A Successful Program Loses Momentum: Family Planning Repositioning; EngenderHealth/The ACQUIRE Project: New York, NY, USA, 2006. [Google Scholar]
- United Republic of Tanzania. Tanzania Demographic and Health Survey and Malaria Indicator Survey 2015–2016 Final Report; ICF: Rockville, MD, USA, 2016.
- Kidayi, P.L.; Msuya, S.; Todd, J.; Mtuya, C.C.; Mtuy, T.; Mahande, M.J. Determinants of modern contraceptive use among women of reproductive age in Tanzania: Evidence from Tanzania demographic and health survey data. Adv. Sex. Med. 2015, 5, 43–52. [Google Scholar] [CrossRef]
- Mosha, P.E.; Mgimwa, C.A.; Msuya, S.M. Assessment of knowledge and perception towards modern contraceptives use among women of reproductive age in Mtwivila, Tanzania. Sci. J. Public Health 2017, 5, 335. [Google Scholar] [CrossRef]
- World Health Organisation; FP2030. WHO and FP2030 to Strengthen Cooperation for Sexual and Reproductive Health and Rights. Available online: https://www.who.int/news/item/16-11-2022-who-and-fp2030-to-strengthen-cooperation-for-sexual-and-reproductive-health-and-rights (accessed on 23 January 2023).
- Hák, T.; Janoušková, S.; Moldan, B. Sustainable Development Goals: A need for relevant indicators. Ecol. Indic. 2016, 60, 565–573. [Google Scholar] [CrossRef]
- Rutstein, S.O.; Rojas, G. Guide to DHS Statistics; ORC Macro: Calverton, MD, USA, 2006; Volume 38, p. 78. [Google Scholar]
- Ministry of Health, Community Development, Gender, Elderly and Children (MoHCDGEC). Tanzania Demographic and Health Survey and Malaria Indicator Survey 2015–2016 Final Report; Ministry of Health, Community Development, Gender, Elderly and Children (MoHCDGEC): Dar Es Salaam, Tanzania, 2016.
- Ministry of Health, Community Development, Gender, Elderly and Children (MoHCDGEC). Tanzania Reproductive and Child Health Survey 1999; Ministry of Health, Community Development, Gender, Elderly and Children (MoHCDGEC): Dar Es Salaam, Tanzania, 1999.
- Ministry of Health, Community Development, Gender, Elderly and Children (MoHCDGEC). Tanzania Demographic and Health Survey 2004–2005; Ministry of Health, Community Development, Gender, Elderly and Children (MoHCDGEC): Dar Es Salaam, Tanzania, 2016.
- Ministry of Health, Community Development, Gender, Elderly and Children (MoHCDGEC). Tanzania Demographic and Health Survey 2010; Ministry of Health, Community Development, Gender, Elderly and Children (MoHCDGEC): Dar Es Salaam, Tanzania, 2011.
- Bureau National of Statistics URT. Age and Sex Distribution, 2002 Population and Housing Census; Central Census Office, National Bureau of Statistics: Dr Es Salaam, Tanzania, 2004; Volume 2.
- Central Census Office, National Bureau of Statistics. The 2002 Population and Housing Census, General Report; Central Census Office, National Bureau of Statistics: Dar Es Salaam, Tanzania, 2003.
- Bureau National of Statistics. Population Census 1988. National Profile; Bureau National of Statistics: Dar Es Salaam, Tanzania, 1989.
- Adebowale, S.A.; Palamuleni, M.E. Determinants of unmet need for modern contraception and reasons for non-use among married women in rural areas of Burkina Faso. Afr. Popul. Stud. 2014, 28, 499–514. [Google Scholar] [CrossRef]
- Letamo, G.; Navaneetham, K. Levels, trends and reasons for unmet need for family planning among married women in Botswana: A cross-sectional study. BMJ Open 2015, 5, e006603. [Google Scholar] [CrossRef]
- Mekonnen, W.; Worku, A. Determinants of low family planning use and high unmet need in Butajira District, South Central Ethiopia. Reprod. Health 2011, 8, 37. [Google Scholar] [CrossRef]
- Yaya, S.; Ghose, B. Prevalence of unmet need for contraception and its association with unwanted pregnancy among married women in Angola. PloS ONE 2018, 13, e0209801. [Google Scholar] [CrossRef]
- Tanzania National Bureau of Statistics. 2022 Population and Housing Census—Preliminary Report in Swahili Language. Available online: https://www.nbs.go.tz/index.php/en/census-surveys/population-and-housing-census/802-matokeo-ya-mwanzo-ya-sensa-ya-watu-na-makazi-ya-mwaka-2022 (accessed on 23 January 2023).
- Ali, A.A.A.; Okud, A. Factors affecting unmet need for family planning in Eastern Sudan. BMC Public Health 2013, 13, 102. [Google Scholar] [CrossRef]
- Alkema, L.; Kantorova, V.; Menozzi, C.; Biddlecom, A. National, regional, and global rates and trends in contraceptive prevalence and unmet need for family planning between 1990 and 2015: A systematic and comprehensive analysis. Lancet 2013, 381, 1642–1652. [Google Scholar] [CrossRef]
- Casterline, J.B.; Sinding, S.W. Unmet need for family planning in developing countries and implications for population policy. Popul. Dev. Rev. 2000, 26, 691–723. [Google Scholar] [CrossRef]
- Hailemariam, A.; Haddis, F. Factors affecting unmet need for family planning in southern nations, nationalities and peoples region, Ethiopia. Ethiop. J. Health Sci. 2011, 21, 77–90. [Google Scholar] [CrossRef]
- Machiyama, K.; Casterline, J.B.; Mumah, J.N.; Huda, F.A.; Obare, F.; Odwe, G.; Kabiru, C.W.; Yeasmin, S.; Cleland, J. Reasons for unmet need for family planning, with attention to the measurement of fertility preferences: Protocol for a multi-site cohort study. Reprod. Health 2017, 14, 23. [Google Scholar] [CrossRef]
- Bradley, S.E.; Croft, T.N.; Fishel, J.D.; Westoff, C.F. Revising Unmet Need for Family Planning; DHS Analytical Studies No. 25; ICF International: Calverton, MD, USA, 2012. [Google Scholar]
- Sedgh, G.; Ashford, L.S.; Hussain, R. Unmet Need for Contraception in Developing Countries: Examining Women’s Reasons for Not Using a Method; Guttmacher Institute: New York, NY, USA, 2016. [Google Scholar]
- Andersen, R.; Newman, J.F. Societal and Individual Determinants of Medical Care Utilization in the United States. Milbank Q. 2005, 83, 4. [Google Scholar] [CrossRef]
- Juarez, F.; Gayet, C.; Mejia-Pailles, G. Factors associated with unmet need for contraception in Mexico: Evidence from the National Survey of Demographic Dynamics 2014. BMC Public Health 2018, 18, 546. [Google Scholar] [CrossRef]
- Wulifan, J.K.; Mazalale, J.; Kambala, C.; Angko, W.; Asante, J.; Kpinpuo, S.; Kalolo, A. Prevalence and determinants of unmet need for family planning among married women in Ghana-a multinomial logistic regression analysis of the GDHS, 2014. Contracept. Reprod. Med. 2019, 4, 2. [Google Scholar] [CrossRef]
- Vyas, S.; Kumaranayake, L. Constructing socio-economic status indices: How to use principal components analysis. Health Policy Plan. 2006, 21, 459–468. [Google Scholar] [CrossRef]
- Ajong, A.B.; Njotang, P.N.; Yakum, M.N.; Essi, M.J.; Essiben, F.; Eko, F.E.; Kenfack, B.; Mbu, E.R. Determinants of unmet need for family planning among women in Urban Cameroon: A cross sectional survey in the Biyem-Assi Health District, Yaoundé. BMC Women’s Health 2015, 16, 4. [Google Scholar] [CrossRef]
- Fagbamigbe, A.F.; Afolabi, R.F.; Idemudia, E.S. Demand and unmet needs of contraception among sexually active in-union women in Nigeria: Distribution, associated characteristics, barriers, and program implications. Sage Open 2018, 8, 2158244017754023. [Google Scholar] [CrossRef]
- Hosseini, H.; Erfani, A.; Bagi, B. The levels and correlates of unmet need for contraception among Kurdish women in Mahabad, Iran: An application of the revised definition of unmet need. In Proceedings of the European Population Conference 2014, Budapest, Hungary, 25–28 June 2014. [Google Scholar]
- Solanke, B.L. Drivers of unmet need for family planning among women of advanced reproductive age in Urban Western Africa. Family Planning; InTech Open: London, UK, 2018. [Google Scholar]
- Croissant, Y. Estimation of Multinomial Logit Models in R: The Mlogit Packages. R Package Version 0.2-2. 2012. Available online: http://cran.r-project.org/web/packages/mlogit/vignettes/mlogit.pdf (accessed on 23 January 2023).
- Chatterjee, S.; Hadi, A.S. Influential observations, high leverage points, and outliers in linear regression. Stat. Sci. 1986, 1, 379–393. [Google Scholar]
- Hailu, D.; Tekeste, S.; Siyoum, D. Unmet Need for Modern Contraceptive Method and Associated Factors among Married Women in Mekelle City; Community Based cross Sectional Study; Research Square: Tigray, Ethiopia, 2019. [Google Scholar] [CrossRef]
- Shakya, S.; Yadav, B.C. Survey on understanding of socio-demographic factors responsible for unmet need of family planning from the selected locality in Agra. Int. Multidiscip. Res. J. 2020, 10, 7–12. [Google Scholar] [CrossRef]
- Palamuleni, M.E. Socio-economic and demographic factors affecting contraceptive use in Malawi. Afr. J. Reprod. Health 2013, 17, 91–104. [Google Scholar] [CrossRef]
- Toure, L.B. Male Involvement in Family Planning: A Review of Selected Program Initiatives in Africa; USAID: Washington, DC, USA, 1996.
- Imasiku, E.N.; Odimegwu, C.O.; Adedini, S.A.; Ononokpono, D.N. Variations in unmet need for contraception in Zambia: Does ethnicity play a role? J. Biosoc. Sci. 2014, 46, 294–315. [Google Scholar] [CrossRef] [PubMed]
- Ayele, W.; Tesfaye, H.; Gebreyes, R.; Gebreselassie, T. Trends and Determinants of Unmet Need for Family Planning and Programme Options, Ethiopia; Further Analysis of the 2000, 2005, and 2011 Demographic and Health Surveys; USAID: Washington, DC, USA, 2013.
- Teshale, A.B. Factors associated with unmet need for family planning in sub-Saharan Africa: A multilevel multinomial logistic regression analysis. PloS ONE 2022, 17, e0263885. [Google Scholar] [CrossRef]
- Nzokirishaka, A.; Itua, I. Determinants of unmet need for family planning among married women of reproductive age in Burundi: A cross-sectional study. Contracept. Reprod. Med. 2018, 3, 11. [Google Scholar] [CrossRef]
- Ajmal, S.; Idris, A.; Ajmal, B. Factors affecting contraceptive use and unmet need among currently married women in Afghanistan: Further analysis of the 2015 Afghanistan Demographic and Health Survey. J. Glob. Health Rep. 2018, 2, e2018037. [Google Scholar] [CrossRef]
- Jahangir, Y.T.; Arora, A.; Liamputtong, P.; Nabi, M.H.; Meyer, S.B. Provider Perspectives on Sexual Health Services Used by Bangladeshi Women with mHealth Digital Approach: A Qualitative Study. Int. J. Environ. Res. Public Health 2020, 17, 6195. [Google Scholar] [CrossRef]
- WHO. SDG 3: Ensure Healthy Lives and Promote Wellbeing for All at All Ages 2016; World Health Organization: Geneva, Switzerland, 2019. [Google Scholar]
- Tadele, A.; Abebaw, D.; Ali, R. Predictors of unmet need for family planning among all women of reproductive age in Ethiopia. Contracept. Reprod. Med. 2019, 4, 6. [Google Scholar] [CrossRef]
- Ntenda, P.A. Factors associated with contraceptive use and intention to use contraceptives among married women in Ethiopia. Women Health 2016, 56, 1–22. [Google Scholar]
- Austin, A. Unmet contraceptive need among married Nigerian women: An examination of trends and drivers. Contraception 2015, 91, 31–38. [Google Scholar] [CrossRef] [PubMed]
- Mahoro, J. Unmet need among married women: Examining socio-religious influences on family planning use in Rwanda, 2005–2015. Int. J. Hum. Rights Healthc. 2018, 11, 380–391. [Google Scholar] [CrossRef]
- Ojakaa, D. Trends and Determinants of Unmet Need for Family Planning in Kenya; Macro International Incorporated: Irvine, CA, USA, 2008. [Google Scholar]
- Chafo, K.; Doyore, F. Unmet need for family planning and associated factors among currently married women in Misha District, southern Ethiopia: A cross sectional study. J. Women’s Health Care 2014, 3, 1000165. [Google Scholar] [CrossRef]
- Malarcher, S.; Polis, C.B. Using measurements of unmet need to inform program investments for health service integration. Stud. Fam. Plan. 2014, 45, 263–275. [Google Scholar] [CrossRef] [PubMed]
- Gebreselassie, T.; Govindasamy, P. Levels and Trends in Unmet Need for Family Planning among Adolescents and Young Women in Ethiopia; ICF International: Calverton, MD, USA, 2013; pp. 11–14. [Google Scholar]
- Duressa, L.; Getahun, A.; Regassa, T.; Babure, Z.; Bidu, K. Unmet need for family planning and related factors among currently married women in Sibu Sire district, 2016. J. Women’s Health Care 2018, 7, 1000446. [Google Scholar] [CrossRef]
- Guure, C.; Maya, E.T.; Dery, S.; da-Costa Vrom, B.; Alotaibi, R.M.; Rezk, H.R.; Yawson, A. Factors influencing unmet need for family planning among Ghanaian married/union women: A multinomial mixed effects logistic regression modelling approach. Arch. Public Health 2019, 77, 11. [Google Scholar] [CrossRef]
- Magure, T.M.; Manene, T.; Munjanja, S.P.; Bradley, S.E.; Mishra, V. Trends in Unmet Need and the Demand for Family Planning in Zimbabwe; Zimbabwe Working Papers; USAID: Washington, DC, USA, 2010.
- Kumar, A.; Singh, A. Trends and determinants of unmet need for family planning in Bihar (India): Evidence from National Family Health Surveys. Adv. Appl. Sociol. 2013, 3, 157. [Google Scholar] [CrossRef]
- Wulifan, J.K.; Brenner, S.; Jahn, A.; De Allegri, M. A scoping review on determinants of unmet need for family planning among women of reproductive age in low and middle income countries. BMC Women’s Health 2015, 16, 2. [Google Scholar] [CrossRef]
- Sah, R.K. The effects of child mortality changes on fertility choice and parental welfare. J. Political Econ. 1991, 99, 582–606. [Google Scholar] [CrossRef]
- Kalemli-Ozcan, S. A stochastic model of mortality, fertility, and human capital investment. J. Dev. Econ. 2003, 70, 103–118. [Google Scholar] [CrossRef]
- Barro, R.J.; Becker, G.S. Fertility choice in a model of economic growth. Econom. J. Econom. Soc. 1989, 57, 481–501. [Google Scholar] [CrossRef]
- Asif, M.F.; Pervaiz, Z. Socio-demographic determinants of unmet need for family planning among married women in Pakistan. BMC Public Health 2019, 19, 1226. [Google Scholar] [CrossRef]
- Worku, S.A.; Ahmed, S.M.; Mulushewa, T.F. Unmet need for family planning and its associated factor among women of reproductive age in Debre Berhan Town, Amhara, Ethiopia. BMC Res. Notes 2019, 12, 143. [Google Scholar] [CrossRef]
- United Republic of Tanzania. Tanzania—Rural Electrification Expansion Project (English), Dar Es Salaam, Tanzania 2016; World Bank: Dar Es Salaam, Tanzania, 2019.
- Yaya, S.; Uthman, O.A.; Ekholuenetale, M.; Bishwajit, G. Women empowerment as an enabling factor of contraceptive use in sub-Saharan Africa: A multilevel analysis of cross-sectional surveys of 32 countries. Reprod. Health 2018, 15, 214. [Google Scholar] [CrossRef] [PubMed]
- Blackstone, S.R. Women’s empowerment, household status and contraception use in Ghana. J. Biosoc. Sci. 2017, 49, 423–434. [Google Scholar] [CrossRef] [PubMed]
- Upadhyay, U.D.; Karasek, D. Women’s empowerment and ideal family size: An examination of DHS empowerment measures in Sub-Saharan Africa. Int. Perspect. Sex. Reprod. Health 2012, 38, 78–89. [Google Scholar] [CrossRef]
- Do, M.; Kurimoto, N. Women’s empowerment and choice of contraceptive methods in selected African countries. Int. Perspect. Sex. Reprod. Health 2012, 38, 23–33. [Google Scholar] [CrossRef]
- Lowe, M.; Chen, D.-R.; Huang, S.-L. Social and cultural factors affecting maternal health in rural Gambia: An exploratory qualitative study. PloS ONE 2016, 11, e0163653. [Google Scholar] [CrossRef]
- Bongaarts, J. The impact of family planning programs on unmet need and demand for contraception. Stud. Fam. Plan. 2014, 45, 247–262. [Google Scholar] [CrossRef]
- Mumah, J.; Machiyama, K.; Kabiru, C.W.; Odwe, G.; Obare, F.; Huda, F.A.; Casterline, J.B.; Cleland, J.C. Reasons for Unmet Need for Family Planning, with Attention to the Measurement of Fertility Preferences in Kenya and Bangladesh; Population Council: New York, NY, USA, 2017. [Google Scholar]


| Variables | 1999 (N = 2653) | 2004/2005 (N = 6950) | 2010 (N = 6412) | 2015/2016 (N = 8210) | 1999–2016 (N = 24,225) |
|---|---|---|---|---|---|
| n (%) | n (%) | n (%) | n (%) | n (%) | |
| Community-level factors | |||||
| Place of residence | |||||
| Urban | 622 (23.4) | 1647 (23.7) | 1585 (24.7) | 2535 (30.9) | 6388 (26.4) |
| Rural | 2031 (76.6) | 5303 (76.3) | 4827 (75.3) | 5675 (69.1) | 17,836 (73.6) |
| Sociodemographic factors | |||||
| Mother’s age | |||||
| 15–24 years | 777 (29.3) | 1990 (28.6) | 1610 (25.1) | 2146 (26.1) | 6523 (26.9) |
| 25–34 years | 1022 (38.5) | 2803 (40.3) | 2475 (38.6) | 2994 (36.5) | 9295 (38.4) |
| 35–49 years | 854 (32.2) | 2157 (31.0) | 2327 (36.3) | 3070 (37.4) | 8407 (34.7) |
| Parity | |||||
| Zero | 225 (8.5) | 551 (8.0) | 377 (5.9) | 592 (7.2) | 1745 (7.2) |
| 1–4 | 1530 (57.7) | 4122 (59.3) | 3893 (60.7) | 5030 (61.2) | 14,575 (60.2) |
| 5+ | 897 (33.8) | 2277 (32.8) | 2141 (33.4) | 2587 (31.5) | 7903 (32.6) |
| Mother’s education | |||||
| No schooling | 840 (31.7) | 1994 (28.7) | 1524 (23.8) | 1559 (19.0) | 5918 (24.4) |
| Primary education or higher | 1813 (68.3) | 4956 (71.3) | 4887 (76.2) | 6651 (81.0) | 18,307 (75.6) |
| Mother’s employment status | |||||
| No employment | 460 (17.4) | 791 (11.4) | 815 (12.7) | 1657 (20.2) | 3722 (15.4) |
| Formal employment | 92 (3.5) | 316 (4.6) | 339 (5.3) | 629 (7.7) | 1376 (5.6) |
| Informal employment | 2097 (79.2) | 5842 (84.0) | 5252 (82.0) | 5924 (72.1) | 19,115 (79.0) |
| Partner’s education | |||||
| No schooling | - | 1291 (18.6) | 998 (15.6) | 1003 (12.2) | 3292 (15.3) |
| Primary school | - | 4991 (71.9) | 4653 (72.7) | 5612 (68.5) | 15,256 (70.8) |
| Secondary education or higher | - | 655 (9.5) | 748 (11.7) | 1584 (19.3) | 2987 (13.9) |
| Partner’s employment status | |||||
| No employment | - | 44 (0.6) | 53 (0.8) | 247 (3.0) | 344 (1.6) |
| Formal employment | - | 648 (9.3) | 826 (12.9) | 1030 (12.6) | 2504 (11.6) |
| Informal employment | - | 6255 (90.1) | 5513 (86.3) | 6933 (84.4) | 18,701 (86.8) |
| Household wealth status | |||||
| Poor | 1439 (57.8) | 3987 (57.4) | 1119 (46.7) | 1441 (37.9) | 7986 (51.1) |
| Middle | 740 (29.7) | 1873 (27.0) | 815 (34.0) | 1580 (41.6) | 5008 (32.0) |
| Rich | 312 (12.5) | 1085 (15.6) | 462 (19.3) | 781 (20.5) | 2640 (16.9) |
| Number of partners | |||||
| One | 2008 (76.8) | 5536 (79.6) | 5146 (81.00) | 6741 (82.1) | 19,431 (80.4) |
| More than one | 608 (23.2) | 1415 (20.4) | 1241 (19.0) | 1466 (17.9) | 4731 (19.6) |
| Health knowledge factor | |||||
| Listening to radio | |||||
| No | - | 1708 (24.6) | 1764 (27.5) | 1918 (23.4) | 5389 (25.0) |
| Yes | - | 5238 (75.4) | 4645 (72.5) | 6292 (76.6) | 16,275 (75.0) |
| Watch Television | |||||
| No | - | 5403 (77.8) | 4529 (70.7) | 4436 (54.0) | 14,368 (66.6) |
| Yes | - | 1541 (22.2) | 1882 (29.4) | 3775 (46.0) | 7198 (33.4) |
| Reading newspapers/Magazines | |||||
| No | - | 4566 (65.7) | 4298 (67.1) | 5041 (61.4) | 13,905 (64.5) |
| Yes | - | 2379 (34.3) | 2106 (32.9) | 3168 (38.6) | 7654 (35.5) |
| Visited by HC workers within last 12 month | |||||
| No | 2463 (93.0) | 6721 (96.7) | 6100 (95.2) | 7883 (96.0) | 23,167 (95.7) |
| Yes | 186 (7.0) | 228 (3.3) | 307 (4.8) | 327 (4.0) | 1048 (4.3) |
| Visited health facility for any health services within last 12 month | |||||
| No | 947 (35.7) | 2788 (40.1) | 2093 (32.7) | 2464 (30.0) | 8292 (34.2) |
| Yes | 1702 (64.3) | 4162 (59.9) | 4315 (67.3) | 5742 (70.0) | 15,921 (65.8) |
| Enabling factors | |||||
| Distance to health facilities | |||||
| Big problem | - | 2775 (40.0) | 5088 (79.5) | 3692 (45.0) | 11,553 (53.6) |
| Not a big problem | - | 4170 (60.0) | 1308 (20.5) | 4519 (55.0) | 9997 (46.4) |
| Mother’s autonomy | |||||
| Involved in all three household decisions | - | 3306 (47.6) | 3088 (48.2) | 4671 (56.9) | 11,065 (51.3) |
| Not involved in all three household decisions | - | 3645 (52.4) | 3324 (51.8) | 3540 (43.1) | 10,509 (48.7) |
| Household head | |||||
| Male | 2320 (87.5) | 6054 (87.1) | 5700 (88.9) | 7343 (89.4) | 21,417 (88.4) |
| Female | 333 (12.5) | 896 (12.9) | 711 (11.1) | 868 (10.6) | 2807 (11.6) |
| Need factors | |||||
| Future plan to have more children | |||||
| Want no more | 865 (32.6) | 2220 (32.0) | 2055 (32.1) | 2582 (31.5) | 7722 (31.9) |
| Want within 2 years | 744 (28.0) | 1639 (23.6) | 1365 (21.3) | 1814 (22.1) | 5561 (22.0) |
| Want after 2+ years | 944 (35.6) | 2903 (41.8) | 2791 (43.6) | 3468 (42.2) | 10,106 (41.7) |
| Not sure | 100 (3.8) | 186 (2.7) | 187 (3.0) | 347 (4.2) | 820 (3.4) |
| Variables | 1999 (N = 354) | 2004/2005 (N = 1117) | 2010 (N = 1021) | 2015/2016 (N = 1275) | 1999–2016 (N = 3767) | 1999–2016 |
|---|---|---|---|---|---|---|
| n (%) | n (%) | n (%) | n (%) | n (%) | % Change (95% CI) | |
| Community-level factors | ||||||
| Place of residence | ||||||
| Urban | 81 (13.1) | 190 (11.5) | 179 (11.3) | 335 (13.2) | 784 (12.3) | 0.2 (−3.9, 4.2) |
| Rural | 272 (13.4) | 928 (17.5) | 843 (17.5) | 941 (16.6) | 2983 (16.7) | 3.2 (0.8, 5.6) |
| Sociodemographic factors | ||||||
| Mother’s age | ||||||
| 15–24 years | 140 (18.1) | 430 (21.6) | 349 (21.7) | 469 (21.9) | 1389 (21.3) | 3.8 (−0.2, 7.9) |
| 25–34 years | 172 (16.8) | 530 (18.9) | 479 (19.3) | 565 (18.9) | 1746 (18.8) | 2.1 (−1.4, 5.5) |
| 35–49 years | 42 (4.9) | 157 (7.3) | 194 (8.3) | 241 (7.8) | 633 (7.5) | 2.9 (0.8, 5.2) |
| Parity | ||||||
| None | 10 (4.5) | 15 (2.7) | 12 (3.2) | 26 (4.4) | 63 (3.6) | −0.1 (−3.7, 3.4) |
| 1–4 children | 258 (16.9) | 807 (19.6) | 700 (18.0) | 887 (17.6) | 2652 (18.2) | 0.7 (−2.3, 3.8) |
| 5+ children | 85 (9.5) | 295 (13.0) | 310 (14.5) | 363 (14.7) | 1052 (13.3) | 4.5 (1.9 (7.2) |
| Mother’s education | ||||||
| No schooling | 85 (10.2) | 289 (14.5) | 289 (18.9) | 281 (18.0) | 944 (16.0) | 7.8 (3.8, 11.8) |
| Primary school and above | 268 (14.8) | 828 (16.7) | 733 (15.0) | 995 (15.0) | 2824 (15.4) | 0.2 9–2.1, 2.4) |
| Mother’s employment status | ||||||
| No employment | 88 (19.2) | 124 (15.7) | 174 (21.4) | 313 (19.0) | 699 (18.8) | −0.2 (−5.8, 5.3) |
| Formal employment | 8 (8.3) | 32 (10.0) | 31 (9.0) | 61 (9.7) | 131 (9.5) | 1.4 (−5.2, 7.9) |
| Informal employment | 258 (12.3) | 962 (16.5) | 817 (15.6) | 901 (15.2) | 2937 (15.6) | 2.9 (0.7, 5.1) |
| Partner’s education | ||||||
| No schooling | - | 168 (13.00 | 181 (18.1) | 192 (19.2) | 541 (16.4) | |
| Primary school | - | 874 (17.5) | 773 (16.6) | 884 (15.8) | 2531 (16.6) | |
| Secondary and higher | - | 72 (10.9) | 68 (9.0) | 199 (12.5) | 338 (11.3) | |
| Partner’s employment status | ||||||
| No employment | - | 5 (10.2) | 3 (4.9) | 37 (14.9) | 44 (12.8) | |
| Formal employment | - | 88 (13.5) | 90 (10.9) | 115 (11.2) | 293 (11.7) | |
| Informal employment | - | 1024 (16.4) | 919 (16.7) | 1123 (16.2) | 3065 (16.4) | |
| Household wealth status | ||||||
| Poor | 192 (13.4) | 664 (16.6) | 236 (21.1) | 296 (20.6) | 1388 (17.4) | 7.2 (3.7, 10.7) |
| Middle | 94 (12.7) | 320 (17.1) | 134 (16.4) | 191 (12.1) | 738 (14.7) | −0.6 (−4.5, 3.3) |
| Rich | 43 (13.8) | 134 (12.3) | 32 (6.9) | 69 (8.9) | 278 (10.5) | −4.9 (−10.8, 1.1) |
| Number of partners | ||||||
| One | 289 (14.4) | 934 (16.9) | 866 (16.8) | 1098 (16.3) | 3187 (16.4) | 1.9 (−0.5, 4.2) |
| More than one | 59 (9.7) | 183 (13.0) | 155 (14.6) | 178 (12.1) | 575 (12.1) | 2.4 (−2.0, 6.8) |
| Health knowledge factor | ||||||
| Listening to radio | ||||||
| No | - | 278 (16.3) | 331 (18.8) | 335 (17.5) | 944 (17.5) | |
| Yes | - | 838 (16.0) | 690 (14.9) | 940 (15.0) | 2469 (15.3) | |
| Watch Television | ||||||
| No | - | 914 (16.9) | 799 (17.7) | 789 (17.8) | 2502 (17.4) | |
| Yes | - | 202 (13.1) | 222 (11.8) | 486 (12.9) | 910 (12.6) | |
| Reading newspapers/Magazines | ||||||
| No | - | 743 (16.3) | 735 (17.0) | 855 (17.0) | 2330 (16.8) | |
| Yes | - | 374 (15.7) | 289 (13.7) | 421 (13.3) | 1083 (14.2) | |
| Visited by HC workers within last 12 month | ||||||
| No | 324 (13.2) | 1076 (16.0) | 966 (15.8) | 1246 (15.8) | 3611 (15.6) | 2.6 90.6, 4.8) |
| Yes | 30 (16.0) | 42 (18.2) | 55 (17.9) | 30 (9.0) | 156 (14.9) | −7.0 (−16.2, 2.3) |
| Visited health facility within last 12 month | ||||||
| No | 89 (9.4) | 300 (10.8) | 243 (11.6) | 289 (11.7) | 922 (11.1) | 2.3 (0.5, 5.1) |
| Yes | 264 (15.5) | 817 (19.6) | 777 (18.0) | 986 (17.2) | 2844 (17.9) | 1.7 (−0.9, 4.2) |
| Enabling factors | ||||||
| Distance to health facilities | ||||||
| Big problem | - | 440 (15.9) | 572 (15.3) | 625 (16.9) | 572 (15.3) | |
| Not a big problem | - | 677 (16.2) | 227 (16.8) | 651 (14.4) | 1292 (16.5) | |
| Mother’s autonomy | ||||||
| Involved in all three household decisions | - | 487 (14.7) | 437 (14.2) | 663 (14.2) | 1587 (14.3) | |
| Not involved in all three household decisions | - | 631 (17.3) | 585 (17.6) | 612 (17.3) | 1827 (17.4) | |
| Household head | ||||||
| Male | 307 (13.2) | 979 (16.2) | 896 (15.7) | 1134 (15.4) | 3315 (15.5) | 22.0 (−0.2, 45.9) |
| Female | 46 (13.9) | 139 (15.5) | 126 (17.7) | 141 (16.3) | 452 (16.1) | 23.7 (−4.9, 9.6) |
| Need factors | ||||||
| Future plan to have more children | ||||||
| Want no more | 42 (4.9) | 167 (7.5) | 148 (7.2) | 150 (5.8) | 508 (6.6) | 0.9 (−1.0, 3.0) |
| Want within 2 years | 3 (0.4) | 9 (0.5) | 17 (1.2) | 7 (0.4) | 35 (0.6) | 0.0 (−0.6, 0.6) |
| Want after 2+ years | 278 (29.4) | 874 930.1) | 777 927.8) | 1019 (29.4) | 2947 (29.2) | 0.0 (−4.5, 4.1) |
| Not sure | 31 (30.7) | 67 (36.1) | 80 (43.0) | 99 (28.5) | 277 (33.8) | −2.2 (14.1, 9.7) |
| Variables | 1999 (N = 246) | 2004/2005 (N = 569) | 2010 (N = 601) | 2015/2016 (N = 540) | 1999–2016 (N = 1956) | 1999–2016 |
|---|---|---|---|---|---|---|
| n (%) | n (%) | n (%) | n (%) | n (%) | % Change (95% CI) | |
| Community-level factors | ||||||
| Place of residence | ||||||
| Urban | 45 (7.2) | 129 (7.8) | 131 (8.3) | 166 (6.5) | 470 (7.4) | −0.6 (−3.0, 1.7) |
| Rural | 202 (9.9) | 440 (8.3) | 470 (9.7) | 375 (6.6) | 1486 (8.3) | −3.3 (−5.2, −1.5) |
| Sociodemographic factors | ||||||
| Mother’s age | ||||||
| 15–24 years | 27 (3.4) | 35 (1.8) | 16 (1.0) | 20 (1.0) | 98 (1.5) | −2.5 (−4.1, −0.8) |
| 25–34 years | 82 (8.0) | 160 (5.7) | 92 (3.7) | 102 (3.4) | 435 (4.7) | −4.6 (−6.9, −2.3) |
| 35–49 years | 138 (16.1) | 375 (17.4) | 493 (21.2) | 418 (13.6) | 1423 (16.9) | −2.5 (−6.3, 1.3) |
| Parity | ||||||
| Zero | 567 (0.3) | 3 (0.5) | 0 (0.0) | 1 (0.0) | 3 (0.2) | −0.2 (−0.7, 0.3) |
| 1–4 | 92 (6.0) | 134 (3.2) | 138 (3.4) | 158 (3.1) | 522 (3.6) | −2.9 (−4.7, −1.1) |
| 5+ | 153 (17.1) | 433 (19.0) | 463 (21.6) | 381 (14.7) | 1430 (18.1) | −2.3 (−5.9, 1.2) |
| Mother’s education | ||||||
| No schooling | 99 (11.8) | 193 (9.7) | 169 (11.1) | 132 (8.4) | 593 (10.0) | −3.4 (−6.4, −0.4) |
| Primary school and above | 147 (8.1) | 377 (7.6) | 432 (8.9) | 409 (6.1) | 1363 (7.5) | −1.9 (−3.7, −0.1) |
| Mother’s employment status | ||||||
| No employment | 35 (7.6) | 50 (6.3) | 67 (8.3) | 92 95.5) | 244 (6.6) | −2.1 (−6.2, 2.0) |
| Formal employment | 12 (12.9) | 20 (6.3) | 20 (6.0) | 39 96.2) | 91 (6.6) | −6.7 (−2.1, 7.3) |
| Informal employment | 199 (9.5) | 499 98.5) | 512 (9.8) | 410 96.9) | 1620 (8.5) | −2.6 (−4.4, −0.8) |
| Partner’s education | ||||||
| No schooling | - | 120 (9.3) | 122 (12.2) | 67 (6.7) | 309 (9.4) | |
| Primary school | - | 409 (8.2) | 427 (9.2) | 388 (6.9) | 1224 (8.0) | |
| Secondary and higher | - | 39 (6.0) | 52 (7.0) | 85 (5.4) | 176 (5.9) | |
| Partner’s employment status | ||||||
| No employment | - | 1 (2.3) | 4 (7.1) | 17 (6.9) | 22 (6.3) | |
| Formal employment | - | 44 (6.9) | 88 (10.6) | 54 95.3) | 186 (7.4) | |
| Informal employment | - | 524 (8.4) | 509 (9.2) | 469 96.8) | 1502 (8.0) | |
| Household wealth status | ||||||
| Poor | 145 (10.1) | 328 (8.2) | 100 (8.9) | 76 (5.3) | 649 (8.1) | −4.8 (−7.3, −2.3) |
| Middle | 66 (8.9) | 173 (9.2) | 77 (9.5) | 89 (5.7) | 405 (8.1) | −3.2 (−6.3, −0.1) |
| Rich | 26 (8.3) | 67 (6.2) | 32 (6.8) | 47 (6.0) | 172 (6.5) | −2.3 (−7.3, 2.7) |
| Number of partners | ||||||
| One | 194 (9.6) | 348 (7.9) | 444 (8.6) | 425 (6.3) | 1500 (7.7) | −3.3 (−5.2, −1.9) |
| More than one | 49 (8.0) | 132 (9.3) | 157 (25.8) | 115 (7.9) | 452 (9.4) | −0.2 (−3.0, 2.7) |
| Health knowledge factor | ||||||
| Listening to radio | ||||||
| No | - | 174 (10.2) | 220 (12.5) | 149 (7.8) | 543 (10.1) | |
| Yes | - | 394 (7.5) | 381 (8.2) | 391 (6.2) | 1166 (7.2) | |
| Watch Television | ||||||
| No | - | 477 (8.8) | 479 (10.6) | 331 (7.5) | 1287 (9.0) | |
| Yes | - | 91 (5.9) | 122 (6.5) | 209 (5.5) | 422 (5.9) | |
| Reading newspapers/Magazines | ||||||
| No | - | 394 (8.6) | 438 (10.2) | 386 (7.7) | 1217 (8.8) | |
| Yes | - | 176 (7.4) | 163 (7.8) | 153 (4.8) | 492 (6.4) | |
| Visited by HC workers within last 12 month | ||||||
| No | 230 (9.3) | 540 (8.0) | 577 (9.5) | 519 (6.6) | 1866 (8.1) | −2.8 (−4.4, −1.2) |
| Yes | 16 (8.5) | 29 (12.8) | 24 (7.9) | 21 (6.5) | 90 (8.6) | −2.1 (−7.8, 3.6) |
| Visited health facility for any health services within last 12 month | ||||||
| No | 89 (9.4) | 208 (7.5) | 292 (13.9) | 162 (6.6) | 750 (9.1) | −2.8 (−5.7, −0.0) |
| Yes | 157 (9.2) | 361 (8.7) | 309 (7.2) | 379 (6.6) | 1206 (7.6) | −2.6 (−4.6, −0.7) |
| Enabling factors | ||||||
| Distance to health facilities | ||||||
| Big problem | - | 240 (8.6) | 346 (9.3) | 243 (6.6) | 346 (9.3) | |
| Not a big problem | - | 330 (7.9) | 121 (8.9) | 297 (6.6) | 604 (7.7) | |
| Mother’s autonomy | ||||||
| Involved in all three household decisions | - | 299 (9.0) | 318 (10.3) | 360 (7.7) | 977 (8.8) | |
| Not involved in all three household decisions | - | 270 (7.4) | 283 (8.5) | 180 (5.1) | 733 (7.0) | |
| Household head | ||||||
| Male | 203 (8.7) | 472 (7.8) | 529 (9.3) | 463 (6.3) | 1666 (7.8) | −2.4 (−4.0, −0.8) |
| Female | 43 (13.1) | 98 (10.9) | 72 (10.2) | 77 (8.9) | 291 (10.4) | −4.2 (−9.4, 1.1) |
| Need factors | ||||||
| Future plan to have more children | ||||||
| Want no more | 222 (25.7) | 541 (24.4) | 597 (29.0) | 536 (20.8) | 1896 (24.6) | −4.9 (−9.6, −0.2) |
| Want within 2 years | 0 (0.0) | 5 (0.3) | 0 (0.0) | 0 (0.0) | 5 (0.008) | |
| Want after 2+ years | 21 (2.2) | 18 (0.6) | 3 (0.1) | 2 (0.06) | 45 (0.4) | −2.2 (−3.5, −0.8) |
| Not sure | 3 (2.0) | 5 (2.7 | 1 (0.06) | 2 (0.6) | 11 (1.4) | −2.4 (−5.9, 1.0) |
| Variables | 1999 (N = 354) | 2004/2005 (N = 1117) | 2010 (N = 1021) | 2015/2016 (N = 1275) | 1999–2016 (N = 3767) | p for Trend |
|---|---|---|---|---|---|---|
| aOR (95% CI) | aOR (95% CI) | aOR (95% CI) | aOR (95% CI) | aOR (95% CI) | ||
| Community-level factors | ||||||
| Place of residence | ||||||
| Urban | 1.00 | 1.00 | 1.00 | 1.00 | 1.00 | 0.780 |
| Rural | 1.18 (0.64–2.02) | 1.55 (1.17–2.05) | 1.511 (0.96–2.37) | 1.13 (0.83–1.55) | 1.41 (1.15–1.71) ** | 0.145 |
| Sociodemographic factors | ||||||
| Mother’s age | ||||||
| 15–24 years | 1.00 | 1.00 | 1.00 | 1.00 | 1.00 | 0.146 |
| 25–34 years | 1.22 (0.79–1.88) | 0.84 (0.68–1.04) | 0.74 (0.52–1.05) | 0.71 (0.51–0.99) | 0.79 (0.68–0.92) ** | 0.864 |
| 35–49 years | 0.68 (0.34–1.36) | 0.41 (0.29–0.58) | 0.42 (0.25–0.69) | 0.54 (0.35–0.83) | 0.44 (0.34–0.55) ** | 0.584 |
| Parity | ||||||
| Zero | 1.00 | 1.00 | 1.00 | 1.00 | 1.00 | 0.298 |
| 1–4 | 2.50 (1.18–5.30) | 5.52 (3.09–9.87) | 13.95 (4.08–47.76) | 2.87 (1.49–5.54) | 4.67 (3.05–7.17) ** | 0.535 |
| 5+ | 2.26 (0.95–5.41) | 7.18 (3.89–13.25) | 20.42 (5.48–76.01) | 3.98 (1.92–8.24) | 6.22 (3.94–9.81) ** | 0.236 |
| Mother’s education | ||||||
| No schooling | 0.00 | 1.00 | 1.00 | 1.00 | 1.00 | 0.267 |
| Primary school and above | 0.98 (0.64–1.50) | 0.93 (0.75–1.16) | 1.02 (0.69–1.50) | 1.01 (0.68–1.48) | 0.98 (0.83–1.16) ** | 0.476 |
| Mother’s employment status | ||||||
| No employment | 1.00 | 1.00 | 1.00 | 1.00 | 1.00 | 0.987 |
| Formal employment | 0.47 (0.22–1.01) | 0.92 (0.49–1.70) | 0.51 (0.26–0.97) | 0.54 (0.34–0.85) | 0.60 (0.44–0.84) ** | 0.124 |
| Informal employment | 0.66 (0.44–0.99) | 0.85 (0.64–1.11) | 0.43 (0.29–0.64) | 0.79 (0.59–1.07) | 0.68 (0.57–0.81) ** | 0.133 |
| Partner’s education * | ||||||
| No schooling | - | 1.00 | 1.00 | 1.00 | 1.00 | 0.004 |
| Primary school | - | 1.25 (0.94–1.66) | 1.00 (0.69–1.45) | 0.89 (0.58–1.40) | 1.12 (0.91–1.38) | 0.910 |
| Secondary and higher | - | 0.85 (0.53–1.35) | 0.80 (0.42–1.54) | 0.73 (0.43–1.03) | 0.85 (0.63–1.14) | 0.316 |
| Partner’s employment status * | ||||||
| No employment | - | 1.00 | 1.00 | 1.00 | 1.00 | 0.873 |
| Formal employment | - | 0.89 (0.34–2.38) | 1.42 (0.34–5.99) | 1.03 (0.53–1.99) | 1.07 (0.61–1.88) | 0.003 |
| Informal employment | - | 0.87 (0.34–2.18) | 1.94 (0.50–7.44) | 1.32 (0.68–2.56) | 1.27 (0.73–2.22) | 0.024 |
| Household wealth status * | ||||||
| Poor | 1.00 | 1.00 | 1.00 | 1.00 | 1.00 | 0.000 |
| Middle | 0.84 (0.55–1.28) | 1.11 (0.90–1.37) | 0.81 (0.57–1.16) | 0.87 (0.63–1.21) | 0.98 (0.84–1.15) | 0.068 |
| Rich | 0.91 (90.47–0.73) | 1.04 (0.76–1.43) | 0.42 (0.21–0.81) | 0.99 (0.59–1.69) | 0.89 (0.69–1.16) | 0.262 |
| Number of partners | ||||||
| One | 1.00 | 1.00 | 1.00 | 1.00 | 1.00 | 0.268 |
| More than one | 0.99 (0.59–1.64) | 1.14 (0.92–1.39) | 1.43 (0.95–2.17) | 1.04 (0.74–1.45) | 1.17 (0.99–1.38) | 0.324 |
| Health knowledge factor | ||||||
| Listening to radio * | ||||||
| No | - | 1.00 | 1.00 | 1.00 | 1.00 | 0.012 |
| Yes | - | 1.01 (0.82–1.24) | 1.22 (0.81–1.84) | 0.93 (0.68–1.28) | 1.00 (0.85–1.18) | 0.936 |
| Watch Television * | ||||||
| No | - | 1.00 | 1.00 | 1.00 | 1.00 | 0.029 |
| Yes | - | 0.74 (0.58–0.96) | 0.95 (0.62–1.47) | 0.69 (0.52–0.94) | 0.75 (0.63–0.89) ** | 0.443 |
| Reading newspapers/Magazines * | ||||||
| No | - | 1.00 | 1.00 | 1.00 | 1.00 | 0.131 |
| Yes | - | 1.12 (0.92–1.37) | 0.95 (0.65–1.39) | 0.92 (0.68–1.25) | 1.01 (0.87–1.18) | 0.656 |
| Visited by HC workers within last 12 month | ||||||
| No | 1.00 | 1.00 | 1.00 | 1.00 | 1.00 | 0.102 |
| Yes | 1.13 (0.49–2.58) | 0.97 (0.62–1.51) | 1.16 (0.63–2.15) | 0.28 (0.12–0.67) | 0.77 (0.55–1.07) | 0.027 |
| Visited health facility for any health services within last 12 month | ||||||
| No | 1.00 | 1.00 | 1.00 | 1.00 | 1.00 | 0.038 |
| Yes | 1.23 (0.86–1.75) | 1.38 (1.14–1.67) | 1.11 (0.77–1.60) | 1.09 (0.81–1.47) | 1.25 (1.07–1.45) ** | 0.983 |
| Enabling factors | ||||||
| Distance to health facilities * | ||||||
| Big problem | - | 1.00 | 1.00 | 1.00 | 1.00 | 0.012 |
| Not a big problem | - | 1.11 (0.93–1.33) | 1.21 (0.84–1.76) | 0.89 (0.65–1.22) | 1.06 (0.92–1.24) | 0.713 |
| Mother’s autonomy * | ||||||
| Involved in all three household decisions | - | 1.00 | 1.00 | 1.00 | 1.00 | 0.525 |
| Not involved in all three household decisions | - | 1.17 (0.99–1.38) | 0.59 (0.36–0.96) | 1.07 (0.85–1.34) | 0.80 (0.65–0.99) | 0.093 |
| Household head | ||||||
| Male | 1.00 | 1.00 | 1.00 | 1.00 | 1.00 | 0.579 |
| Female | 1.49 (0.80–2.77) | 1.13 (0.86–1.49) | 0.94 (0.63–1.41) | 1.31 (0.85–2.01) | 1.12 (0.91–1.38) | 0.218 |
| Need factors | ||||||
| Plan to have more children | ||||||
| Want no more | 1.00 | 1.00 | 1.00 | 1.00 | 1.00 | 0.471 |
| Want within 2 years | 0.38 (0.01–0.29) | 0.49 (0.02–0.10) | 0.06 (0.02–0.23) | 0.12 (0.04–0.39) | 0.063 (0.04–0.11) ** | 0.747 |
| Want after 2+ years | 5.26 (3.07–9.03) | 2.94 (2.28–3.79) | 2.44 (1.60–3.73) | 8.31 (4.62–14.97) | 3.54 (2.89–4.32) ** | 0.090 |
| Not sure | 5.85 (2.91–11.79) | 5.16 (3.07–8.68) | 7.11 (2.99–16.92) | 8.42 (4.91–14.44) | 5.54 (3.95–7.79) ** | 0.966 |
| Variables | 1999 (N = 246) | 2004/2005 (N = 569) | 2010 (N = 601) | 2015/2016 (N = 540) | 1999–2016 (N = 1956) | p for Trend |
|---|---|---|---|---|---|---|
| aOR (95% CI) | aOR (95% CI) | aOR (95% CI) | aOR (95% CI) | aOR (95% CI) | ||
| Community-level factors | ||||||
| Place of residence | ||||||
| Urban | 1.00 | 1.00 | 1.00 | 1.00 | 1.00 | 0.242 |
| Rural | 1.51 (0.81–2.80) | 0.99 (0.67–1.48) | 0.91 90.47–1.77) | 0.77 (0.49–1.22) | 0.99 (0.76–1.29) | 0.086 |
| Sociodemographic factors | ||||||
| Mother’s age | ||||||
| 15–24 years | 1.00 | 1.00 | 1.00 | 1.00 | 1.00 | 0.257 |
| 25–34 years | 1.12 (0.49–2.58) | 0.74 (0.43–1.25) | 0.63 (0.21–1.87) | 0.38 (0.13–1.08) | 0.64 (0.41–0.98) ** | 0.002 |
| 35–49 years | 1.08 (0.39–2.96) | 0.69 (0.41–1.18) | 0.91 (0.30–2.80) | 0.57 (0.21–1.51) | 0.69 (0.45–1.06) | 0.259 |
| Parity | ||||||
| Zero | 1.00 | 1.00 | 1.00 | 1.00 | 1.00 | 0.542 |
| 1–4 | 6.08 (0.78–47.42) | 2.17 (0.54–8.76) | 3.95 (2.07–7.79) | 16.61 (1.04–265.19) | 3.32 (0.89–12.38) | 0.450 |
| 5+ | 6.05 (0.74–49.67) | 4.96 (1.18–20.80) | 11.06 (5.66–26.11) | 20.99 (1.35–326.32) | 6.06 (1.61–22.84) ** | 0.584 |
| Mother’s education | ||||||
| No schooling | 1.00 | 1.00 | 1.00 | 1.00 | 1.00 | 0.556 |
| Primary school and above | 0.84 (0.54–1.29) | 0.85 (0.64–1.13) | 0.90 (0.51–1.60) | 0.99 (0.58–1.69) | 0.88 (0.70–1.11) | 0.058 |
| Mother’s employment status | ||||||
| No employment | 1.00 | 1.00 | 1.00 | 1.00 | 1.00 | 0.002 |
| Formal employment | 0.87 (0.19–3.83) | 0.59 (0.26–1.39) | 0.41 (0.16–1.06) | 1.29 (0.65–2.54) | 0.74 (0.48–1.15) | 0.093 |
| Informal employment | 0.66 (0.30–1.44) | 0.73 (0.47–1.15) | 0.79 (0.43–1.44) | 0.77 (0.48–1.23) | 0.79 (0.60–1.05) | 0.531 |
| Partner’s education* | ||||||
| No schooling | - | 1.00 | 1.00 | 1.00 | 1.00 | 0.359 |
| Primary school | - | 1.01 (0.73–1.39) | 0.52 (0.29–0.94) | 0.64 (0.35–1.19) | 0.83 (0.64–1.06) | 0.026 |
| Secondary and higher | - | 0.89 (0.51–1.58) | 0.66 (0.27–1.61) | 0.96 (0.43–2.14) | 0.95 (0.64–1.40) | 0.102 |
| Partner’s employment status * | ||||||
| No employment | - | 1.00 | 1.00 | 1.00 | 1.00 | 0.397 |
| Formal employment | - | 5.56 (1.75–17.61) | 2.32 (0.32–16.57) | 0.69 (0.25–1.91) | 1.68 (0.82–3.45) | 0.007 |
| Informal employment | - | 4.89 (1.62–14.73) | 1.42 (0.20–9.98) | 1.08 (0.41–2.83) | 1.67 (0.83–3.35) | 0.263 |
| Household wealth status | ||||||
| Poor | 1.00 | 1.00 | 1.00 | 1.00 | 1.00 | 0.922 |
| Middle | 0.85 (0.53–1.37) | 1.24 (0.89–1.70) | 0.90 (0.54–1.51) | 0.75 (0.47–1.20) | 1.08 (0.85–1.37) | 0.013 |
| Rich | 1.08 (0.47–2.47) | 0.92 (0.58–1.45) | 0.42 (0.15–1.22) | 0.57 (0.29–1.09) | 0.81 (0.57–1.16) | 0.063 |
| Number of partners | ||||||
| One | 1.00 | 1.00 | 1.00 | 1.00 | 1.00 | 0.904 |
| More than one | 0.74 (0.45–1.21) | 0.94 (0.69–1.28) | 1.52 (0.92–2.53) | 1.24 (0.79–1.94) | 1.07 (0.86–1.34) | 0.587 |
| Health knowledge factor | ||||||
| Listening to radio * | ||||||
| No | - | 1.00 | 1.00 | 1.00 | 1.00 | 0.063 |
| Yes | - | 0.74 (0.55–0.99) | 0.55 (0.31–0.97) | 1.59 (0.94–2.70) | 0.82 (0.65–1.04) | 0.277 |
| Watch Television * | ||||||
| No | - | 1.00 | 1.00 | 1.00 | 1.00 | 0.266 |
| Yes | - | 0.74 (0.52–1.05) | 1.05 (0.59–1.87) | 0.97 (0.59–1.56) | 0.76 (0.61–0.96) ** | 0.087 |
| Reading newspapers/Magazines * | ||||||
| No | - | 1.00 | 1.00 | 1.00 | 1.00 | 0.405 |
| Yes | - | 1.09 (0.82–1.44) | 1.18 (0.70–2.00) | 0.78 (0.52–1.16) | 1.02 (0.83–1.26) | 0.013 |
| Visited by HC workers within last 12 month | ||||||
| No | 1.00 | 1.00 | 1.00 | 1.00 | 1.00 | 0.132 |
| Yes | 0.74 (0.45–1.21) | 1.38 (0.84–2.28) | 1.70 (0.72–4.03) | 0.97 (0.45–2.08) | 1.30 (0.90–1.88) | 0.053 |
| Visited health facility for any health services within last 12 month | ||||||
| No | 1.00 | 1.00 | 1.00 | 1.00 | 1.00 | 0.706 |
| Yes | 0.89 (0.37–2.18) | 1.49 (1.18–1.90) | 0.75 (0.49–1.14) | 1.04 (0.63–1.72) | 1.16 (0.96–1.42) | 0.008 |
| Enabling factors | ||||||
| Distance to health facilities * | ||||||
| Big problem | - | 1.00 | 1.00 | 1.00 | 1.00 | 0.170 |
| Not a big problem | - | 1.02 (0.79–1.32) | 1.39 (0.81–2.40) | 0.95 (0.59–1.51) | 1.07 (0.87–1.31) | 0.145 |
| Mother’s autonomy * | ||||||
| Involved in all three household decisions | - | 1.00 | 1.00 | 1.00 | 1.00 | 0.121 |
| Not involved in all three household decisions | - | 1.09 (0.88–1.35) | 0.67 (0.34–1.34) | 1.12 (0.72–1.75) | 0.64 (0.51–0.81) ** | 0.180 |
| Household head | ||||||
| Male | 1.00 | 1.00 | 1.00 | 1.00 | 1.00 | 0.517 |
| Female | 1.39 (0.75–2.58) | 1.35 (0.98–1.87) | 0.80 (0.41–1.55) | 1.21 (0.64–2.32) | 1.08 (0.83–1.41) | 0.259 |
| Need factors | ||||||
| Plan to have more children | ||||||
| Want no more | 1.00 | 1.00 | 1.00 | 1.00 | 1.00 | 0.297 |
| Want within 2 years | 2.52 (1.72–3.70) | 0.01 (0.00–0.06) | 7.41 (4.96–11.10) | 1.47 (0.99–2.20) | 0.01 (0.00–0.03) ** | 0.995 |
| Want after 2+ years | 0.10 (0.04–0.22) | 0.03 (0.02–0.05) | 0.01 (0.00–0.03) | 0.00 (0.00–0.03) | 0.02 (0.01–0.03) ** | 0.001 |
| Not sure | 0.12 (0.03–0.42) | 0.14 (0.05–0.39 | 5.31 (2.42–11.72) | 0.03 (0.00–0.20) | 0.08 (0.03–0.19) ** | 0.075 |
Disclaimer/Publisher’s Note: The statements, opinions and data contained in all publications are solely those of the individual author(s) and contributor(s) and not of MDPI and/or the editor(s). MDPI and/or the editor(s) disclaim responsibility for any injury to people or property resulting from any ideas, methods, instructions or products referred to in the content. |
© 2023 by the authors. Licensee MDPI, Basel, Switzerland. This article is an open access article distributed under the terms and conditions of the Creative Commons Attribution (CC BY) license (https://creativecommons.org/licenses/by/4.0/).
Share and Cite
Rwabilimbo, A.G.; Ahmed, K.Y.; Mshokela, J.B.; Arora, A.; Ogbo, F.A.; on behalf of the Global Maternal and Child Health Research Collaboration (GloMACH). Trends and Drivers of Unmet Need for Family Planning in Currently Married Tanzanian Women between 1999 and 2016. Int. J. Environ. Res. Public Health 2023, 20, 2262. https://doi.org/10.3390/ijerph20032262
Rwabilimbo AG, Ahmed KY, Mshokela JB, Arora A, Ogbo FA, on behalf of the Global Maternal and Child Health Research Collaboration (GloMACH). Trends and Drivers of Unmet Need for Family Planning in Currently Married Tanzanian Women between 1999 and 2016. International Journal of Environmental Research and Public Health. 2023; 20(3):2262. https://doi.org/10.3390/ijerph20032262
Chicago/Turabian StyleRwabilimbo, Abdon Gregory, Kedir Y. Ahmed, Jackline Boniphace Mshokela, Amit Arora, Felix Akpojene Ogbo, and on behalf of the Global Maternal and Child Health Research Collaboration (GloMACH). 2023. "Trends and Drivers of Unmet Need for Family Planning in Currently Married Tanzanian Women between 1999 and 2016" International Journal of Environmental Research and Public Health 20, no. 3: 2262. https://doi.org/10.3390/ijerph20032262
APA StyleRwabilimbo, A. G., Ahmed, K. Y., Mshokela, J. B., Arora, A., Ogbo, F. A., & on behalf of the Global Maternal and Child Health Research Collaboration (GloMACH). (2023). Trends and Drivers of Unmet Need for Family Planning in Currently Married Tanzanian Women between 1999 and 2016. International Journal of Environmental Research and Public Health, 20(3), 2262. https://doi.org/10.3390/ijerph20032262