
Community Water Fluoridation in Focus: A Comprehensive Look at Fluoridation Levels across America

 ,
,  ,
,
Abstract
:1. Introduction
2. Methods
2.1. Data Source
2.2. Mesures
2.3. Data Analyses
3. Results
4. Discussion
Limitations
5. Conclusions
Author Contributions
Funding
Institutional Review Board Statement
Informed Consent Statement
Data Availability Statement
Acknowledgments
Conflicts of Interest
References
- O’Connell, J.M.; Brunson, D.; Anselmo, T.; Sullivan, P.W. Costs and savings associated with community water fluoridation programs in Colorado. Prev. Chronic Dis. 2005, 2, A06. [Google Scholar] [PubMed]
- Horst, J.A.; Tanzer, J.M.; Milgrom, P.M. Fluorides and Other Preventive Strategies for Tooth Decay. Dent. Clin. N. Am. 2018, 62, 207–234. [Google Scholar] [CrossRef]
- Association AD. Fluoridation Facts. NFAC of ADA. Available online: https://ebooks.ada.org/fluoridationfacts/ (accessed on 15 November 2023).
- Prevention CfDCa. Community Water Fluoridation. Division of Oral Health, National Center for Chronic Disease Prevention and Health Promotion. Available online: https://www.cdc.gov/fluoridation/index.html (accessed on 15 November 2023).
- Prevention CfDCa. Ten Great Public Health Achievements—United States, 1900–1999; US Department of Health and Human Services: Atlanta, GA, USA, 1999; Volume 48, pp. 241–243. Available online: https://www.cdc.gov/mmwr/preview/mmwrhtml/00056796.htm (accessed on 15 November 2023).
- Green, R.; Lanphear, B.; Hornung, R.; Flora, D.; Martinez-Mier, E.A.; Neufeld, R.; Ayotte, P.; Muckle, G.; Till, C. Association Between Maternal Fluoride Exposure During Pregnancy and IQ Scores in Offspring in Canada. JAMA Pediatr. 2019, 173, 940–948. [Google Scholar] [CrossRef]
- Rocha-Amador, D.; Navarro, M.E.; Carrizales, L.; Morales, R.; Calderón, J. Decreased intelligence in children and exposure to fluoride and arsenic in drinking water. Cad. Saúde Pública 2007, 23 (Suppl. 4), S579–S587. [Google Scholar] [CrossRef] [PubMed]
- Saxena, S.; Sahay, A.; Goel, P. Effect of fluoride exposure on the intelligence of school children in Madhya Pradesh, India. J. Neurosci. Rural Pract. 2012, 3, 144–149. [Google Scholar] [CrossRef] [PubMed]
- Bashash, M.; Thomas, D.; Hu, H.; Martinez-Mier, E.A.; Sanchez, B.N.; Basu, N.; Peterson, K.E.; Ettinger, A.S.; Wright, R.; Zhang, Z.; et al. Prenatal Fluoride Exposure and Cognitive Outcomes in Children at 4 and 6–12 Years of Age in Mexico. Environ. Health Perspect. 2017, 125, 097017. [Google Scholar] [CrossRef] [PubMed]
- Mullenix, P.J.; Denbesten, P.K.; Schunior, A.; Kernan, W.J. Neurotoxicity of sodium fluoride in rats. Neurotoxicol. Teratol. 1995, 17, 169–177. [Google Scholar] [CrossRef]
- Varner, J.A.; Jensen, K.F.; Horvath, W.; Isaacson, R.L. Chronic administration of aluminum–fluoride or sodium–fluoride to rats in drinking water: Alterations in neuronal and cerebrovascular integrity. Brain Res. 1998, 784, 284–298. [Google Scholar] [CrossRef]
- Grandjean, P. Developmental fluoride neurotoxicity: An updated review. Environ. Health 2019, 18, 110. [Google Scholar] [CrossRef]
- Grandjean, P.; Meddis, A.; Nielsen, F.; Beck, I.H.; Bilenberg, N.; Goodman, C.V.; Hu, H.; Till, C.; Budtz-Jørgensen, E. Dose dependence of prenatal fluoride exposure associations with cognitive performance at school age in three prospective studies. Eur. J. Public Health 2023, ckad170. [Google Scholar] [CrossRef]
- Miranda, G.H.N.; Alvarenga, M.O.P.; Ferreira, M.K.M.; Puty, B.; Bittencourt, L.O.; Fagundes, N.C.F.; Pessan, J.P.; Buzalaf, M.A.R.; Lima, R.R. A systematic review and meta-analysis of the association between fluoride exposure and neurological disorders. Sci. Rep. 2021, 11, 22659. [Google Scholar] [CrossRef] [PubMed]
- Kumar, J.V.; Moss, M.E.; Liu, H.; Fisher-Owens, S. Association between low fluoride exposure and children’s intelligence: A meta-analysis relevant to community water fluoridation. Public Health 2023, 219, 73–84. [Google Scholar] [CrossRef]
- U.S. Department of Health and Human Services Federal Panel on Community Water Fluoridation. U.S. Public Health Service Recommendation for Fluoride Concentration in Drinking Water for the Prevention of Dental Caries. Public Health Rep. 2015, 130, 318–331. [Google Scholar] [CrossRef] [PubMed]
- Hung, M.; Hon, E.S.; Mohajeri, A.; Moparthi, H.; Vu, T.; Jeon, J.; Lipsky, M.S. A National Study Exploring the Association Between Fluoride Levels and Dental Fluorosis. JAMA Netw. Open 2023, 6, e2318406. [Google Scholar] [CrossRef] [PubMed]
- Prevention CfDCa. Fluorosis. Available online: https://www.cdc.gov/fluoridation/faqs/dental_fluorosis/index.htm (accessed on 15 November 2023).
- Morabia, A. Community Water Fluoridation: Open Discussions Strengthen Public Health. Am. J. Public Health 2016, 106, 209–210. [Google Scholar] [CrossRef] [PubMed]
- Carstairs, C. Debating Water Fluoridation before Dr. Strangelove. Am. J. Public Health 2015, 105, 1559–1569. [Google Scholar] [CrossRef]
- Unde, M.P.; Patil, R.U.; Dastoor, P.P. The untold story of fluoridation: Revisiting the changing perspectives. Indian J. Occup. Environ. Med. 2018, 22, 121–127. [Google Scholar] [CrossRef]
- Healthy People 2030. Increase the Proportion of People Whose Water Systems Have the Recommended amount of Fluoride—OH-11. Office of Disease Prevention and Health Promotion. Available online: https://health.gov/healthypeople/objectives-and-data/browse-objectives/health-policy/increase-proportion-people-whose-water-systems-have-recommended-amount-fluoride-oh-11 (accessed on 15 November 2023).
- Curiel, J.; Sanders, A.; Slade, G. Emulation of Community Water Fluoridation Coverage Across US Counties. JDR Clin. Transl. Res. 2019, 5, 376–384. [Google Scholar] [CrossRef]
- Song, Y.; Kim, J. Community Water Fluoridation: Caveats to Implement Justice in Public Oral Health. Int. J. Environ. Res. Public Health 2021, 18, 2372. [Google Scholar] [CrossRef]
- Prevention CfDCa. Water Fluoridation Data & Statistics. Division of Oral Health, National Center for Chronic Disease Prevention and Health Promotion. Available online: https://www.cdc.gov/fluoridation/statistics/index.htm (accessed on 15 November 2023).
- Prevention CfDCa. Water Fluoridation Reporting System. Division of Oral Health, National Center for Chronic Disease Prevention and Health Promotion. 2022. Available online: https://www.cdc.gov/fluoridation/data-tools/reporting-system.html (accessed on 15 November 2023).
- Agency USEP. Information about Public Water Systems. 2022. Available online: https://www.epa.gov/dwreginfo/information-about-public-water-systems (accessed on 15 November 2023).
- Prevention CfDCa. My Water’s Fluoride Glossary. U.S. Department of Health & Human Services. Available online: https://nccd.cdc.gov/doh_mwf/Help/MWFGlossary.aspx (accessed on 15 November 2023).
- HP. Oral Conditions. Office of Disease Prevention and Health Promotion. 2023. Available online: https://health.gov/healthypeople/objectives-and-data/browse-objectives/oral-conditions (accessed on 15 November 2023).
- Veneri, F.; Vinceti, M.; Generali, L.; Giannone, M.E.; Mazzoleni, E.; Birnbaum, L.S.; Consolo, U.; Filippini, T. Fluoride exposure and cognitive neurodevelopment: Systematic review and dose-response meta-analysis. Environ. Res. 2023, 221, 115239. [Google Scholar] [CrossRef]
- Community Water Fluoridation Exposure: A Review of Neurological and Cognitive Effects—A 2020 Update. Ottawa (ON): Canadian Agency for Drugs and Technologies in Health. 2020. Available online: https://www.ncbi.nlm.nih.gov/books/NBK567579 (accessed on 15 November 2023).
- Fluoride Action Network. About FAN. Fluoride Action Network. 2011. Available online: https://fluoridealert.org/about/ (accessed on 15 November 2023).
- MESH A. Portland Voters Soundly Reject Fluoride. Willamette Week. 2013. Available online: https://www.wweek.com/portland/blog-30229-portland-voters-soundly-reject-fluoride.html (accessed on 15 November 2023).
- Meyer, J.; Margaritis, V.; Mendelsohn, A. Consequences of community water fluoridation cessation for Medicaid-eligible children and adolescents in Juneau, Alaska. BMC Oral Health 2018, 18, 215. [Google Scholar] [CrossRef]
- Mattheus, D.; Shannon, M. Oral Health Outcomes for Children in Hawaii: Not much to Smile about. J. Dent. Probl. Solut. 2015, 2, 34–37. [Google Scholar] [CrossRef]
- Ran, T.; Chattopadhyay, S.K.; Community Preventive Services Task Force. Economic Evaluation of Community Water Fluoridation: A Community Guide Systematic Review. Am. J Prev. Med. 2016, 50, 790–796. [Google Scholar] [CrossRef] [PubMed]
- O’Connell, J.; Rockell, J.; Ouellet, J.; Tomar, S.L.; Maas, W. Costs and Savings Associated with Community Water Fluoridation in the United States. Health Aff. 2016, 35, 2224–2232. [Google Scholar] [CrossRef] [PubMed]
- McLaren, L.; Patterson, S.K.; Faris, P.; Chen, G.; Thawer, S.; Figueiredo, R.; Weijs, C.; McNeil, D.; Waye, A.; Potestio, M. Fluoridation cessation and children’s dental caries: A 7-year follow-up evaluation of Grade 2 schoolchildren in Calgary and Edmonton, Canada. Community Dent. Oral Epidemiol. 2022, 50, 391–403. [Google Scholar] [CrossRef] [PubMed]
- Wiener, R.C.; Shen, C.; Findley, P.; Tan, X.; Sambamoorthi, U. Dental Fluorosis over Time: A comparison of National Health and Nutrition Examination Survey data from 2001–2002 and 2011–2012. J. Dent. Hyg. 2018, 92, 23–29. [Google Scholar] [PubMed]
- Levy, A.G.; Thorpe, A.; Scherer, L.D.; Scherer, A.M.; Drews, F.A.; Butler, J.M.; Burpo, N.; Shoemaker, H.; Stevens, V.; Fagerlin, A. Misrepresentation and Nonadherence Regarding COVID-19 Public Health Measures. JAMA Netw. Open 2022, 5, e2235837. [Google Scholar] [CrossRef] [PubMed]
- Hamilton, E.K.; Griffin, S.O.; Espinoza, L. Effect of CDC adjustment of state-reported data on community water fluoridation statistics. J. Public Health Dent. 2023, 83, 320–324. [Google Scholar] [CrossRef] [PubMed]

| Measures | 2006 | 2008 | 2010 | 2012 | 2014 | 2016 | 2018 | 2020 |
|---|---|---|---|---|---|---|---|---|
| Number of CWSs adjusting fluoride | 6368 | 6143 | 6042 | 5999 | 5919 | 5817 | 5753 | 5728 |
| Number of CWSs consecutive to systems with optimal fluoride levels | 6705 | 6176 | 6795 | 6342 | 6015 | 6230 | 6340 | 5696 |
| Number of CWSs providing fluoridated water | 16,412 | 16,977 | 18,427 | 18,502 | 18,186 | 18,030 | 17,917 | 17,558 |
| Number of CWSs with naturally occurring fluoride at or above optimal levels | 3339 | 4658 | 5590 | 6151 | 6205 | 5865 | 5727 | 5636 |
| Percentage of U.S. population on CWSs receiving fluoridated water | 69.2 | 72.4 | 73.9 | 74.6 | 74.4 | 72.8 | 73.0 | 72.7 |
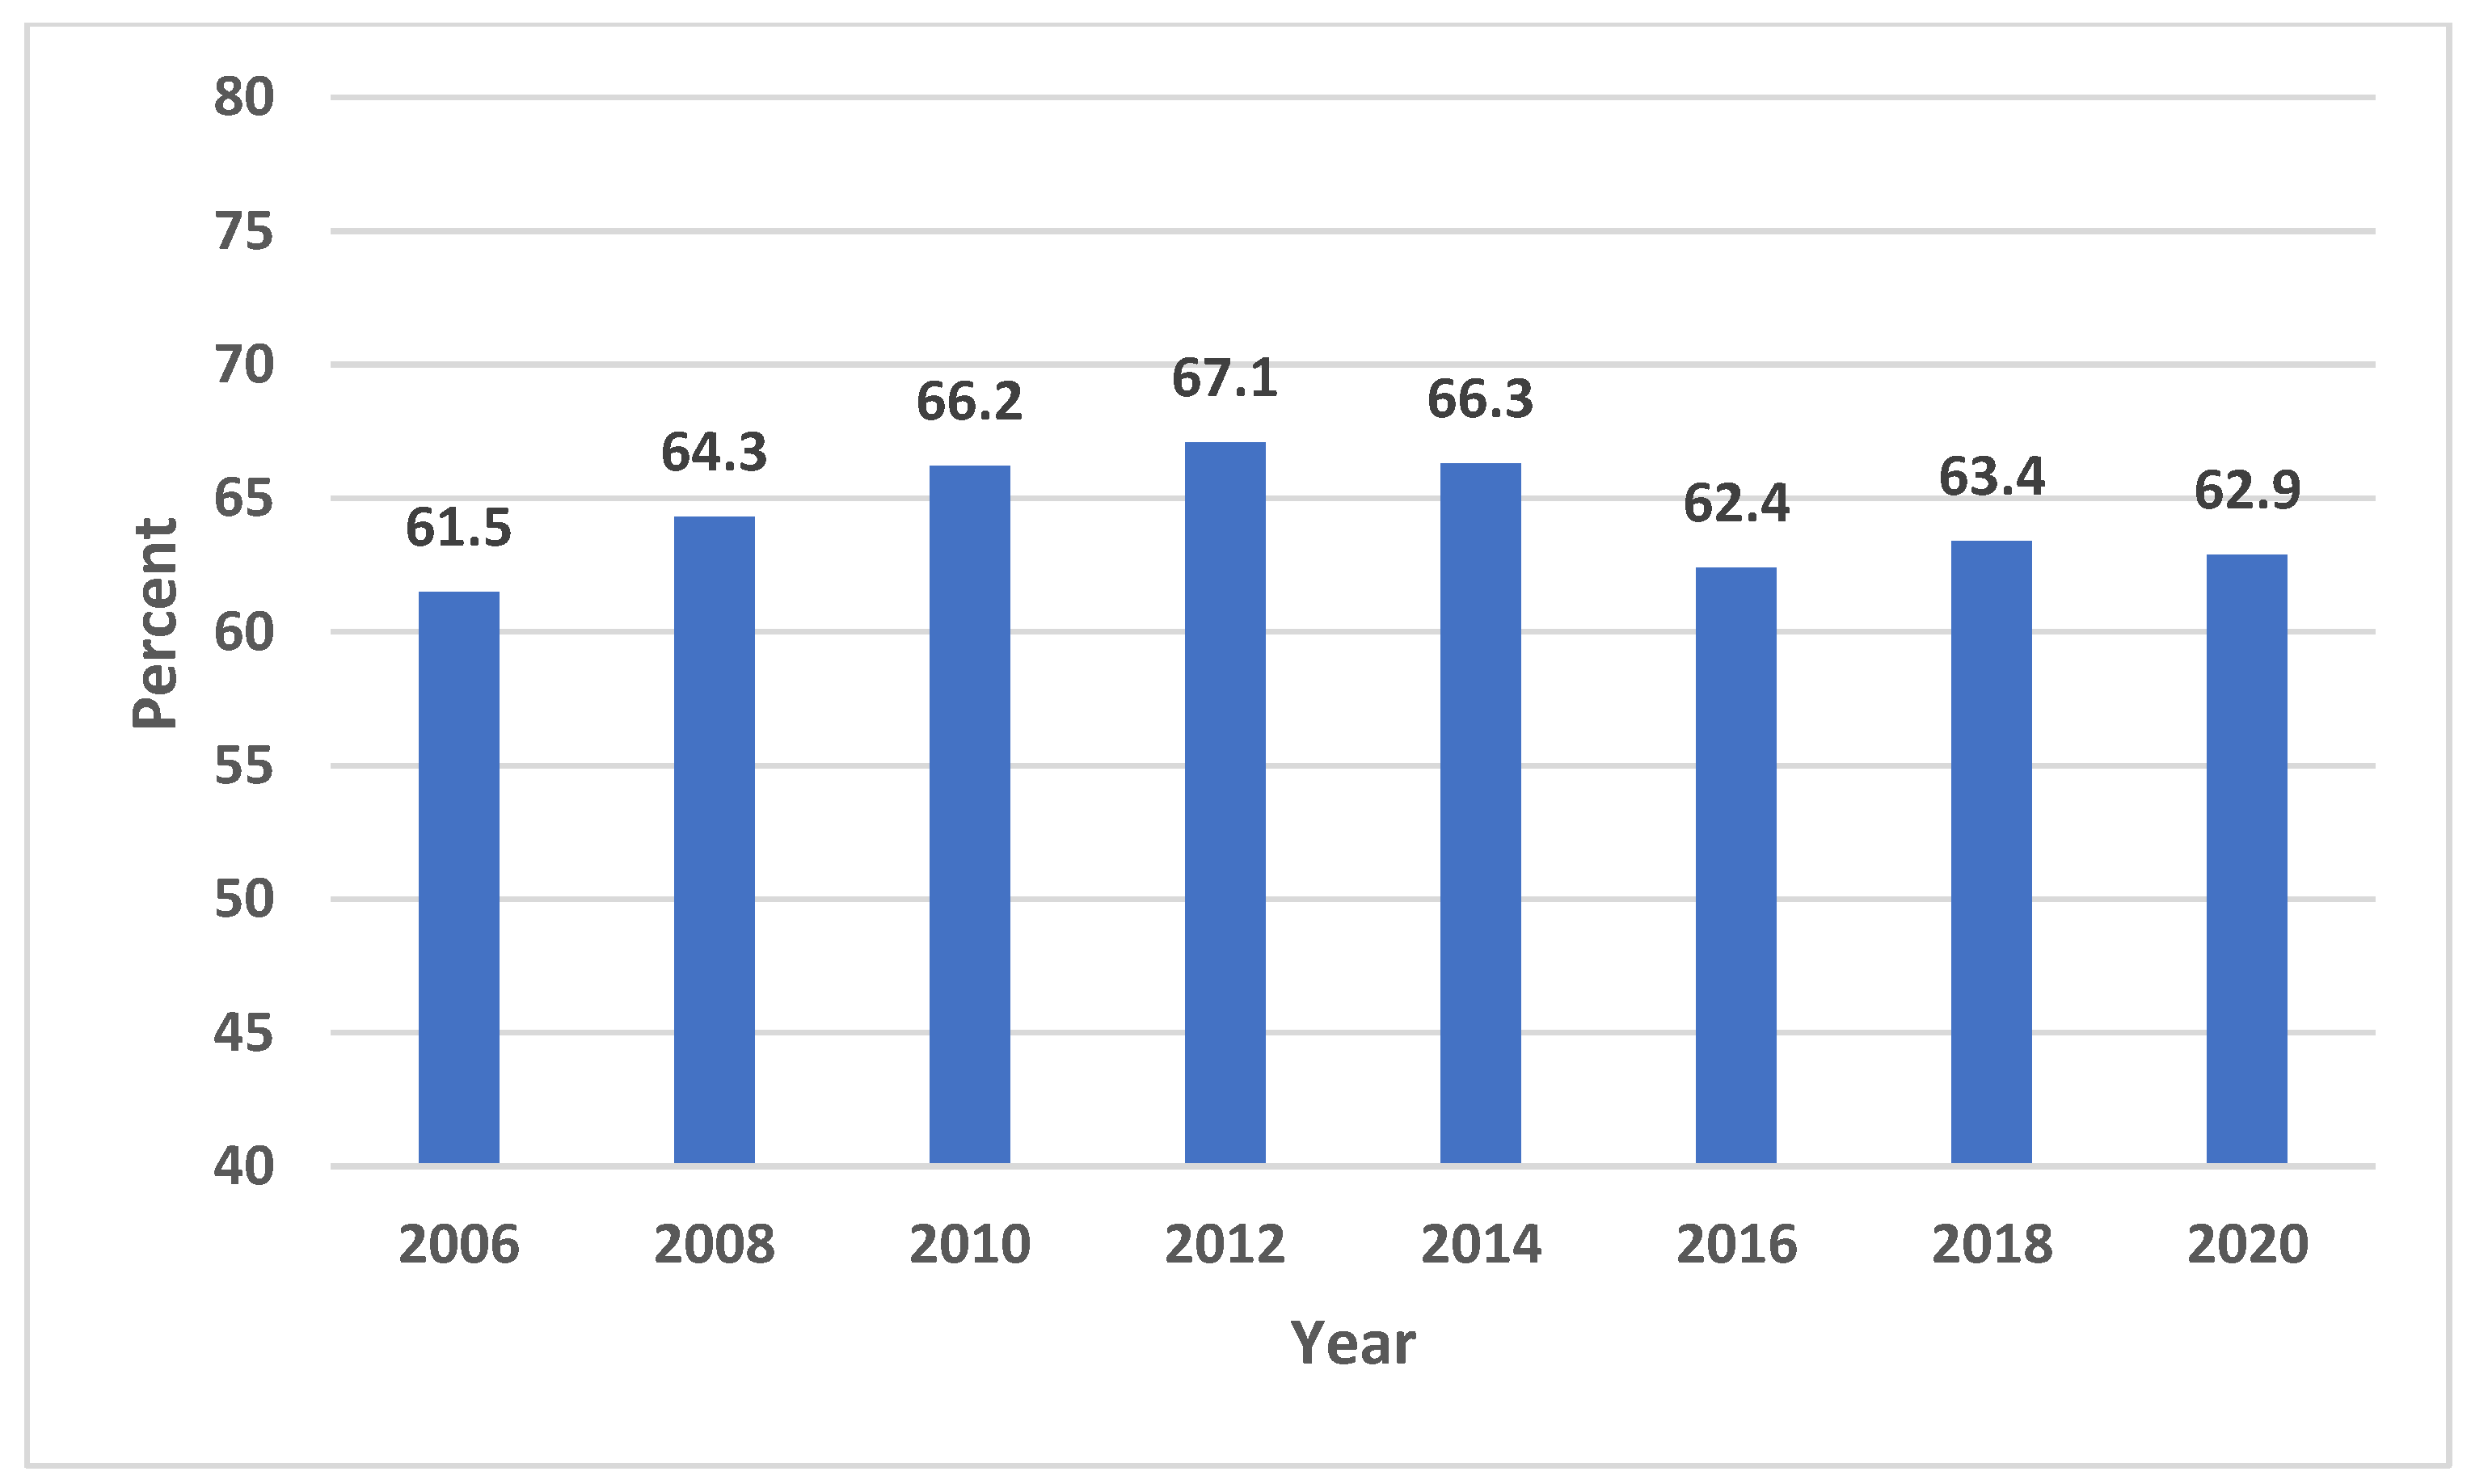
| Percentage of U.S. population receiving fluoridated water | 61.5 | 64.3 | 66.2 | 67.1 | 66.3 | 62.4 | 63.4 | 62.9 |
| Population served by CWSs with naturally occurring fluoride at or above optimal levels | 8,078,890 | 8,805,304 | 10,077,922 | 11,116,202 | 11,883,007 | 11,283,910 | 12,059,342 | 11,578,079 |
| Total number of CWSs in the United States | 53,429 | 55,396 | 54,293 | 52,734 | * | 52,286 | 52,211 | 51,373 |
| Total U.S. population on fluoridated drinking water systems, persons | 184,028,038 | 195,545,109 | 204,283,554 | 210,655,401 | 211,393,167 | 201,565,162 | 207,426,536 | 209,145,650 |
| Total U.S. population, persons | 299,398,484 | 304,059,724 | 308,745,538 | 313,914,040 | 318,857,056 | 323,127,513 | 327,167,434 | 331,501,080 |
| U.S. population on community water systems, persons | 262,690,043 | 269,911,707 | 276,607,387 | 282,534,910 | 284,099,832 | 276,969,134 | 284,075,868 | 287,798,584 |
| State | 2006 % | 2012 % | 2016 % | 2020 % | % Difference (2006–2012) | % Difference (2016–2020) |
|---|---|---|---|---|---|---|
| United States | 69.2 | 74.6 | 72.8 | 72.7 | 5.4 | −0.1 |
| Alabama | 82.9 | 78.6 | 78.0 | 77.7 | −4.3 | −0.3 |
| Alaska | 59.5 | 52.9 | 49.6 | 42.1 | −6.6 | −7.5 |
| Arizona | 56.1 | 57.8 | 57.8 | 57.7 | 1.7 | −0.1 |
| Arkansas | 64.4 | 66.9 | 85.6 | 85.8 | 2.5 | 0.2 |
| California | 27.1 | 63.7 | 60.6 | 57.5 | 36.6 | −3.1 |
| Colorado | 73.6 | 72.4 | 74.9 | 75.2 | −1.2 | 0.3 |
| Connecticut | 88.9 | 90.3 | 89.5 | 90.4 | 1.4 | 0.9 |
| Delaware | 73.6 | 86.3 | 87.4 | 76 | 12.7 | −11.4 |
| District of Columbia | 100 | 100 | 100.0 | 100 | 0 | 0.0 |
| Florida | 77.7 | 78.0 | 77.0 | 78.5 | 0.3 | 1.5 |
| Georgia | 95.8 | 96.3 | 96.2 | 94.9 | 0.5 | −1.3 |
| Hawaii | 8.4 | 10.8 | 11.3 | 8.5 | 2.4 | −2.8 |
| Idaho | 31.3 | 36.1 | 32.2 | 31.4 | 4.8 | −0.8 |
| Illinois | 98.9 | 98.5 | 98.5 | 98.4 | −0.4 | −0.1 |
| Indiana | 95.1 | 94.8 | 94.3 | 92.4 | −0.3 | −1.9 |
| Iowa | 92.4 | 92.0 | 90.3 | 89.8 | −0.4 | −0.5 |
| Kansas | 65.1 | 63.6 | 66.4 | 65.4 | −1.5 | −1.0 |
| Kentucky | 99.8 | 99.9 | 99.9 | 99.9 | 0.1 | 0.0 |
| Louisiana | 40.4 | 43.4 | 44.2 | 38 | 3.0 | −6.2 |
| Maine | 79.6 | 79.4 | 79.3 | 79.5 | −0.2 | 0.2 |
| Maryland | 93.8 | 97.2 | 93.4 | 93.7 | 3.4 | 0.3 |
| Massachusetts | 59.1 | 70.4 | 57.9 | 57.8 | 11.3 | −0.1 |
| Michigan | 90.9 | 90.2 | 89.7 | 89.3 | −0.7 | −0.4 |
| Minnesota | 98.7 | 98.8 | 98.8 | 98.8 | 0.1 | 0.0 |
| Mississippi | 50.9 | 58.2 | 61.0 | 61.1 | 7.3 | 0.1 |
| Missouri | 79.7 | 76.4 | 76.8 | 72.2 | −3.3 | −4.6 |
| Montana | 31.3 | 32.0 | 33.7 | 31.4 | 0.7 | −2.3 |
| Nebraska | 69.8 | 71.2 | 71.6 | 73.8 | 1.4 | 2.2 |
| Nevada | 72.0 | 73.5 | 75.0 | 76.4 | 1.5 | 1.4 |
| New Hampshire | 42.6 | 46.0 | 46.5 | 46.2 | 3.4 | −0.3 |
| New Jersey | 22.6 | 14.6 | 14.6 | 16.1 | −8.0 | 1.5 |
| New Mexico | 77.0 | 77.0 | 77.0 | 76.8 | 0.0 | −0.2 |
| New York | 72.9 | 71.8 | 71.7 | 71.5 | −1.1 | −0.2 |
| North Carolina | 87.6 | 87.5 | 87.7 | 87.9 | −0.1 | 0.2 |
| North Dakota | 96.2 | 96.7 | 95.8 | 96.5 | 0.5 | 0.7 |
| Ohio | 89.3 | 92.2 | 92.5 | 92.7 | 2.9 | 0.2 |
| Oklahoma | 73.5 | 70.1 | 69.6 | 68 | −3.4 | −1.6 |
| Oregon | 27.4 | 22.6 | 22.6 | 26.4 | −4.8 | 3.8 |
| Pennsylvania | 54.0 | 54.6 | 54.6 | 60 | 0.6 | 5.4 |
| Rhode Island | 84.6 | 83.9 | 84.5 | 82.7 | −0.7 | −1.8 |
| South Carolina | 94.6 | 93.8 | 91.4 | 91.7 | −0.8 | 0.3 |
| South Dakota | 95.0 | 93.6 | 93.6 | 93.8 | −1.4 | 0.2 |
| Tennessee | 93.7 | 89.7 | 88.4 | 88.8 | −4.0 | 0.4 |
| Texas | 78.1 | 79.6 | 67.6 | 71 | 1.5 | 3.4 |
| Utah | 54.3 | 51.7 | 52.7 | 50.9 | −2.6 | −1.8 |
| Vermont | 58.7 | 56.1 | 56.2 | 56.3 | −2.6 | 0.1 |
| Virginia | 95.0 | 96.0 | 96.3 | 95.5 | 1.0 | −0.8 |
| Washington | 62.9 | 63.6 | 63.9 | 65.1 | 0.7 | 1.2 |
| West Virginia | 91.7 | 91.1 | 90.3 | 90.9 | −0.6 | 0.6 |
| Wisconsin | 89.7 | 89.4 | 88.3 | 86.7 | −0.3 | −1.6 |
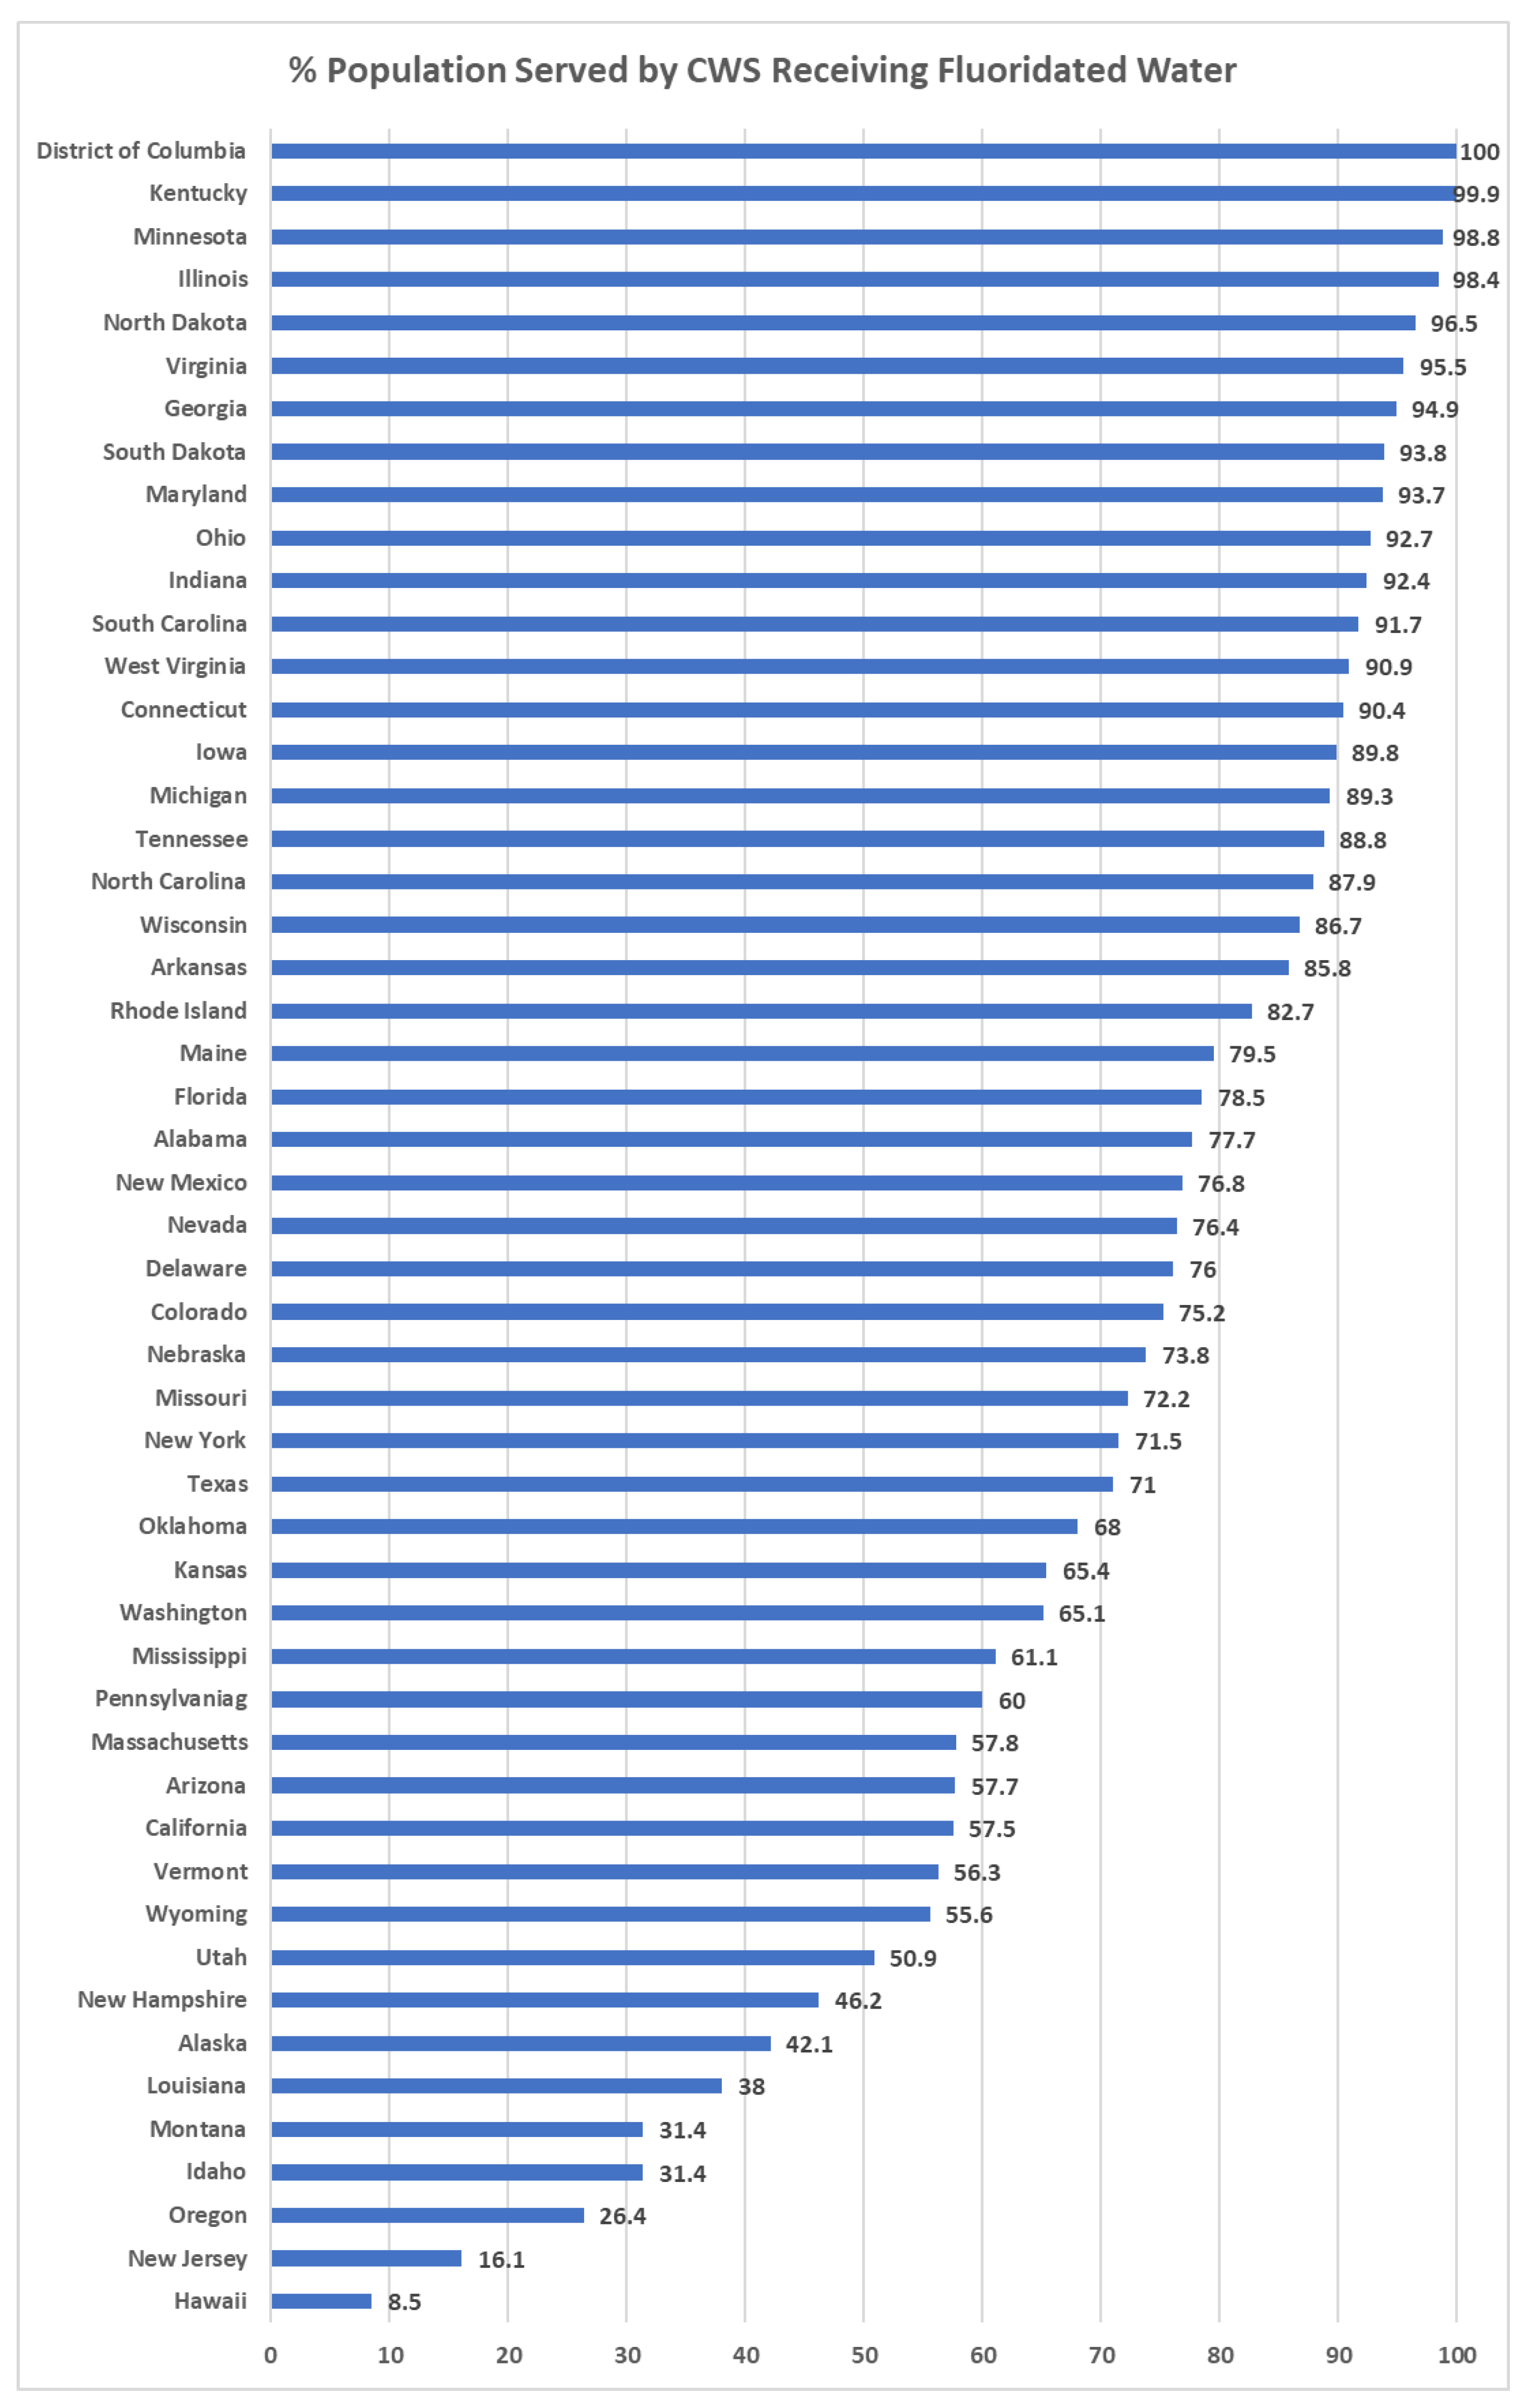
| Wyoming | 36.4 | 43.6 | 57.1 | 55.6 | 7.2 | −1.5 |
Disclaimer/Publisher’s Note: The statements, opinions and data contained in all publications are solely those of the individual author(s) and contributor(s) and not of MDPI and/or the editor(s). MDPI and/or the editor(s) disclaim responsibility for any injury to people or property resulting from any ideas, methods, instructions or products referred to in the content. |
© 2023 by the authors. Licensee MDPI, Basel, Switzerland. This article is an open access article distributed under the terms and conditions of the Creative Commons Attribution (CC BY) license (https://creativecommons.org/licenses/by/4.0/).
Share and Cite
Hung, M.; Mohajeri, A.; Chiang, J.; Park, J.; Bautista, B.; Hardy, C.; Lipsky, M.S. Community Water Fluoridation in Focus: A Comprehensive Look at Fluoridation Levels across America. Int. J. Environ. Res. Public Health 2023, 20, 7100. https://doi.org/10.3390/ijerph20237100
Hung M, Mohajeri A, Chiang J, Park J, Bautista B, Hardy C, Lipsky MS. Community Water Fluoridation in Focus: A Comprehensive Look at Fluoridation Levels across America. International Journal of Environmental Research and Public Health. 2023; 20(23):7100. https://doi.org/10.3390/ijerph20237100
Chicago/Turabian StyleHung, Man, Amir Mohajeri, Jody Chiang, Jungweon Park, Beatrice Bautista, Chase Hardy, and Martin S. Lipsky. 2023. "Community Water Fluoridation in Focus: A Comprehensive Look at Fluoridation Levels across America" International Journal of Environmental Research and Public Health 20, no. 23: 7100. https://doi.org/10.3390/ijerph20237100
APA StyleHung, M., Mohajeri, A., Chiang, J., Park, J., Bautista, B., Hardy, C., & Lipsky, M. S. (2023). Community Water Fluoridation in Focus: A Comprehensive Look at Fluoridation Levels across America. International Journal of Environmental Research and Public Health, 20(23), 7100. https://doi.org/10.3390/ijerph20237100