
Cognitive Analyses for Interface Design Using Dual N-Back Tasks for Mental Workload (MWL) Evaluation

 , and
, and
Abstract
1. Introduction
1.1. Cognitive Analyses (CA)
1.1.1. Hierarchical Task Analysis (HTA)
1.1.2. Task Analysis for Error Identification (TAFEI) in Interface Design
1.2. NASA-TLX for Mental Workload Assessment
2. Materials and Methods
2.1. Limitations of the Study
2.2. Participants
2.3. Materials
2.3.1. Hardware
2.3.2. Software
2.3.3. Methodology for GUI Design
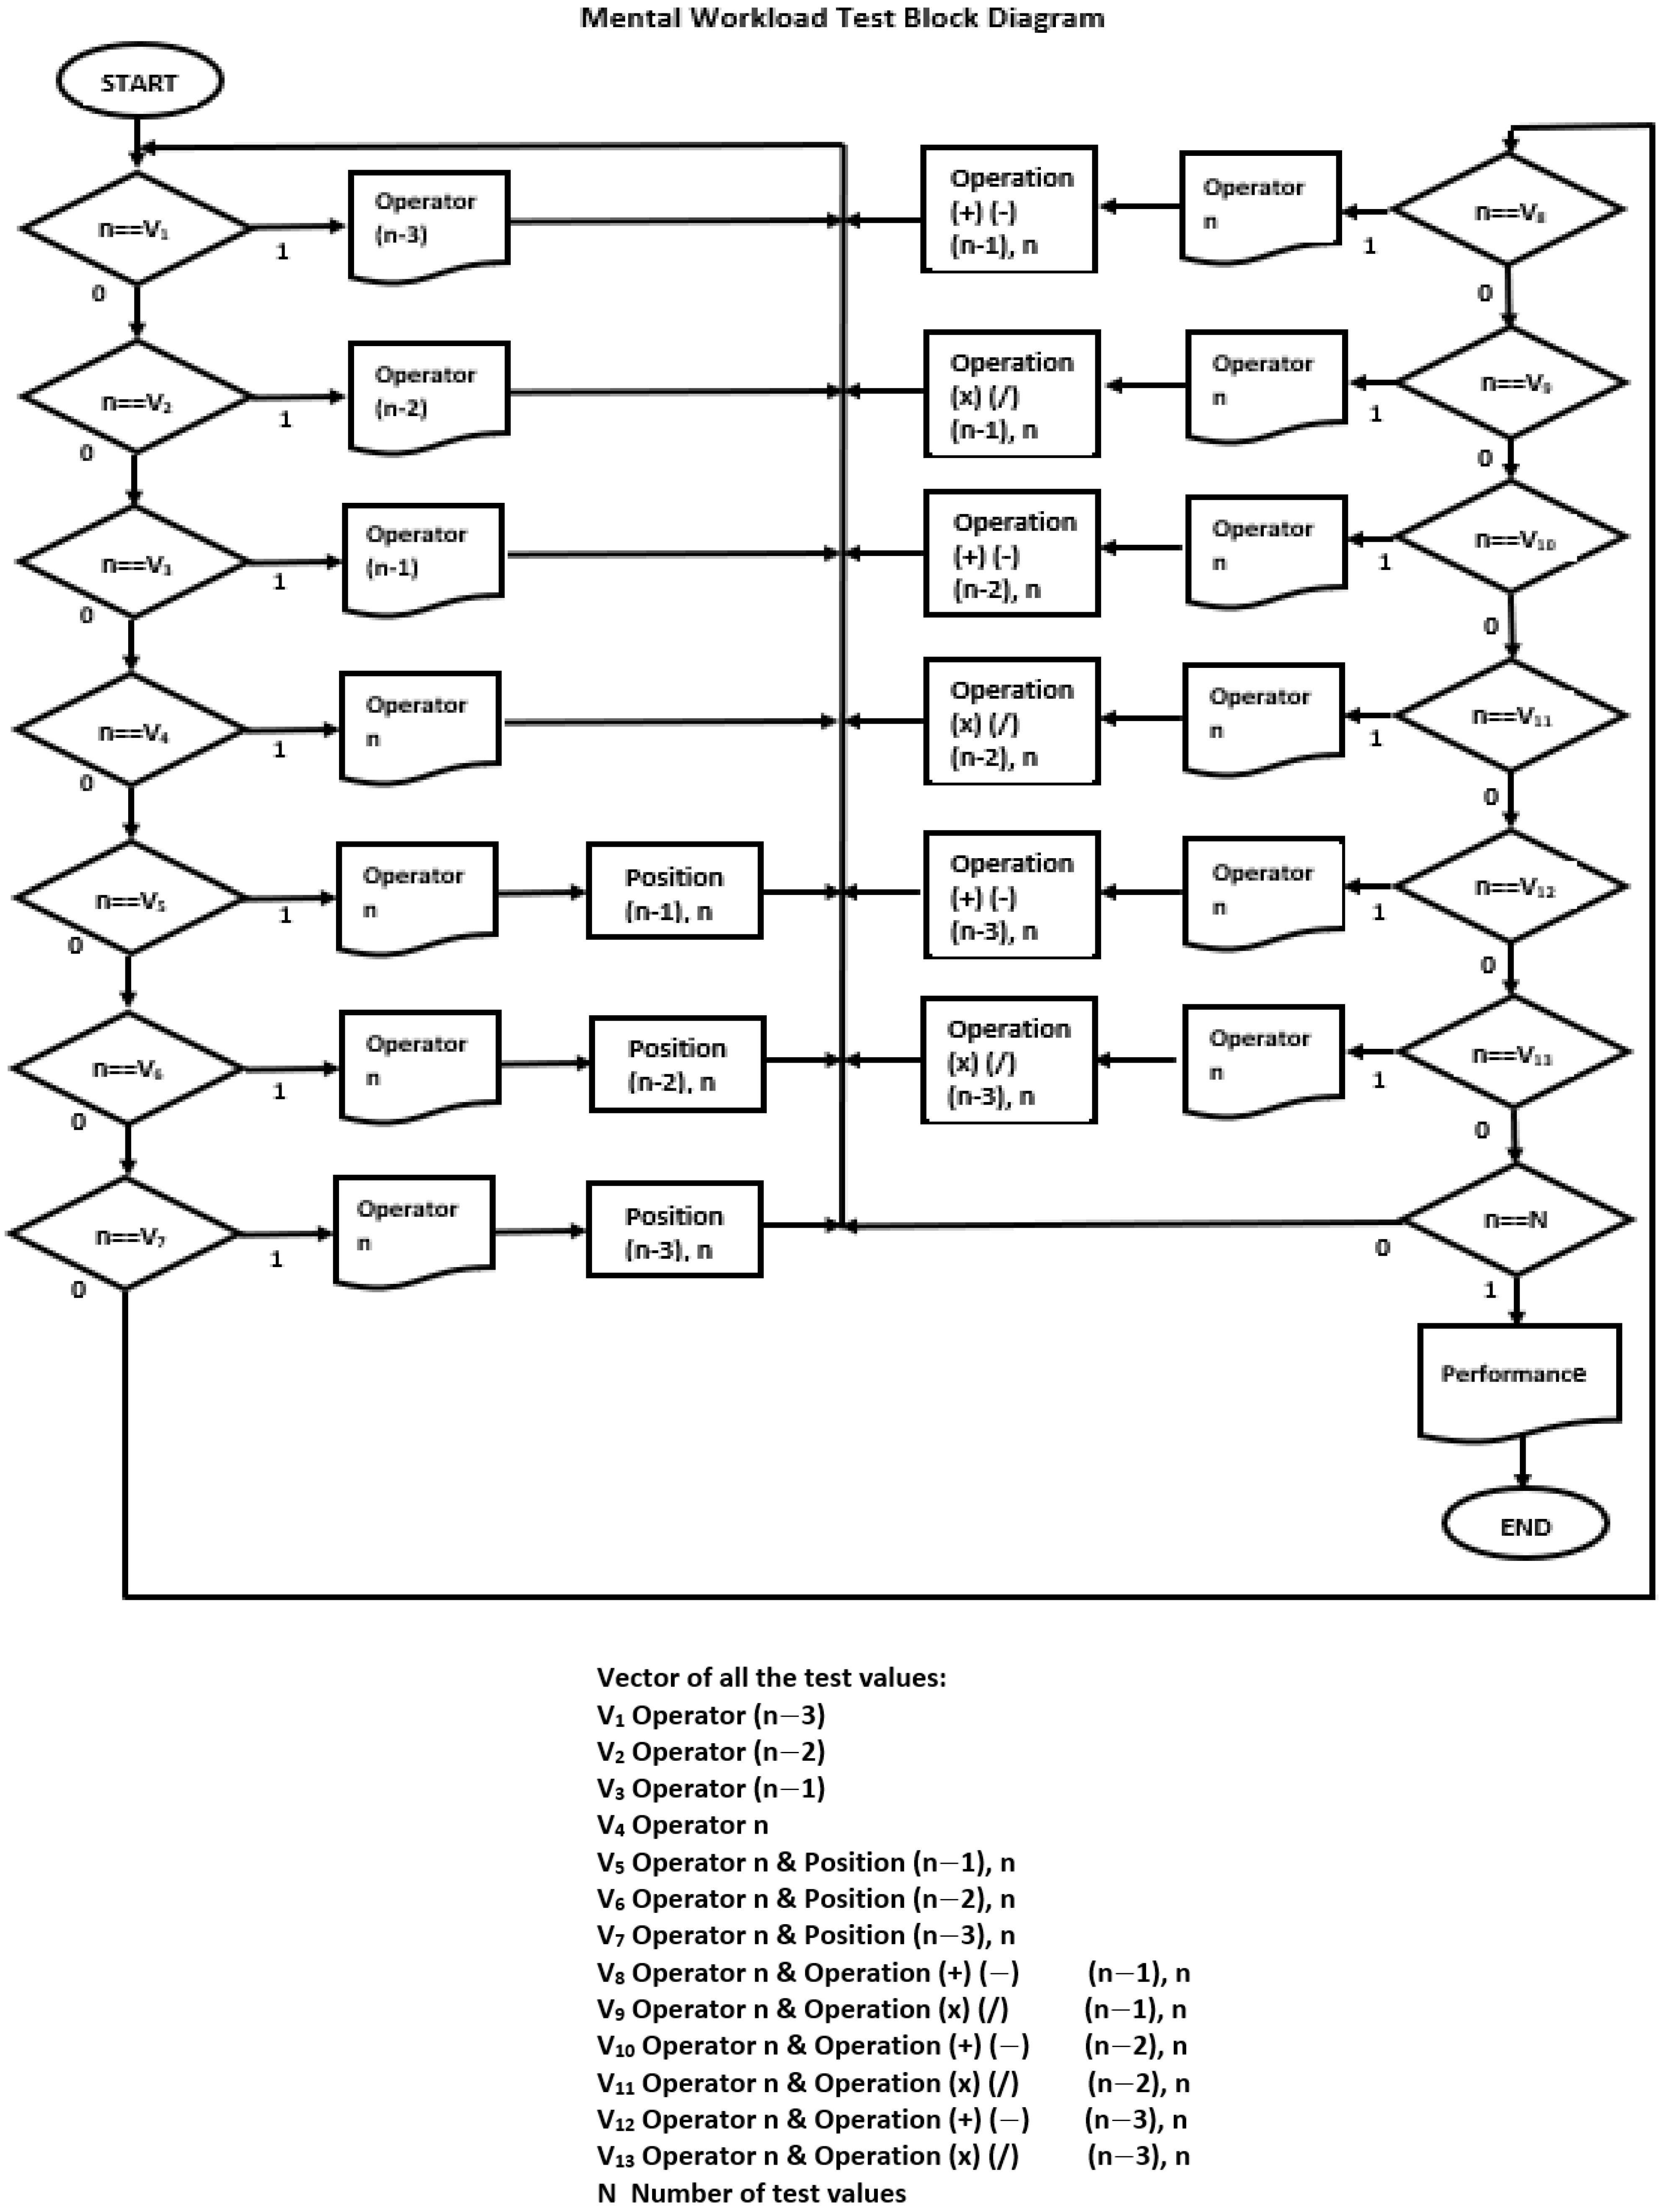
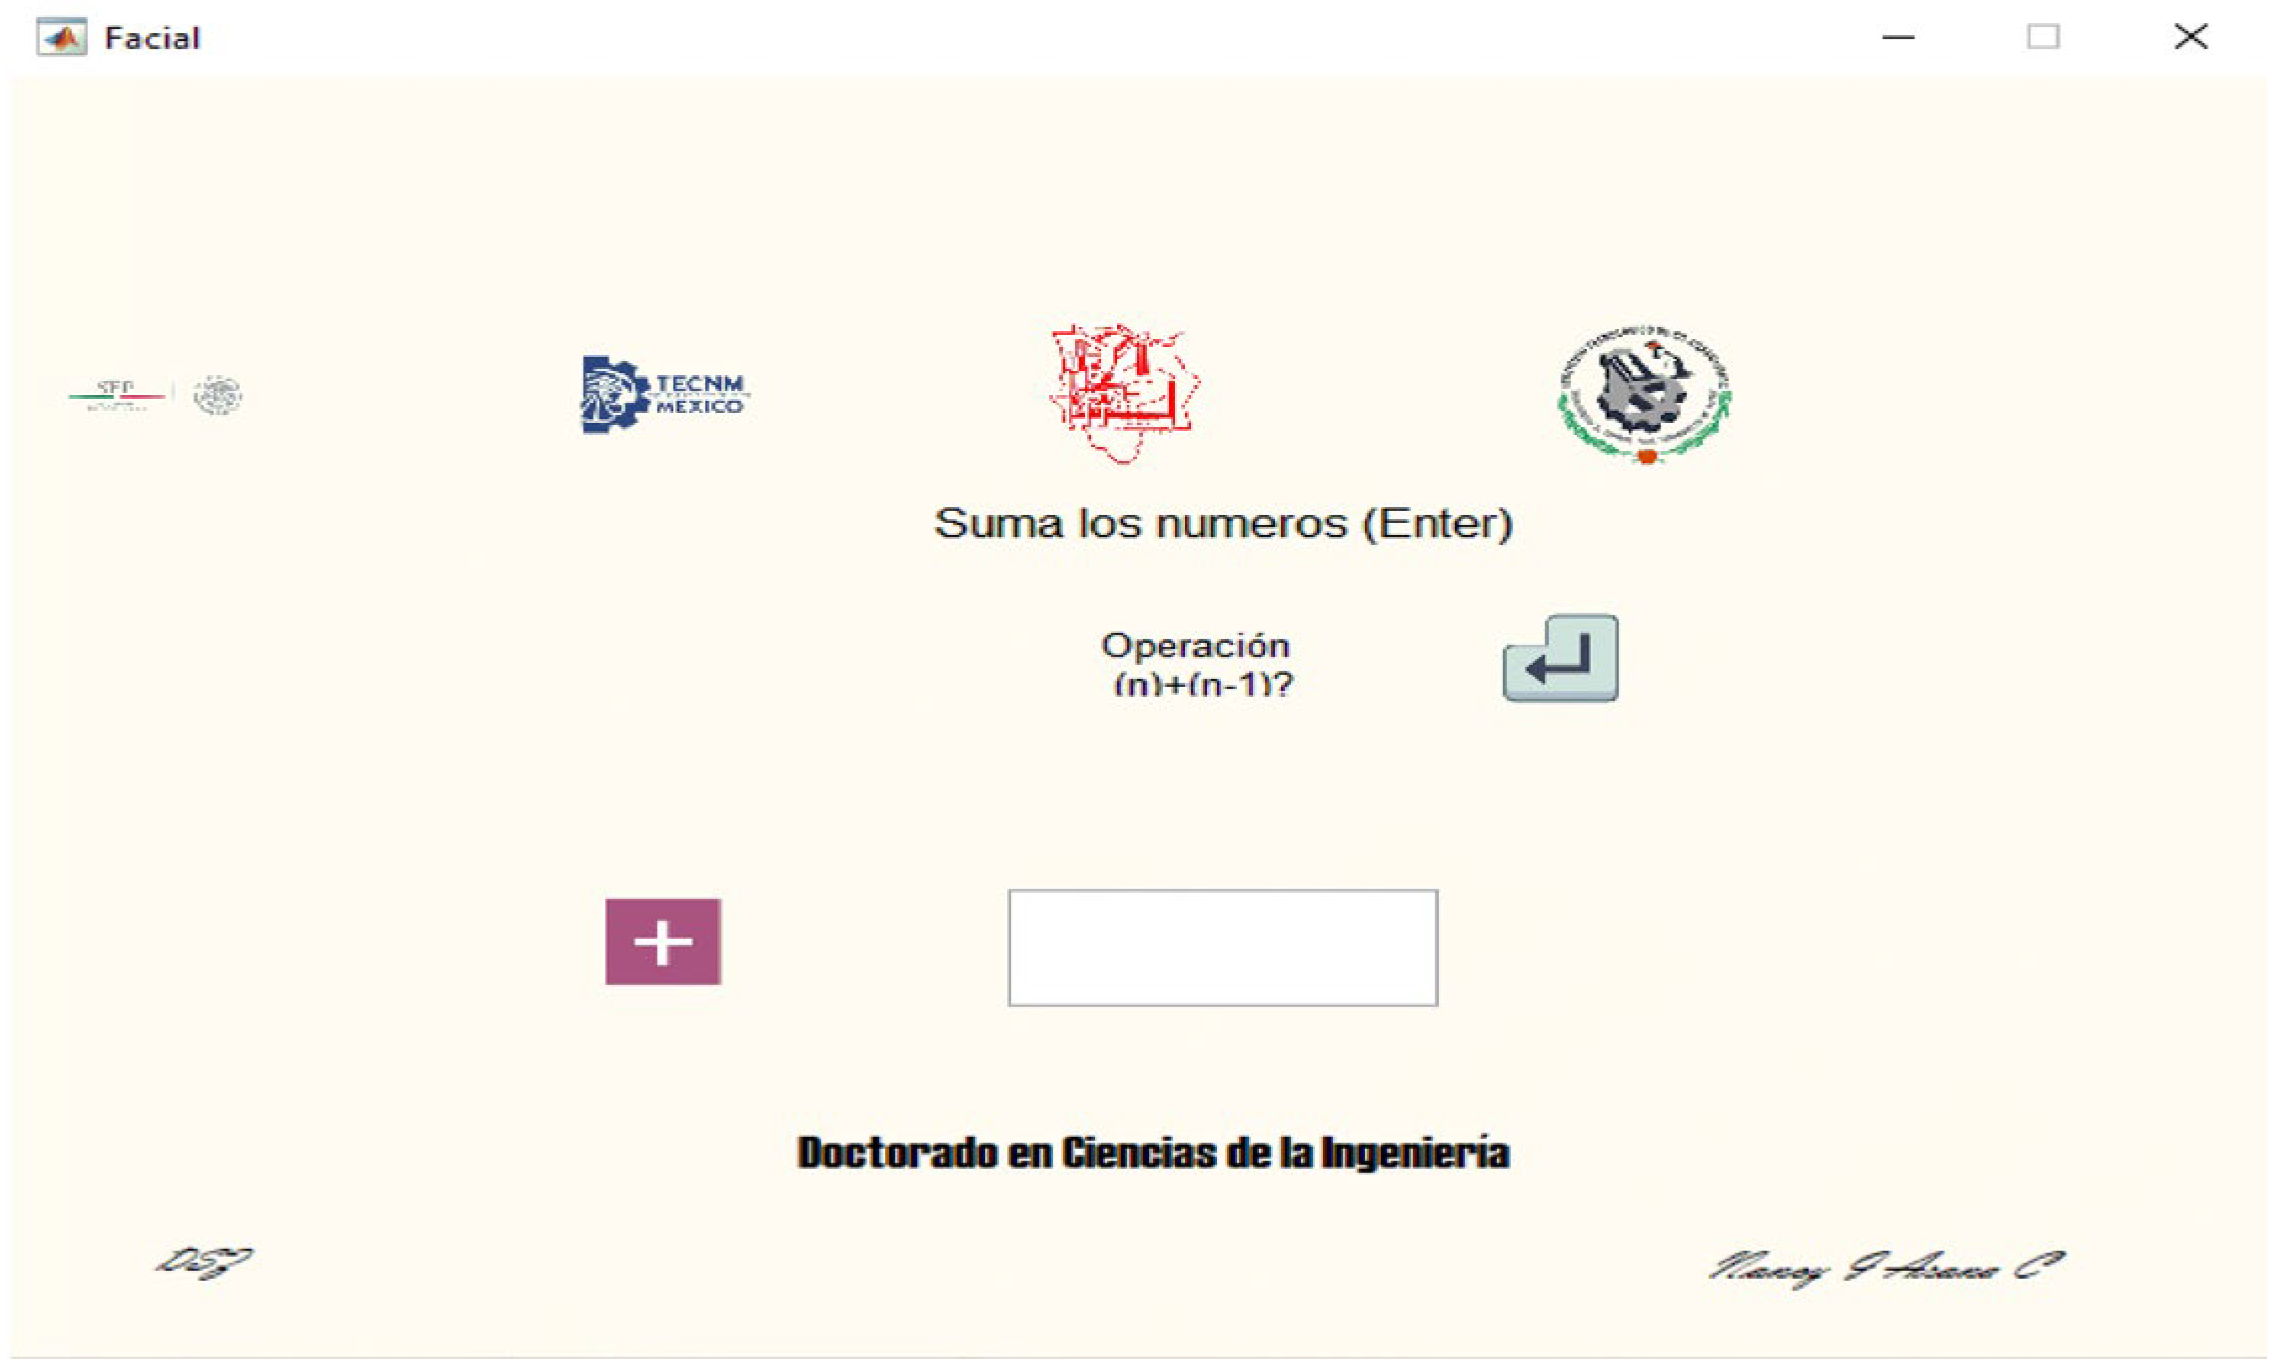
- Easy: It consists of identifying the position and adding and subtracting the operands in times (n) and (n1).
- Medium: It consists of performing addition or subtraction operations of the operands in times (n) and (n1) or (n2).
- Hard: It consists of performing one of the following operations: addition, subtraction, multiplication, or division of the operands in times (n) and (n2) or (n3).
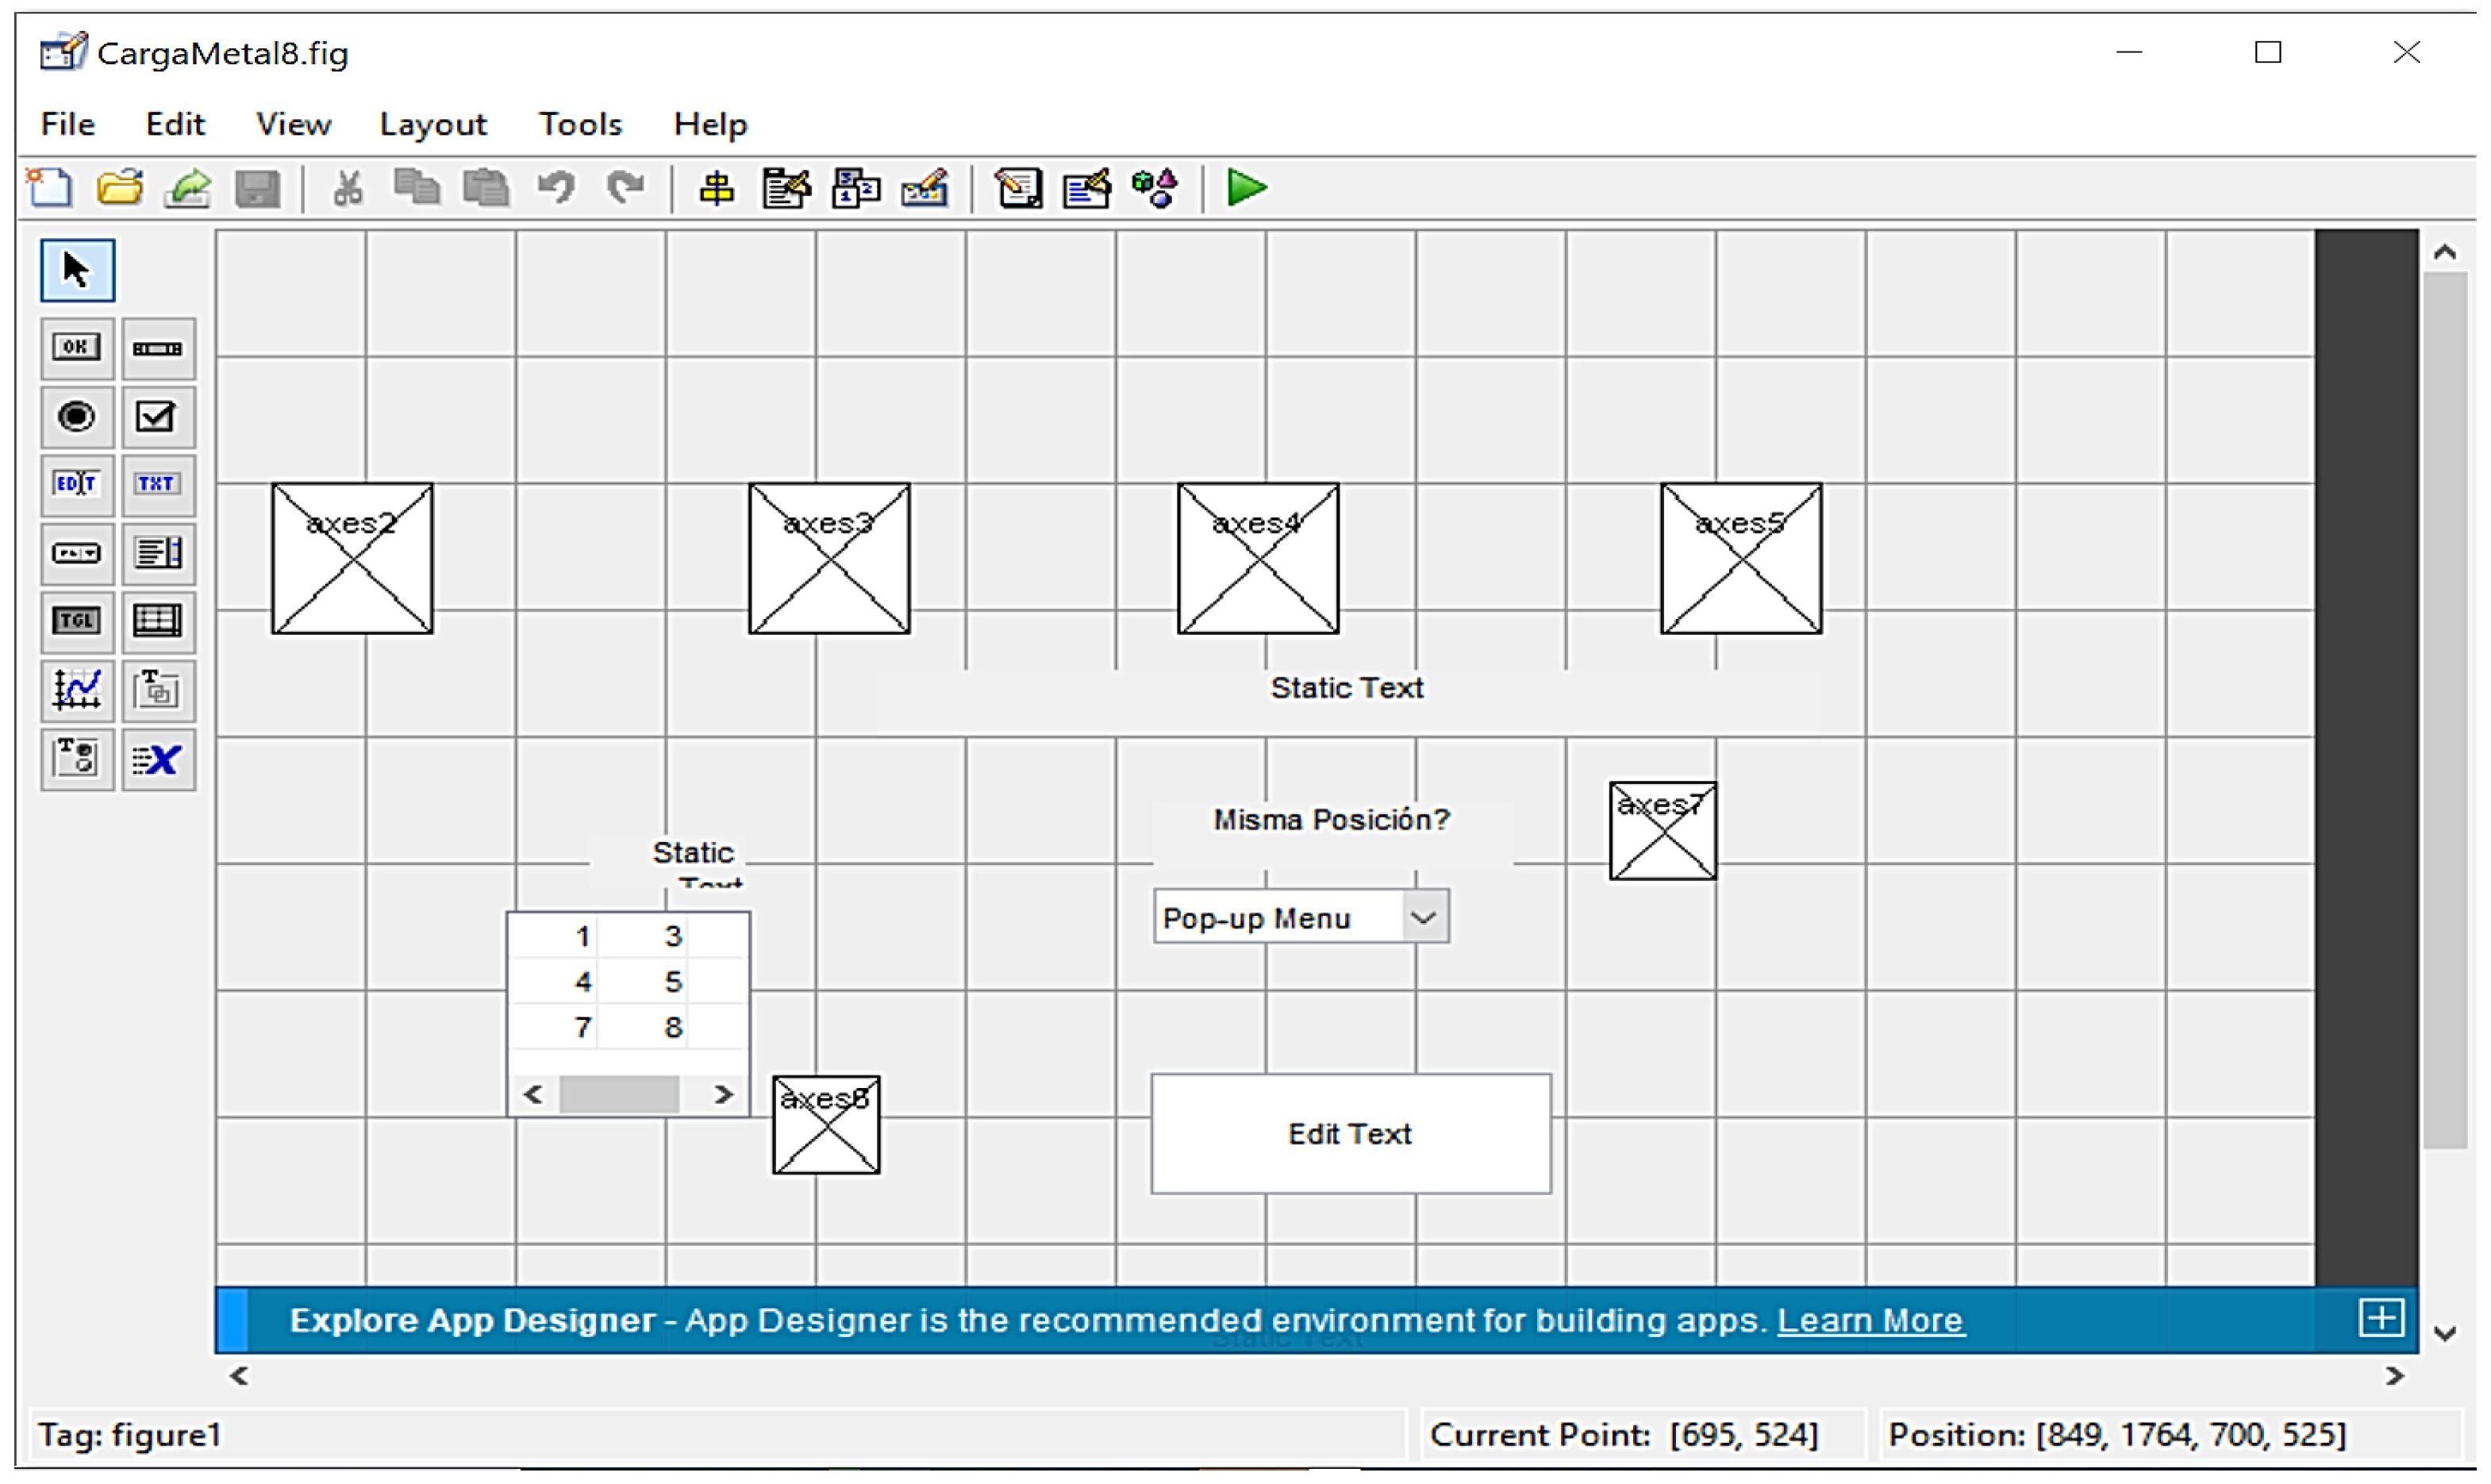
- text. Provides static text in the figure to provide information to the user and indicate values.
- popup menu. Creates a menu that displays a list of options on whether the operands at times n and (n1), (n2), and (n3) are in the same position or not. The user selects them by pressing the mouse button on the desired option.
- edit. An editable text field is created where the keyboard cursor becomes active and blinking, waiting for information to be entered. This is where the user writes the result of the mental operation he performs (addition, subtraction, multiplication, division).
- axes. Creates a Cartesian axis in the figure for images to be inserted. It is used to insert the icons shown to users to tell them what to do, for example, Memorize, Add, Subtract, Multiply, and Divide. It also indicates whether an answer should be given and whether it is correct or incorrect.
- uitable. Creates a table component in the figure for the user interface. It is used to display the 3 3 matrix where the operand is positioned.
- sound. This command lays an audio file (.wav) on the computer speaker. Audio clips simultaneously play as icons are displayed to instruct users regarding the activity they must perform, for example, Memorize, Add, Subtract, Multiply, or Divide.
2.4. Procedure for Interface Cognitive Evaluation
2.4.1. Phase 1: Task Analysis and Hierarchical Task Analysis (HTA)
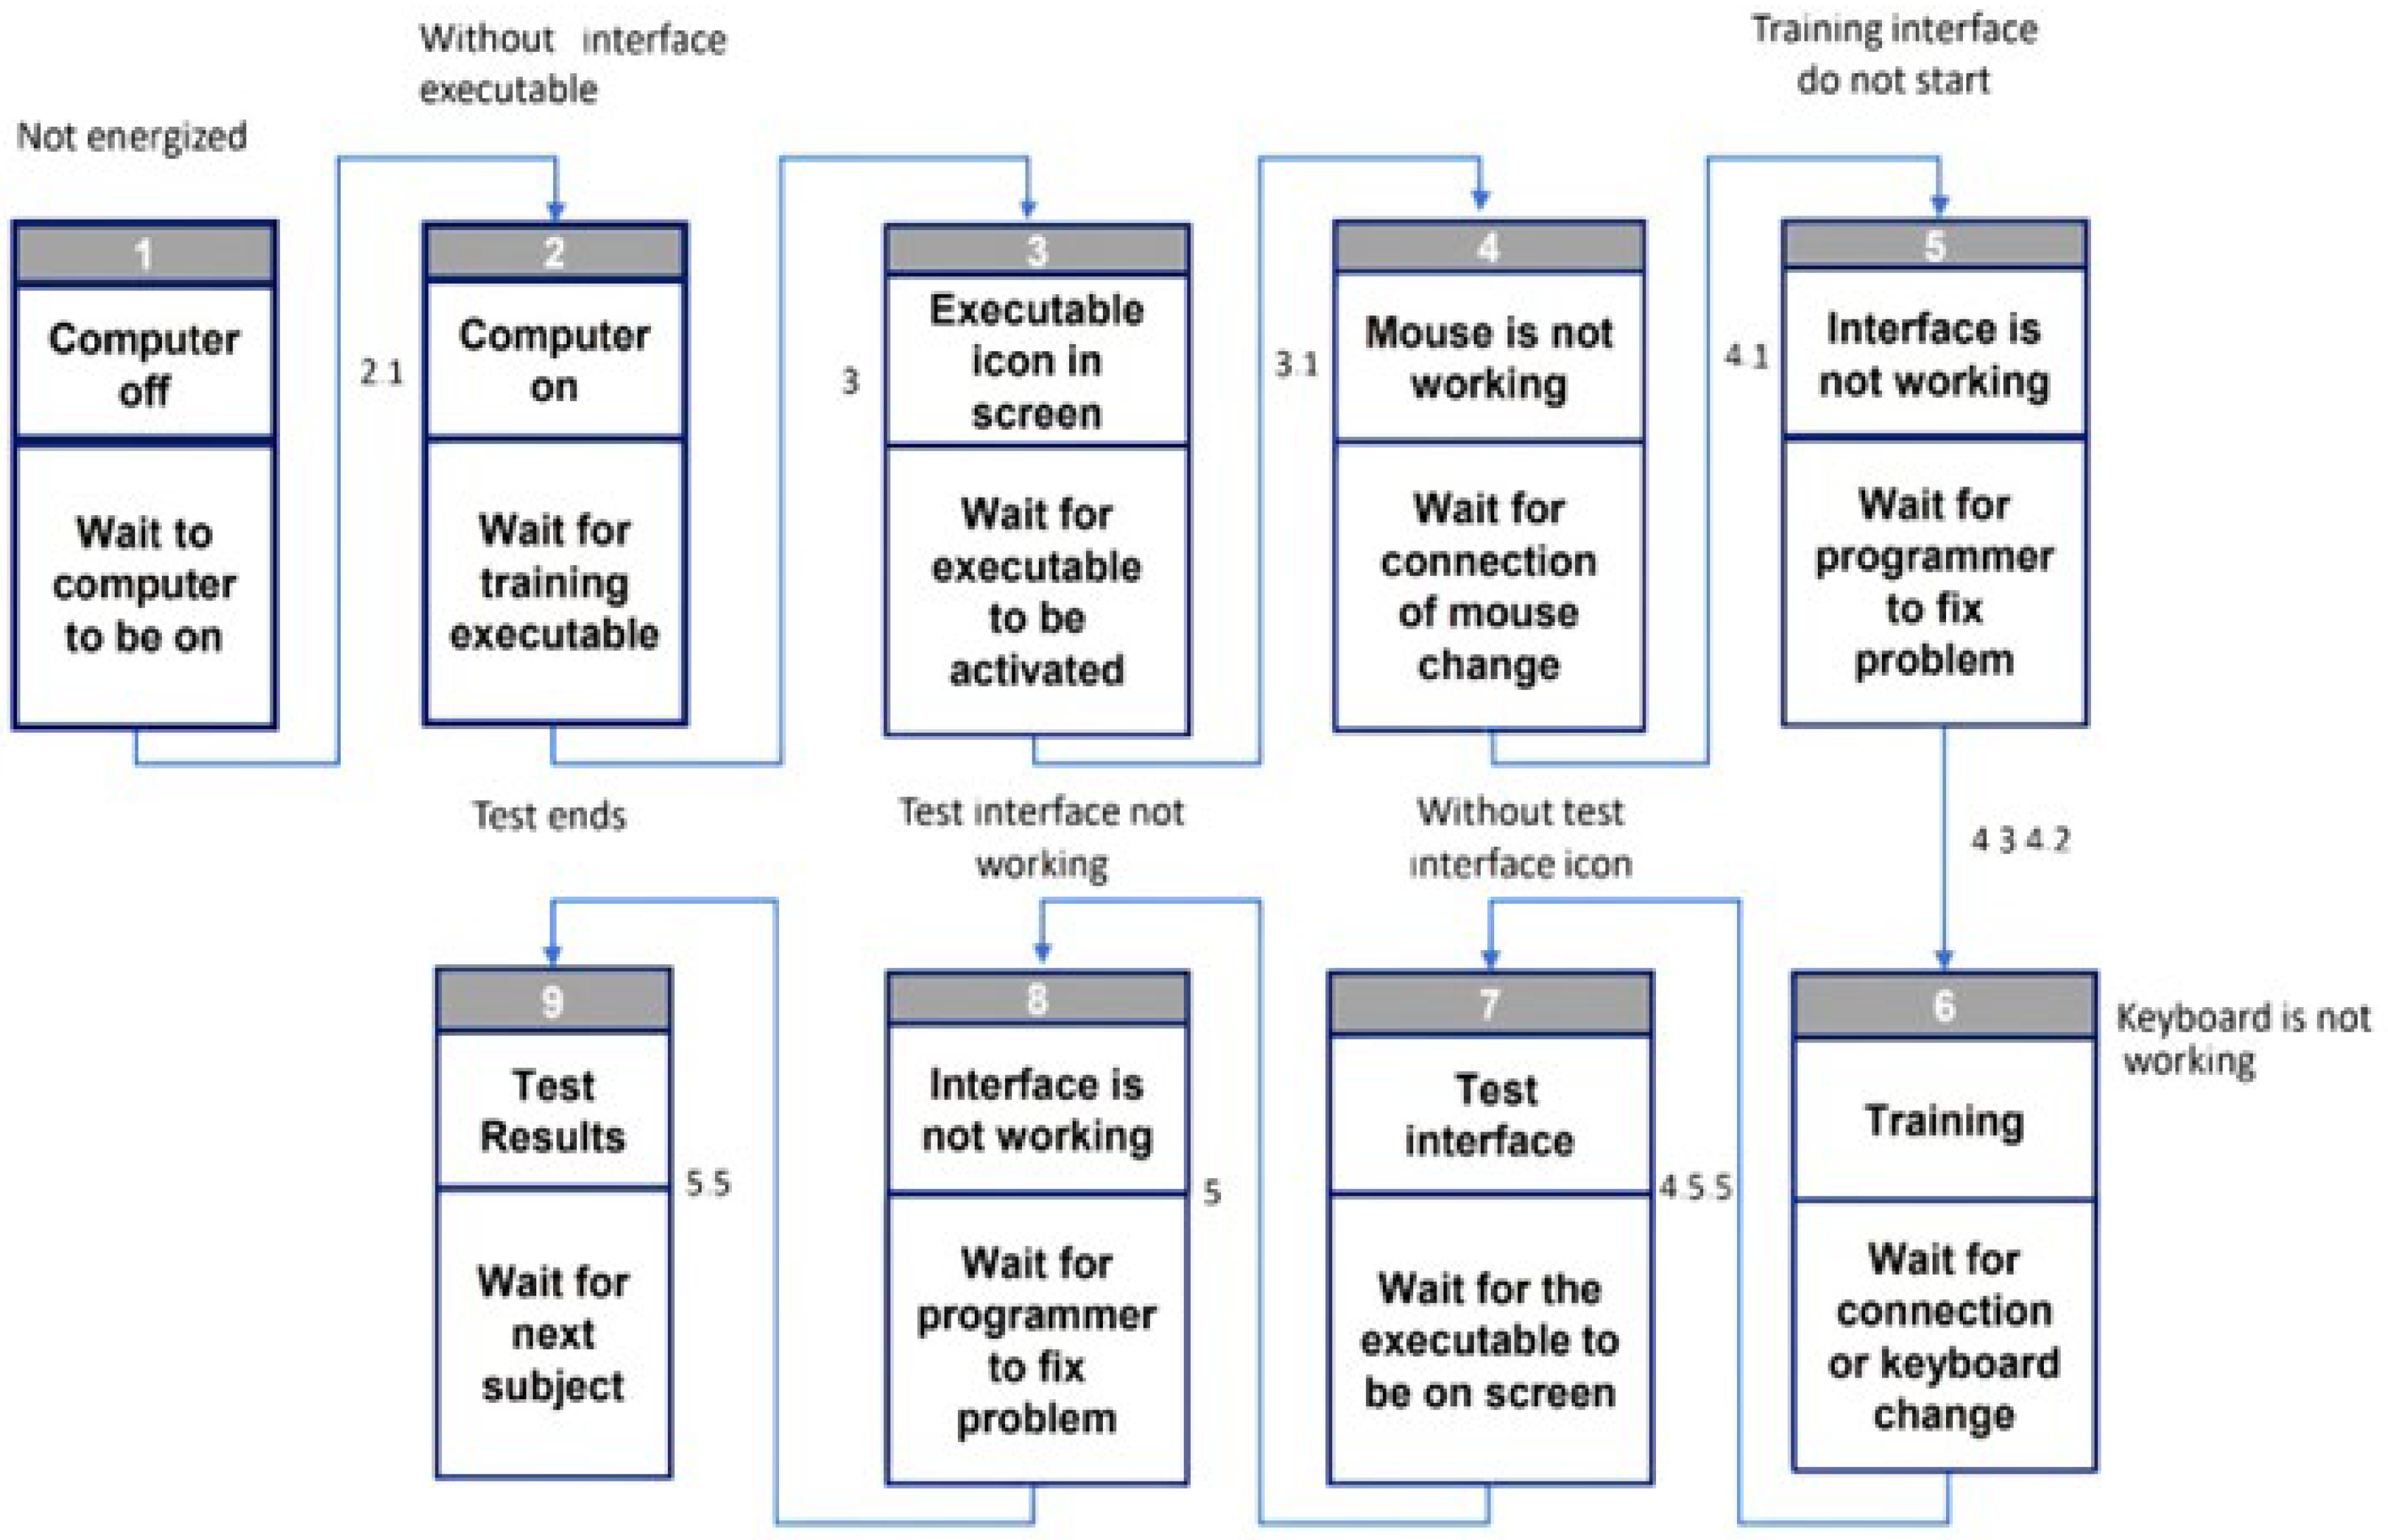
2.4.2. Phase 2: Task Analysis for Error Identification (TAFEI)
- Step 1: Create space–time diagrams (SSD), including the list of states that may happen in the interface. These states are constructed to represent the interface behavior as a whole (artifact), and they consist of a series of states that the interface passes through, from a starting state to the goal state. For each series of states, there will be a current state and a set of possible exits to other states.
- Step 2: Create the transition matrix, including the detection of impossible transitions denoted by the (-) symbol, possible and desirable denoted by (L), and possible but undesirable/Illegal denoted by (I). These transitions will be further analyzed. TAFEI intends to assist the interface (artifact) design by illustrating when a state transition is possible but undesirable (Illegal, I). Consequently, designers will try to make all the illegal transitions impossible and facilitate the cooperative attempt of interface use. All possible states are entered as headers on the matrix, where the cells represent the state transitions.
2.4.3. Phase 3: Experiment for Interface Validation of Mental Workload Using Dual N-Back Tasks
2.4.4. Phase 4: Mental Workload Subjective Evaluation Using NASA-TLX
2.4.5. Phase 5: Statistical Analysis
3. Results
3.1. Results of Graphical User Interface (GUI) Design
- 3 3 Matrix
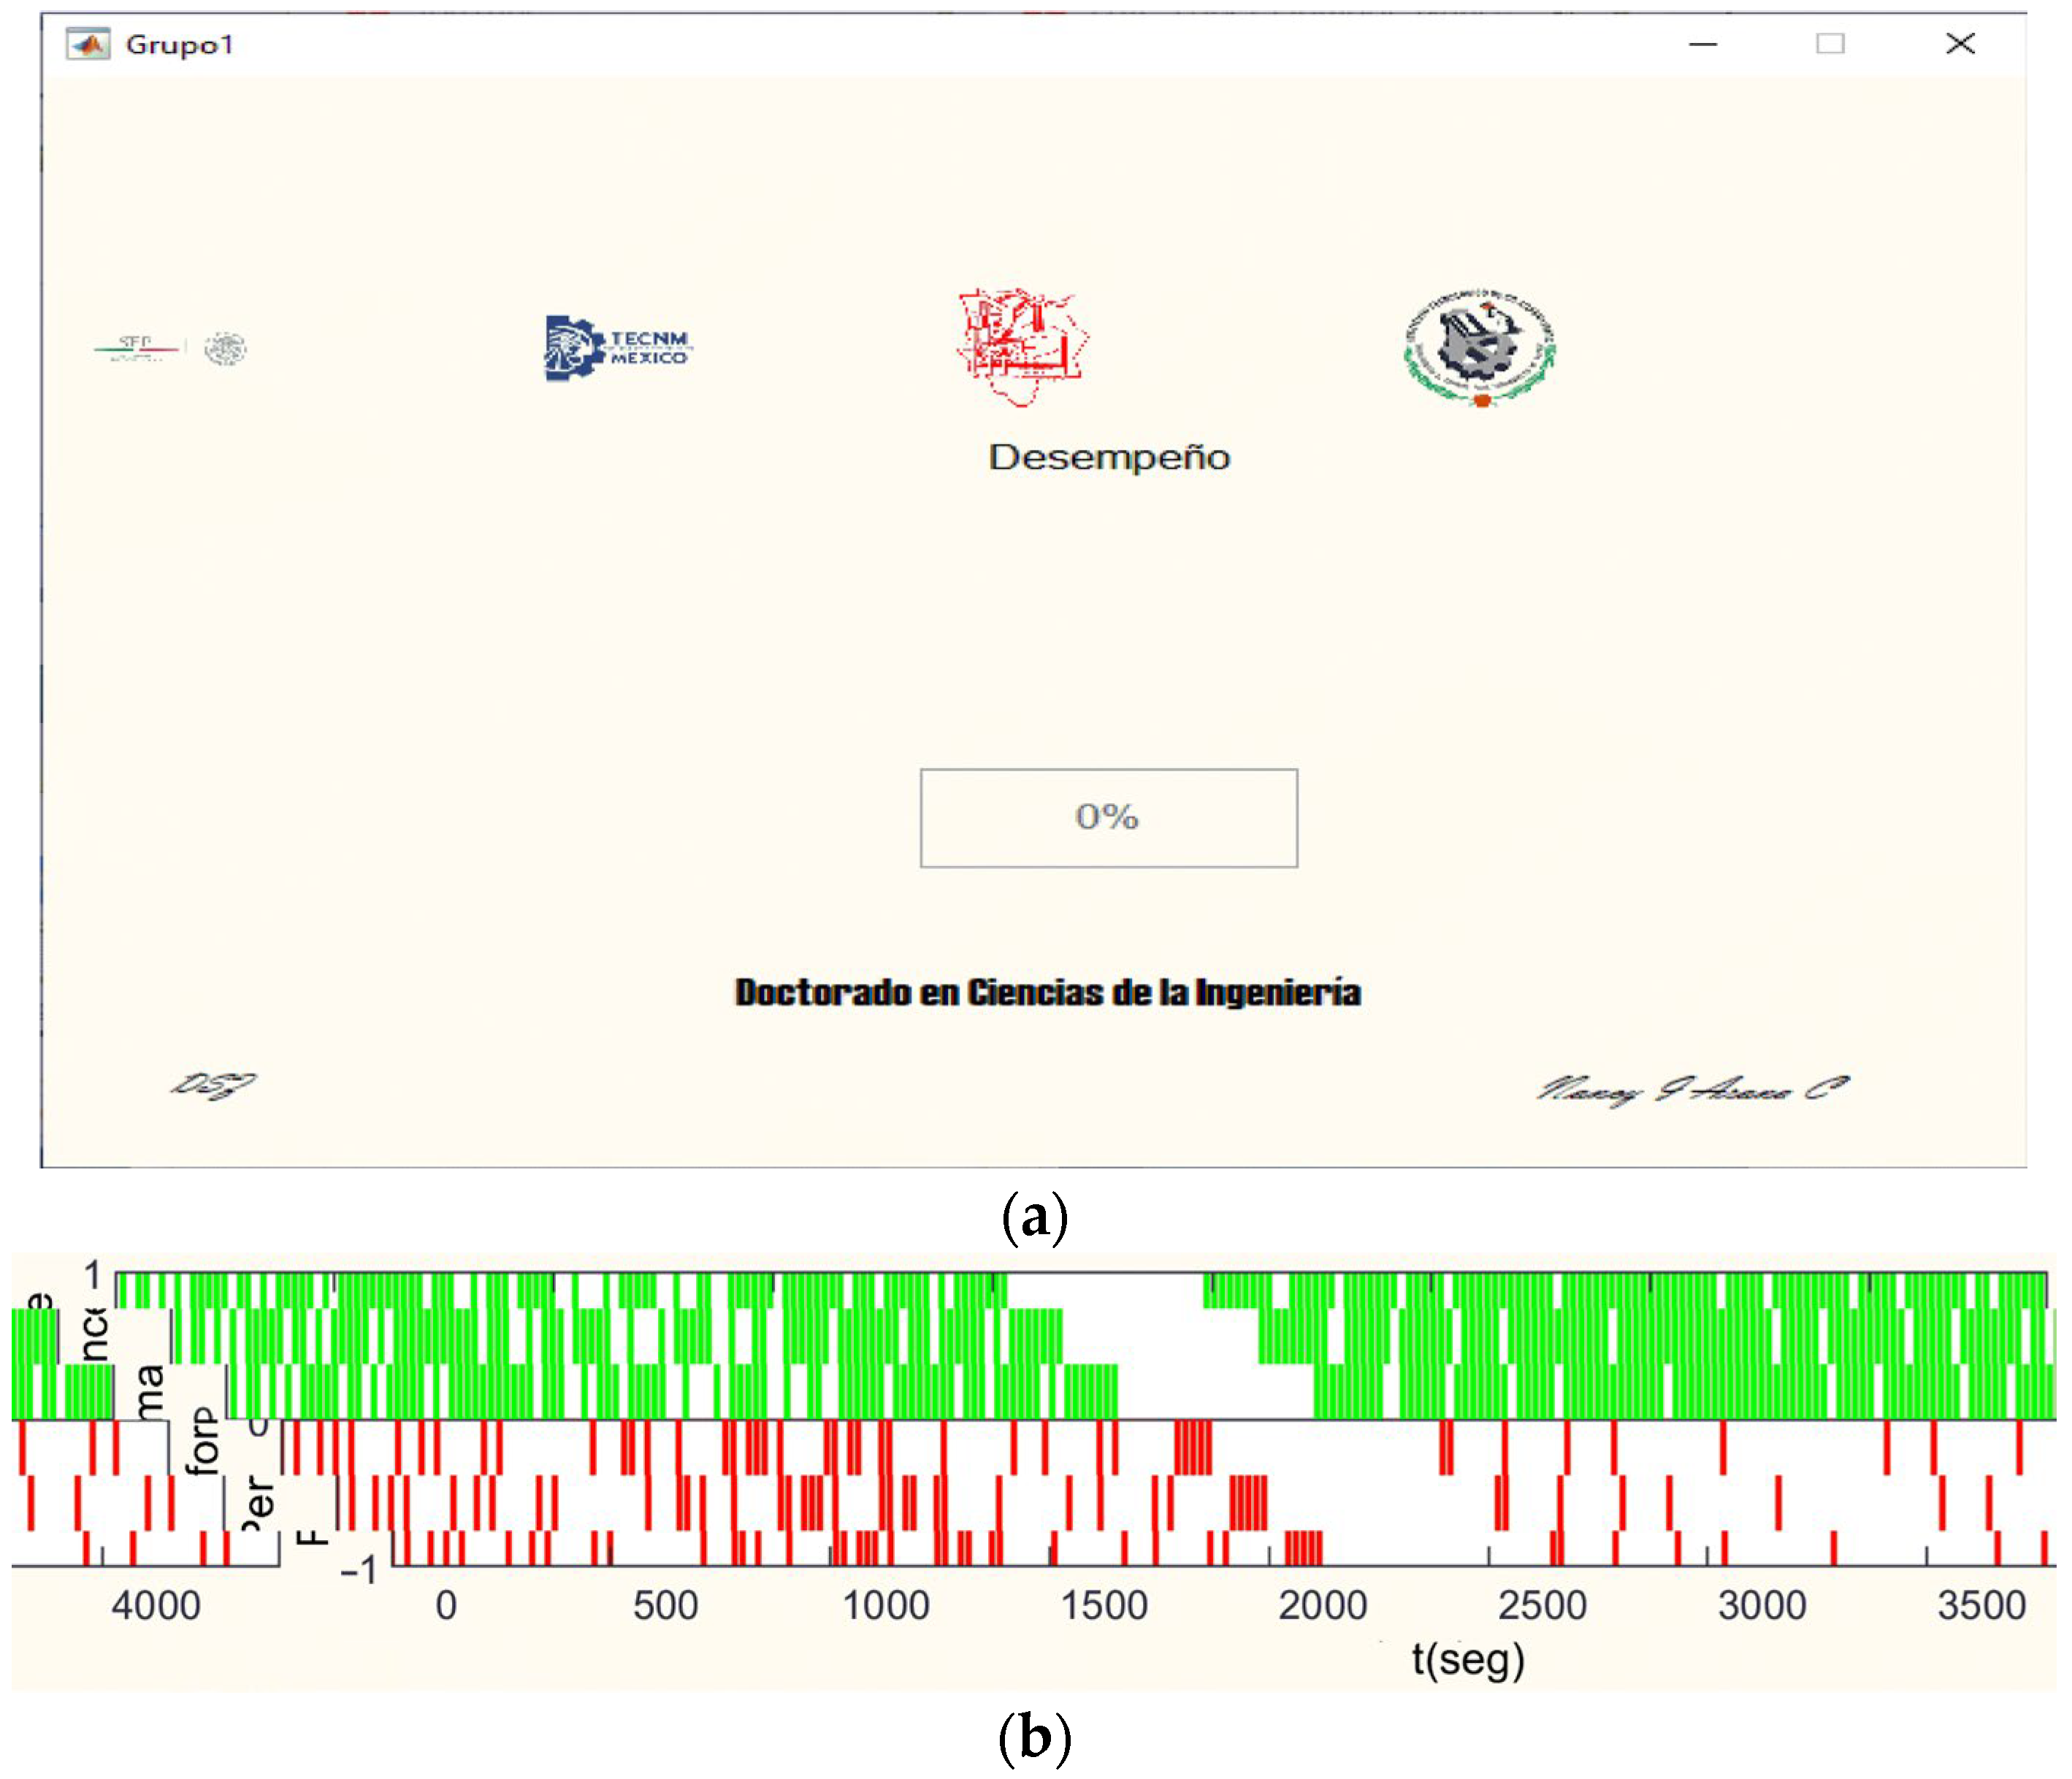
- Response box
- Operation
3.2. Hierarchical Task Analysis (HTA) Results
3.3. Task Analysis for Error Identification (TAFEI)
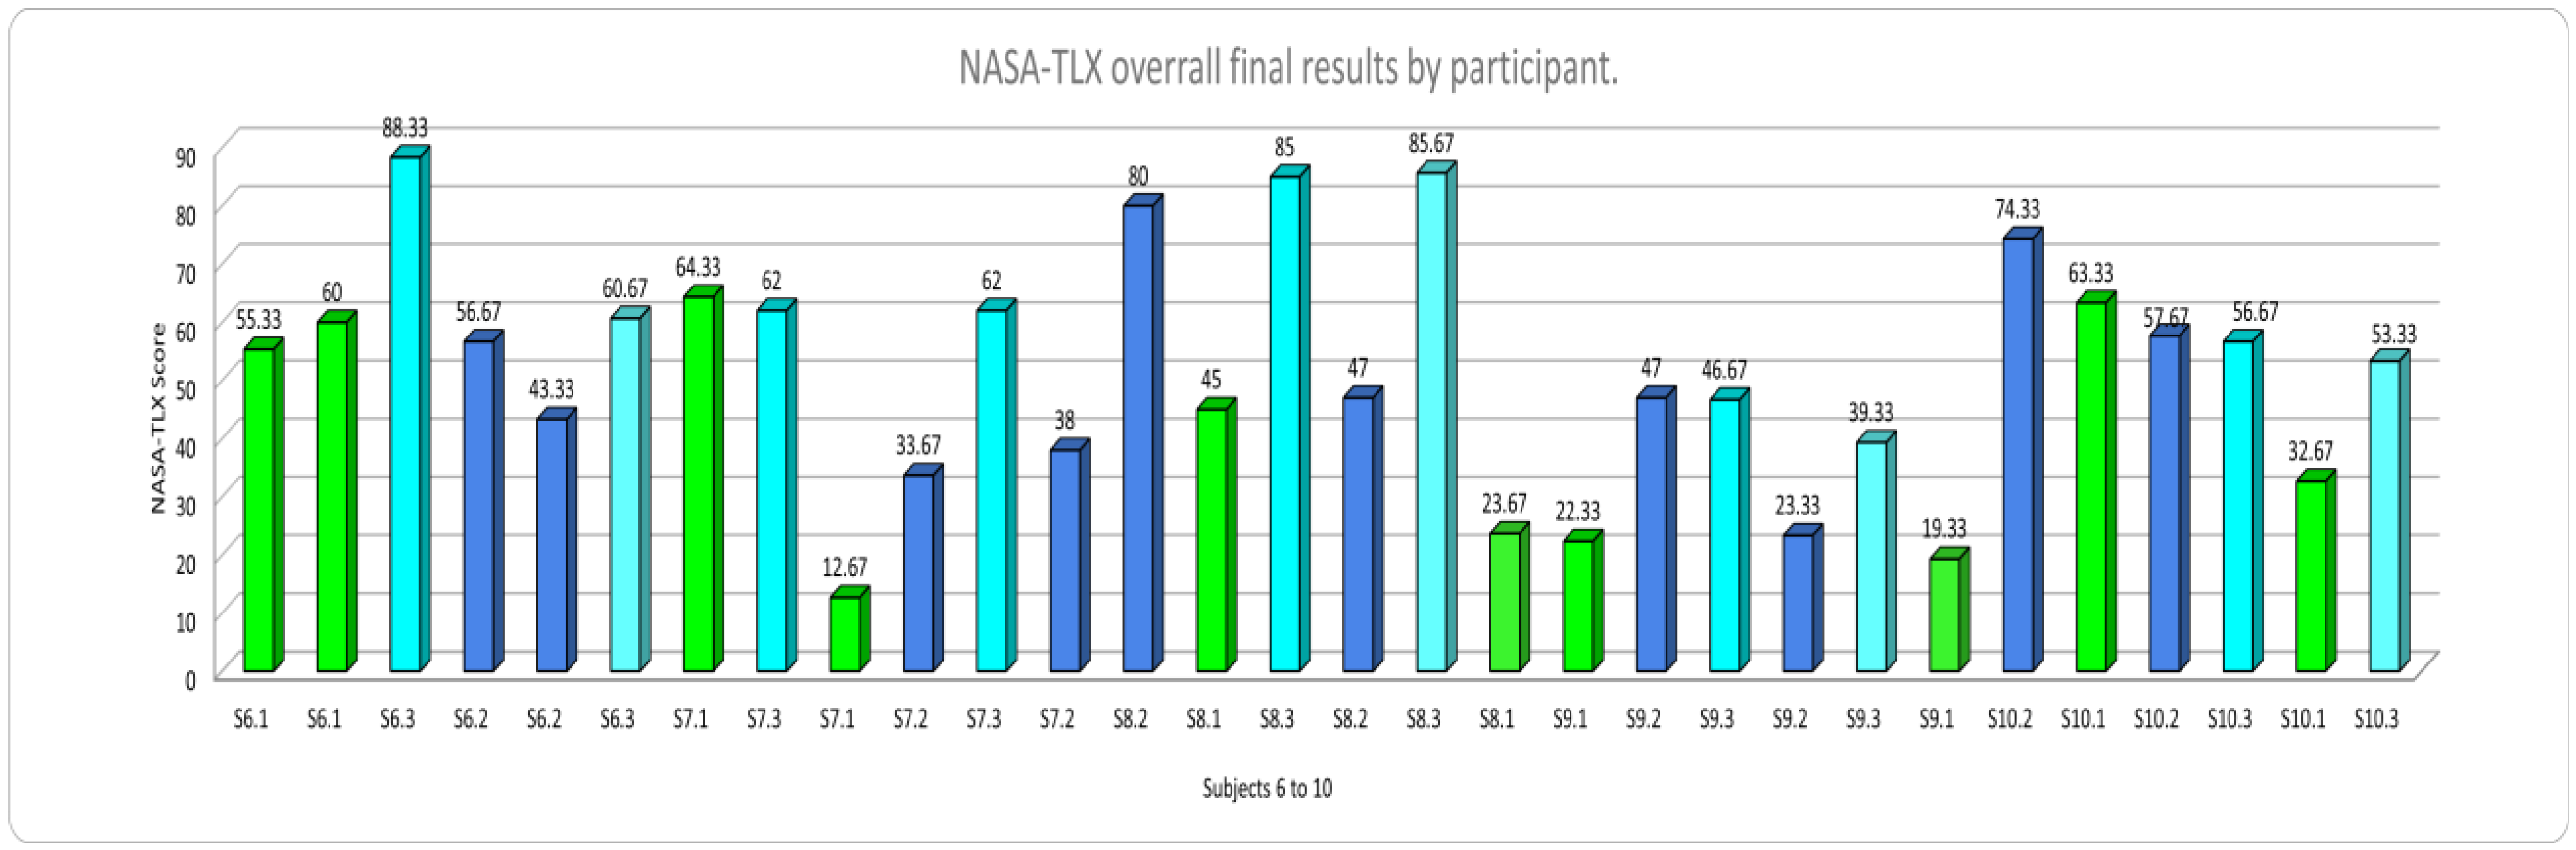
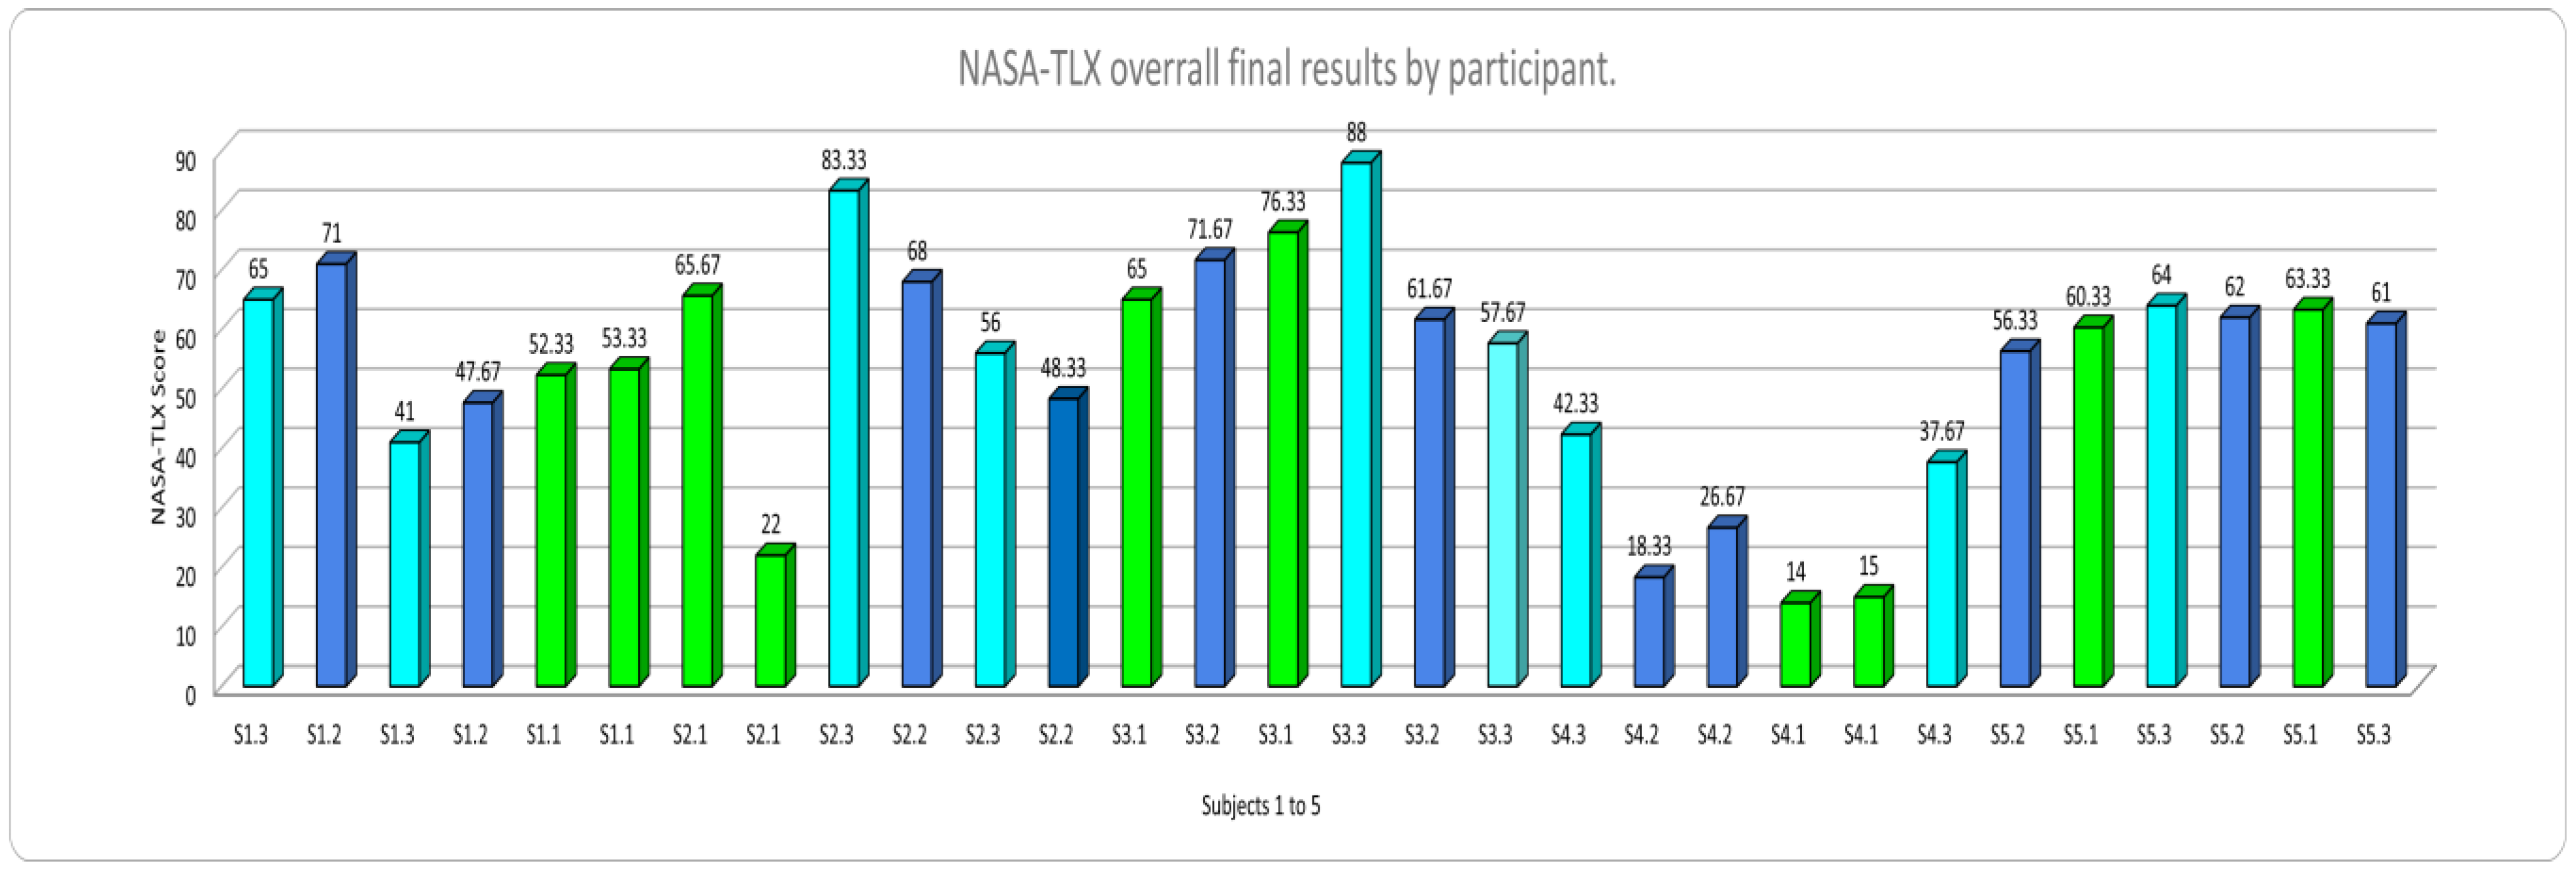
3.4. Results for Mental Workload Interface Validation of Mental Workload Using NASA-TLX and Statistical Analysis
4. Discussion
5. Conclusions
Author Contributions
Funding
Institutional Review Board Statement
Informed Consent Statement
Data Availability Statement
Acknowledgments
Conflicts of Interest
Appendix A

| Subtask | Elementary Task | Specific Activity | |||
|---|---|---|---|---|---|
| 0. Interface validation Plan 0: Do 1,2,3 in order. Do 4 in the first session, and when required, after and to finish 5. | 1. Sitting in front of the computer Plan 1: Do 1.1 and 1.2 in any order. | 1.1 Arrange the chair in position to the desk. | |||
| 1.2 Arrange keyboard. | |||||
| 2. Locate the Mouse. Plan 2: Do 2.1 | 2.1 Arrange Mouse. | ||||
| 3. Visualize the Computer screen. Plan 3: Do 3.1 | 3.1 Locate the executable of the program corresponding to training and click. | ||||
| 4. Training Plan 4: do 4.1, 4.2, 4.3, 4.4, and 4.5 in order. | 4.1 Beginning of the training | ||||
| 4.2 Digit position training Plan 4.2: 4 times ((Do 4.2.1 & 4.2.2) × 2 then 4.2.3, 4.2.4 & 4.2.5 in order)) | 4.2.1 Listen to the word: “Memorize.” | ||||
| 4.2.2 See 3 3 matrix with a number from 1 to 9. Memorize the digit and position. | |||||
| 4.2.3 Look at the sentence “Same Position” (n)/(n-1)? on the computer screen. | |||||
| 4.2.4 Select “no” if the position of the corresponding digits is different or “Yes” if it is the same. | |||||
| 4.2.5 The subject receives feedback. | |||||
| 4.3 Addition or subtraction training 1 N-Back (n1) Plan 4.3: 4 times ((Do 4.3.1 × 2, then 4.3.2) then 4.3.3 & 4.3.4 in order) | 4.3.1 Memorize. Plan 4.3.1 Do 4.3.1.1 and 4.3.1.2 in order | 4.3.1.1 Listen and memorize. | |||
| 4.3.1.2 Look at the 3 × 3 matrix with a digit from 0 to 9. Memorize digits and position. | |||||
| 4.3.2 Look at the writing on the computer screen “Operation (n)/(n1)” and operation determination (addition or subtraction) Plan 4.3.2: Do 4.3.2.1 and 4.3.2.2 in order. | 4.3.2.1 Listen and see the mathematical operation to be completed. | ||||
| 4.3.2.2 Do the operation mentally. | |||||
| 4.3.3 Answer. Plan 4.3.3: Do 4.3.3.1 & 4.3.3.2 in order | 4.3.4.1 Position the cursor in the answer box and click. | ||||
| 4.3.4.2 Use the keyword to write the answer. | |||||
| 4.3.4 Receive Feedback in a visual way | |||||
 | If correct | ||||
 | If wrong | ||||
| 4.4 Addition or subtraction training 2 N-Back (n2) Plan 4.4: 4 times ((Do 4.4.1 × 3, then 4.4.2) then 4.4.3, 4.4.4 & 4.4.5 in order) | 4.4.1 Memorize. Plan 4.4.1: Do 4.4.1.1 & 4.4.1.2 in order. | 4.4.1.1 Listen and memorize. | |||
| 4.4.1.2 Look at the 3 × 3 matrix with a digit from 0 to 9. Memorize digits and position. | |||||
| 4.4.2 Look at the writing “Operation (n)/(n2)” on the computer screen | |||||
| 4.4.3 See operation determination (addition or subtraction) Plan 4.4.3: Do 4.4.3.1 and 4.4.3.2 in order | 4.4.3.1 Listen and see the operation to be completed | ||||
| 4.4.3.2 Do the operation mentally | |||||
| 4.4.4 Answer Plan 4.4.4: Do 4.4.4.1 & 4.4.4.2 in order | 4.4.4.1 Position the cursor in the answer box and click | ||||
| 4.4.4.2 Using the keyboard to write the answer. | |||||
| 4.4.5 Receive Feedback in a visual way | |||||
| If correct | ||||
| If wrong | ||||
| 4.5 Multiplication or division training 3 N-Back (n3) | 4.5.1 Memorize Plan 4.5.1 Do 4.5.1.1 and 4.5.1.2 in order. | 4.5.1.1 Listen and memorize. | |||
| 4.5.1.2 Look at the 3 × 3 matrix with a digit from 0 to 9. Memorize digits and position. | |||||
| 4.5.2 See writing “Operation (n)/(n3)” on the computer screen | |||||
| 4.5.3 See operation determination (multiplication or division). Plan 4.5.3: Do 4.5.3.1 and 4.5.3.2 in order. | 4.5.3.1 Listen and observe the operation to be completed. | ||||
| 4.5.3.2 Do operation mentally. | |||||
| 4.5.4 Answer Plan 4.5.4: Do 4.5.4.1 & 4.5.4.2 in order. | 4.5.4.1 Position the cursor in the answer box and click. | ||||
| 4.5.4.2 Using the keyboard, write the answer. | |||||
| 4.5.5 Receive Feedback in a visual way | |||||
| If correct | ||||
| If wrong | ||||
| 5 Test Plan 5: Do 5.1 or 5.3, or 5.4 as corresponding | 5.1 Low Mental Workload Interface Plan 5.1: 13 times (Do 5.1.1, 5.1.2, 5.1.3, 5.1.4, 5.1.5 in order) | 5.1.1 Memorize. Plan 5.1.1: 2 times (Do 5.1.1.1 & 5.5.1.2 in order) | 5.1.1.1 Listen and memorize. | ||
| 5.1.1.2 Look at the 3 × 3 matrix with a digit from 0 to 9. Memorize digits and position. | |||||
| 5.1.2 See the writing on the computer screen. Plan 5.1.2: Look at 5.1.2.1 or 5.1.2.2 | 5.1.2.1 Look at the writing on the computer screen “Same Position (n)/(n1)”? | ||||
| 5.1.2.2 Observe writing on the computer screen “Operation (n)/(n1)”? | |||||
| 5.1.3 See the mathematical equation determination (position, addition, or subtraction). Plan 5.1.3: Do 5.1.3.1 and 5.1.3.2 in order. | 5.1.3.1 Listen and observe the mathematical operation to be completed | ||||
| 5.1.3.2 Do the operation mentally. | |||||
| 5.1.4 Answer. Plan 5.1.4: Do 5.1.4.1 & 5.1.4.2 in order. | 5.1.4.1 Position the cursor in the answer box and click. | ||||
| 5.1.4.2 Select the answer or use the keyboard to write the answer as it corresponds. | |||||
| 5.1.5 Receive Feedback in a visual way | |||||
| If correct | ||||
| If wrong | ||||
| 5.2 Medium Mental Workload Interface | 5.2.1 Memorize. Plan 5.2.1: 2 times if (n1) or 3 times if (n2) as it corresponds (Do 5.2.1.1 & 5.2.1.2 in order) | 5.2.1.1 Listen and memorize. | |||
| 5.2.1.2 Look at the 3 3 matrix with a digit from 0 to 9. Memorize digits and position. | |||||
| 5.2.2 See the writing on the computer screen Plan 5.2.2: Look 5.2.2.1 or 5.2.2.2 | 5.2.2.1 Look at the writing on the screen “Operation (n)/(n1)”? | ||||
| 5.1.2.2 Look at the writing on the screen “Operation (n)/(n2)”? | |||||
| 5.2.3 See mathematical operation determination (Addition or subtraction). Plan 5.2.3: Do 5.2.3.1 and 5.2.3.2 in order | 5.2.3.1 Listen and observe the mathematical operation to be completed. | ||||
| 5.2.3.2 Do operation mentally. | |||||
| 5.2.4 Answer. Plan 5.2.4: Do 5.2.4.1 & 5.2.4.2 in order | 5.2.4.1 Position the cursor in the answer box and click. | ||||
| 5.2.4.2 Use the keyboard to write the answer. | |||||
| 5.2.5 Receive Feedback in a visual way | |||||
| If correct | ||||
| If wrong | ||||
| 5.3 High Mental Workload Interface | 5.3.1 Memorize. Plan 5.3.1: 3 times if (n2) or 4 times if (n3) as it corresponds (Do 5.3.1.1 & 5.3.1.2 in order) | 5.3.1.1 Listen and memorize. | |||
| 5.3.1.2 Look at the 3 × 3 matrix with a digit from 0 to 9. Memorize digits and position. | |||||
| 5.3.2 See writing. Plan 5.3.2: Look at 5.3.2.1 or 5.3.2.2 | 5.3.2.1 Look at the writing on the screen “Operation (n)/(n2)”? | ||||
| 5.3.2.2 Look at the writing on the screen “Operation (n)/(n3)”? | |||||
| 5.3.3 See mathematical operation determination (Multiplication or division). Plan 5.3.3: Do 5.1.3.1 and 5.1.3.2 in order. | 5.3.3.1 Listen and see the mathematical operation to be completed on the computer screen. | ||||
| 5.3.3.2 Do operation mentally. | |||||
| 5.3.4 Answer. Plan 5.1.4: Do 5.1.4.1 & 5.1.4.2 in order. | 5.3.4.1 Position the cursor in the answer box and click. | ||||
| 5.3.4.2 Using the keyboard, write the answer. | |||||
| 5.3.5 Receive Feedback in a visual way | |||||
| If correct | ||||
| If wrong | ||||
References
- Bläsing, D.; Bornewasser, M. Influence of Increasing Task Complexity and Use of Informational Assistance Systems on Mental Workload. Brain Sci. 2021, 11, 102. [Google Scholar] [CrossRef] [PubMed]
- Van Acker, B.; Parmentier, D.; Conradie, P.; Van Hove, S.; Biondi, A.; Bombeke, K.; Vlerick, P.; Saldien, J. Development and validation of a behavioral video coding scheme for detecting mental workload in manual assembly. Ergonomics 2021, 64, 78–102. [Google Scholar] [CrossRef] [PubMed]
- Argyle, E.; Marinescu, A.; Wilson, M.; Lawson, G.; Sharples, S. Physiological indicators of task demand, fatigue, and cognition in future digital manufacturing environments. IJHCS 2021, 145, 102522. [Google Scholar] [CrossRef]
- Rössler, W. Stress, burnout, & job dissatisfaction in mental health workers. Eur. Arch. Psychiatry Clin. Neurosci. 2012, 262, 65–69. [Google Scholar]
- Dehais, F.; Lafont, A.; Roy, R.; Fairclough, S. A Neuroergonomics Approach to Mental Workload, Engagement, and Human Performance. Front. Neurosci. 2020, 14, 268. [Google Scholar] [CrossRef]
- Young, M.S.; Brookhuis, K.A.; Wickens, C.D.; Hancock, P.A. State of science: Mental workload in ergonomics. Ergonomics 2015, 58, 1–17. [Google Scholar] [CrossRef]
- Galy, E.; Paxion, J.; Berthelon, C. Measuring mental workload with the NASA-TLX needs to examine each dimension rather than relying on the global score: An example with driving. Ergonomics 2018, 61, 517–527. [Google Scholar] [CrossRef]
- Albuquerque, I.; Tiwari, A.; Gagnon, J.; Lafond, D.; Parent, M.; Tremblay, S.; Falk, T. On the Analysis of EEG Features for Mental Workload Assessment During Physical Activity. In Proceedings of the IEEE International Conference on Systems, Man, and Cybernetics, Miyazaki, Japan, 7–10 October 2018; pp. 538–542. [Google Scholar] [CrossRef]
- Van Acker, B.; Parmentier, D.; Verick, P.; Saldlen, J. Understanding mental workload: From a clarifying concept analysis toward an implementable framework. Cogn. Technol. Work 2018, 20, 351–365. [Google Scholar] [CrossRef]
- Rakhra, A.; Green, M.; Mann, D. The Influence of a User-Centered Design Focus on the Effectiveness of a User Interface for an Agricultural Machine. Agric. Sci. 2020, 11, 947–965. [Google Scholar] [CrossRef]
- Dai, X.; Ming, J.; Mao, T.; Yang, M.; Yang, J.; Zhang, Y.; Lu, H. A Hierarchical Task Analysis Approach for static Human Factors Engineering Verification and Validation of Human-System Interface. In Nuclear Power Plants: Innovative Technologies for Instrumentation and Control Systems; (SICPNP. Lecture Notes in Electrical Engineering); Springer: Singapore, 2019; Volume 595. [Google Scholar] [CrossRef]
- Hong, J.; Tai, K.; Hwang, M.; Kuo, Y.; Chen, J. Internet cognitive failure relevant to users’ satisfaction with content and interface design to reflect continuance intention to use a government e-learning system. Comput. Hum. Behav. 2017, 66, 353–362. [Google Scholar] [CrossRef]
- Hix, D.; Hartson, R. Developing User Interfaces: Ensuring Usability Through Product & Process; John Wiley & Sons: New York, NY, USA, 1993; p. 210. [Google Scholar]
- Kirchner, W.K. Age differences in short-term retention of rapidly changing information. J. Exp. Psychol. 1958, 55, 352–358. [Google Scholar] [CrossRef]
- Jaeggi, S.; Seewer, R.; Nirkko, A.; Eckstein, D.; Shroth, G.; Groner, R.; Gutbrod, K. Does excessive memory load attenuate activation in the prefrontal cortex? Load-dependent processing in single and dual tasks: A functional magnetic resonance imaging study. NeuroImage 2003, 19, 210–225. [Google Scholar] [CrossRef]
- Mun, S.; Whang, M.; Park, S.; Park, M. Effects of mental workload on involuntary attention: A somatosensory ERP study. Neuropsychologia 2017, 106, 7–20. [Google Scholar] [CrossRef]
- Cinaz, B.; Arnrich, B.; La Marca, R.; Tröster, G. Monitoring of mental workload levels during an everyday life office-work scenario. Pers. Ubiquit. Comput. 2013, 17, 229–239. [Google Scholar] [CrossRef]
- Hogervorst, M.; Brouwer, A.; Van Erp, J. Combining and comparing EEG, peripheral physiology, and eye-related measures for the assessment of mental workload. Front. Neurosci. 2014, 8, 322. [Google Scholar] [CrossRef]
- Aghajani, H.; Garbey, M.; Omurtag, A. Measuring Mental Workload with EEG + fNIRS. Front. Hum. Neurosci. 2017, 11, 359. [Google Scholar] [CrossRef]
- McKendrick, R.; Mehta, R.; Ayaz, H.; Scheldrup, M.; Parasuraman, R. Prefrontal Hemodynamics of Physical Activity and Environmental Complexity during cognitive work. Hum. Factors 2017, 59, 147–162. [Google Scholar] [CrossRef]
- Helton, W.; Russell, P. Rest is still best: The role of the qualitative and Quantitative load of interruptions on vigilance. Hum. Factors 2017, 59, 91–100. [Google Scholar] [CrossRef]
- Flach, J.; Stappers, P.; Voothorst, F. Beyond Affordances: Closing the Generalization Gap Between Design and Cognitive Science. Des. Issues 2017, 33, 76–89. [Google Scholar] [CrossRef]
- Read, G.; Salmon, P.; Lenné, M.; Stanton, N. Designing sociotechnical systems with cognitive work analysis: Putting theory back into practice. Ergonomics 2015, 58, 822–851. [Google Scholar] [CrossRef]
- Naikar, N.; Elix, B. Integrated System Design: Promoting the Capacity of Sociotechnical Systems for Adaptation through Extensions of Cognitive Work Analysis. Front. Psychol. 2016, 7, 962. [Google Scholar] [CrossRef] [PubMed]
- Annett, J.; Duncan, K.D. Task Analysis and Training Design. In Proceedings of the Aston Working Conference on Learning Resources in Industrial and Commercial Education, Birmingham, UK, 5 July 1967. [Google Scholar]
- Annett, J. Hierarchical task analysis. In Handbook of Cognitive Task Design; Hollnagel, E., Ed.; CRC Press: Erlbaum Mahwah, NJ, USA, 2003; pp. 17–35. [Google Scholar]
- Karami, E.; Goodarzi, Z.; Rashidi, R.; Karimi, A. Assessing human errors in sensitive jobs using two methods, TAFEI and SHERPA: A case study in a high-pressure power post. J. Health Field 2020, 8, 58–69. [Google Scholar]
- Mohammadian, M.; Choobineh, A.; Mostafavi, N.; Hashemi, N. Human errors identification in the operation of meat grinder using TAFEI technique. J. Occup. Health 2012, 1, 171–181. [Google Scholar] [CrossRef]
- Stanton, N.A. Hierarchical task analysis: Developments, applications, and extensions. Appl. Ergon. 2006, 37, 55–79. [Google Scholar] [CrossRef] [PubMed]
- Felipe, S.; Adams, A.; Rogers, W.; Fisk, A. Training Novices on hierarchical Task Analysis. In Proceedings of the Human Factors and Ergonomics Society 54th annual meeting 2005–2009, San Francisco, CA, USA, 27 September–1 October 2010. [Google Scholar]
- Fargnoli, M.; Lombardi, M.; Puri, D. Applying Hierarchical Task Analysis to Depict Human Safety Errors during Pesticide Use in Vineyard Cultivation. Agriculture 2019, 9, 158. [Google Scholar] [CrossRef]
- Barajas-Bustillos, M.A.; Maldonado, A.A.; Ortiz, M.; Armenta, O.; García-Alcaraz, J.L. Analysis of Human Error in the task of changing a PC Power supply. In Ergonomía Ocupacional. Investigaciones y Soluciones; Sociedad de Ergonomistas de México, A.C.: Ciudad Juárez, Mexico, 2018; Volume 11, pp. 243–252. [Google Scholar]
- Bustamante, N.G.; Maldonado, A.A.; Durán, A.; Ortiz, N.J.; Quiñones, A. Usability Test and Cognitive Analyses During the Task of Using Wireless Earphones. In Handbook of Research on Ergonomics and Product Design; Hernández Arellano, J.L., Maldonado Macías, A.A., Castillo Martínez, J.A., Peinado Coronado, P., Eds.; IGI Global: Hershey, PA, USA, 2018; pp. 241–263. [Google Scholar] [CrossRef]
- Zeilstra, M.; van Wincoop, A.; Rypkerma, J. The WASCAL-Tool: Prediction of Staffing for Train Dispatching as Part of the Design Process of Track Yards. In Human Mental Workload: Models and Applications; Longo, L., Leva, M.C., Eds.; Springer International Publishing: Berlin/Heidelberg, Germany, 2017; pp. 143–160. [Google Scholar] [CrossRef]
- Salmon, P.; Jenkins, D.; Stanton, N.A.; Walker, G. Hierarchical task analysis vs. cognitive work analysis: Comparison of theory, methodology, and contribution to system design. Theor. Issues Ergon. Sci. 2010, 11, 504–531. [Google Scholar] [CrossRef]
- Baber, C.; Stanton, N.A. Task analysis for error identification: A methodology for designing error-tolerant consumer products. Ergonomics 1994, 37, 1923–1941. [Google Scholar] [CrossRef]
- Salmon, P.; Stanton, N.A.; Walker, G. Human Factors Design Methods Review; Human Factors Integration Defense Technology Centre: London, UK, 2003. [Google Scholar]
- Baber, C.; Stanton, N.A. Task analysis for error identification: Theory, method, and validation. Theor. Issues Ergon. Sci. 2002, 3, 212–227. [Google Scholar] [CrossRef]
- Barajas-Bustillos, M.A.; Maldonado, A.A.; Ortiz, M.; Hernández-Arellano, J.L.; García-Alcaraz, J.L. SHERPA and TAFEI, Comparison of two human error identification techniques: A case study. In Ergonomía Ocupacional. Investigaciones y Soluciones; Sociedad de Ergonomistas de México, A.C.: Ciudad Juárez, México, 2019; Volume 12, pp. 51–61. [Google Scholar]
- Kearney, P.; Li, W.; Zhang, J.; Braithwaite, G.; Lei, W. Human performance assessment of a single air traffic controller conducting multiple remote tower operations. Hum. Factors Manuf. 2020, 30, 114–123. [Google Scholar] [CrossRef]
- Yan, S.; Tran, C.C.; Wei, Y.; Habiyaremye, J.L. Driver’s mental workload prediction model based on physiological indices. JOSE 2017, 25, 476–484. [Google Scholar] [CrossRef]
- Guckenberger, M.; Sudol, A.; Mavris, D. Virtual workload Measurement for assessing systems Utilizing Automation Technology. In Proceedings of the AIAA Scitech 2021 Forum, Virtual Event, 11–22 January 2021. [Google Scholar] [CrossRef]
- Bommer, S.; Fendley, M. A theoretical framework for evaluating mental workload resources in human systems design for manufacturing operations. IJIE 2018, 63, 7–17. [Google Scholar] [CrossRef]
- Imtiaz, M.; Munsi, A.; Nayan, D.; Dei, S. Systematic Human Error Reductions and Prediction Approach while Drilling. IJSER 2014, 5, 808–813. [Google Scholar]
- Jiménez, R.; Cárdenas, D.; González-Anera, R.; Jiménez, J.R.; Vera, J. Measuring mental workload: Ocular astigmatism aberration as a novel objective index. Ergonomics 2018, 61, 506–516. [Google Scholar] [CrossRef]
- Fairclough, S.; Ewing, K. The effect of task demand and incentive on neurophysiological and cardiovascular markers of effort. Int. J. Psychophysiol. 2017, 119, 58–66. [Google Scholar] [CrossRef]
- Heine, T.; Lenis, G.; Reichensperger, P.; Beran, T.; Doessel, O.; Deml, B. Electrocardiographic features for the measurement of driver mental workload. Appl. Ergon. 2017, 61, 31–43. [Google Scholar] [CrossRef]
- Vera, J.; Jiménez, R.; García, J.A.; Cárdenas, D. Intraocular pressure is sensitive to cumulative and instantaneous mental workload. Appl. Ergon. 2017, 60, 313–319. [Google Scholar] [CrossRef]
- Kato, K.; Kim, R.; Mcvey, R.; Stukenborg, B.; Sharpe, M.; Guilbert, M.; Gore, B. NASA TLX EULA iOS (Version 1.0.3) [Mobile app]. NASA Ames Research Center 2016. Apple App Store. Available online: https://itunes.apple.com/us/app/nasa-tlx/id1168110608 (accessed on 19 January 2021).
- Chand, K.; Khosla, A. BioNES: A plug-and-play MATLAB-based tool to use NES games for multimodal biofeedback. SoftwareX 2022, 19, 101184. [Google Scholar] [CrossRef]
- Ninni, D.; Mendez, M.A. MODULO: A software for Multiscale Proper Orthogonal Decomposition of Data. SoftwareX 2020, 12, 100622. [Google Scholar] [CrossRef]
- Stanton, N.A.; Salmon, P.M.; Rafferty, L.A.; Walker, G.H.; Baber, C.; Jenkins, D.P. Human Factors Methods: A Practical Guide for Engineering and Design; Ashgate Publishing: Farnham, UK, 2013; p. 656. [Google Scholar]
- Prabaswary, A.; Basumerda, C.; Utomo, B. The Mental Workload Analysis of Staff in Study Program of Private Educational Organization. IOP Conf. Ser. Mater. Sci. Eng. 2019, 528, 012018. [Google Scholar] [CrossRef]
- NASA Ames Research Center. NASA Task Load Index (TLX) Manual; Computerized Version (Version 1.0); Human Performance Research Group: Mountain View, CA, USA, 1986. Available online: https://ntrs.nasa.gov/api/citations/20000021487/downloads/20000021487.pdf (accessed on 19 January 2021).
- Knierim, M.T.; Berger, C.; Reali, P. Open-source concealed EEG data collection for Brain-computer-interfaces-neural observation through OpenBCI amplifiers with around-the-ear cEEGrid electrodes. Brain-Comput. Interfaces 2021, 8, 161–179. [Google Scholar] [CrossRef]


| 03/03/21 | 03/04/21 | 03/05/21 | 03/08/21 | 03/09/21 | 03/10/21 | 03/11/21 | 03/12/21 | 03/15/21 | 03/16/21 | |
|---|---|---|---|---|---|---|---|---|---|---|
| 17:00 | S6-T1 | S3-T1 | S4-T3 | S2-T1 | S10-T1 | S3-T2 | S8-T2 | S3-T3 | S2-T3 | S5-T3 |
| 18:00 | S10-T2 | S7-T3 | S1-T1 | S7-T2 | S7-T3 | S3-T1 | S2-T1 | S8-T1 | S1-T2 | S2-T2 |
| 19:00 | S7-T1 | S5-T2 | S7-T1 | S4-T2 | S7-T2 | S9-T1 | S5-T1 | S6-T1 | S6-T3 | S4-T2 |
| 03/17/21 | 03/18/21 | 03/19/21 | 03/22/21 | 03/23/21 | 03/24/21 | 03/25/21 | 03/26/21 | 04/12/21 | 04/13/21 | |
| 17:00 | S8-T3 | S6-T2 | S1-T3 | S8-T2 | S2-T3 | S9-T2 | S2-T2 | S8-T3 | S4-T3 | S1-T3 |
| 18:00 | S3-T2 | S4-T1 | S4-T1 | S9-T3 | S5-T2 | S10-T3 | S9-T3 | S6-T3 | S10-T3 | S5-T3 |
| 19:00 | S6-T2 | S10-T2 | S9-T2 | S1-T2 | S1-T1 | S10-T1 | S5-T1 | S3-T3 | S8-T1 | S9-T1 |
| Subtask | Elementary Task | Specific Activity |
|---|---|---|
| 4. Training Plan 4: do 4.1, 4.2, 4.3, 4.4, and 4.5 in order. | 4.1 Beginning of the training | 4.1.1 Click the start button |
| 4.2 Digit position training Plan 4.2: 4 times ((Do 4.2.1 & 4.2.2 3 then 4.2.3, 4.2.4 & 4.2.5 in order)) | 4.2.1 Listen “Memorize.” | |
| 4.2.2 See 3 3 matrix with a number from 1 to 9. Memorize the digit and position | ||
| 4.2.3 Observe writing “Same Position”. (n)/(n1)? | ||
| 4.2.4 Select “no” or “Yes” as appropriate | ||
| 4.2.5 The subject receives feedback |
| 1 | 2 | 3 | 4 | 5 | 6 | 7 | 8 | 9 | |
|---|---|---|---|---|---|---|---|---|---|
| 1 | ‘ | L | ‘ | ‘ | ‘ | ‘ | ‘ | ‘ | ‘ |
| 2 | ‘ | ‘ | L | I | ‘ | I | I | I | ‘ |
| 3 | ‘ | ‘ | ‘ | L | ‘ | ‘ | I | ‘ | ‘ |
| 4 | ‘ | ‘ | ‘ | ‘ | L | I | I | ‘ | ‘ |
| 5 | ‘ | ‘ | ‘ | ‘ | ‘ | L | I | ‘ | ‘ |
| 6 | ‘ | ‘ | ‘ | ‘ | ‘ | ‘ | L | ‘ | ‘ |
| 7 | ‘ | ‘ | ‘ | ‘ | ‘ | ‘ | ‘ | L | ‘ |
| 8 | ‘ | ‘ | ‘ | ‘ | ‘ | ‘ | ‘ | ‘ | L |
| 9 | ‘ | ‘ | ‘ | ‘ | ‘ | ‘ | ‘ | ‘ | ‘ |
| Low MWL | Medium MWL | High MWL | |
|---|---|---|---|
| Mental demand | 161.5 | 194.75 | 249.25 |
| Physical demand | 19.25 | 32.25 | 24 |
| Temporal demand | 214.5 | 176.25 | 235.75 |
| Performance | 57.25 | 105.25 | 172.5 |
| Effort | 99.75 | 113 | 143 |
| Frustration level | 112.25 | 153 | 169.25 |
| Overall mental workload score (NASA TLX) | 44.29 | 51.63 | 61.78 |
| Performance Average (Correct responses) | 89.22% | 80% | 76.1% |
| Source | DG | SSR | Adj. MS | F Value | p-Value |
|---|---|---|---|---|---|
| MWL Level | 2 | 3083 | 1541.7 | 7.76 | 0.001 |
| Subject | 9 | 10,306 | 1145.1 | 5.76 | 0.000 |
| Error | 48 | 9535 | 198.6 | ||
| Lack of adjustment | 18 | 3285 | 182.5 | 0.88 | 0.608 |
| Pure error | 30 | 6250 | 208.3 | ||
| 59 | 22,925 |
Disclaimer/Publisher’s Note: The statements, opinions and data contained in all publications are solely those of the individual author(s) and contributor(s) and not of MDPI and/or the editor(s). MDPI and/or the editor(s) disclaim responsibility for any injury to people or property resulting from any ideas, methods, instructions or products referred to in the content. |
© 2023 by the authors. Licensee MDPI, Basel, Switzerland. This article is an open access article distributed under the terms and conditions of the Creative Commons Attribution (CC BY) license (https://creativecommons.org/licenses/by/4.0/).
Share and Cite
Arana-De las Casas, N.I.; De la Riva-Rodríguez, J.; Maldonado-Macías, A.A.; Sáenz-Zamarrón, D. Cognitive Analyses for Interface Design Using Dual N-Back Tasks for Mental Workload (MWL) Evaluation. Int. J. Environ. Res. Public Health 2023, 20, 1184. https://doi.org/10.3390/ijerph20021184
Arana-De las Casas NI, De la Riva-Rodríguez J, Maldonado-Macías AA, Sáenz-Zamarrón D. Cognitive Analyses for Interface Design Using Dual N-Back Tasks for Mental Workload (MWL) Evaluation. International Journal of Environmental Research and Public Health. 2023; 20(2):1184. https://doi.org/10.3390/ijerph20021184
Chicago/Turabian StyleArana-De las Casas, Nancy Ivette, Jorge De la Riva-Rodríguez, Aide Aracely Maldonado-Macías, and David Sáenz-Zamarrón. 2023. "Cognitive Analyses for Interface Design Using Dual N-Back Tasks for Mental Workload (MWL) Evaluation" International Journal of Environmental Research and Public Health 20, no. 2: 1184. https://doi.org/10.3390/ijerph20021184
APA StyleArana-De las Casas, N. I., De la Riva-Rodríguez, J., Maldonado-Macías, A. A., & Sáenz-Zamarrón, D. (2023). Cognitive Analyses for Interface Design Using Dual N-Back Tasks for Mental Workload (MWL) Evaluation. International Journal of Environmental Research and Public Health, 20(2), 1184. https://doi.org/10.3390/ijerph20021184