
Spillover Effects among Electricity Prices, Traditional Energy Prices and Carbon Market under Climate Risk


Abstract
1. Introduction
2. Literature Review
3. Methodology and Datasets
3.1. Methodology
3.2. Data Description
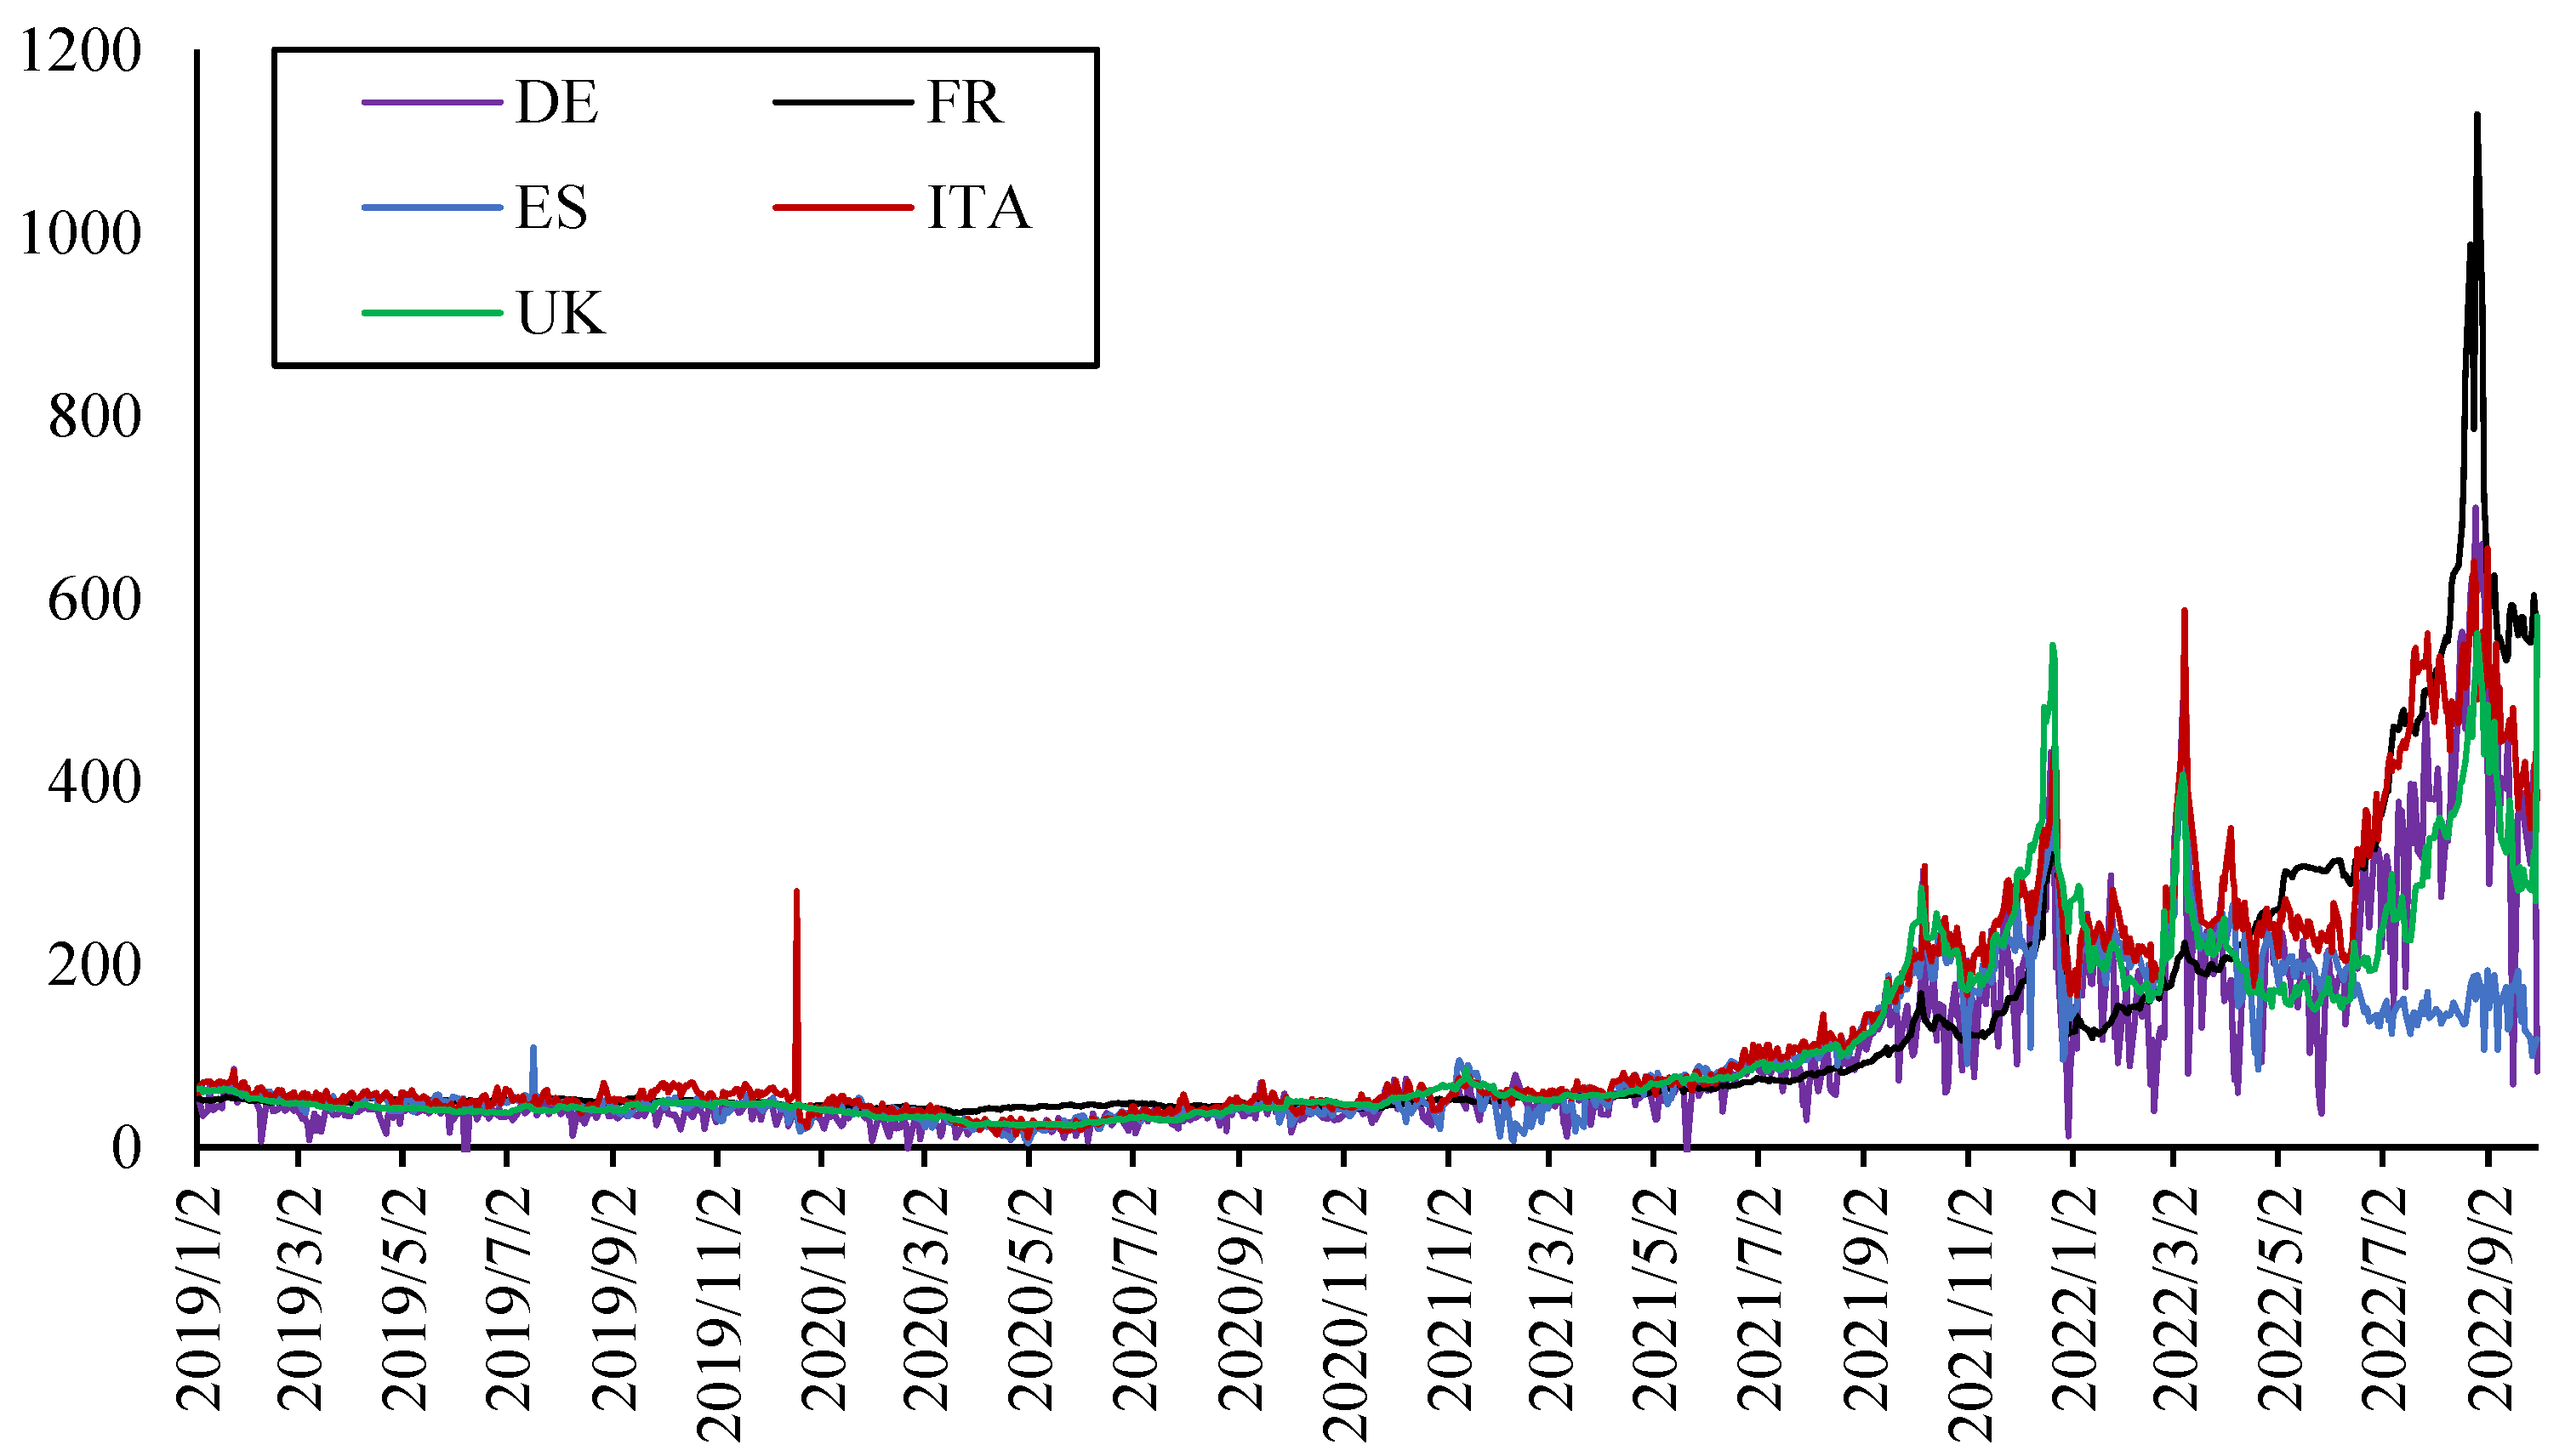
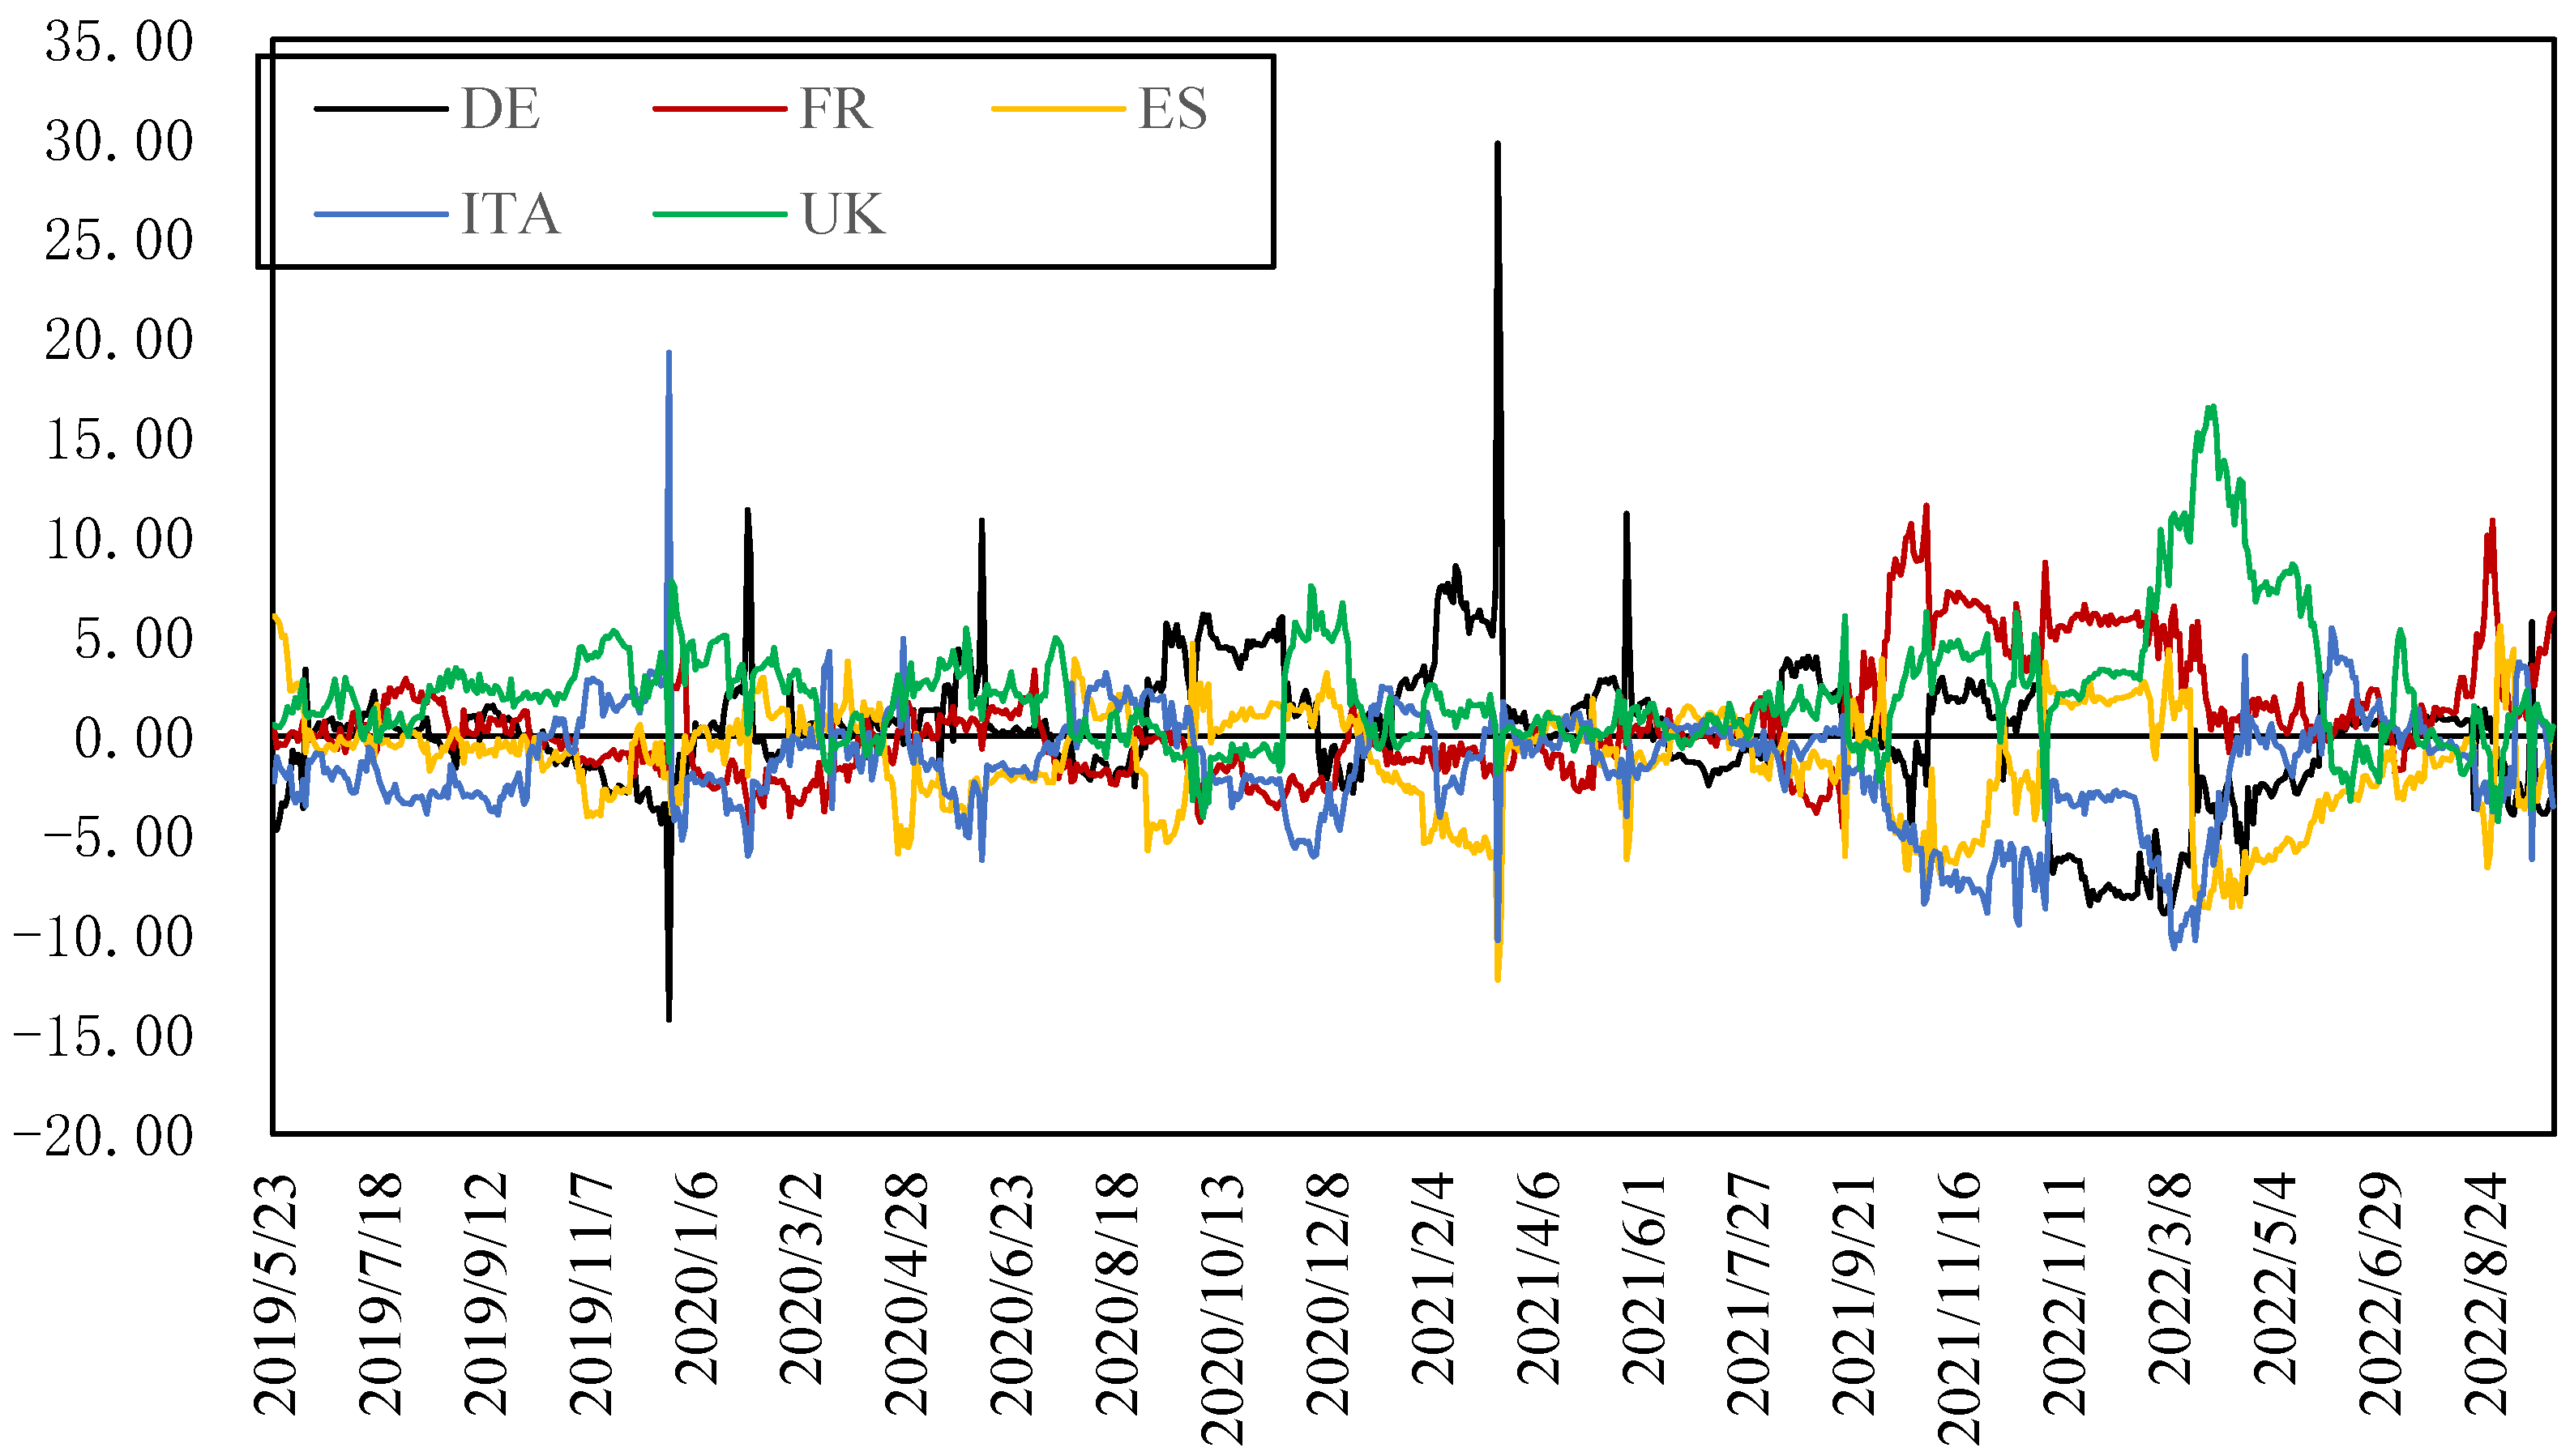
3.2.1. Electricity Prices
3.2.2. Indicators of Other Markets
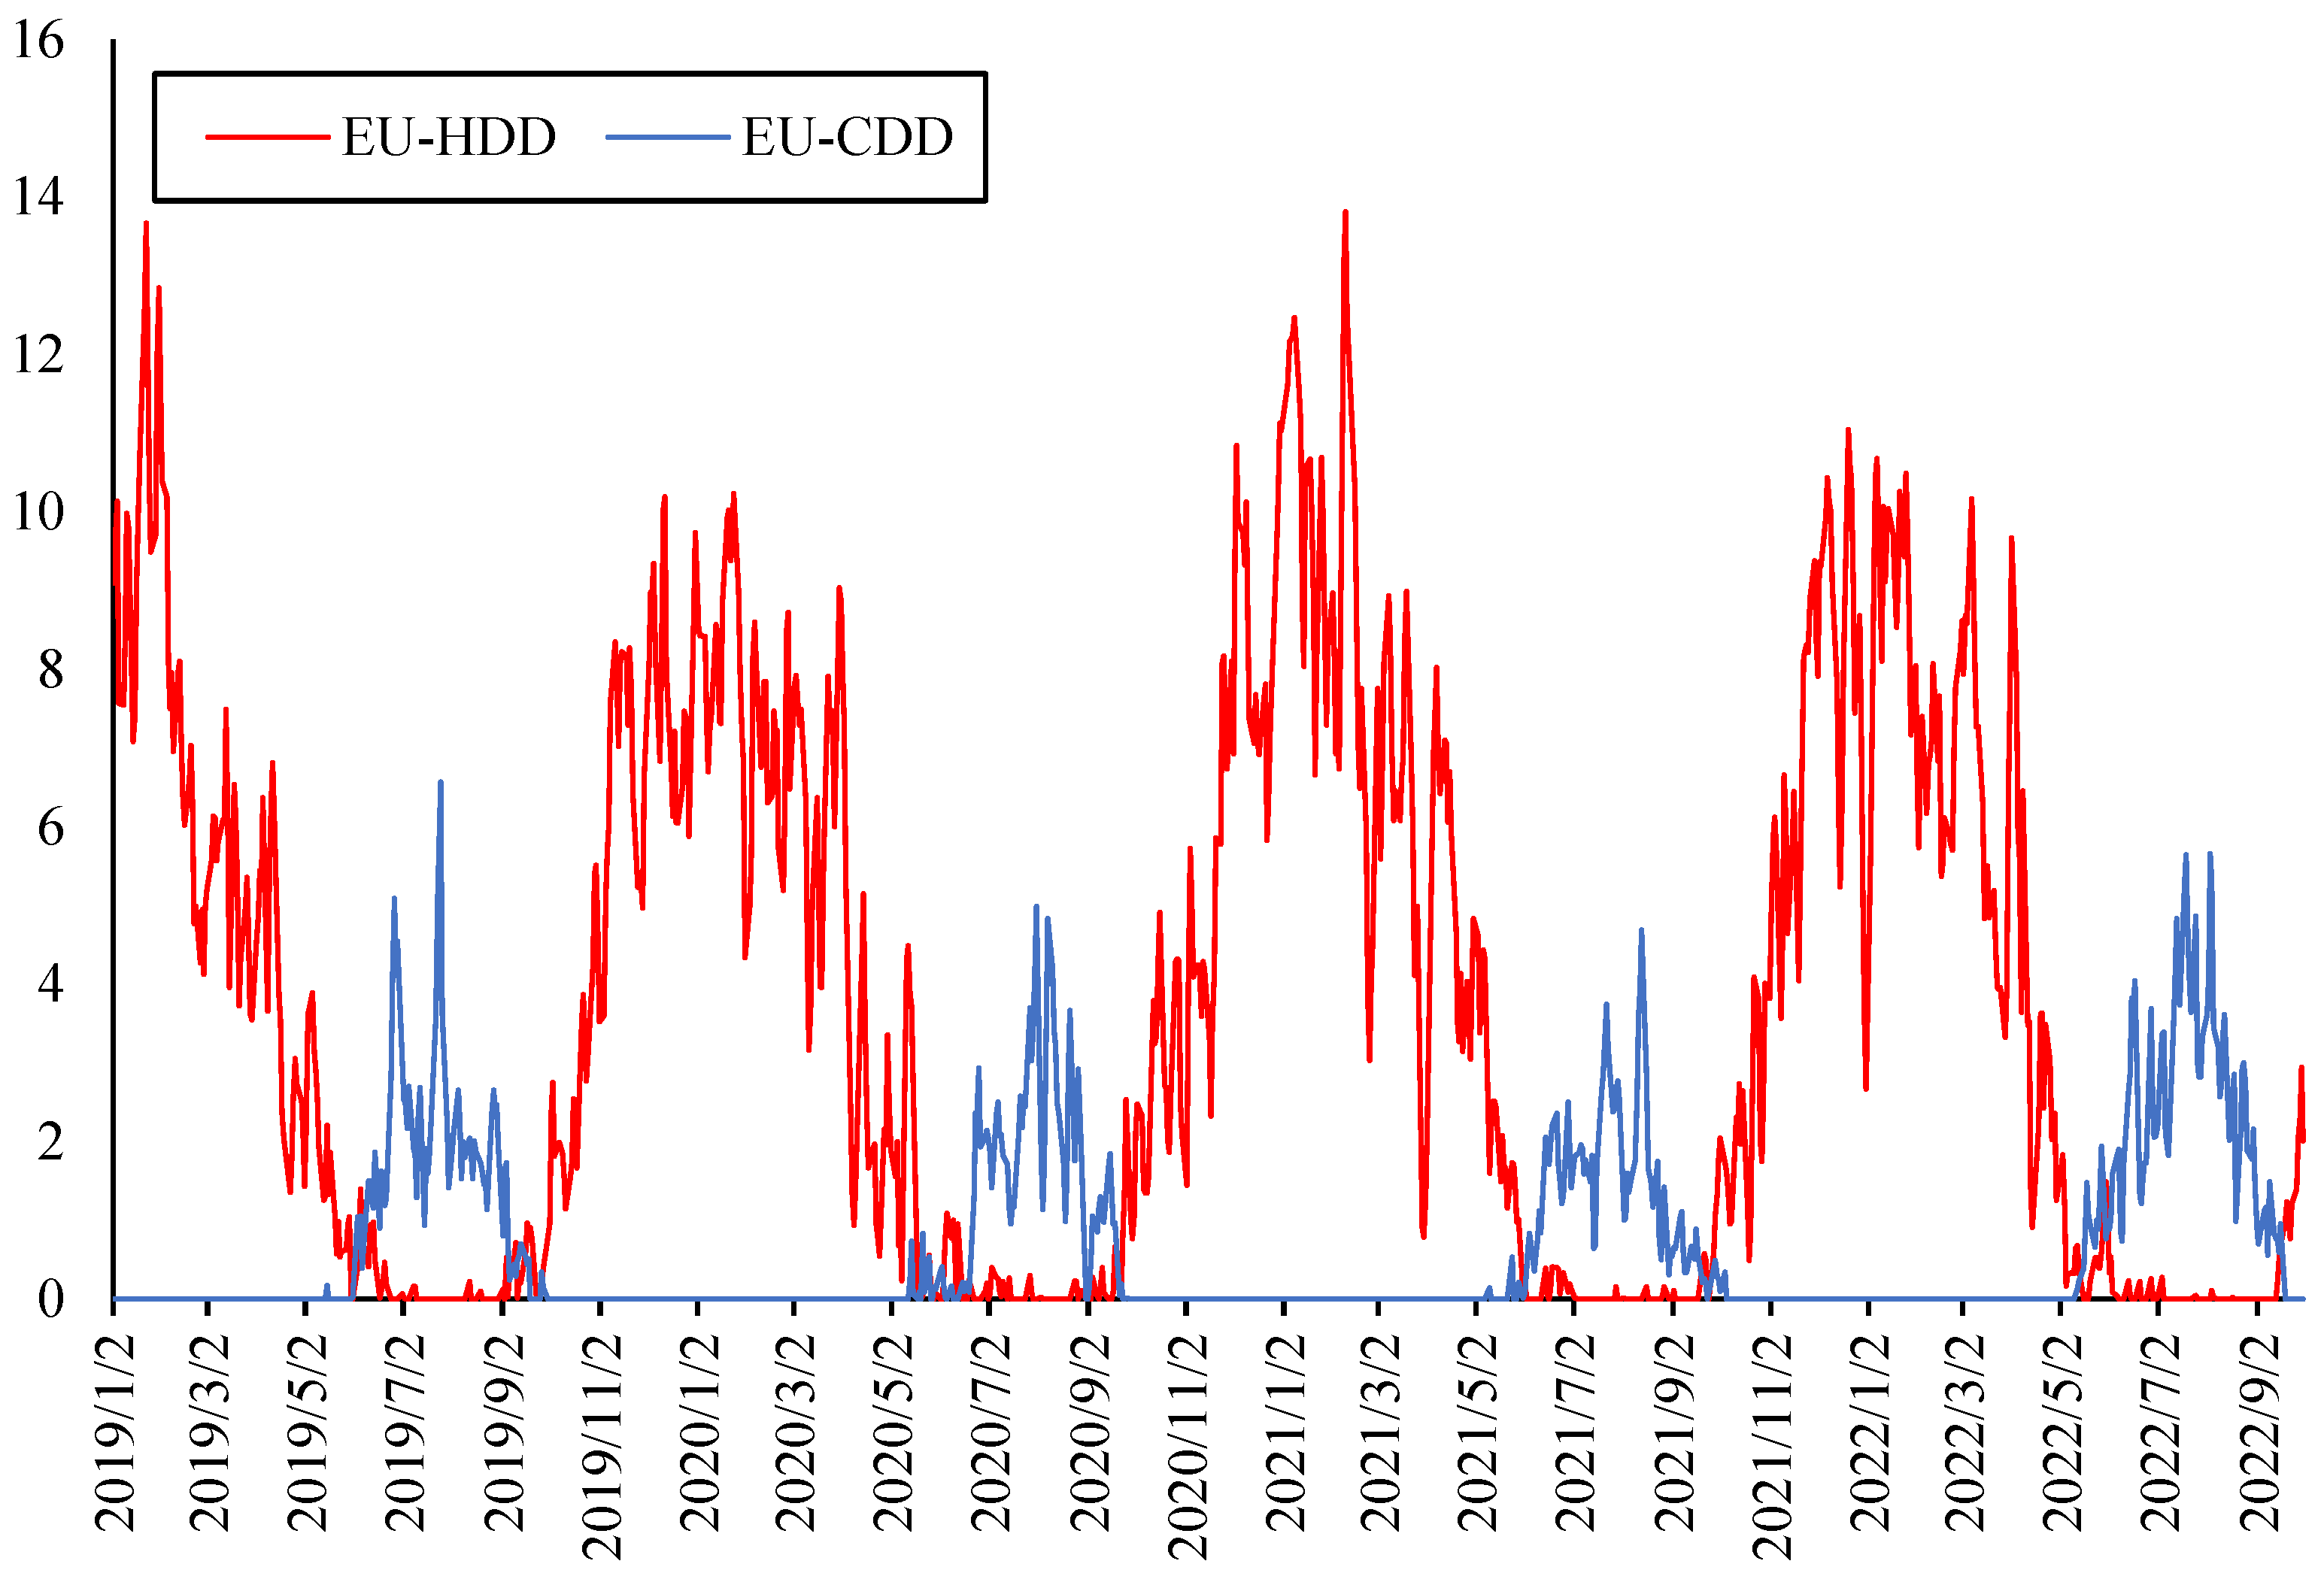
3.2.3. Indicators of Climate Risk
4. Connectedness among Electricity Prices in the European Countries
4.1. Static Analysis of the Full Sample
4.2. Dynamic Analysis of Connectedness among Electricity Prices
5. Spillover Effects among Markets under Climate Change
5.1. Static Analysis of the Full Sample
5.2. Dynamic Analysis of Spillover Effects among Markets under Climate Change
6. Conclusions
Author Contributions
Funding
Institutional Review Board Statement
Informed Consent Statement
Data Availability Statement
Conflicts of Interest
References
- European Commission. A European Green Deal: Striving to Be the First Climate-Neutral Continent. Available online: https://ec.europa.eu/info/strategy/priorities-2019-2024/european-green-deal_en (accessed on 29 December 2022).
- Maris, G.; Flouros, F. The Green Deal, National Energy and Climate Plans in Europe: Member States’ Compliance and Strategies. Adm. Sci. 2021, 11, 75. [Google Scholar] [CrossRef]
- Pietzcker, R.; Osorio, S.; Rodrigues, R. Tightening EU ETS targets in line with the European Green Deal: Impacts on the decarbonization of the EU power sector. Appl. Energy 2021, 293, 116914. [Google Scholar] [CrossRef]
- Cevik, S.; Ninomiy, K. Chasing the Sun and Catching the Wind: Energy Transition and Electricity Prices in Europe. IMF Work. Pap. 2022, WP/22/220. Available online: https://ideas.repec.org/p/imf/imfwpa/2022-220.html (accessed on 29 December 2022). [CrossRef]
- International Energy Agency (IEA). Electricity Market Report. Available online: https://www.iea.org/reports/electricity-market-report-july-2022 (accessed on 29 December 2022).
- Emery, G.W.; Liu, Q. An analysis of the relationship between electricity and natural-gas futures prices. J. Fut. Mark 2002, 22, 95–122. [Google Scholar] [CrossRef]
- Gil-Alana, L.; Mudida, R.; Carcel, H. Shocks affecting electricity prices in Kenya, a fractional integration study. Energy 2017, 124, 521–530. [Google Scholar] [CrossRef]
- Mosquera-López, S.; Nursimulu, A. Drivers of electricity price dynamics: Comparative analysis of spot and futures markets. Energy Policy 2019, 126, 76–87. [Google Scholar] [CrossRef]
- Ohler, A.; Mohammadi, H.; Loomis, D. Electricity restructuring and the relationship between fuel costs and electricity prices for industrial and residential customers. Energy Policy 2020, 142, 111559. [Google Scholar] [CrossRef]
- Trujillo-Baute, E.; Río, P.; Mir-Artigues, P. Analysing the impact of renewable energy regulation on retail electricity prices. Energy Policy 2018, 114, 153–164. [Google Scholar] [CrossRef]
- Rowińska, P.; Veraart, A.; Gruet, P. A multi-factor approach to modelling the impact of wind energy on electricity spot prices. Energy Econ. 2021, 104, 105640. [Google Scholar] [CrossRef]
- Biber, A.; Felder, M.; Wieland, C.; Spliethoff, H. Negative price spiral caused by renewables? Electricity price prediction on the German market for 2030. Electr. J. 2022, 35, 107188. [Google Scholar] [CrossRef]
- Nagel, N.; Böhringer, C.; Rosendahl, K.; Bolkesjø, T. Impacts of green deal policies on the Nordic power market. Util. Policy 2023, 80, 101475. [Google Scholar] [CrossRef]
- Mandal, P.; Srivastava, A.K.; Negnevitsky, M.; Park, J.W. Sensitivity analysis of neural network parameters to improve the performance of electricity price forecasting. Int. J. Energy Res. 2009, 33, 38–51. [Google Scholar] [CrossRef]
- Weron, R. Electricity price forecasting: A review of the state-of-the-art with a look into the future. Int. J. Forecast. 2014, 30, 1030–1081. [Google Scholar] [CrossRef]
- Borovkova, S.; Schmeck, M. Electricity price modeling with stochastic time change. Energy Econ. 2017, 63, 51–65. [Google Scholar] [CrossRef]
- Müller, G.; Seibert, A. Bayesian estimation of stable CARMA spot models for electricity prices. Energy Econ. 2019, 78, 267–277. [Google Scholar] [CrossRef]
- Deschatre, T.; Féron, O.; Gruet, P. A survey of electricity spot and futures price models for risk management applications. Energy Econ. 2021, 102, 105504. [Google Scholar] [CrossRef]
- Iwabuchi, K.; Kato, K.; Watari, D.; Taniguchi, I.; Catthoor, F.; Shirazi, E.; Onoye, T. Flexible electricity price forecasting by switching mother wavelets based on wavelet transform and Long Short-Term Memory. Energy AI 2022, 10, 100192. [Google Scholar] [CrossRef]
- Heidarpanah, M.; Hooshyaripor, F.; Fazeli, M. Daily electricity price forecasting using artificial intelligence models in the Iranian electricity market. Energy 2023, 263 Pt E, 126011. [Google Scholar] [CrossRef]
- Longstaff, F.A.; Wang, A.W. Electricity Forward Prices: A High-Frequency Empirical Analysis. J. Financ. 2004, 59, 1877–1900. [Google Scholar] [CrossRef]
- Joutz, F.L.; Maddala, G.S.; Trost, R.P. An integrated bayesian vector auto regression and error correction model for forecasting electricity consumption and prices. J. Forecast. 1995, 14, 287–310. [Google Scholar] [CrossRef]
- Ziel, F.; Steinert, R. Probabilistic mid- and long-term electricity price forecasting. Renew. Sustain. Energy Rev. 2018, 94, 251–266. [Google Scholar] [CrossRef]
- Menezes, L.; Houllier, M.; Tamvakis, M. Time-varying convergence in European electricity spot markets and their association with carbon and fuel prices. Energy Policy 2016, 88, 613–627. [Google Scholar] [CrossRef]
- Keles, D.; Dehler-Holland, J.; Densing, M.; Panos, E.; Hack, F. Cross-border effects in interconnected electricity markets—An analysis of the Swiss electricity prices. Energy Econ. 2020, 90, 104802. [Google Scholar] [CrossRef]
- Nakajima, T.; Hamori, S. Causality-in-mean and causality-in-variance among electricity prices, crude oil prices, and yen–US dollar exchange rates in Japan. Res. Int. Bus. Financ. 2012, 26, 371–386. [Google Scholar] [CrossRef]
- Kristjanpoller, W.; Minutolo, M. Asymmetric multi-fractal cross-correlations of the price of electricity in the US with crude oil and the natural gas. Phys. A Stat. Mech. Its Appl. 2021, 572, 125830. [Google Scholar] [CrossRef]
- Dong, S.; Li, H.; Wallin, F.; Avelin, A.; Zhang, Q.; Yu, Z. Volatility of electricity price in Denmark and Sweden. Energy Procedia 2019, 158, 4331–4337. [Google Scholar] [CrossRef]
- Tselika, K. The impact of variable renewables on the distribution of hourly electricity prices and their variability: A panel approach. Energy Econ. 2022, 113, 106194. [Google Scholar] [CrossRef]
- Schöniger, F.; Morawetz, U. What comes down must go up: Why fluctuating renewable energy does not necessarily increase electricity spot price variance in Europe. Energy Econ. 2022, 111, 106069. [Google Scholar] [CrossRef]
- Freitas, C.; Silva, P. European Union emissions trading scheme impact on the Spanish electricity price during phase II and phase III implementation. Util. Policy 2022, 33, 54–62. [Google Scholar] [CrossRef]
- Woo, C.; Olson, A.; Chen, Y.; Moore, J.; Schlag, N.; Ong, A.; Ho, T. Does California’s CO2 price affect wholesale electricity prices in the Western U.S.A.? Energy Policy 2017, 110, 9–19. [Google Scholar] [CrossRef]
- Peña, J.; Rodríguez, R. Are EU’s Climate and Energy Package 20-20-20 targets achievable and compatible? Evidence from the impact of renewables on electricity prices. Energy 2019, 183, 477–486. [Google Scholar] [CrossRef]
- Liu, X.; Jin, Z. An analysis of the interactions between electricity, fossil fuel and carbon market prices in Guangdong, China. Energy Sustain. Dev. 2020, 55, 82–94. [Google Scholar] [CrossRef]
- Santamouris, M.; Papanikolaou, N.; Livada, I.; Koronakis, I.; Georgakis, C.; Argiriou, A.; Assimakopoulos, D.N. On the impact of urban climate on the energy consumption of buildings. Sol. Energy 2001, 70, 201–216. [Google Scholar] [CrossRef]
- Taseska, V.; Markovska, N.; Callaway, J. Evaluation of climate change impacts on energy demand. Energy 2012, 48, 88–95. [Google Scholar] [CrossRef]
- Mosquera-López, S.; Uribe, J.; Manotas-Duque, D. Effect of stopping hydroelectric power generation on the dynamics of electricity prices: An event study approach. Renew. Sustain. Energy Rev. 2018, 94, 456–467. [Google Scholar] [CrossRef]
- Jasiński, T. Use of new variables based on air temperature for forecasting day-ahead spot electricity prices using deep neural networks: A new approach. Energy 2020, 213, 118784. [Google Scholar] [CrossRef]
- Guo, J.; Long, S.; Luo, W. Nonlinear effects of climate policy uncertainty and financial speculation on the global prices of oil and gas. Int. Rev. Financ. Anal. 2022, 83, 102286. [Google Scholar] [CrossRef]
- Ozturk, S.; Demirer, R.; Gupta, R. Climate uncertainty and carbon emissions prices: The relative roles of transition and physical climate risks. Econ. Lett. 2022, 217. [Google Scholar] [CrossRef]
- Lin, J.; Bao, M.; Liang, Z.; Sang, M.; Ding, Y. Spatio-temporal evaluation of electricity price risk considering multiple uncertainties under extreme cold weather. Appl. Energy 2022, 328, 120090. [Google Scholar] [CrossRef]
- Diebold, F.X.; Yilmaz, K. Better to Give than to Receive: Predictive Directional Measurement of Volatility Spillovers. Int. J. Forecast. 2012, 28, 57–66. [Google Scholar] [CrossRef]
- Ji, Q.; Bouri, E.; Lau, C.; Roubaud, D. Dynamic connectedness and integration in cryptocurrency markets. Int. Rev. Financ. Anal. 2019, 63, 257–272. [Google Scholar] [CrossRef]
- Grillini, S.; Ozkan, A.; Sharma, A. Static and dynamic liquidity spillovers in the Eurozone: The role of financial contagion and the Covid-19 pandemic. Int. Rev. Financ. Anal. 2022, 83, 102273. [Google Scholar] [CrossRef]
- Bienvenido-Huertas, D.; Pulido-Arcas, J.; Rubio-Bellido, C.; Pérez-Fargallo, A. Feasibility of adaptive thermal comfort for energy savings in cooling and heating: A study on Europe and the Mediterranean basin. Urban Clim. 2021, 36, 100807. [Google Scholar] [CrossRef]


| FR | ES | DE | ITA | UK | |
|---|---|---|---|---|---|
| Mean | 0.0030 | 0.0191 | 0.0431 | 0.0133 | 0.0039 |
| Median | 0.0013 | 0.0038 | −0.0235 | 0.0000 | 0.0004 |
| Maximum | 0.2614 | 2.6986 | 5.8634 | 3.9831 | 1.1536 |
| Minimum | −0.3588 | −0.8372 | −16.9603 | −0.8164 | −0.3593 |
| Std. Dev. | 0.0341 | 0.2173 | 0.8445 | 0.1890 | 0.0612 |
| Skewness | −0.9445 | 4.7766 | −8.4192 | 10.7970 | 7.0598 |
| Kurtosis | 33.7229 | 52.1793 | 195.5536 | 212.9305 | 134.5466 |
| Jarque–Bera | 38,214.41 | 101,231.50 | 1,506,870.00 | 1,796,330.00 | 705,989.50 |
| Probability | 0.0000 | 0.0000 | 0.0000 | 0.0000 | 0.0000 |
| ADF t-Statistic | −15.0695 | −13.2338 | −32.0745 | −14.6691 | −25.4600 |
| Probability | 0.0000 | 0.0000 | 0.0000 | 0.0000 | 0.0000 |
| Observations | 968 | 968 | 968 | 968 | 968 |
| FR | ES | DE | ITA | UK | |
|---|---|---|---|---|---|
| FR | 1.0000 | −0.0145 | 0.0302 | 0.0107 | 0.3412 |
| ES | −0.0145 | 1.0000 | −0.0037 | 0.2282 | 0.0133 |
| DE | 0.0302 | −0.0037 | 1.0000 | 0.0123 | −0.0001 |
| ITA | 0.0107 | 0.2282 | 0.0123 | 1.0000 | 0.0222 |
| UK | 0.3412 | 0.0133 | −0.0001 | 0.0222 | 1.0000 |
| OIL | GAS | CARBON | EMISSION | ELEC | |
|---|---|---|---|---|---|
| Mean | 0.0010 | 0.0000 | 0.0013 | 0.0003 | 0.0165 |
| Median | 0.0031 | 0.0000 | 0.0019 | 0.0005 | 0.0044 |
| Maximum | 0.2102 | 1.9556 | 0.1751 | 0.1204 | 1.1417 |
| Minimum | −0.2440 | −3.2444 | −0.1625 | −0.1612 | −3.3717 |
| Std. Dev. | 0.9297 | 0.4236 | 0.0294 | 0.0243 | 0.1818 |
| Skewness | −0.6947 | −1.2095 | −0.2621 | −0.2434 | −6.6101 |
| Kurtosis | 17.0890 | 15.3959 | 6.9397 | 9.2374 | 146.1563 |
| Jarque–Bera | 8083.97 | 6433.51 | 637.12 | 1578.74 | 833,629.80 |
| Probability | 0.0000 | 0.0000 | 0.0000 | 0.0000 | 0.0000 |
| ADF t-Statistic | −28.8675 | −32.1444 | −33.9706 | −17.0033 | −31.7333 |
| Probability | 0.0000 | 0.0000 | 0.0000 | 0.0000 | 0.0000 |
| Observations | 968 | 968 | 968 | 968 | 968 |
| OIL | GAS | D_HDD | D_CDD | ELEC | CARBON | EMISSION | |
|---|---|---|---|---|---|---|---|
| OIL | 1.0000 | 0.1065 | −0.0234 | 0.0035 | 0.0148 | 0.1950 | 0.0474 |
| GAS | 0.1065 | 1.0000 | −0.0499 | 0.0066 | 0.0684 | 0.0868 | −0.0046 |
| D_HDD | −0.0234 | −0.0499 | 1.0000 | 0.0019 | 0.0299 | −0.0316 | 0.3197 |
| D_CDD | 0.0035 | 0.0066 | 0.0019 | 1.0000 | −0.0184 | −0.0113 | −0.0074 |
| ELEC | 0.0148 | 0.0684 | 0.0299 | −0.0184 | 1.0000 | 0.0260 | 0.1127 |
| CARBON | 0.1950 | 0.0868 | −0.0316 | −0.0113 | 0.0260 | 1.0000 | −0.0737 |
| EMISSION | 0.0474 | −0.0046 | 0.3197 | −0.0074 | 0.1127 | −0.0737 | 1.0000 |
| Item | DE | FR | ES | ITA | UK | FROM |
|---|---|---|---|---|---|---|
| DE | 98.84 | 0.85 | 0.01 | 0.16 | 0.13 | 1.16 |
| FR | 0.17 | 85.03 | 0.74 | 0.42 | 13.63 | 14.97 |
| ES | 0.62 | 0.85 | 92.81 | 4.94 | 0.78 | 7.19 |
| ITA | 0.74 | 0.64 | 4.34 | 92.44 | 1.85 | 7.56 |
| UK | 0.02 | 10.88 | 0.14 | 0.11 | 88.85 | 11.15 |
| Directional TO Others | 1.56 | 13.22 | 5.22 | 5.63 | 16.40 | 42.03 |
| Directional Including Own | 100.40 | 98.26 | 98.03 | 98.07 | 105.24 | TCI |
| NET Directional Connectedness | 0.40 | −1.74 | −1.97 | −1.93 | 5.24 | 8.41 |
| Item | D_HDD | D_CDD | CARBON | OIL | GAS | EMISSION | ELEC | E_TCI | FROM |
|---|---|---|---|---|---|---|---|---|---|
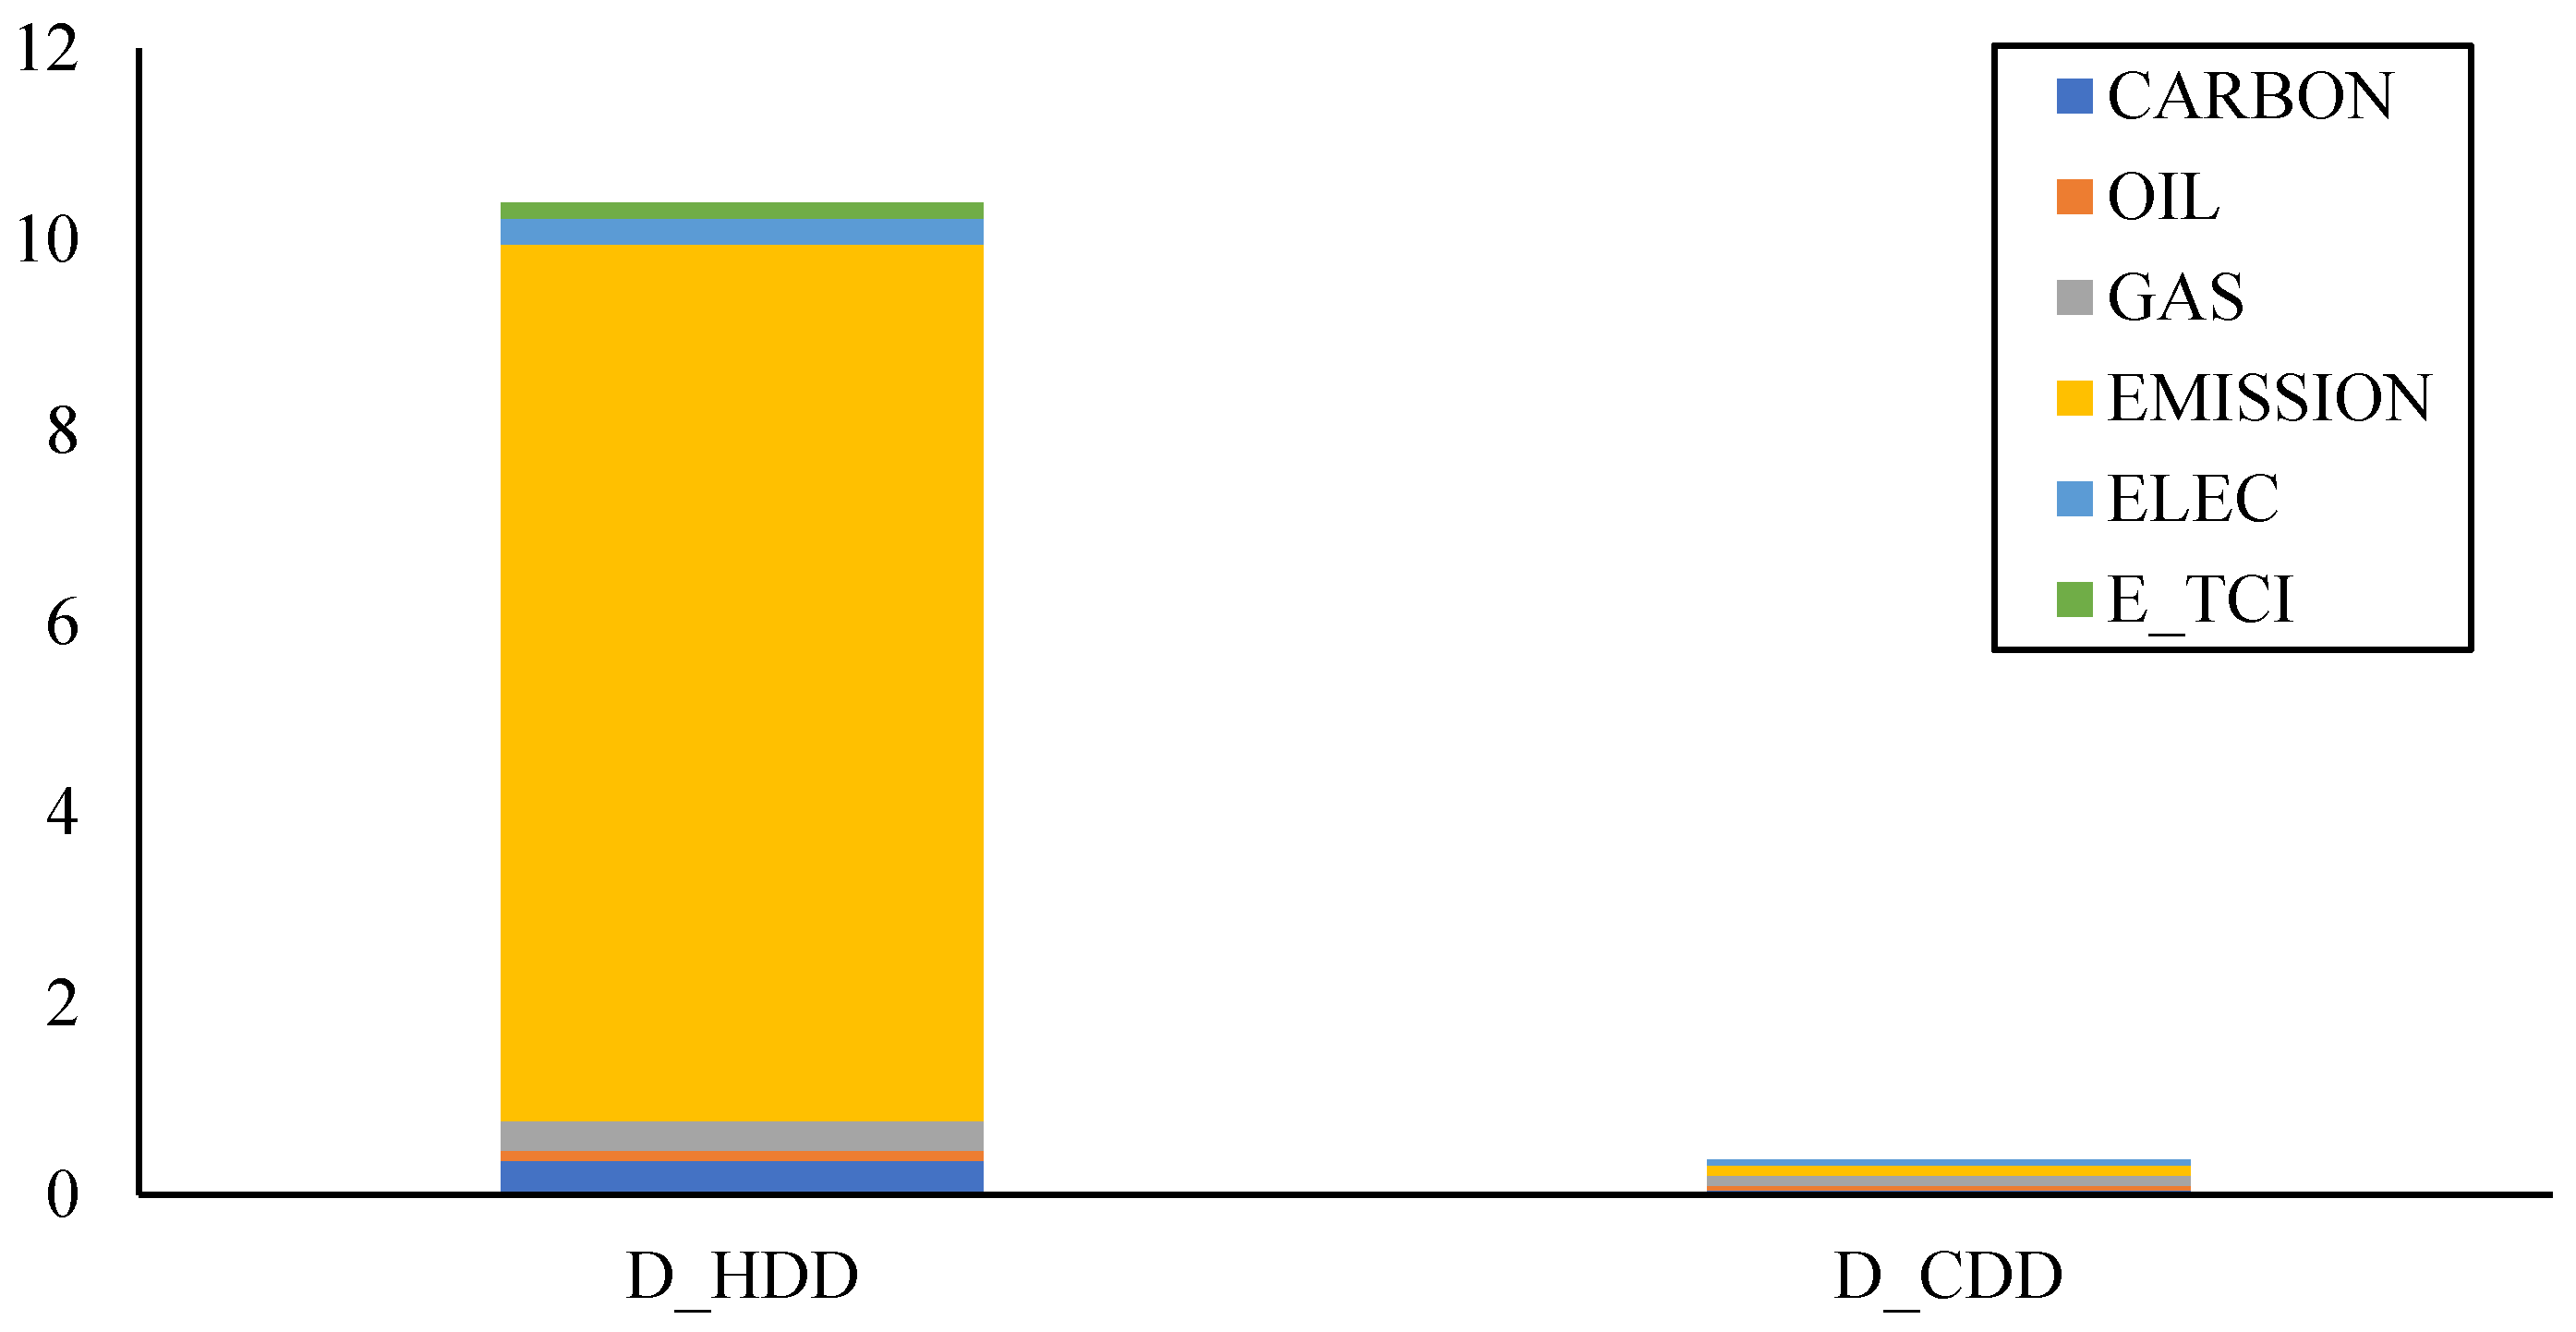
| D_HDD | 88.38 | 0.01 | 0.28 | 0.22 | 0.40 | 10.30 | 0.00 | 0.41 | 11.62 |
| D_CDD | 0.01 | 99.76 | 0.04 | 0.00 | 0.01 | 0.03 | 0.07 | 0.09 | 0.24 |
| CARBON | 0.36 | 0.05 | 93.25 | 4.09 | 0.91 | 0.71 | 0.20 | 0.42 | 6.75 |
| OIL | 0.11 | 0.05 | 4.12 | 93.06 | 1.44 | 0.25 | 0.67 | 0.31 | 6.94 |
| GAS | 0.31 | 0.11 | 1.04 | 1.39 | 95.87 | 0.15 | 0.51 | 0.62 | 4.13 |
| EMISSION | 9.17 | 0.10 | 0.06 | 0.20 | 0.40 | 88.32 | 1.12 | 0.62 | 11.68 |
| ELEC | 0.27 | 0.06 | 0.12 | 0.03 | 0.66 | 1.29 | 97.42 | 0.15 | 2.58 |
| E_TCI | 0.16 | 0.00 | 0.02 | 0.29 | 0.09 | 0.70 | 0.85 | 97.88 | 2.12 |
| Directional TO Others | 10.39 | 0.39 | 5.67 | 6.22 | 3.90 | 13.43 | 3.43 | 2.63 | 46.06 |
| Directional Including Own | 98.77 | 100.14 | 98.92 | 99.27 | 99.77 | 101.75 | 100.85 | 100.51 | TCI |
| NET Directional Connectedness | −1.23 | 0.14 | −1.08 | −0.73 | −0.23 | 1.75 | 0.85 | 0.51 | 5.76 |
Disclaimer/Publisher’s Note: The statements, opinions and data contained in all publications are solely those of the individual author(s) and contributor(s) and not of MDPI and/or the editor(s). MDPI and/or the editor(s) disclaim responsibility for any injury to people or property resulting from any ideas, methods, instructions or products referred to in the content. |
© 2023 by the authors. Licensee MDPI, Basel, Switzerland. This article is an open access article distributed under the terms and conditions of the Creative Commons Attribution (CC BY) license (https://creativecommons.org/licenses/by/4.0/).
Share and Cite
Liu, D.; Liu, X.; Guo, K.; Ji, Q.; Chang, Y. Spillover Effects among Electricity Prices, Traditional Energy Prices and Carbon Market under Climate Risk. Int. J. Environ. Res. Public Health 2023, 20, 1116. https://doi.org/10.3390/ijerph20021116
Liu D, Liu X, Guo K, Ji Q, Chang Y. Spillover Effects among Electricity Prices, Traditional Energy Prices and Carbon Market under Climate Risk. International Journal of Environmental Research and Public Health. 2023; 20(2):1116. https://doi.org/10.3390/ijerph20021116
Chicago/Turabian StyleLiu, Donglan, Xin Liu, Kun Guo, Qiang Ji, and Yingxian Chang. 2023. "Spillover Effects among Electricity Prices, Traditional Energy Prices and Carbon Market under Climate Risk" International Journal of Environmental Research and Public Health 20, no. 2: 1116. https://doi.org/10.3390/ijerph20021116
APA StyleLiu, D., Liu, X., Guo, K., Ji, Q., & Chang, Y. (2023). Spillover Effects among Electricity Prices, Traditional Energy Prices and Carbon Market under Climate Risk. International Journal of Environmental Research and Public Health, 20(2), 1116. https://doi.org/10.3390/ijerph20021116