

Unique SARS-CoV-2 Variants, Tourism Metrics, and B.1.2 Emergence in Early COVID-19 Pandemic: A Correlation Analysis in South Dakota


Abstract
:1. Introduction
2. Materials and Methods
2.1. Ethical Statement
2.2. Metrics
2.3. Analysis
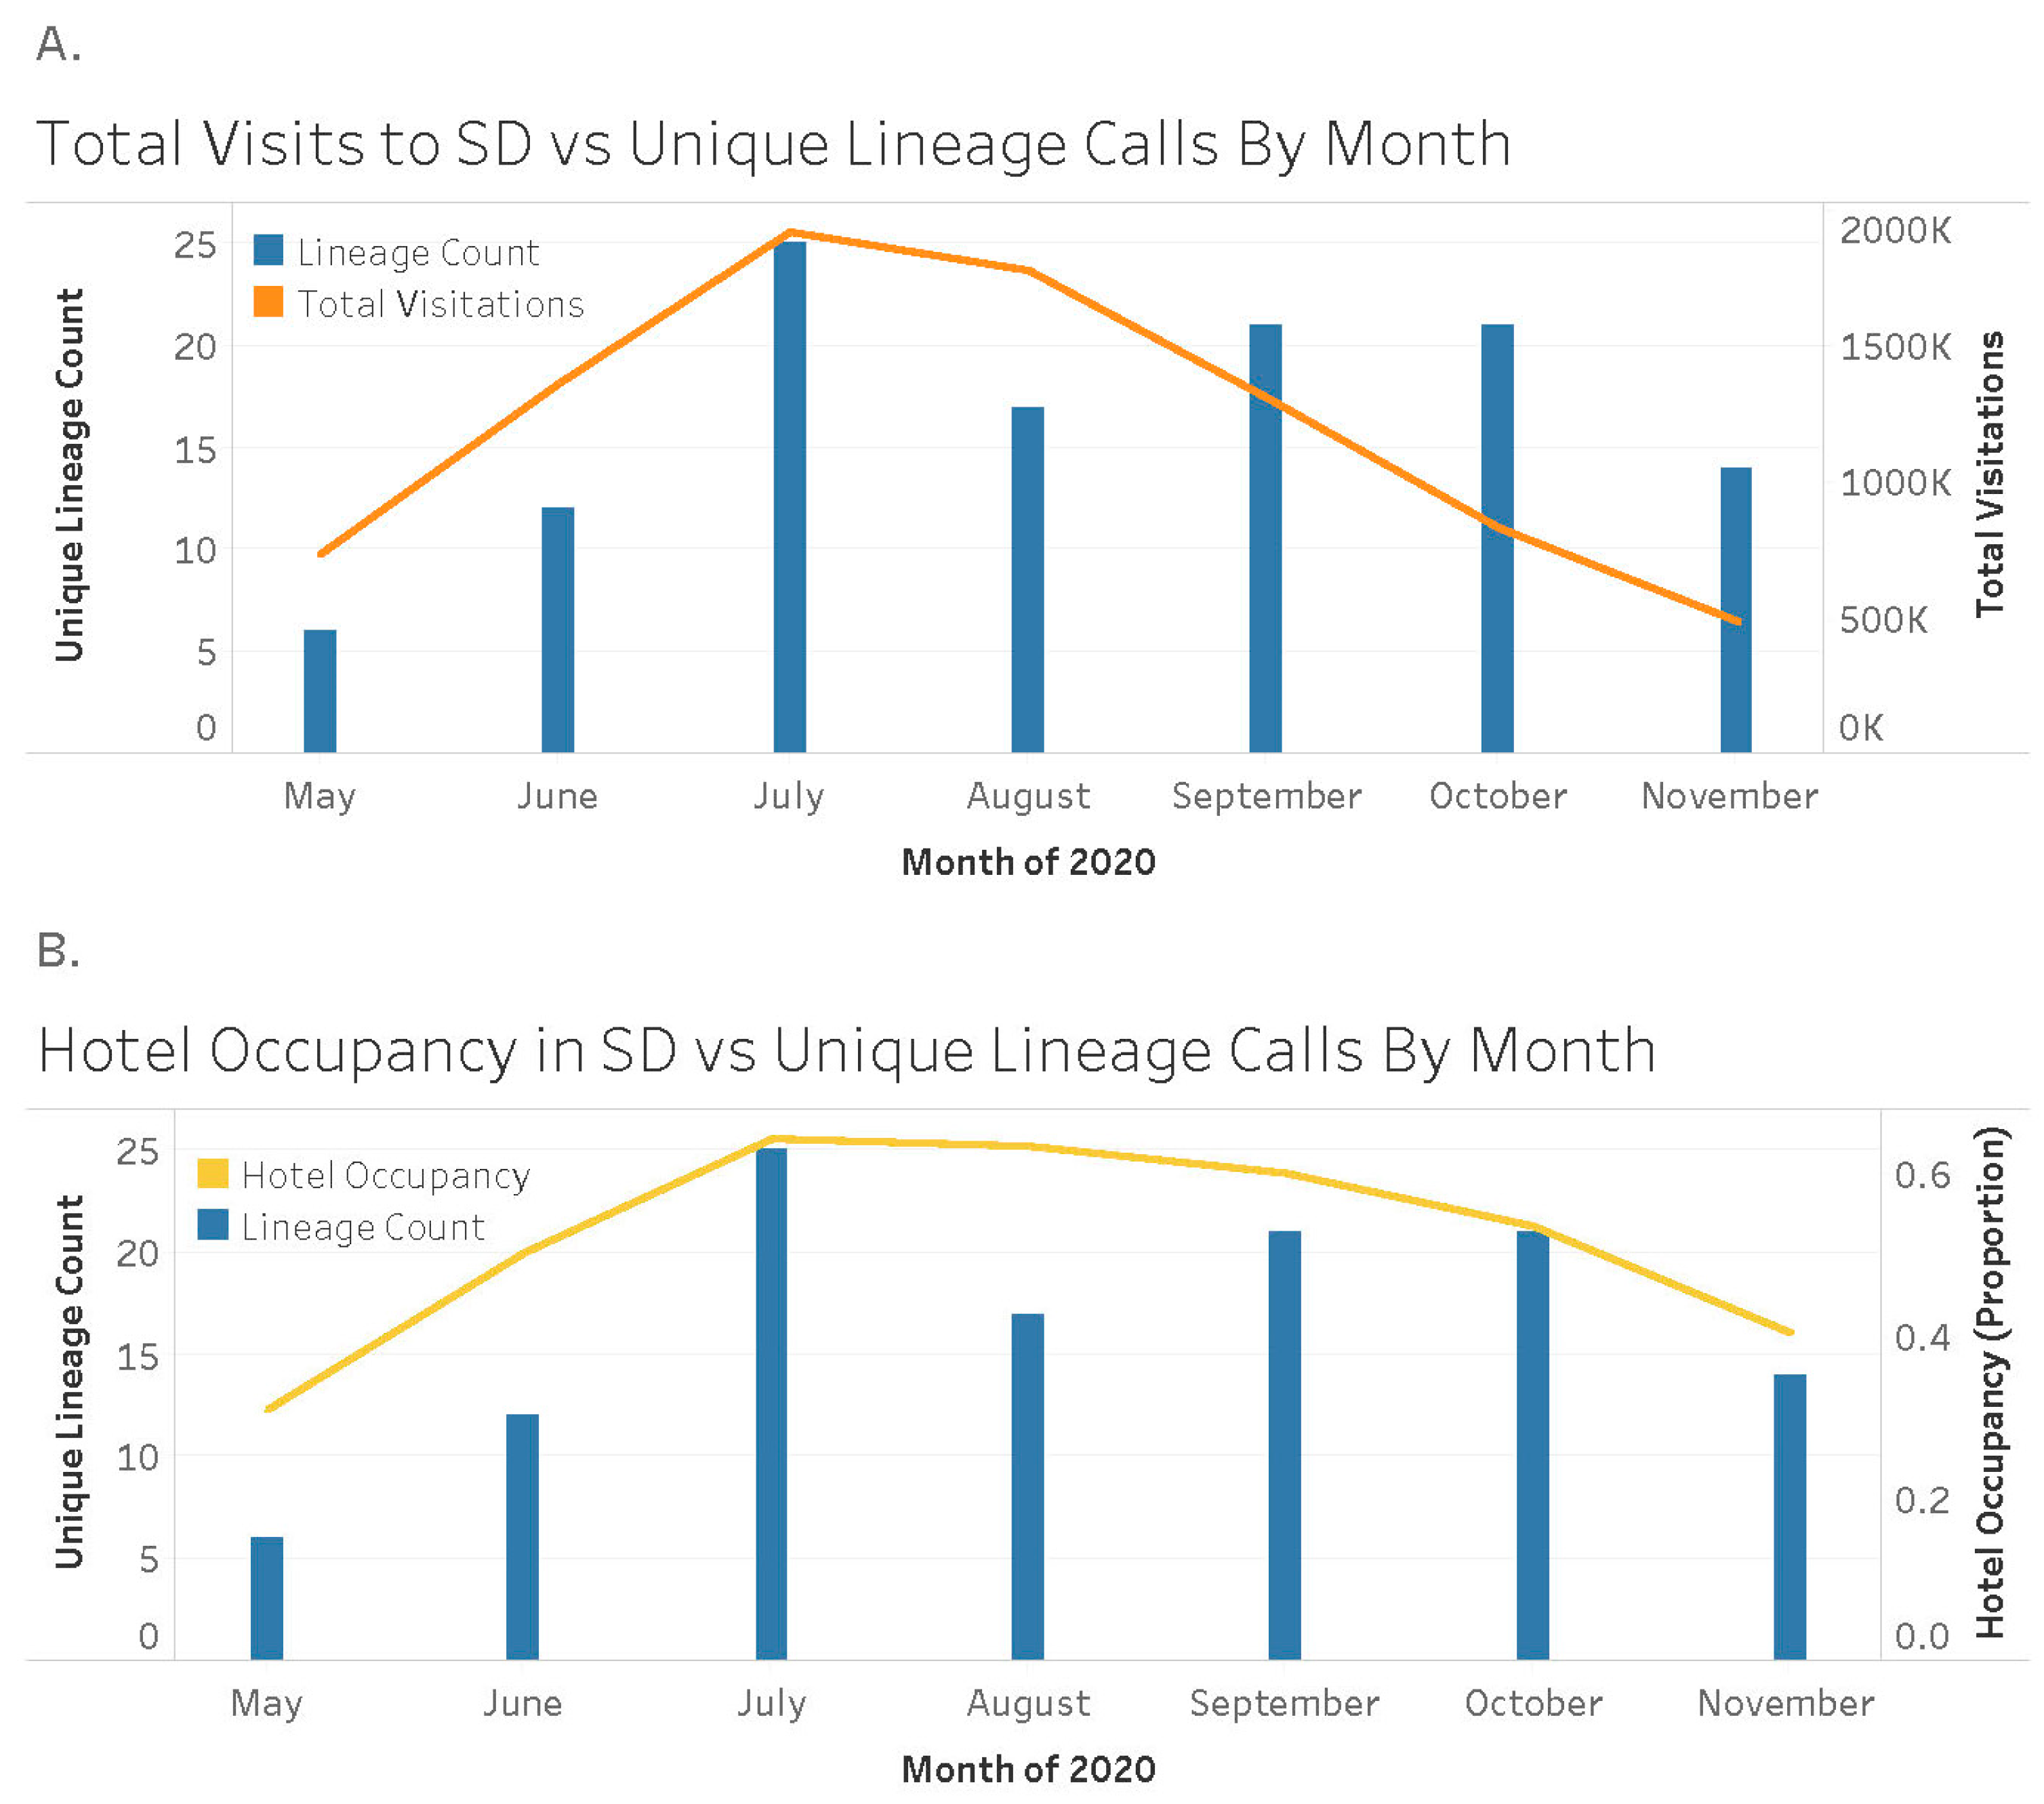
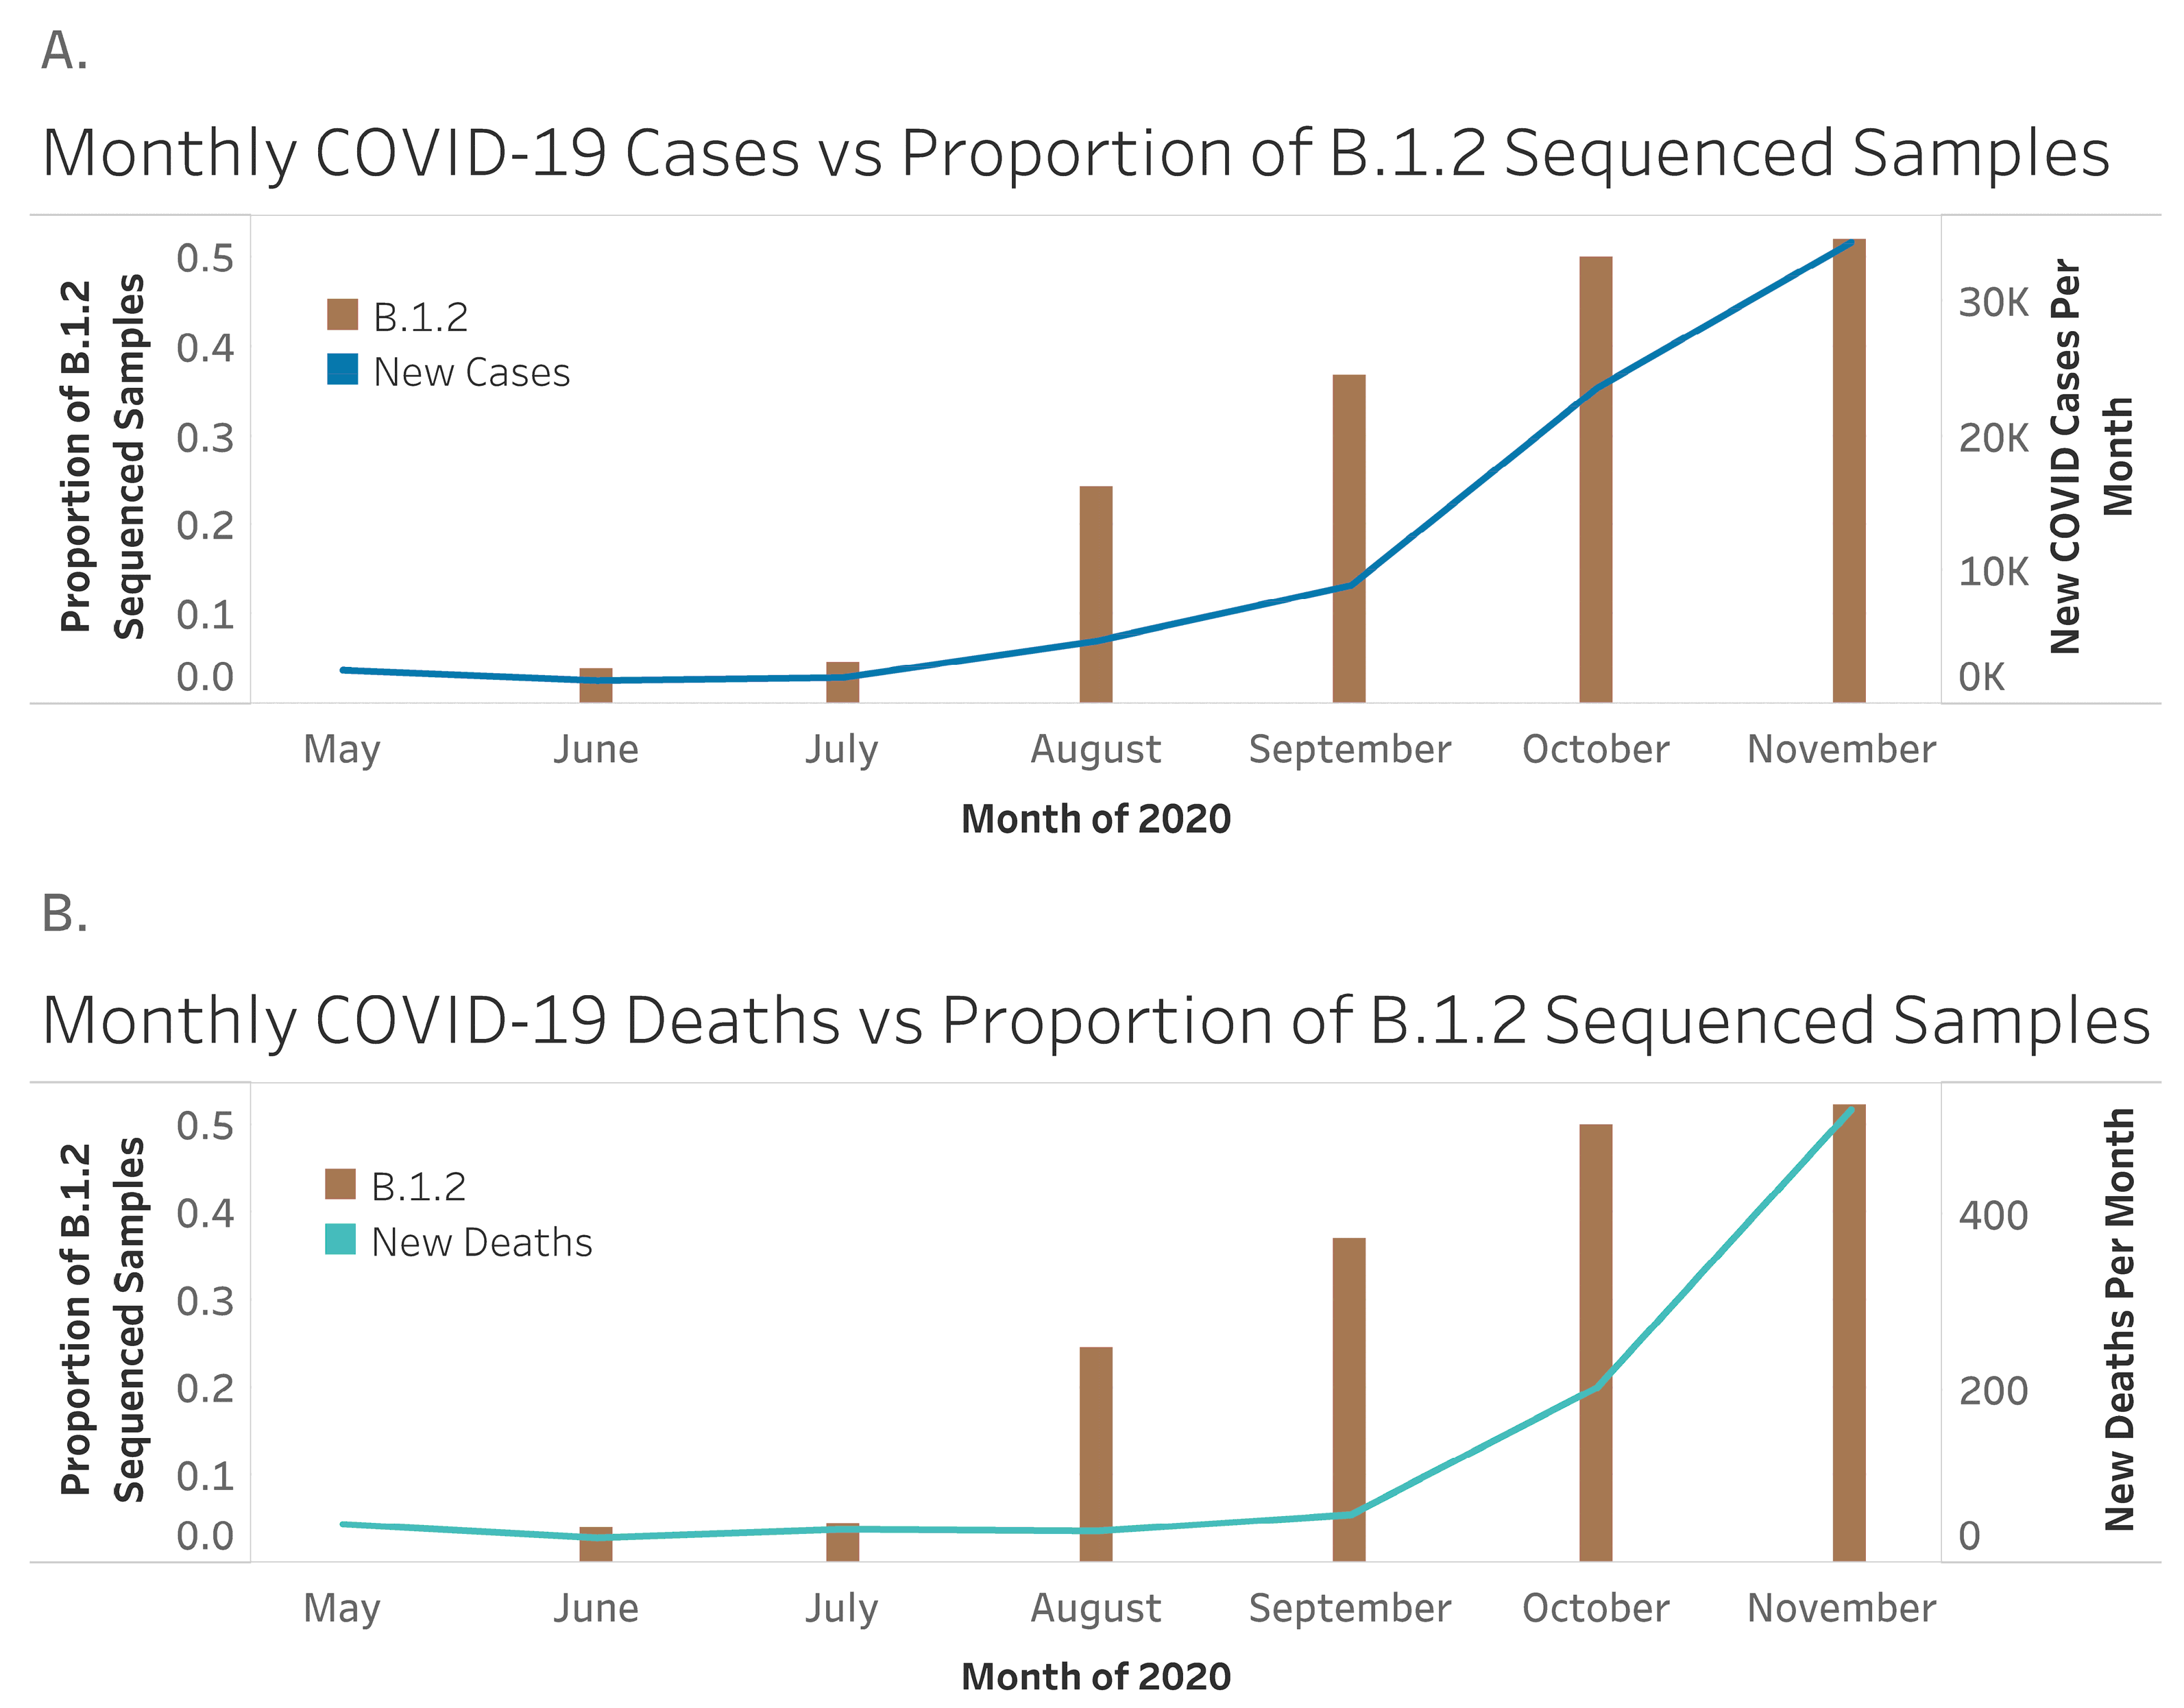
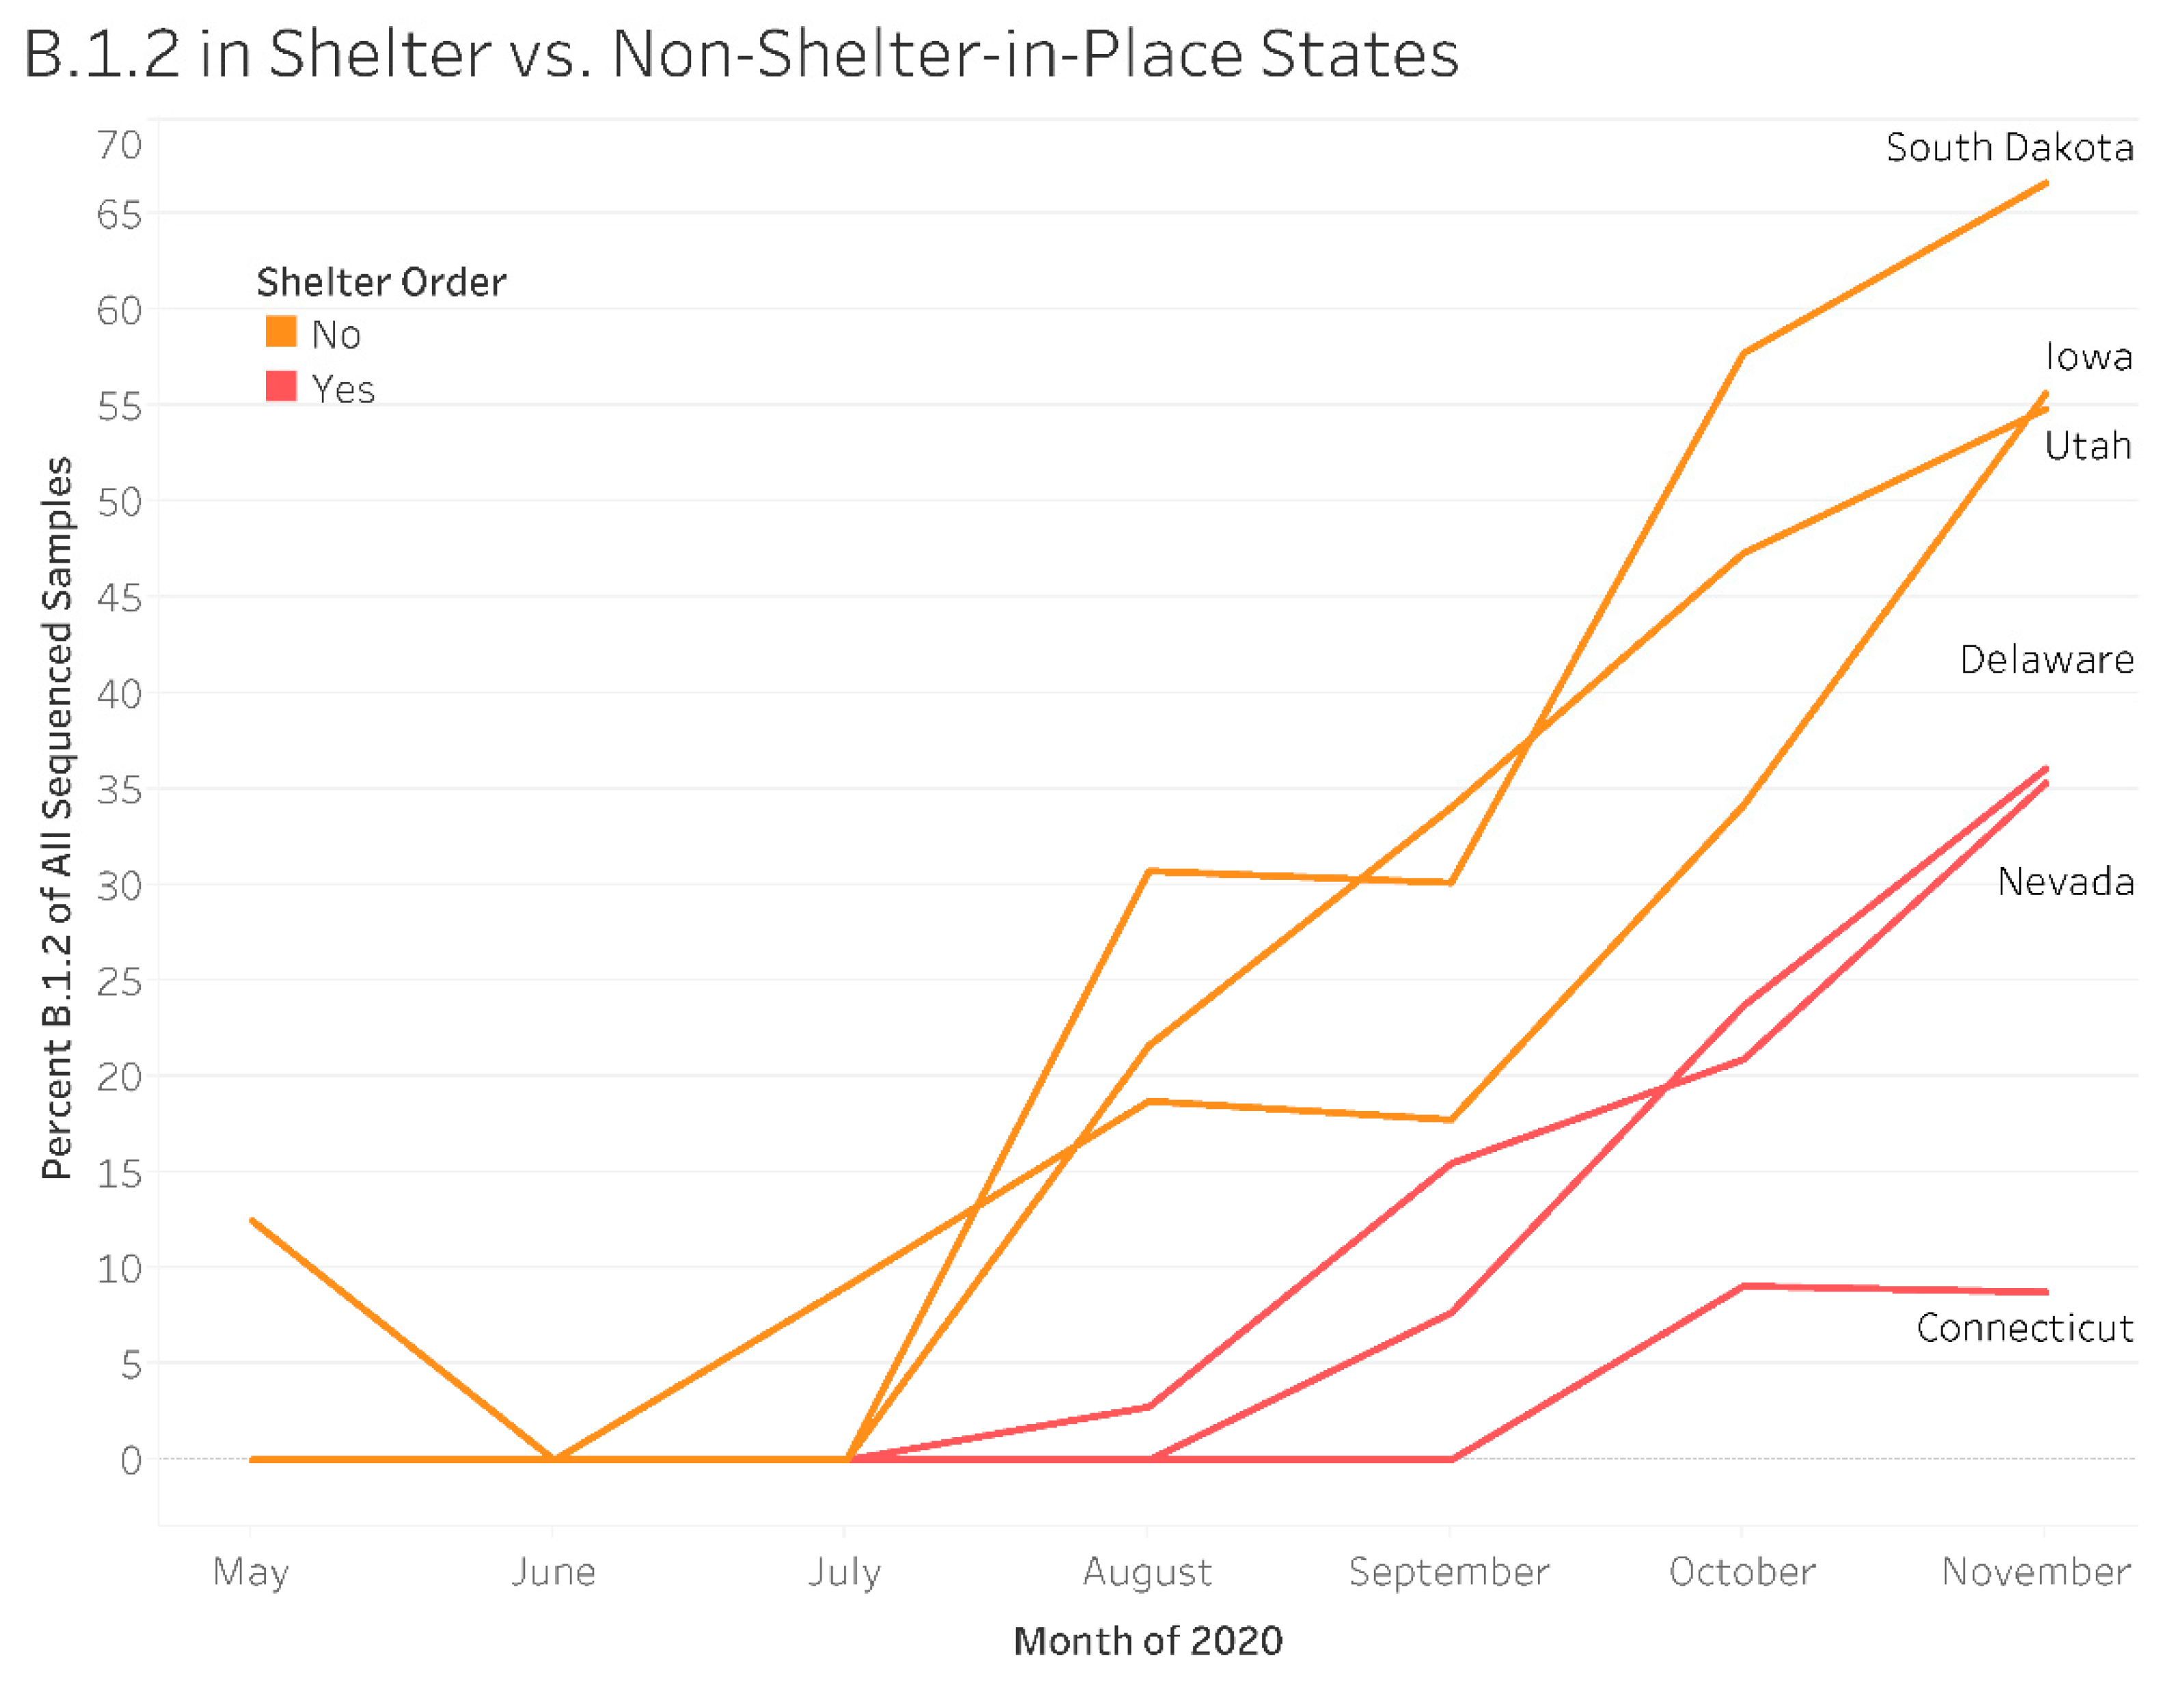
3. Results
3.1. SARS-CoV-2 Variants
3.2. Clinical Metrics
In Shelter vs. Non-Shelter-In-Place States
4. Discussion
Limitations
5. Conclusions
Supplementary Materials
Author Contributions
Funding
Institutional Review Board Statement
Informed Consent Statement
Data Availability Statement
Acknowledgments
Conflicts of Interest
References
- Yuki, K.; Fujiogi, M.; Koutsogiannaki, S. COVID-19 pathophysiology: A review. Clin. Immunol. 2020, 215, 108427. [Google Scholar] [CrossRef]
- Sun, Y.-Y.; Sie, L.; Faturay, F.; Auwalin, I.; Wang, J. Who are vulnerable in a tourism crisis? A tourism employment vulnerability analysis for the COVID-19 management. J. Hosp. Tour. Manag. 2021, 49, 304–308. [Google Scholar] [CrossRef]
- Graham, M.; Hayward, H.; Janicki, H.; McEntarfer, E.; Tucker, L. Tourism and Related Industries Declined Sharply in Northeastern States in Spring 2020, Women and Young Workers More Affected Nationwide. United States Census Bureau, 23 June 2021. Available online: https://www.census.gov/library/stories/2021/06/initial-impact-of-covid-19-on-travel-tourism-outdoor-recreation-varied-widely-across-states.html#:~:text=Workers%20employed%20in%20travel%2C%20tourism%20and%20outdoor%20recreation,the%20start%20of%20the%20second%20quarter%20of%202019 (accessed on 25 May 2023).
- Truong, D.; Truong, M.D. Projecting daily travel behavior by distance during the pandemic and the spread of COVID-19 infections—Are we in a closed loop scenario? Transp. Res. Interdiscip. Perspect. 2020, 9, 100283. [Google Scholar] [CrossRef] [PubMed]
- South Dakota Tourism. Fast Facts about the South Dakota Tourism Industry. Available online: https://sdvisit.com/fast-facts-about-south-dakota-tourism-industry (accessed on 25 May 2023).
- United States Census Bureau. Quick Facts: South Dakota. 2023. Available online: https://www.census.gov/quickfacts/SD (accessed on 25 May 2023).
- Moreland, A.; Herlihy, C.; Tynan, M.A.; Sunshine, G.; McCord, R.F.; Hilton, C.; Poovey, J.; Werner, A.K.; Jones, C.D.; Fulmer, E.B.; et al. Timing of State and Territorial COVID-19 Stay-at-Home Orders and Changes in Population Movement—United States, March 1–31 May 2020. MMWR. Morb. Mortal. Wkly. Rep. 2020, 69, 1198–1203. [Google Scholar] [CrossRef] [PubMed]
- Kates, J.; Michaud, J.; Tolbert, J. Stay-at-Home Orders to Fight COVID-19 in the United States: The Risk of a Scattershot Approach. KFF. 5 April 2020. Available online: https://www.kff.org/policy-watch/stay-at-home-orders-to-fight-covid19/ (accessed on 4 March 2023).
- Jacob, J.J.; Vasudevan, K.; Pragasam, A.K.; Gunasekaran, K.; Veeraraghavan, B.; Mutreja, A. Evolutionary Tracking of SARS-CoV-2 Genetic Variants Highlights an Intricate Balance of Stabilizing and Destabilizing Mutations. mBio 2021, 12, e0118821. [Google Scholar] [CrossRef] [PubMed]
- Wolf, J.M.; Wolf, L.M.; Bello, G.L.; Maccari, J.G.; Nasi, L.A. Molecular evolution of SARS-CoV-2 from December 2019 to August 2022. J. Med. Virol. 2022, 95, e28366. [Google Scholar] [CrossRef]
- CDC. Weekly Trends in Number of COVID-19 Deaths in the United States Reported to CDC. Available online: https://covid.cdc.gov/covid-data-tracker/#trends_weeklydeaths_select_00 (accessed on 2 March 2023).
- South Dakota Tourism. Research and Reports. Available online: https://sdvisit.com/research-reports (accessed on 2 March 2023).
- Shu, Y.; McCauley, J. GISAID: Global initiative on sharing all influenza data—From vision to reality. Eurosurveillance 2017, 22, 30494. [Google Scholar] [CrossRef]
- SAS. The Logistic Proceedure. Available online: https://support.sas.com/documentation/cdl/en/statug/63347/HTML/default/viewer.htm#logistic_toc.htm (accessed on 22 August 2023).
- Jia, J.S.; Lu, X.; Yuan, Y.; Xu, G.; Jia, J.; Christakis, N.A. Population flow drives spatio-temporal distribution of COVID-19 in China. Nature 2020, 582, 389–394. [Google Scholar] [CrossRef]
- Kuchler, T.; Russel, D.; Stroebel, J. JUE Insight: The geographic spread of COVID-19 correlates with the structure of social networks as measured by Facebook. J. Urban Econ. 2022, 127, 103314. [Google Scholar] [CrossRef]
- Badr, H.S.; Du, H.; Marshall, M.; Dong, E.; Squire, M.M.; Gardner, L.M. Association between mobility patterns and COVID-19 transmission in the USA: A mathematical modelling study. Lancet Infect. Dis. 2020, 20, 1247–1254. [Google Scholar] [CrossRef]
- Kraemer, M.U.G.; Yang, C.-H.; Gutierrez, B.; Wu, C.-H.; Klein, B.; Pigott, D.M.; du Plessis, L.; Faria, N.R.; Li, R.; Hanage, W.P.; et al. The effect of human mobility and control measures on the COVID-19 epidemic in China. Science 2020, 368, 493–497. [Google Scholar] [CrossRef] [PubMed]
- Fong, M.W.; Gao, H.; Wong, J.Y.; Xiao, J.; Shiu, E.Y.; Ryu, S.; Cowling, B.J. Nonpharmaceutical Measures for Pandemic Influenza in Nonhealthcare Settings-Social Distancing Measures. Emerg. Infect. Dis. 2020, 26, 976–984. [Google Scholar] [CrossRef] [PubMed]
- Colombo, F.R.; Alicandro, G.; La Vecchia, C. Area-level indicators of income and total mortality during the COVID-19 pandemic. Eur. J. Public Health 2021, 31, 625–629. [Google Scholar] [CrossRef] [PubMed]
- Chinazzi, M.; Davis, J.T.; Ajelli, M.; Gioannini, C.; Litvinova, M.; Merler, S.; Piontti, Y.; Pastore, A.; Mu, K.; Rossi, L.; et al. The effect of travel restrictions on the spread of the 2019 novel coronavirus (COVID-19) outbreak. Science 2020, 368, 395–400. [Google Scholar] [CrossRef]
- Bi, Q.; Wu, Y.; Mei, S.; Ye, C.; Zou, X.; Zhang, Z.; Liu, X.; Wei, L.; Truelove, S.A.; Zhang, T.; et al. Epidemiology and transmission of COVID-19 in 391 cases and 1286 of their close contacts in Shenzhen, China: A retrospective cohort study. Lancet Infect. Dis. 2020, 20, 911–919, Erratum in Lancet Infect. Dis. 2020, 20, e148. [Google Scholar] [CrossRef] [PubMed]
- Arima, M.; Takamiya, Y.; Furuta, A.; Siriratsivawong, K.; Tsuchiya, S.; Izumi, M. Factors associated with the mental health status of medical students during the COVID-19 pandemic: A cross-sectional study in Japan. BMJ Open 2020, 10, e043728. [Google Scholar] [CrossRef]
- Ning, H.; Li, Z.; Qiao, S.; Zeng, C.; Zhang, J.; Olatosi, B.; Li, X. Revealing geographic transmission pattern of COVID-19 using neighborhood-level simulation with human mobility data and SEIR model: A case study of South Carolina. Int. J. Appl. Earth Obs. Geoinform. 2023, 118, 103246. [Google Scholar] [CrossRef]
- Vo, V.; Tillett, R.L.; Papp, K.; Chang, C.-L.; Harrington, A.; Moshi, M.; Oh, E.C.; Gerrity, D. Detection of the Omicron BA.1 Variant of SARS-CoV-2 in Wastewater From a Las Vegas Tourist Area. JAMA Netw. Open 2023, 6, e230550. [Google Scholar] [CrossRef]
- Rainey, A.L.; Loeb, J.C.; Robinson, S.E.; Lednicky, J.A.; McPherson, J.; Colson, S.; Allen, M.; Coker, E.S.; Sabo-Attwood, T.; Maurelli, A.T.; et al. Wastewater surveillance for SARS-CoV-2 in a small coastal community: Effects of tourism on viral presence and variant identification among low prevalence populations. Environ. Res. 2022, 208, 112496. [Google Scholar] [CrossRef]
- Turcato, G.; Zaboli, A.; Giudiceandrea, A.; Sibilio, S.; Magnarelli, G.; Rella, E.; Canelles, M.F.; Pfeifer, N.; Brigo, F. Impact of tourists on emergency department in a high-tourism alpin area: An observational study. Travel Med. Infect. Dis. 2023, 51, 102491. [Google Scholar] [CrossRef]
- Anzai, A.; Jung, S.-M.; Nishiura, H. Go To Travel campaign and the geographic spread of COVID-19 in Japan. BMC Infect. Dis. 2022, 22, 808. [Google Scholar] [CrossRef] [PubMed]
- Klein, C.; Borsche, M.; Balck, A.; Föh, B.; Rahmöller, J.; Peters, E.; Knickmann, J.; Lane, M.; Vollstedt, E.-J.; Elsner, S.A.; et al. One-year surveillance of SARS-CoV-2 transmission of the ELISA cohort: A model for population-based monitoring of infection risk. Sci. Adv. 2022, 8, eabm5016. [Google Scholar] [CrossRef] [PubMed]
- Chang, D.; Chang, X.; He, Y.; Tan, K.J.K. The determinants of COVID-19 morbidity and mortality across countries. Sci. Rep. 2022, 12, 5888. [Google Scholar] [CrossRef] [PubMed]
- Firestone, M.J.; Wienkes, H.; Garfin, J.; Wang, X.; Vilen, K.; Smith, K.E.; Holzbauer, S.; Plumb, M.; Pung, K.; Medus, C.; et al. COVID-19 Outbreak Associated with a 10-Day Motorcycle Rally in a Neighboring State—Minnesota, August–September 2020. MMWR. Morb. Mortal. Wkly. Rep. 2020, 69, 1771–1776. [Google Scholar] [CrossRef]
- Carter, R.J.; Rose, D.; Sabo, R.; Clayton, J.; Steinberg, J.; Anderson, M. Widespread Severe Acute Respiratory Syndrome Coronavirus 2 Transmission Among Attendees at a Large Motorcycle Rally and their Contacts, 30 US Jurisdictions, August–September, 2020. Clin. Infect. Dis. 2021, 73 (Suppl. S1), S106–S109. [Google Scholar] [CrossRef]
- Marroquín, B.; Vine, V.; Morgan, R. Mental health during the COVID-19 pandemic: Effects of stay-at-home policies, social distancing behavior, and social resources. Psychiatry Res. 2020, 293, 113419. [Google Scholar] [CrossRef]
- Rodríguez-Fernández, P.; González-Santos, J.; Santamaría-Peláez, M.; Soto-Cámara, R.; Sánchez-González, E.; González-Bernal, J.J. Psychological Effects of Home Confinement and Social Distancing Derived from COVID-19 in the General Population-A Systematic Review. Int. J. Environ. Res. Public Health 2021, 18, 6528. [Google Scholar] [CrossRef]
- Benke, C.; Autenrieth, L.K.; Asselmann, E.; Pané-Farré, C.A. Lockdown, quarantine measures, and social distancing: Associations with depression, anxiety and distress at the beginning of the COVID-19 pandemic among adults from Germany. Psychiatry Res. 2020, 293, 113462. [Google Scholar] [CrossRef]
- Cohn-Schwartz, E.; Vitman-Schorr, A.; Khalaila, R. Physical distancing is related to fewer electronic and in-person contacts and to increased loneliness during the COVID-19 pandemic among older Europeans. Qual. Life Res. 2021, 31, 1033–1042. [Google Scholar] [CrossRef]
- Husain, A.A.; Rai, U.; Sarkar, A.K.; Chandrasekhar, V.; Hashmi, M.F. Out-of-Hospital Cardiac Arrest during the COVID-19 Pandemic: A Systematic Review. Healthcare 2023, 11, 189. [Google Scholar] [CrossRef]
- Yao, X.I.; Han, L.; Sun, Y.; He, D.; Zhao, S.; Ran, J. Temporal variation of excess deaths from diabetes during the COVID-19 pandemic in the United States. J. Infect. Public Health 2023, 16, 483–489. [Google Scholar] [CrossRef] [PubMed]
- Gao, X.; Lv, F.; He, X.; Zhao, Y.; Liu, Y.; Zu, J.; Henry, L.; Wang, J.; Yeo, Y.H.; Ji, F.; et al. Impact of the COVID-19 pandemic on liver disease-related mortality rates in the United States. J. Hepatol. 2022, 78, 16–27. [Google Scholar] [CrossRef] [PubMed]
- Lee, W.-E.; Park, S.W.; Weinberger, D.M.; Olson, D.; Simonsen, L.; Grenfell, B.T.; Viboud, C. Direct and indirect mortality impacts of the COVID-19 pandemic in the United States, 1 March 2020 to 1 January 2022. eLife 2023, 12, e77562. [Google Scholar] [CrossRef] [PubMed]
- Abouk, R.; Heydari, B. The Immediate Effect of COVID-19 Policies on Social-Distancing Behavior in the United States. Public Health Rep. 2021, 136, 245–252. [Google Scholar] [CrossRef]
- Hellewell, J.; Abbott, S.; Gimma, A.; Bosse, N.I.; Jarvis, C.I.; Russell, T.W.; Munday, J.D.; Kucharski, A.J.; Edmunds, W.J.; Funk, S.; et al. Feasibility of controlling COVID-19 outbreaks by isolation of cases and contacts. Lancet Glob. Health 2020, 8, e488–e496. [Google Scholar] [CrossRef]
- Outbreak.info. B.1.2 Lineage Report. Available online: https://outbreak.info/situation-reports?pango=B.1.2&loc=USA&loc=USA_US-CA&selected=USA&overlay=false (accessed on 4 March 2023).
- Gangavarapu, K.; Latif, A.A.; Mullen, J.L.; Alkuzweny, M.; Hufbauer, E.; Tsueng, G.; Haag, E.; Zeller, M.; Aceves, C.M.; Zaiets, K.; et al. Outbreak.info genomic reports: Scalable and dynamic surveillance of SARS-CoV-2 variants and mutations. Nat. Methods 2023, 20, 512–522. [Google Scholar] [CrossRef]
- Zhang, L.; Jackson, C.B.; Mou, H.; Ojha, A.; Peng, H.; Quinlan, B.D.; Rangarajan, E.S.; Pan, A.; Vanderheiden, A.; Suthar, M.S.; et al. SARS-CoV-2 spike-protein D614G mutation increases virion spike density and infectivity. Nat. Commun. 2020, 11, 6013. [Google Scholar] [CrossRef]
- Kepler, L.; Hamins-Puertolas, M.; Rasmussen, D.A. Decomposing the sources of SARS-CoV-2 fitness variation in the United States. Virus Evol. 2021, 7, veab073. [Google Scholar] [CrossRef]
- Chang, S.; Pierson, E.; Koh, P.W.; Gerardin, J.; Redbird, B.; Grusky, D.; Leskovec, J. Mobility network models of COVID-19 explain inequities and inform reopening. Nature 2021, 589, 82–87. [Google Scholar] [CrossRef]
- Perez-Saez, J.; Lauer, S.A.; Kaiser, L.; Regard, S.; Delaporte, E.; Guessous, I.; Stringhini, S.; Azman, A.S.; Alioucha, D.; Arm-Vernez, I.; et al. Serology-informed estimates of SARS-CoV-2 infection fatality risk in Geneva, Switzerland. Lancet Infect. Dis. 2020, 21, e69–e70. [Google Scholar] [CrossRef]


| Measure | Level | Odds Ratio | 95% Confidence Interval |
|---|---|---|---|
| Shelter-in-Place Order | |||
| No | 3.572 | (2.885, 4.423) | |
| Yes | Reference | ||
| Month | |||
| May | <0.001 | (<0.001, 0.004) | |
| June | 0.021 | (0.012, 0.036) | |
| July | 0.159 | (0.118, 0.214) | |
| August | 0.199 | (0.161, 0.246) | |
| September | 0.304 | (0.224, 0.412) | |
| October | 0.670 | (0.540, 0.855) | |
| November | Reference |
Disclaimer/Publisher’s Note: The statements, opinions and data contained in all publications are solely those of the individual author(s) and contributor(s) and not of MDPI and/or the editor(s). MDPI and/or the editor(s) disclaim responsibility for any injury to people or property resulting from any ideas, methods, instructions or products referred to in the content. |
© 2023 by the authors. Licensee MDPI, Basel, Switzerland. This article is an open access article distributed under the terms and conditions of the Creative Commons Attribution (CC BY) license (https://creativecommons.org/licenses/by/4.0/).
Share and Cite
Nahian, A.; Huber, V.C.; McFadden, L.M. Unique SARS-CoV-2 Variants, Tourism Metrics, and B.1.2 Emergence in Early COVID-19 Pandemic: A Correlation Analysis in South Dakota. Int. J. Environ. Res. Public Health 2023, 20, 6748. https://doi.org/10.3390/ijerph20186748
Nahian A, Huber VC, McFadden LM. Unique SARS-CoV-2 Variants, Tourism Metrics, and B.1.2 Emergence in Early COVID-19 Pandemic: A Correlation Analysis in South Dakota. International Journal of Environmental Research and Public Health. 2023; 20(18):6748. https://doi.org/10.3390/ijerph20186748
Chicago/Turabian StyleNahian, Ahmed, Victor C. Huber, and Lisa M. McFadden. 2023. "Unique SARS-CoV-2 Variants, Tourism Metrics, and B.1.2 Emergence in Early COVID-19 Pandemic: A Correlation Analysis in South Dakota" International Journal of Environmental Research and Public Health 20, no. 18: 6748. https://doi.org/10.3390/ijerph20186748
APA StyleNahian, A., Huber, V. C., & McFadden, L. M. (2023). Unique SARS-CoV-2 Variants, Tourism Metrics, and B.1.2 Emergence in Early COVID-19 Pandemic: A Correlation Analysis in South Dakota. International Journal of Environmental Research and Public Health, 20(18), 6748. https://doi.org/10.3390/ijerph20186748