Introduction
Recent studies have confirmed that many large Indian cities are experiencing significant particulate matter pollution with 14 cities reporting levels exceeding 1.5 times the current air pollution standard, 12 cities with high levels and 3 cities reporting moderate levels. Various international studies have indicated that air pollution can trigger lung cancer [
1], respiratory [
2,
3] and heart problems [
4,
5]. Studies on short-term exposure to high pollution concentrations have also suggested higher prevalence of bronchitis, asthma, and other symptoms [
6]. For both chronic and acute health effects, the elderly, children, and those suffering from respiratory or heart conditions seem to be most at risk. Pollutant emissions of the same magnitude do not
In developing a quantitative scheme for determining health risk, one of the key exposure assessment issues is determining the effectiveness of delivery from the source and to the target. In reality, health effects are not solely dependent on emissions and concentrations. Rather they are dependent on doses received by individuals. Doses in turn, depend on the concentrations in air actually breathed by people. Focusing on exposure rather than ambient concentrations is the basic principle of total exposure assessment [
7].
Several studies of air pollution epidemiology have applied the statistical relationship between air pollution and human health outside the countries of the original studies, which are not fully comparable to Indian conditions like temperature, humidity levels [
8]. The early time series studies have been criticized for their analytical approach and inadequate control for confounding by weather variables, etc., whereas the U.S. cohort studies have been criticized for inadequate cofounder and co-pollutant control. Taking the limitations of time series studies into consideration, an eight step methodological framework has been adopted for the total health risk assessment in Hyderabad described in this paper.
The present paper describes a total health risk assessment model for health risk in Hyderabad, India. The model was developed using a multi-objective air pollution monitoring network and online and real time air pollution monitoring stations correlated with daily hospital admissions.
Study Area Description
The study area of Hyderabad city and its environs extend from 17.010°–17.050°N and 78.010°–78.050°E. According to the 2001 Indian census, Hyderabad is one of the largest metropolitan areas in India with a population of 5,533,650 which is projected to increase to 13,642,950 by 2020 due to a combination of migration, annexation of surrounding areas and births [
9]. Hyderabad experiences a minimum temperature of 11.60°C and a maximum of 40.50°C with an average annual rainfall of 73.55 cm. The daily mean maximum temperature varies from a minimum of 14.1°C during the month of December to 38.8°C in the month of May.
Methodological Framework
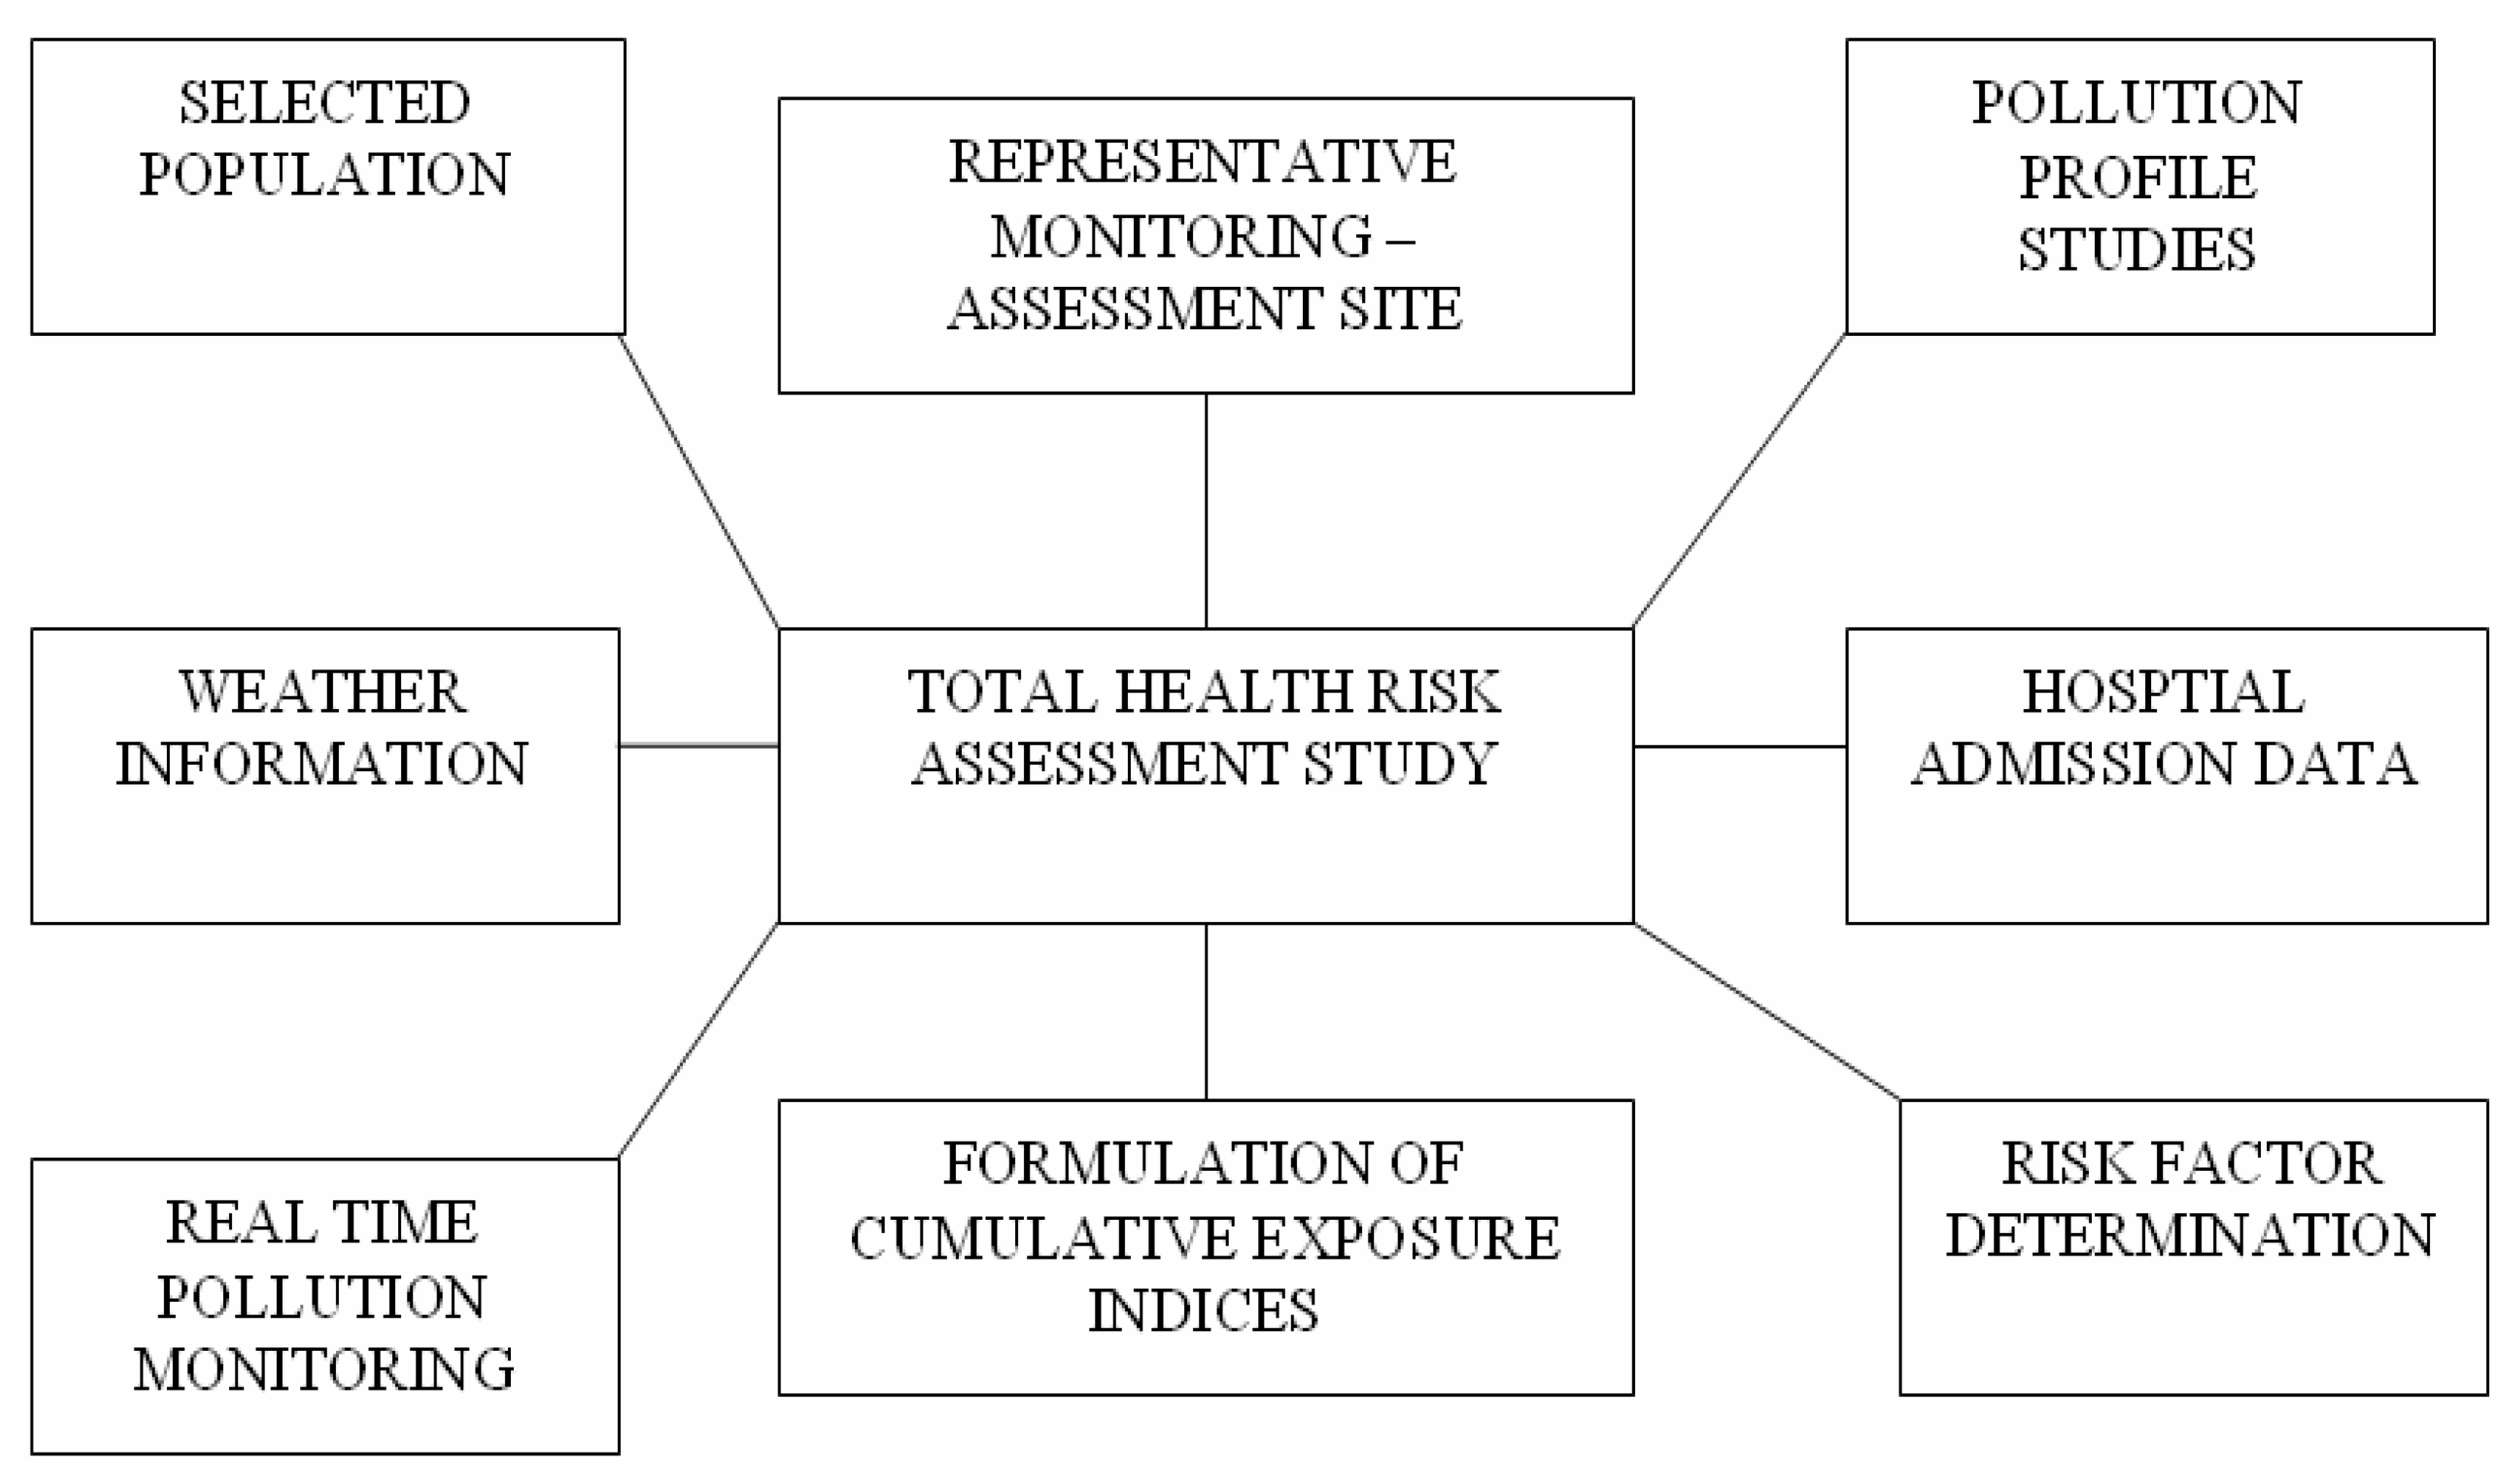
The present study “Total Health Risk Assessment” is a prospective cohort study started during December 2002. The broad methodological framework adopted for the present study is shown in
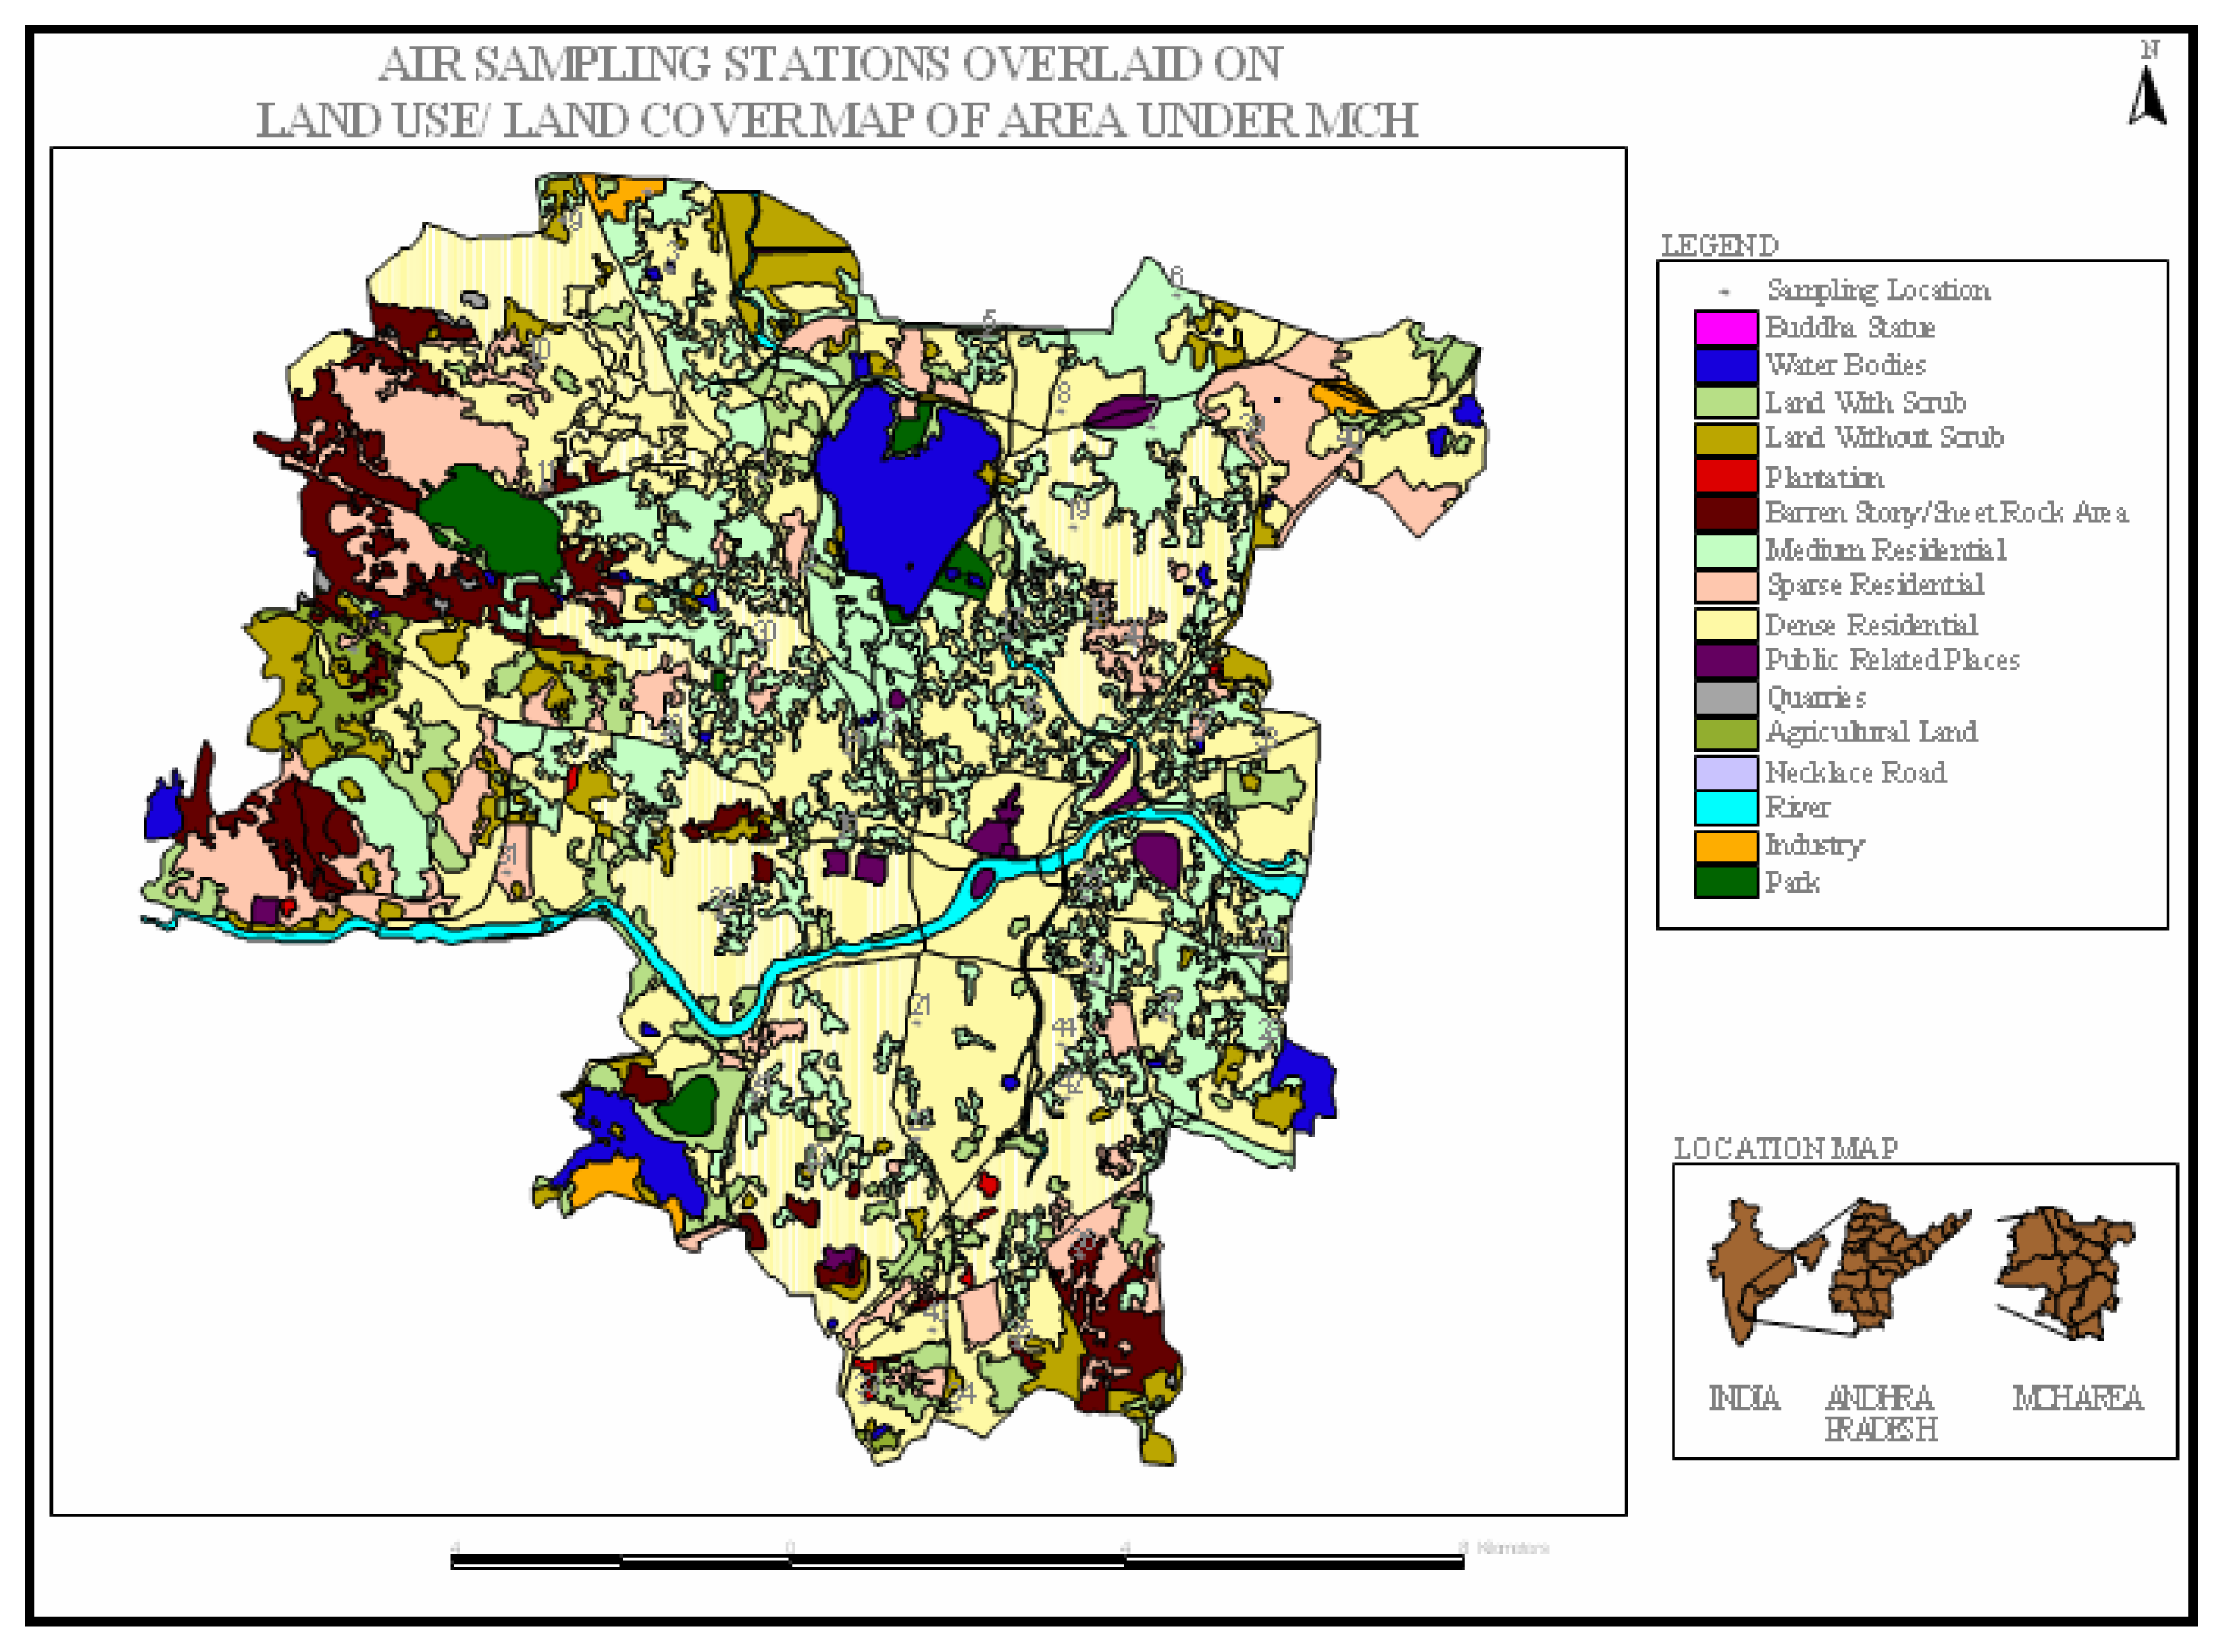
Figure 1. The broad intention of the present work is to study the cumulative exposure indices for the total risk assessment for selected subjects in Hyderabad. For the assessment studies, two sets of data were used both of which were recorded in Hyderabad. The first data set included measurements performed between February and March 2003 as part of the risk assessment study. Twenty four hour mean concentrations of oxides of nitrogen, sulphur dioxide, particulate matter (< 10 μm) and particulate matter composition for heavy metals and inorganic ions were measured at 44 temporary sites within the study area. The 44 sampling sites differed in traffic density and other land use/land cover features. Five sites were typical industrial locations, whereas fifteen were residential sites with low, medium and heavy population densities. The remaining sites were intense traffic zones. Air pollution levels for sulphur dioxide, oxides of nitrogen, suspended particulate matter and respirable suspended particulate matter (RSPM) were measured using conventional air pollution analysis procedures [
10].
Figure 2 shows the various sampling locations selected for the analysis.
Secondly, detailed field investigations were carried out using global positioning satellites (GPS) to identify the multi-objective air quality monitoring network for total risk assessment studies in Hyderabad so as to identify representative sites for pollution monitoring. Finally, an online and real time pollution monitoring station was set up for continuous monitoring of air pollution and meteorological parameters.
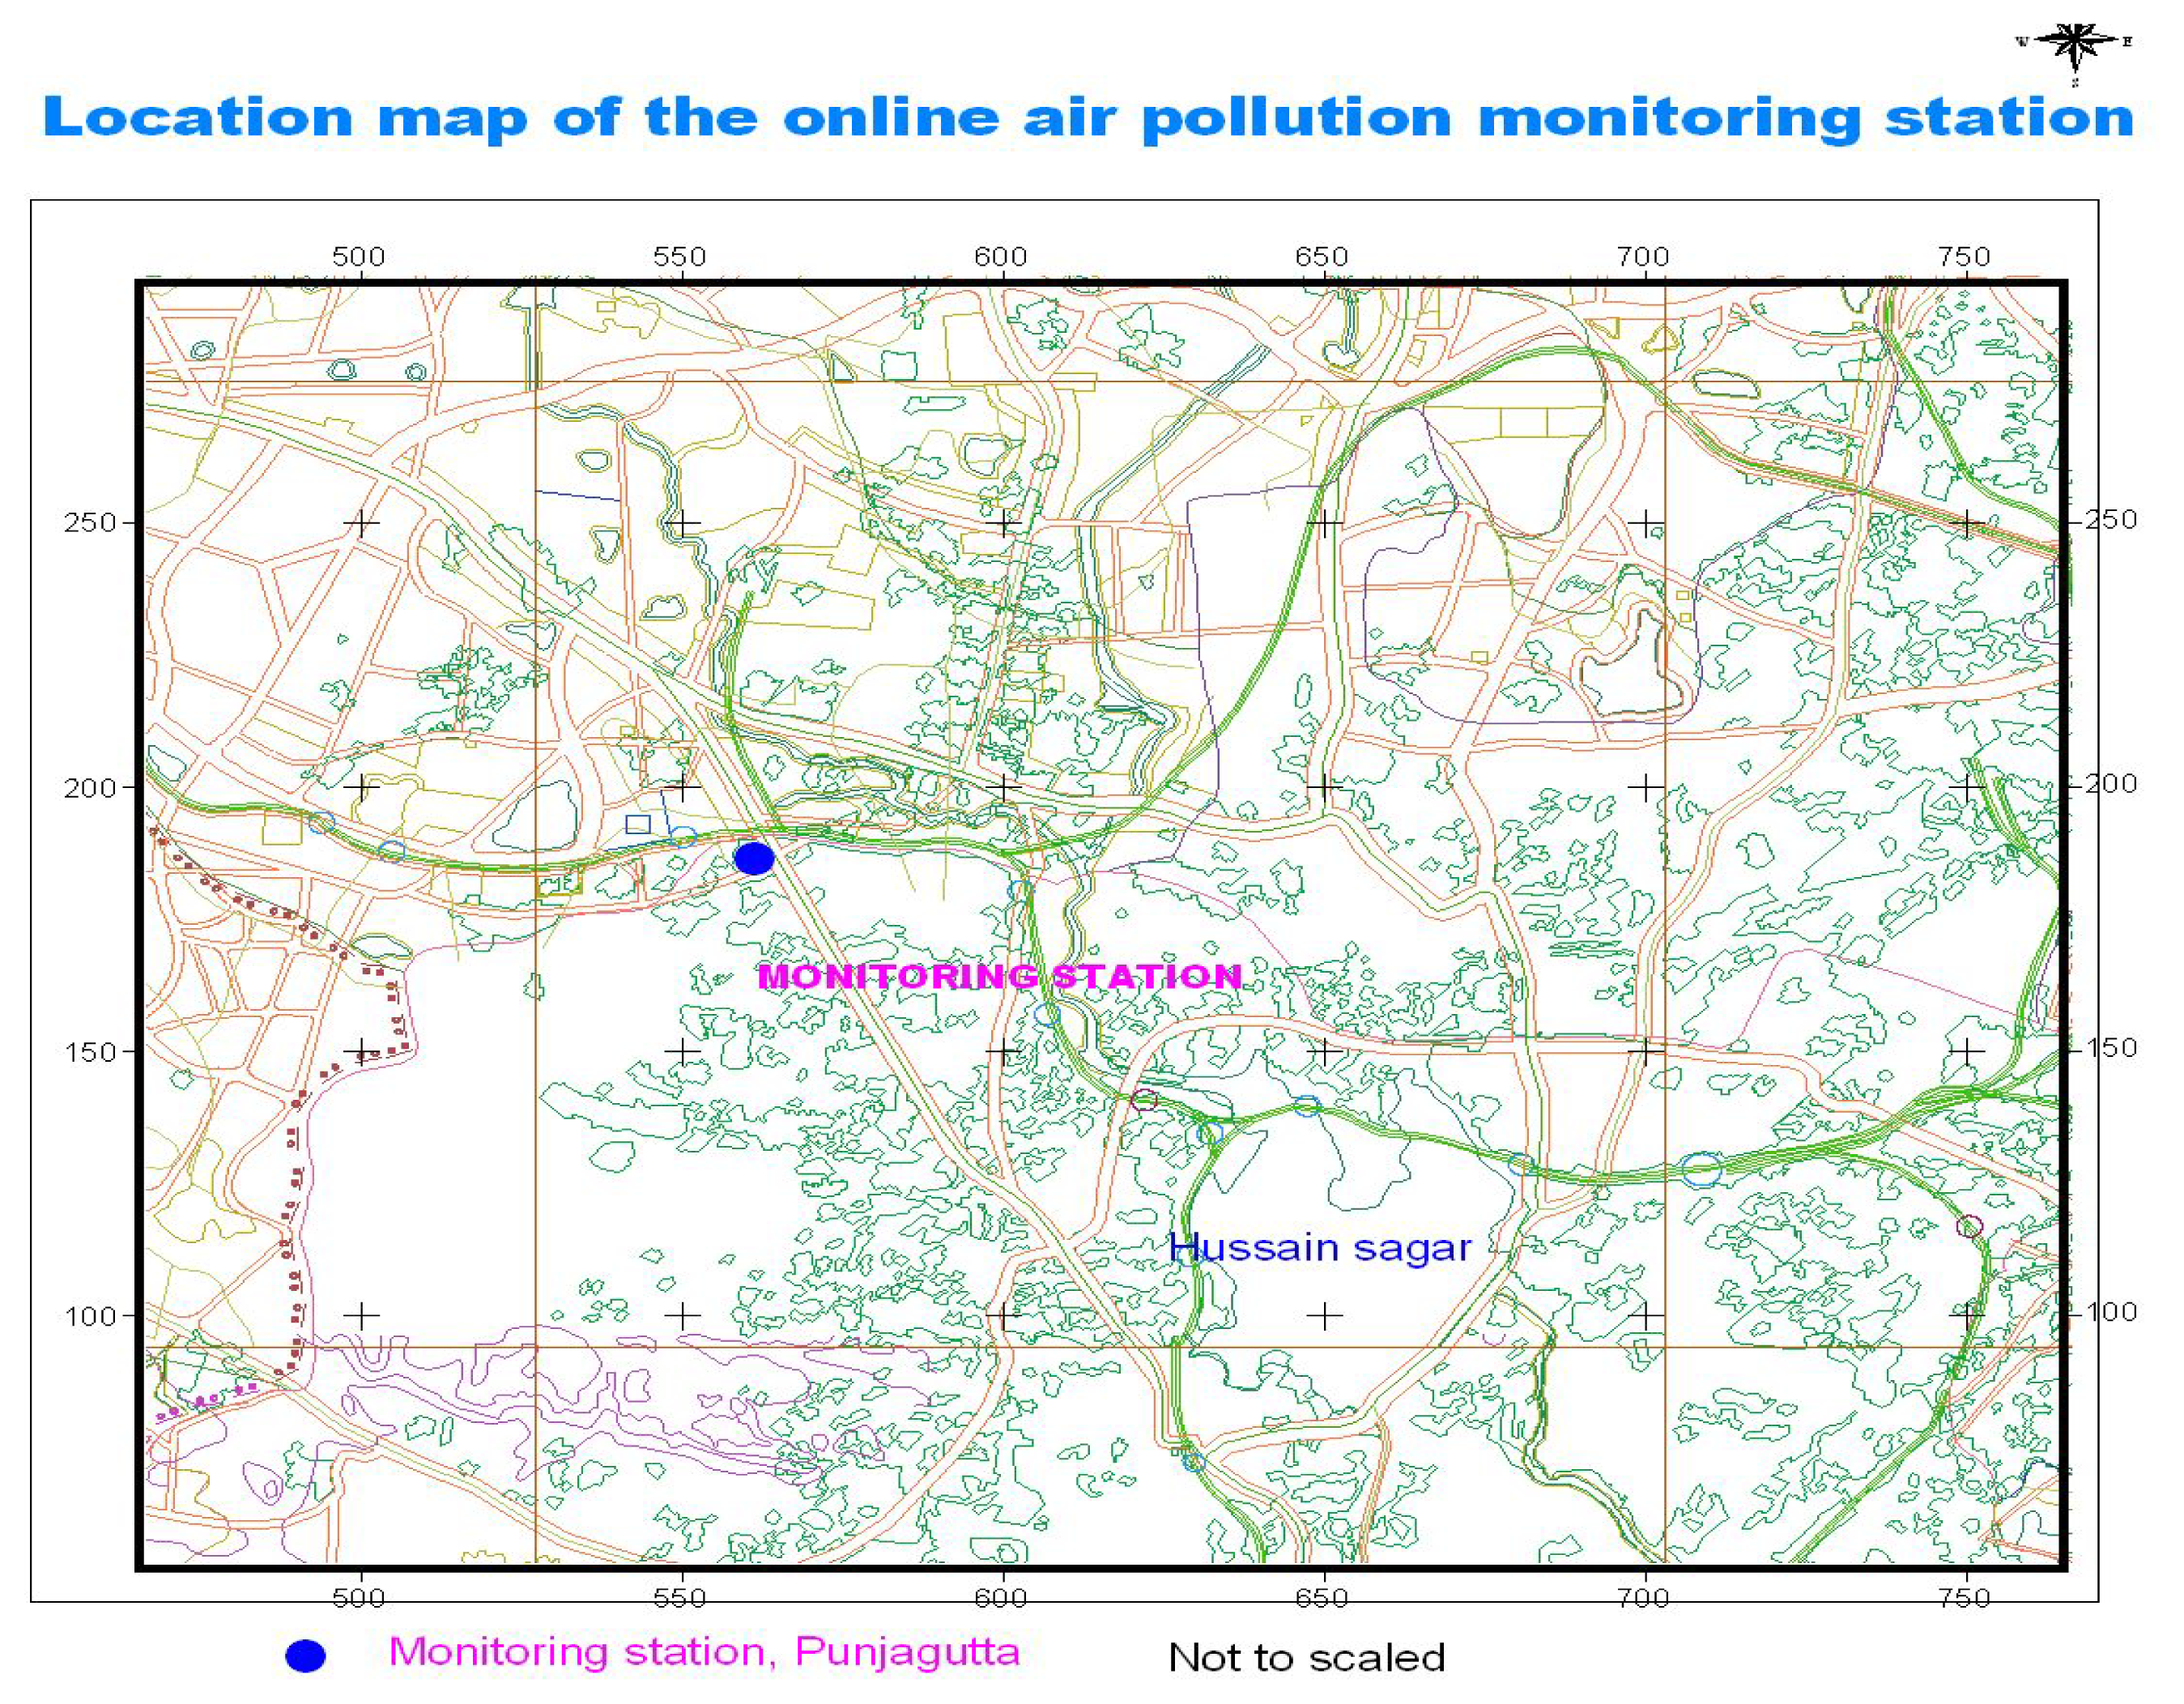
Presently, extensive statistical and numerical simulation studies are being carried out at our center using sample dwellings around the online air pollution monitoring station. The online and real time data have been collected on a continuous basis since October 2003 at a judiciously chosen site at Punjagutta, Hyderabad at predefined sampling intervals of ¼ and 1 hour duration during peak and non peak hours of the day.
Calculation of Inhalation Transfer Factors: Inhalation Transfer Factor
The Inhalation Transfer Factor (ITF) quantifies the fraction of a pollutant emitted into air that would be inhaled by an individual in a specific location for a given release and transport scenario [
7]. For an episodic pollutant release, the ITF is defined as:
where C(t) is the incremental breathing-zone concentration of the pollutant caused solely by the emission source (g/m3), QB(t) is the breathing rate (m3/hr), and E(t) is the emission rate of the pollutant from the source (g/hr). For a release of short duration, the integrals are evaluated for a sufficiently long time, t, to encompass the entire event. In addition to the individual ITF, a cumulative population ITF (PITF) is calculated as the fraction of the emitted pollutant that is inhaled by the entire exposed population
where
N is the number of persons exposed and ITF
i is the ITF for the
ith individual in the population. For a line source of length
W located along the upwind edge of a populated area of dimensions
W ×
L, the PITF over the entire air basin can then be determined by the expression given by
CK Lai et. Al[
7]:
Results and Discussion
Pollution Asessment Studies
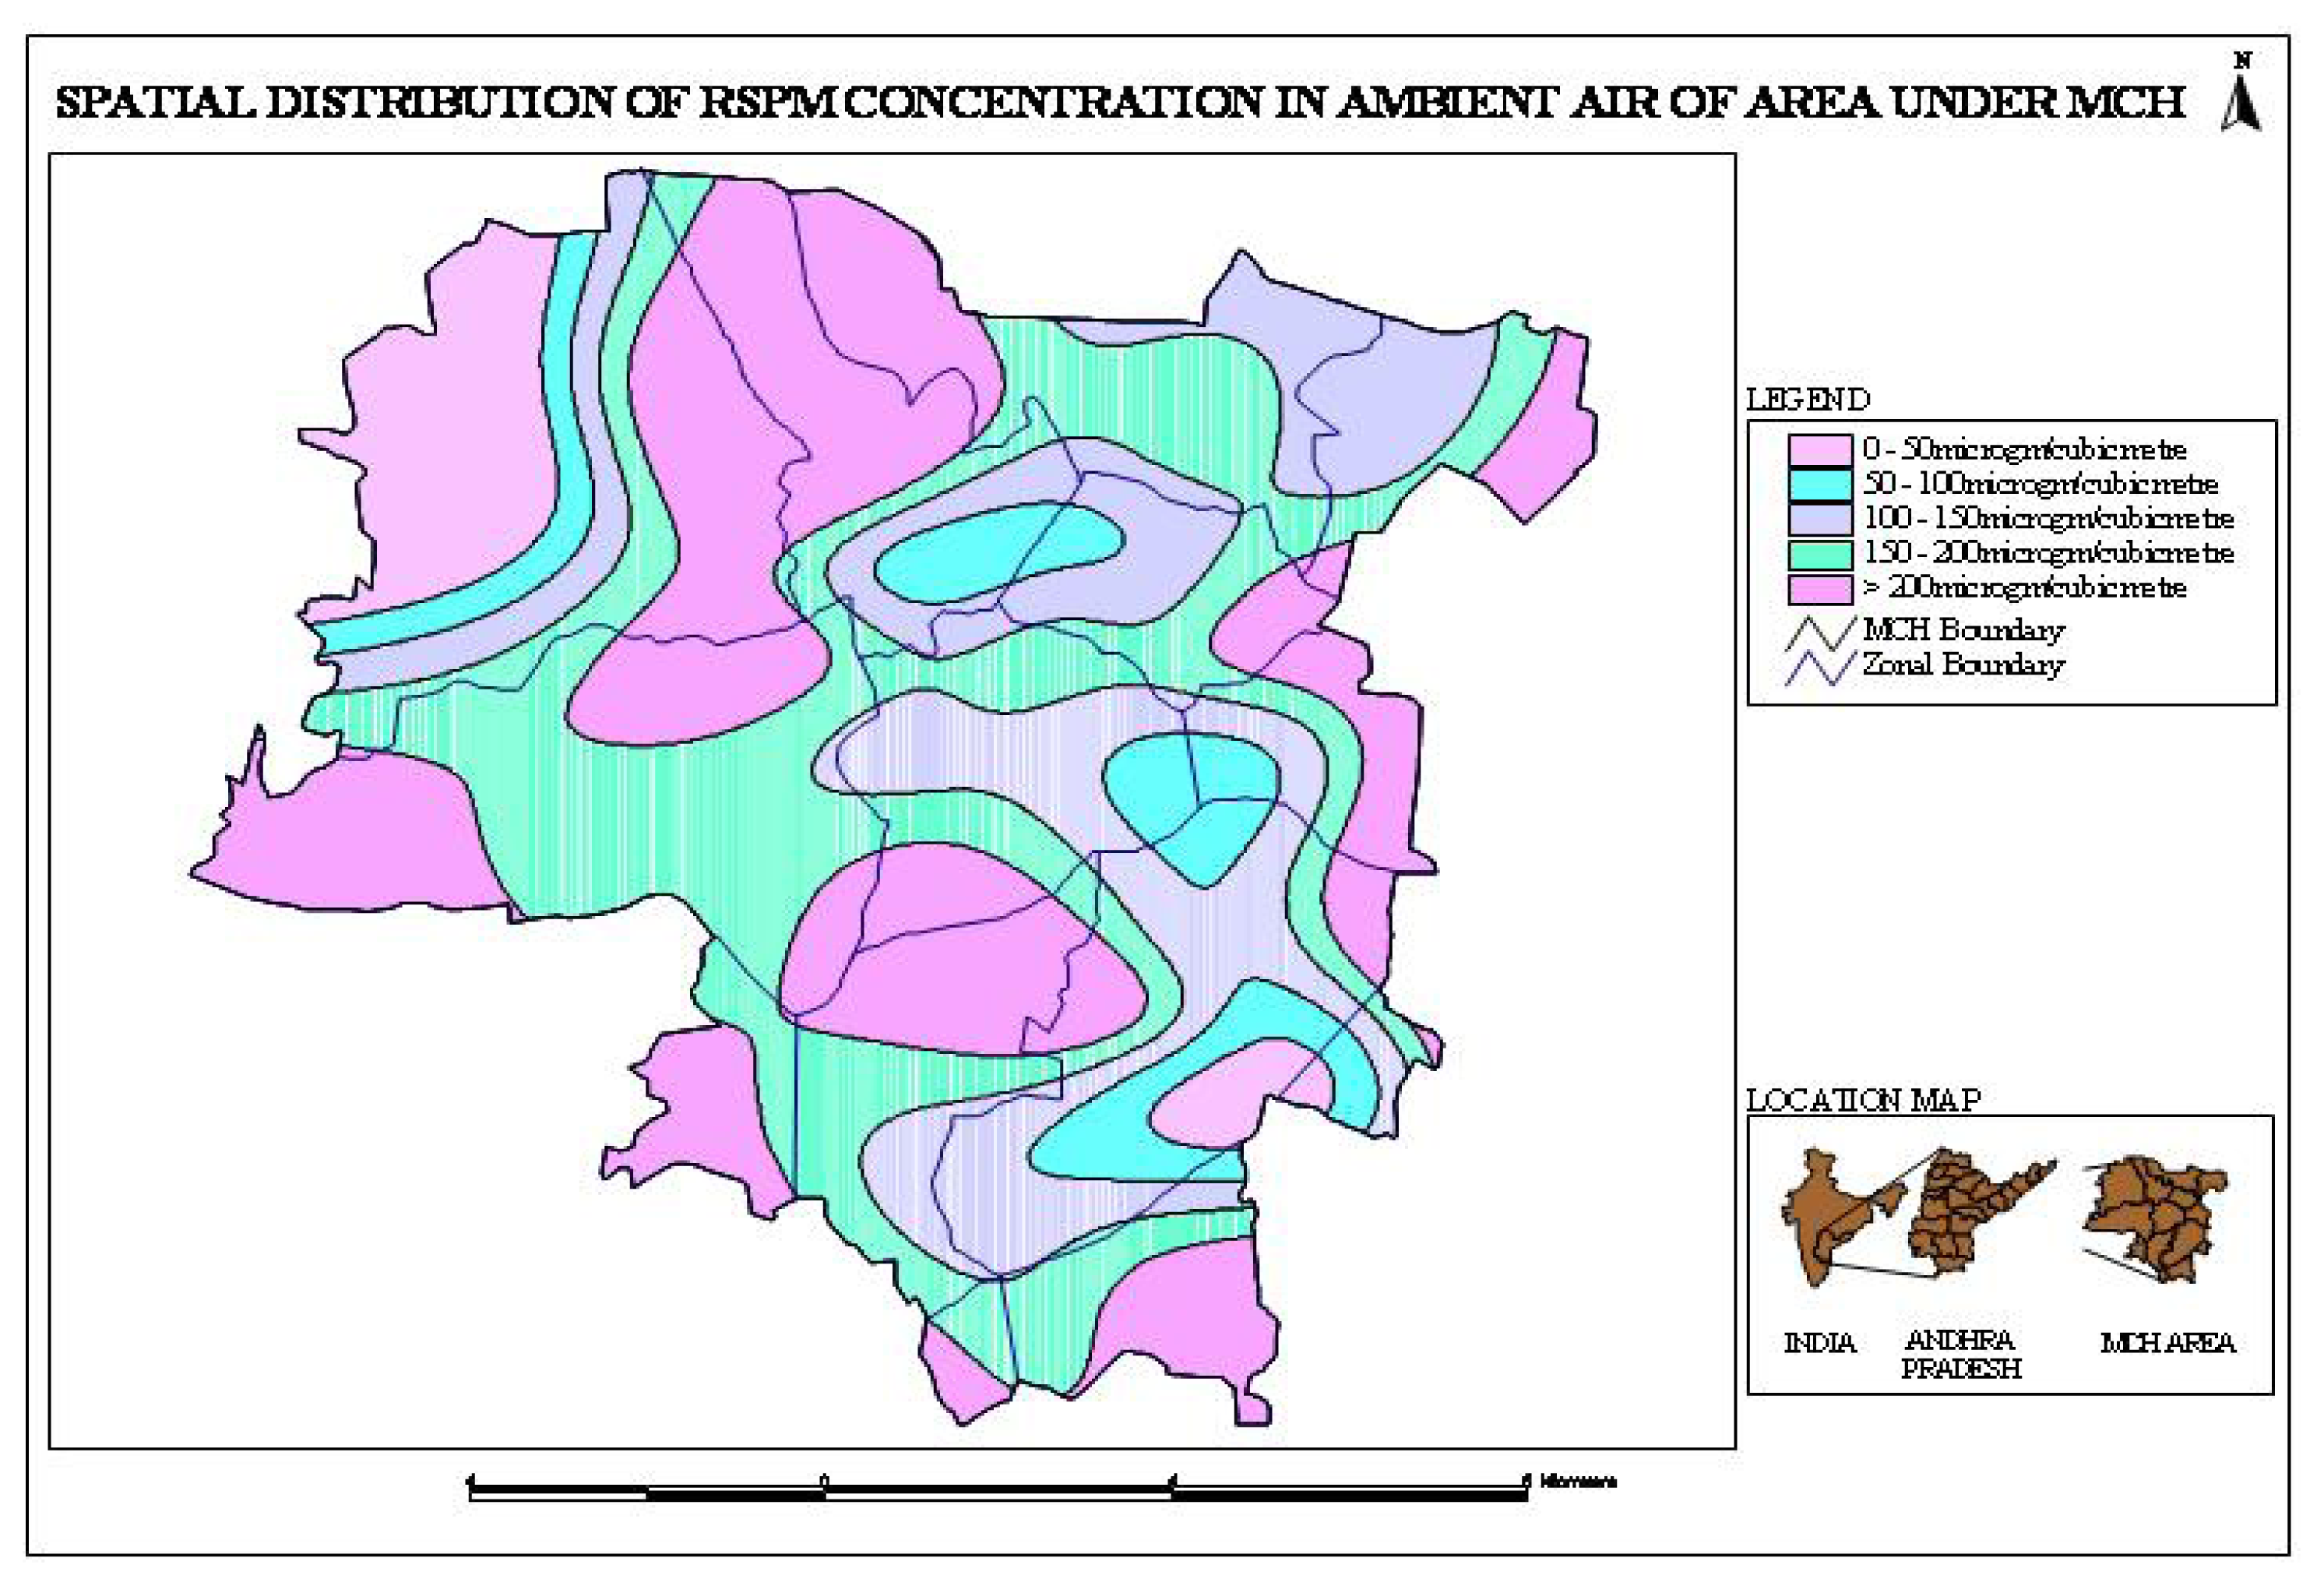
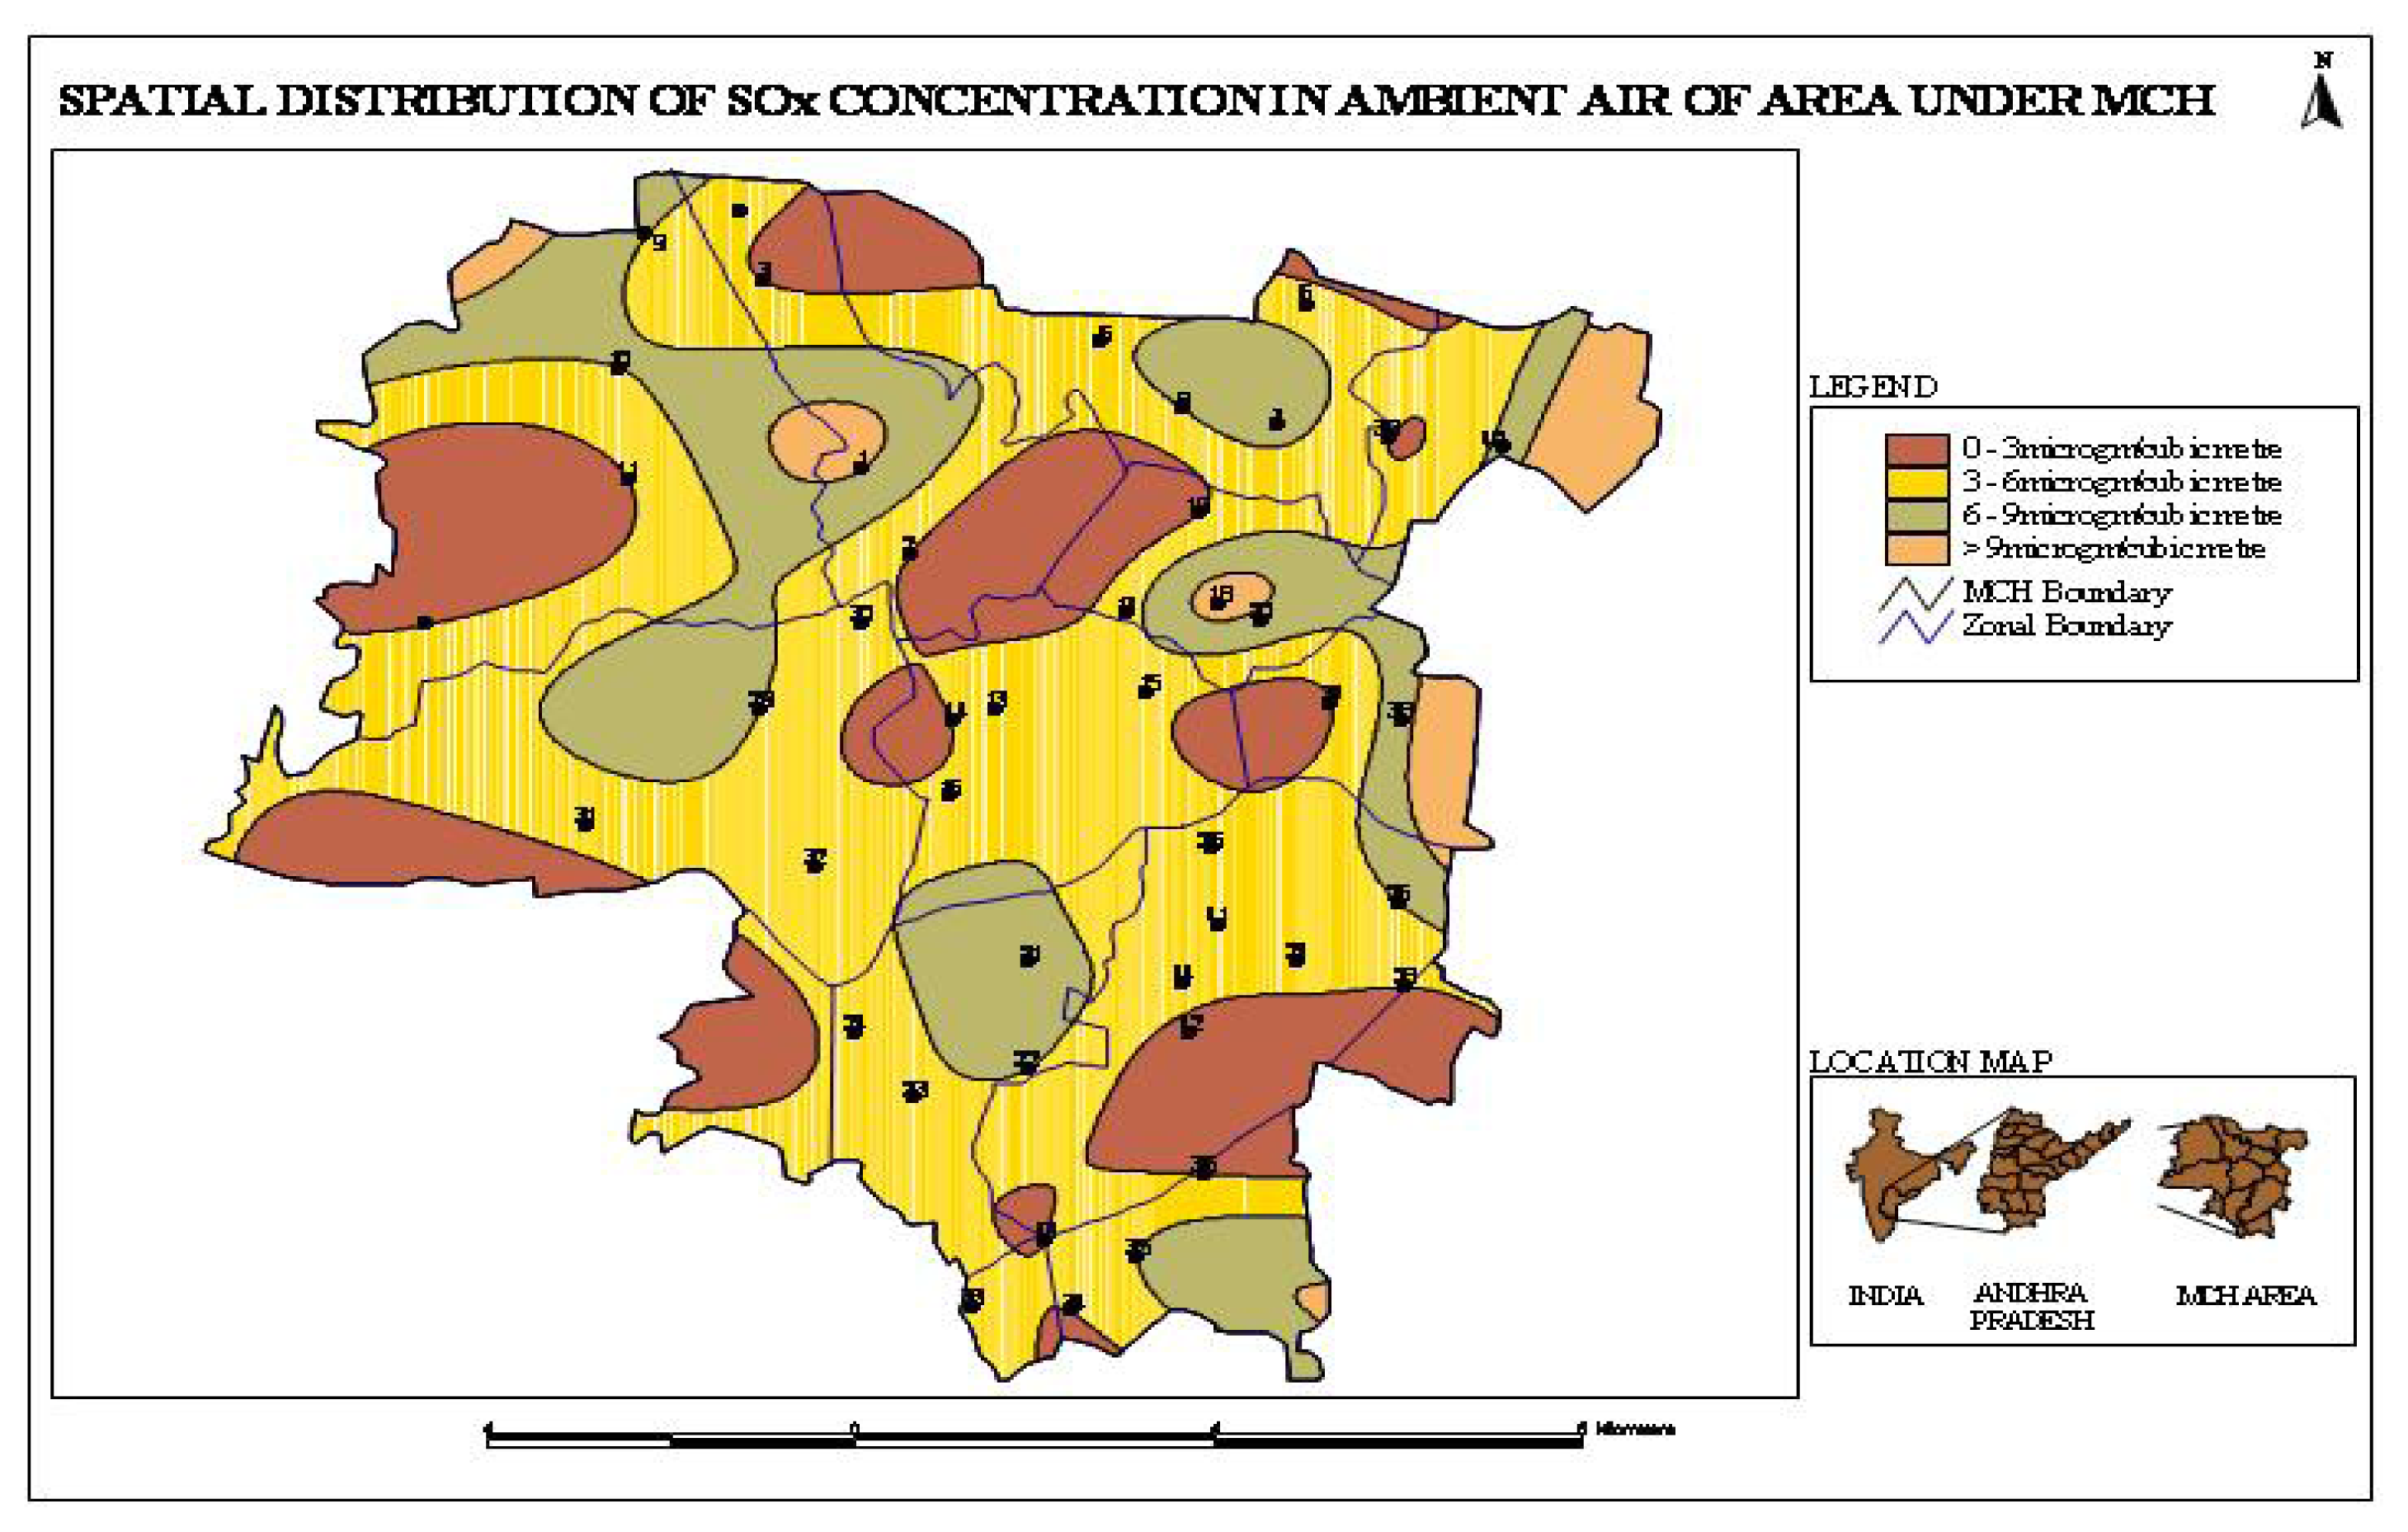
Generally, the spatial variability of RSPM, suspended particulate matter (SPM) and total suspended particulate matter (TSPM) within the Hyderabad air shed was rather limited. With the exception of SO
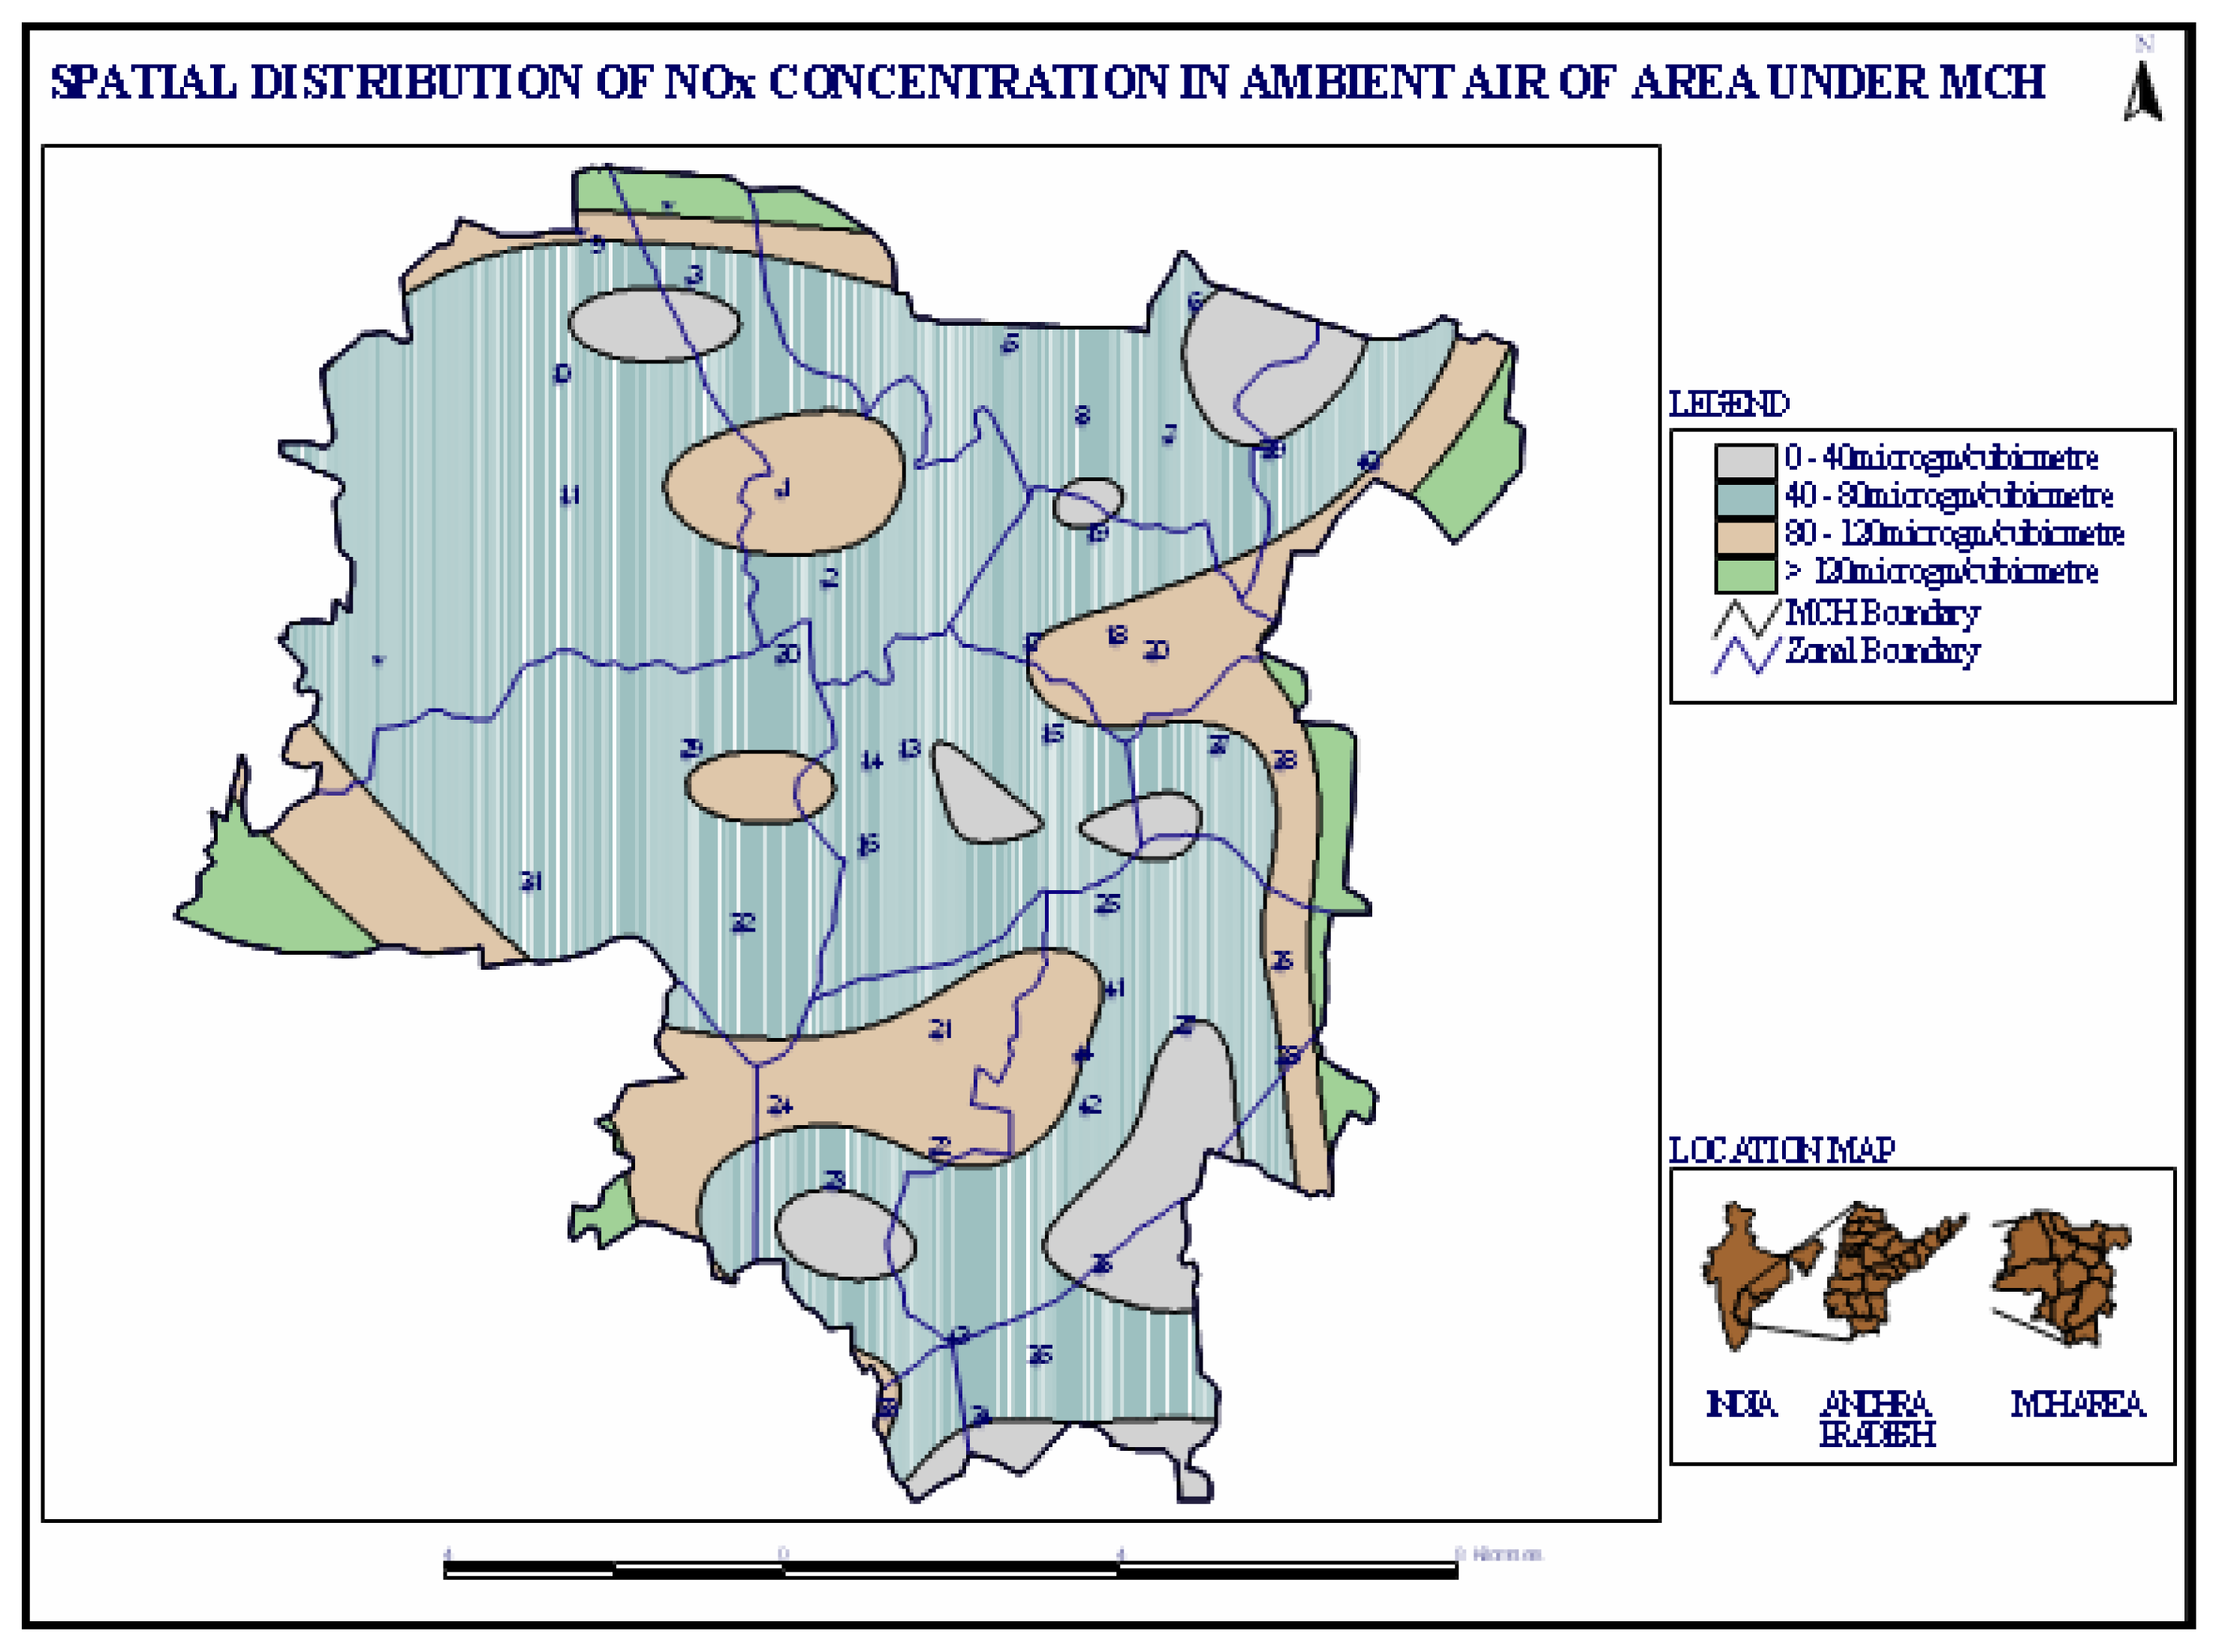
2, all the pollutants measured exceeded the ambient air quality standards. Differences in daily air pollution levels between different areas in Hyderabad were strongly influenced by the type of the land use pattern and the number of motor vehicles. Interpolation studies were carried out using Kriging to study the spatial variability of the air pollution.
Figures 3–
5 show the interpolation results of the analyses. The average deviation between observed and predicted samples was 25% for delete NO
X and 10% for SPM. The discussion presented below assumes the same relative variability
Design of Multi-Objective Air Quality Monitoring Network
A variety of possible data inputs are considered in selecting the current and future air pollution monitoring network sites for identifying and characterizing risk assessment. The criteria used to evaluate potential locations for air monitoring sites in the present study included isopleth or contour maps of pollution using an inverse distance weighing method [
11,
12], population density maps, potential sensitive locations and source locations. The following suggested guidelines were used for selecting the number and locations of the sampling sites.
The area should be the zone of highest pollution concentration within the region; one or more stations are to be located in the area.
Close attention should be given to densely populated areas within the region, especially when they are in the vicinity of heavy pollution concentration levels.
The quality of air entering the region is to be assessed by stations situated on the periphery of the region; meteorological factors (e.g., frequencies of wind directions) are of primary importance in locating these stations.
Sampling should be undertaken in areas of projected growth to determine the effects of future development on the environment.
Sites should be near hospitals and educational institutions.
The overall placement of sampling stations should also consider the previously operated air pollution monitoring station in the study area.
For the city of Hyderabad and the surroundings, an area of investigation of 20km × 20km was studied. Data pertaining to location of hospitals, government offices, educational institutions, business centers, road networks, hotels, cinema theaters, etc were collected using GPS. This was done initially by superimposing a grid over a map of the area of interest. The intersections of the grid lines over variable areas ranging from 100 m to 20 km depending upon the scale of measurement were used as potential areas for the selection of air pollution monitoring sites. The next step was evaluation of criteria on which the optimal configuration of the air pollution monitoring stations would be assessed and established. Once a suitable part of the city in which the air quality needs to be monitored has been identified, certain local factors need to be taken into account in selecting the precise location for the monitoring station. The intention is to select a site that is broadly representative of the quality of the air experienced by people in that part of the city during their normal lives. In other words, the sampling site should not represent a “special case.” In order to meet the overall requirements for urban centre or background sites, the following criteria should be employed as much as possible:
The site should be located where a significant number of people spend their time.
It should be in as open a setting as possible in relation to surrounding buildings.
Immediately above should be open to the sky, with no overhanging trees or buildings.
The sample intake should be no higher than 10m above local ground level and ideally less than 5m.
There should be no major sources of pollution within 50m, e.g. a large multi-storage car park.
There should be no medium sized sources within 20m e.g., petrol stations, ventilation outlets to catering establishments, etc.
Cars/vans/lorries should not be expected to stop with their engines idling within 5 m of the sample inlet.
The site should not be within (a) 30m of a very busy road (>30,000 vehicles/day), (b) 20m of a busy road (10,000–30,000 vehicles/day.
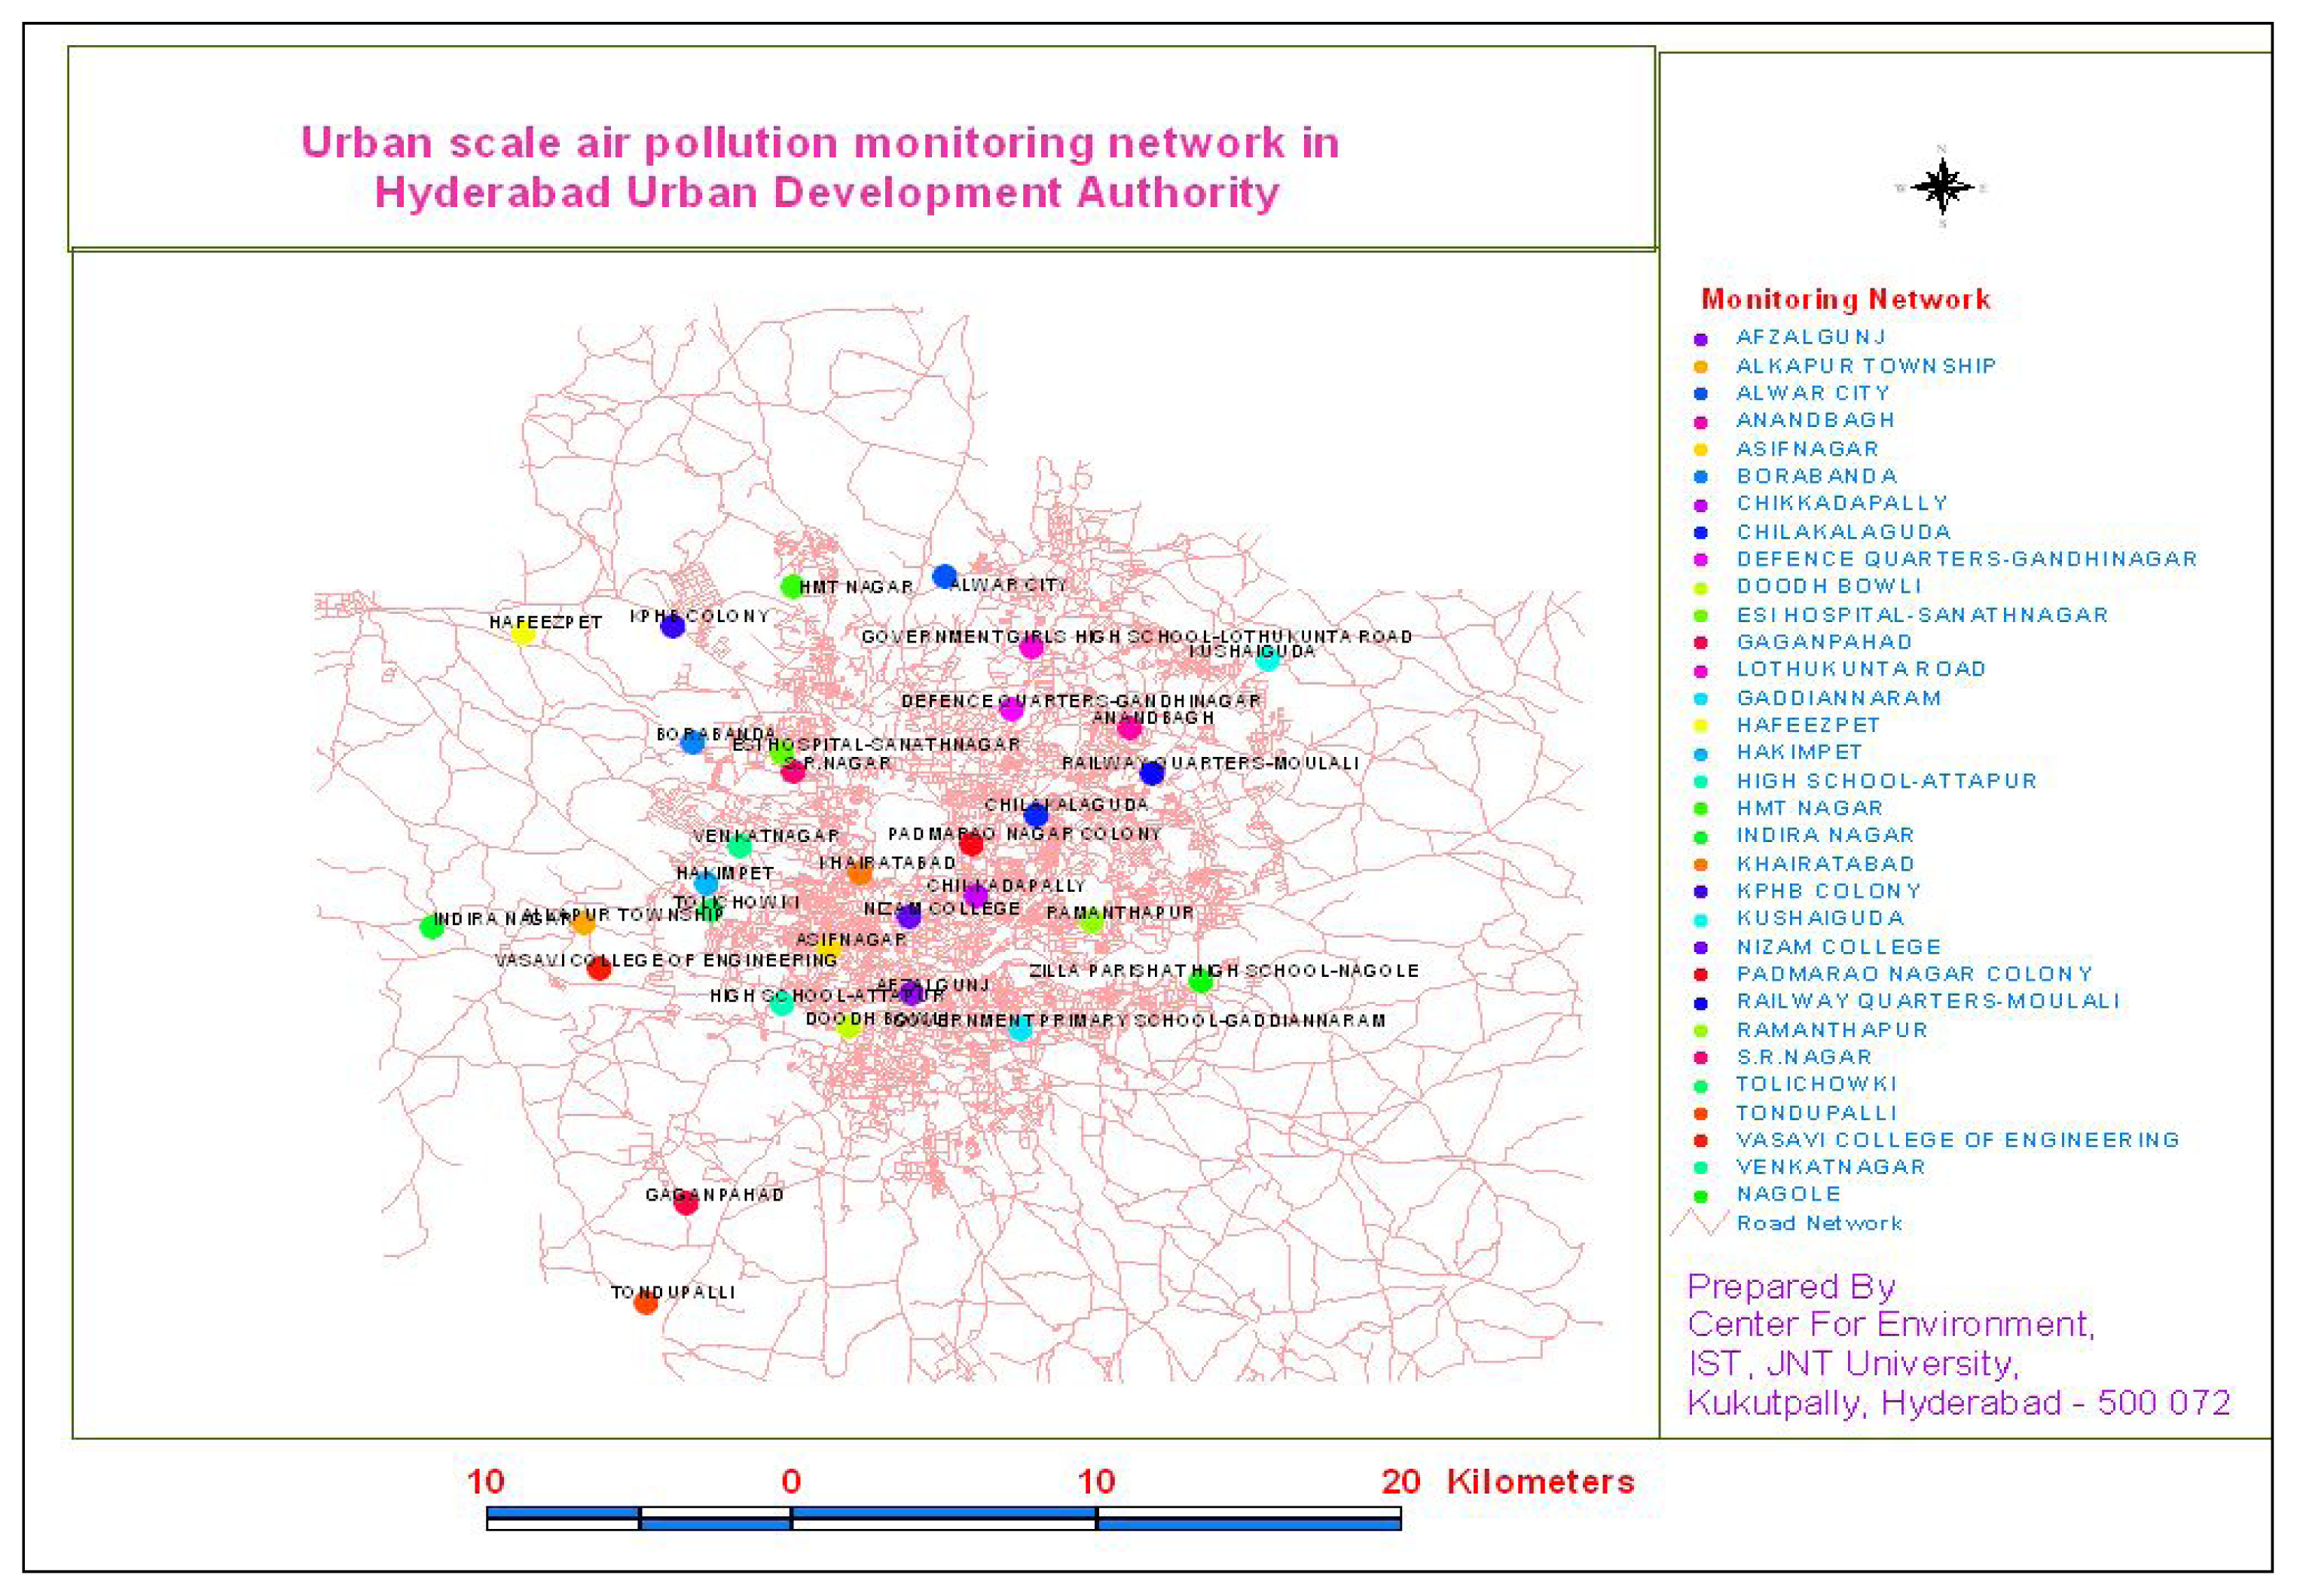
Figure 6 shows the various sites selected for carrying out risk assessment studies in Hyderabad.
Development of Online Air Pollution Monitoring Site for Total Health Risk Assessment
A schematic diagram of the different modules and the data flow chart of the online air pollution monitoring system for studying health risk assessment are shown in
Figure 1. The system encompasses:
Online monitoring system.
Meteorological monitoring system.
Statistical and numerical models for transport and dispersion studies.
Risk assessment study module.
The monitoring system consists of electrochemical sensors for air pollutants including sulphur dioxide, oxides of nitrogen, carbon monoxide, hydrocarbons, ozone, mercaptans and hydrogen sulphide [
13]. Electrochemical sensors are used as they have many advantages. They consume very little low power, respond quickly to gas concentration changes, and are not affected by humidity. Also, the sensors are only exposed to gas at selected sampling intervals, which maximizes the sensor life.
Particulate matter is measured using a tapered element oscillating microbalance (TEOM) particulate matter analyzer. At the heart of the device is the tapered element oscillating microbalance. This microbalance-based analyzer has the USEPA equivalency designation for PM-10 as EQPM-1090-079, and is used extensively by the USEPA and U.S. state air monitoring organizations for continuous PM-2.5 monitoring as a correlated acceptable continuous monitor.
The data acquisition system consists of hardware (computer, monitor and printer) and provides reports, data storage and screen displays. The software is multitasking, allowing several programmes to run simultaneously. A single completely standalone web enabled system is used capable of handling both weather and air pollution data. The acquisition system requires extremely low power operation. The system runs on a 12V battery or solar panel. The on-board memory of the data logger is 16MB and is expandable to 128MB.B
The data from the sensors are fed to a data logger, which in turn transmits the data to the central monitoring station. The measurements are automatically transferred from the monitoring station to a central database for quality control. After appropriate data verification functions, using “Internet protocol” technology, the pollution data are transmitted to the web (
www.appcb.org/pcb/online.htm).
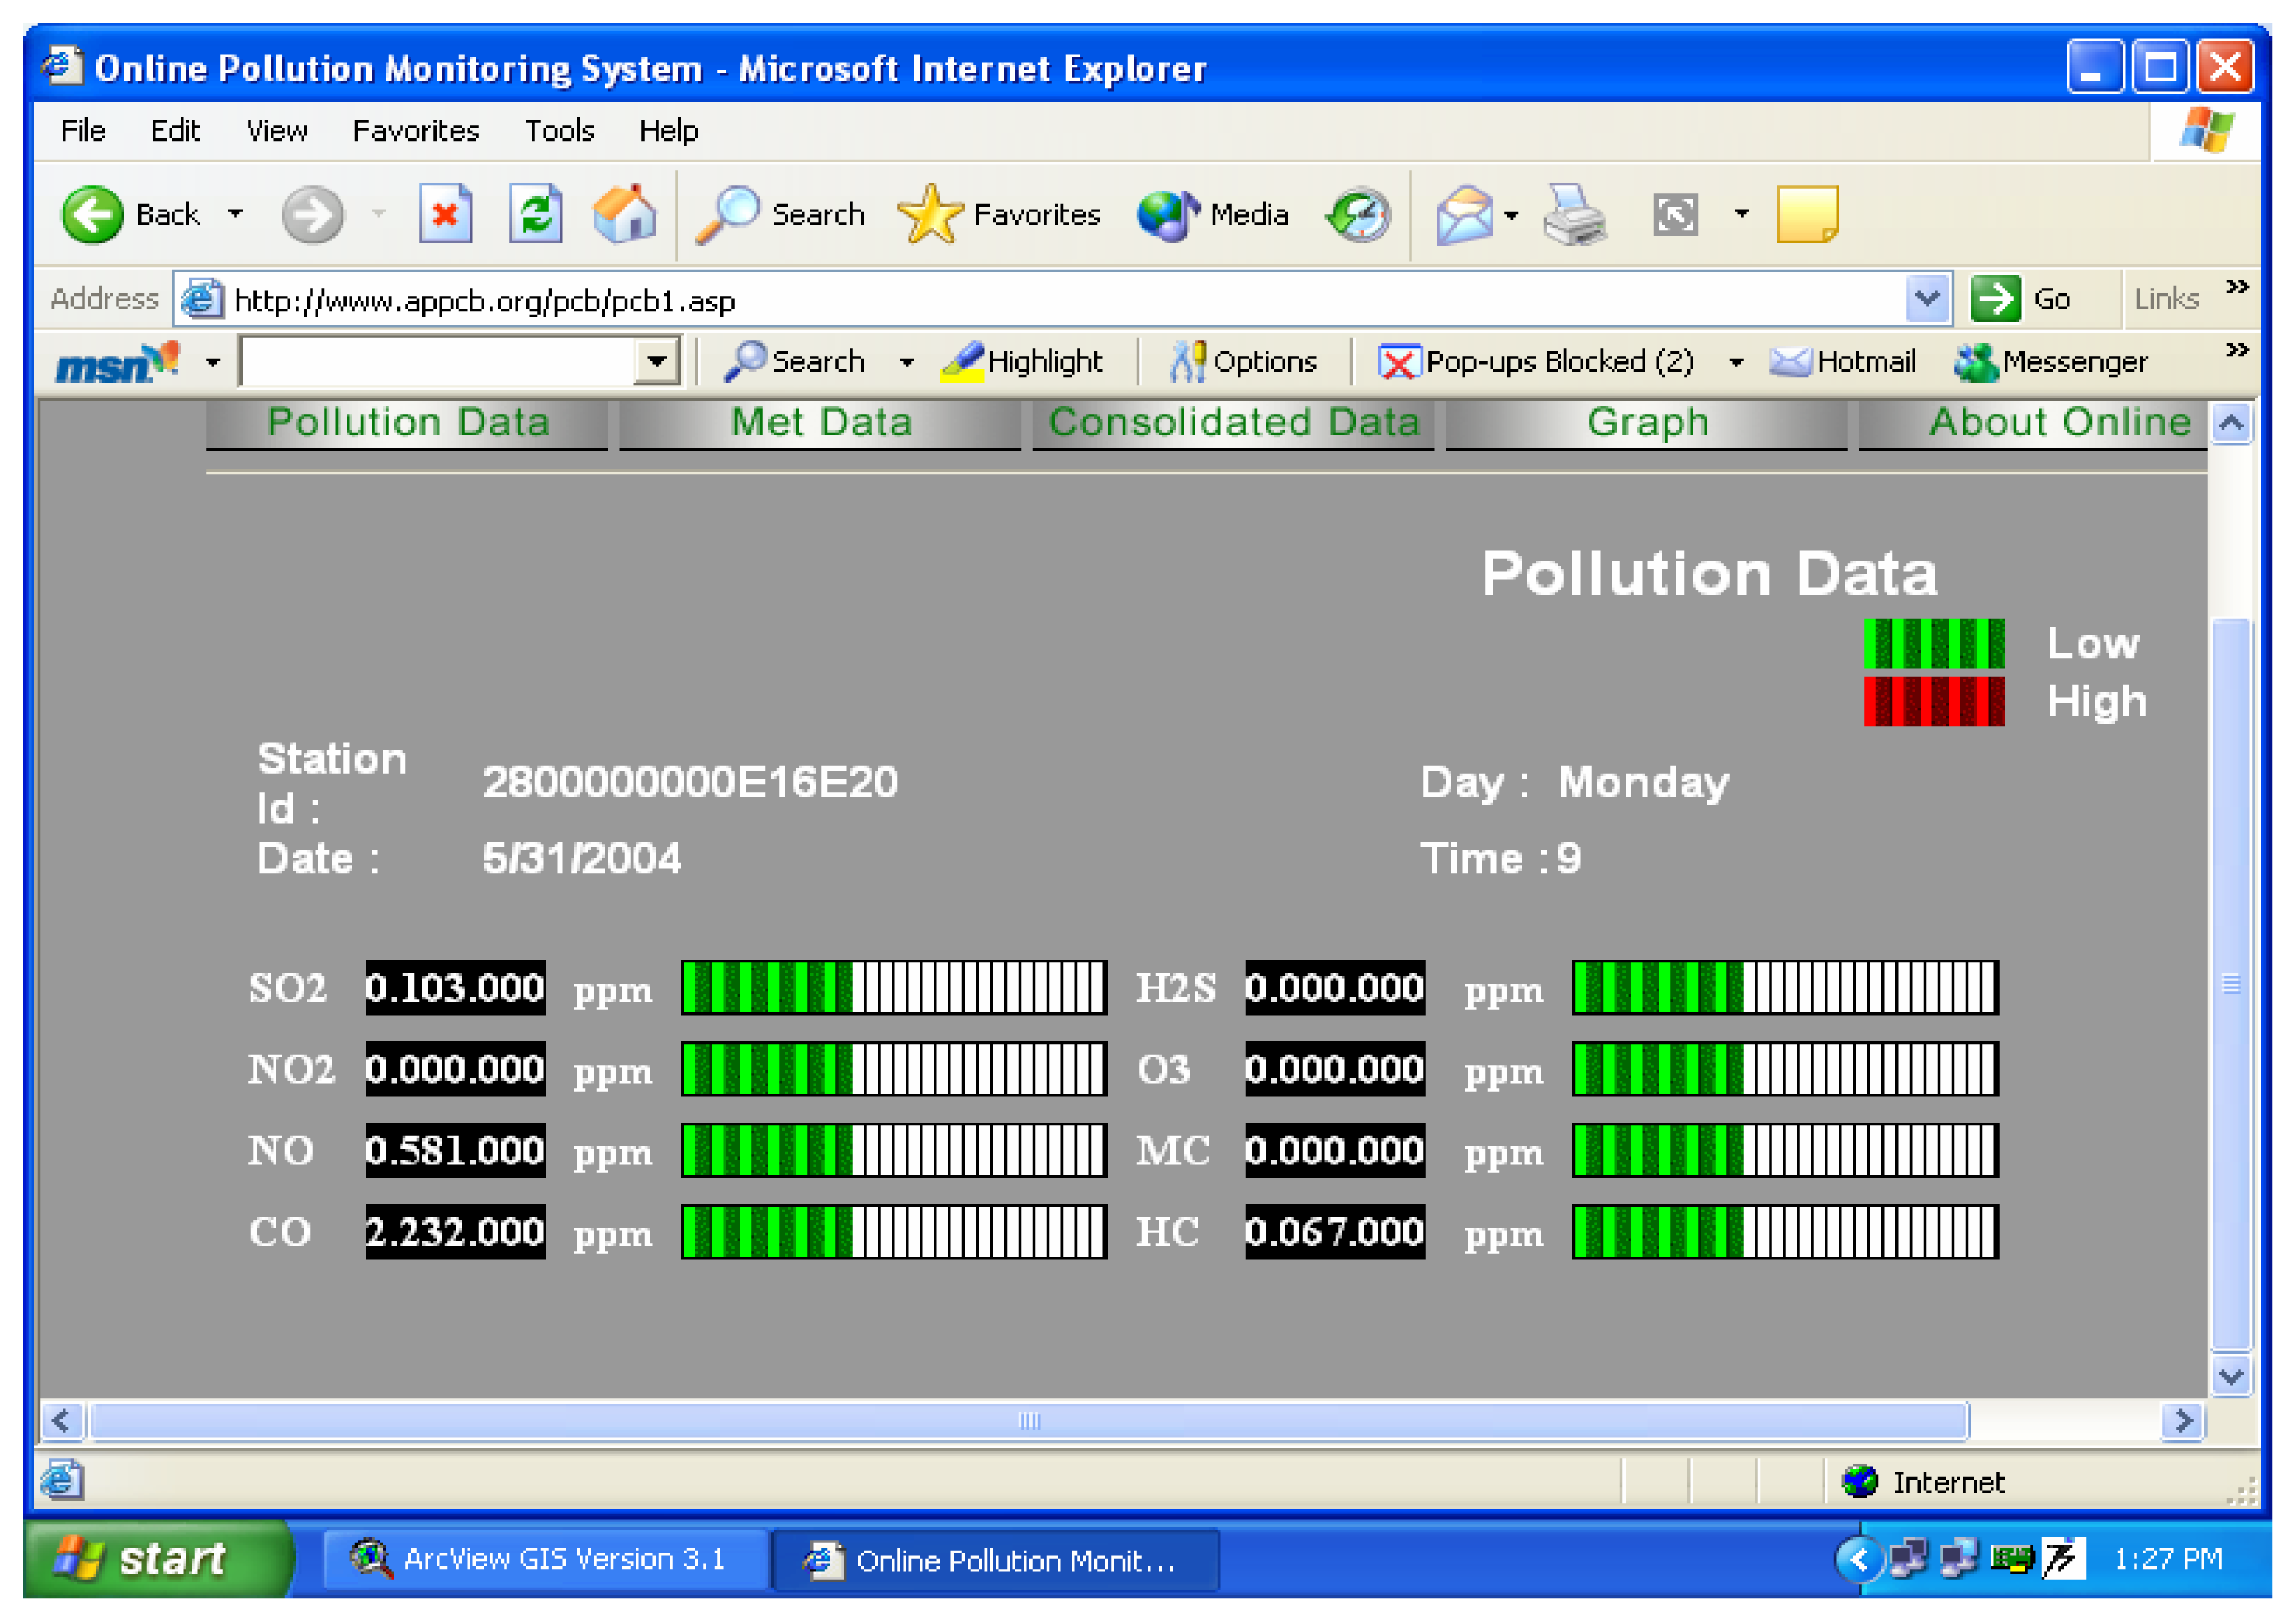
Figure 7 shows the components of the online monitoring station data presentation at Hyderabad.
Because the early time series studies have been criticized for their inadequate control over weather variables, the weather monitoring system is included in the online air pollution and risk assessment monitoring system. To predict the concentration distribution and dispersion of pollutants at various receptor locations, meteorological parameters such as temperature, pressure, humidity, wind direction and wind speed measurement are included. The risk assessment module is also being developed based on the statistical data generated and the general pollution profile studies at various receptor locations at the sample site in Hyderabad.
Temporal Variation of Air Pollution and Total Health Risk Assessment in Hyderabad
Figure 8 shows the location of the online pollution monitoring system and the location of various residential units in Hyderabad. The basic principle used is to combine predefined cumulative time series concentration levels and different hours of data for persons present at the same location to predict concentrations [
14]. The address point is used as the exposure indicator and air pollution levels are calculated for each house number and all people living or working at the address.
Motorized traffic emissions result in small-scale spatial variations (high concentrations at short distances from major roads) and affect urban and regional background air pollution concentrations. The small-scale spatial variations in air pollution concentrations were quantified by calculating proximity to major roads. The concentration data for the pollutants carbon monoxide, particulate matter and nitrogen dioxide are studied, as indicators of traffic-related air pollution. Exposure to traffic-related air pollution has been characterized by estimating long-term average ambient air pollution concentrations at different home addresses around the Punjagutta area.
The addresses were geo-coded using a Geographic Information System. Long-term average exposure to outdoor air pollution was calculated as a function of the regional background pollution, pollution from urban sources (urban background), and pollution from local sources (nearby streets). Exposure for every pollutant was evaluated by comparing the background concentrations with the indicator variable dwelling in the unit area.
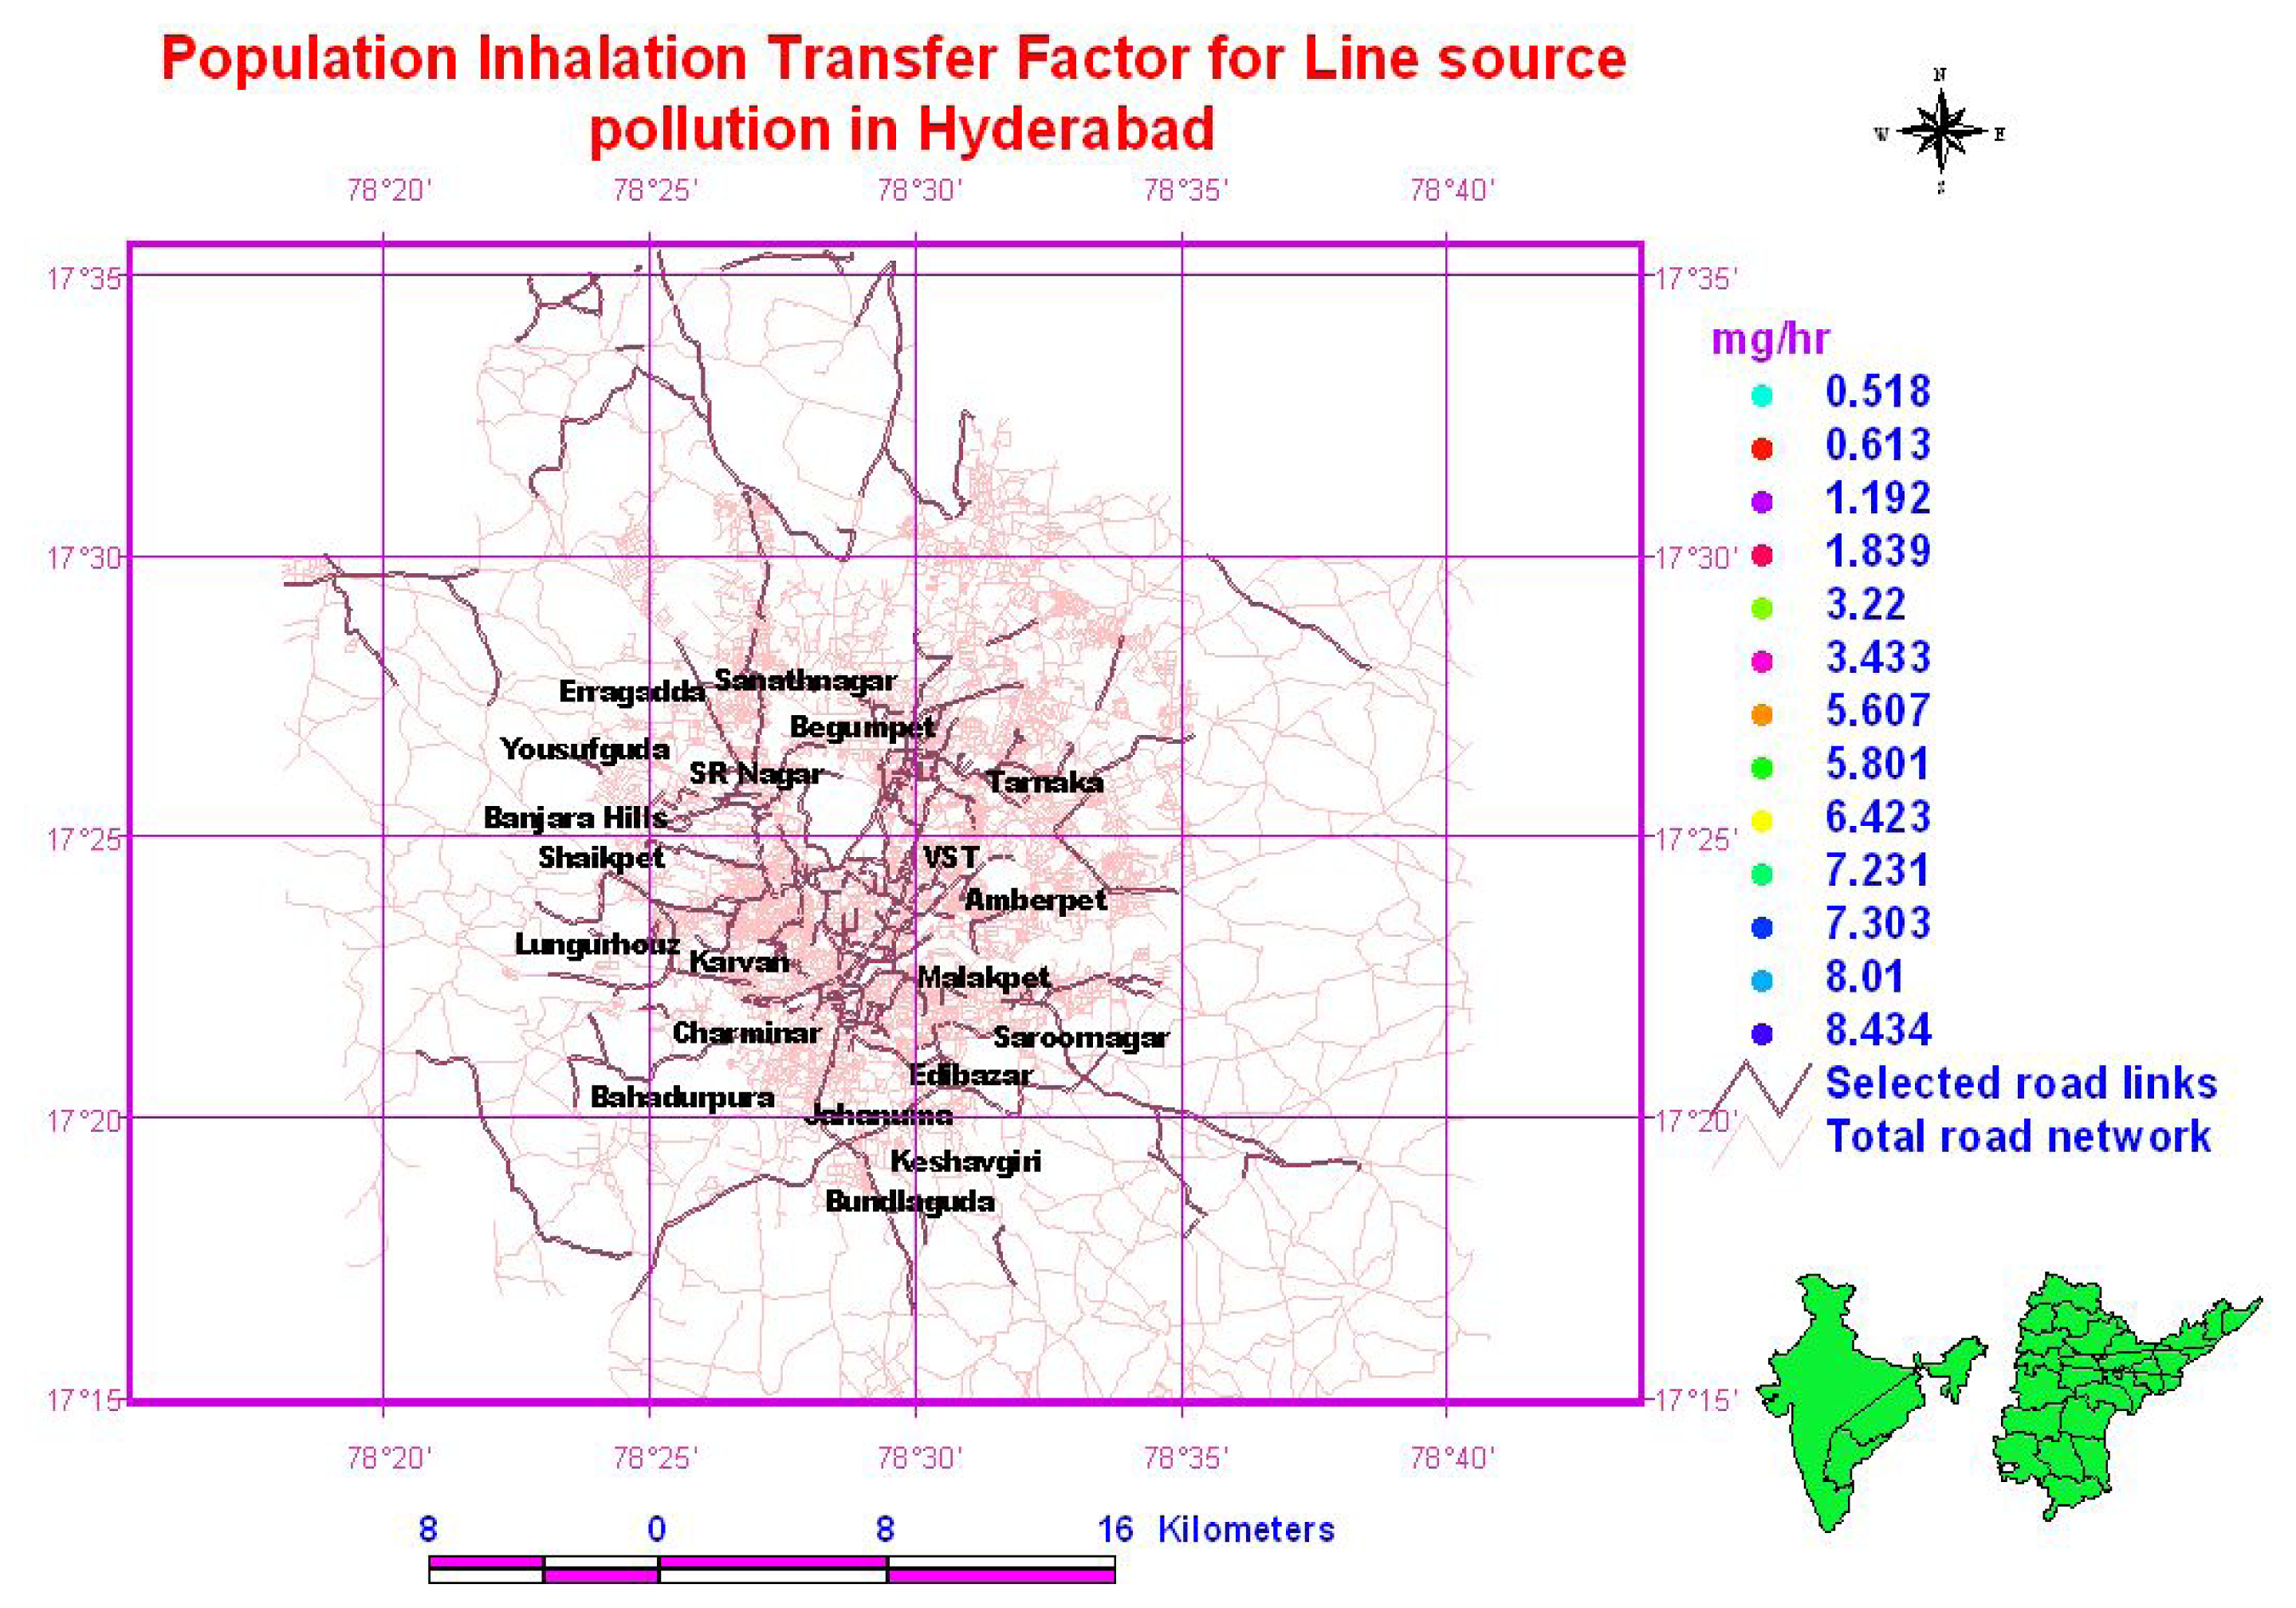
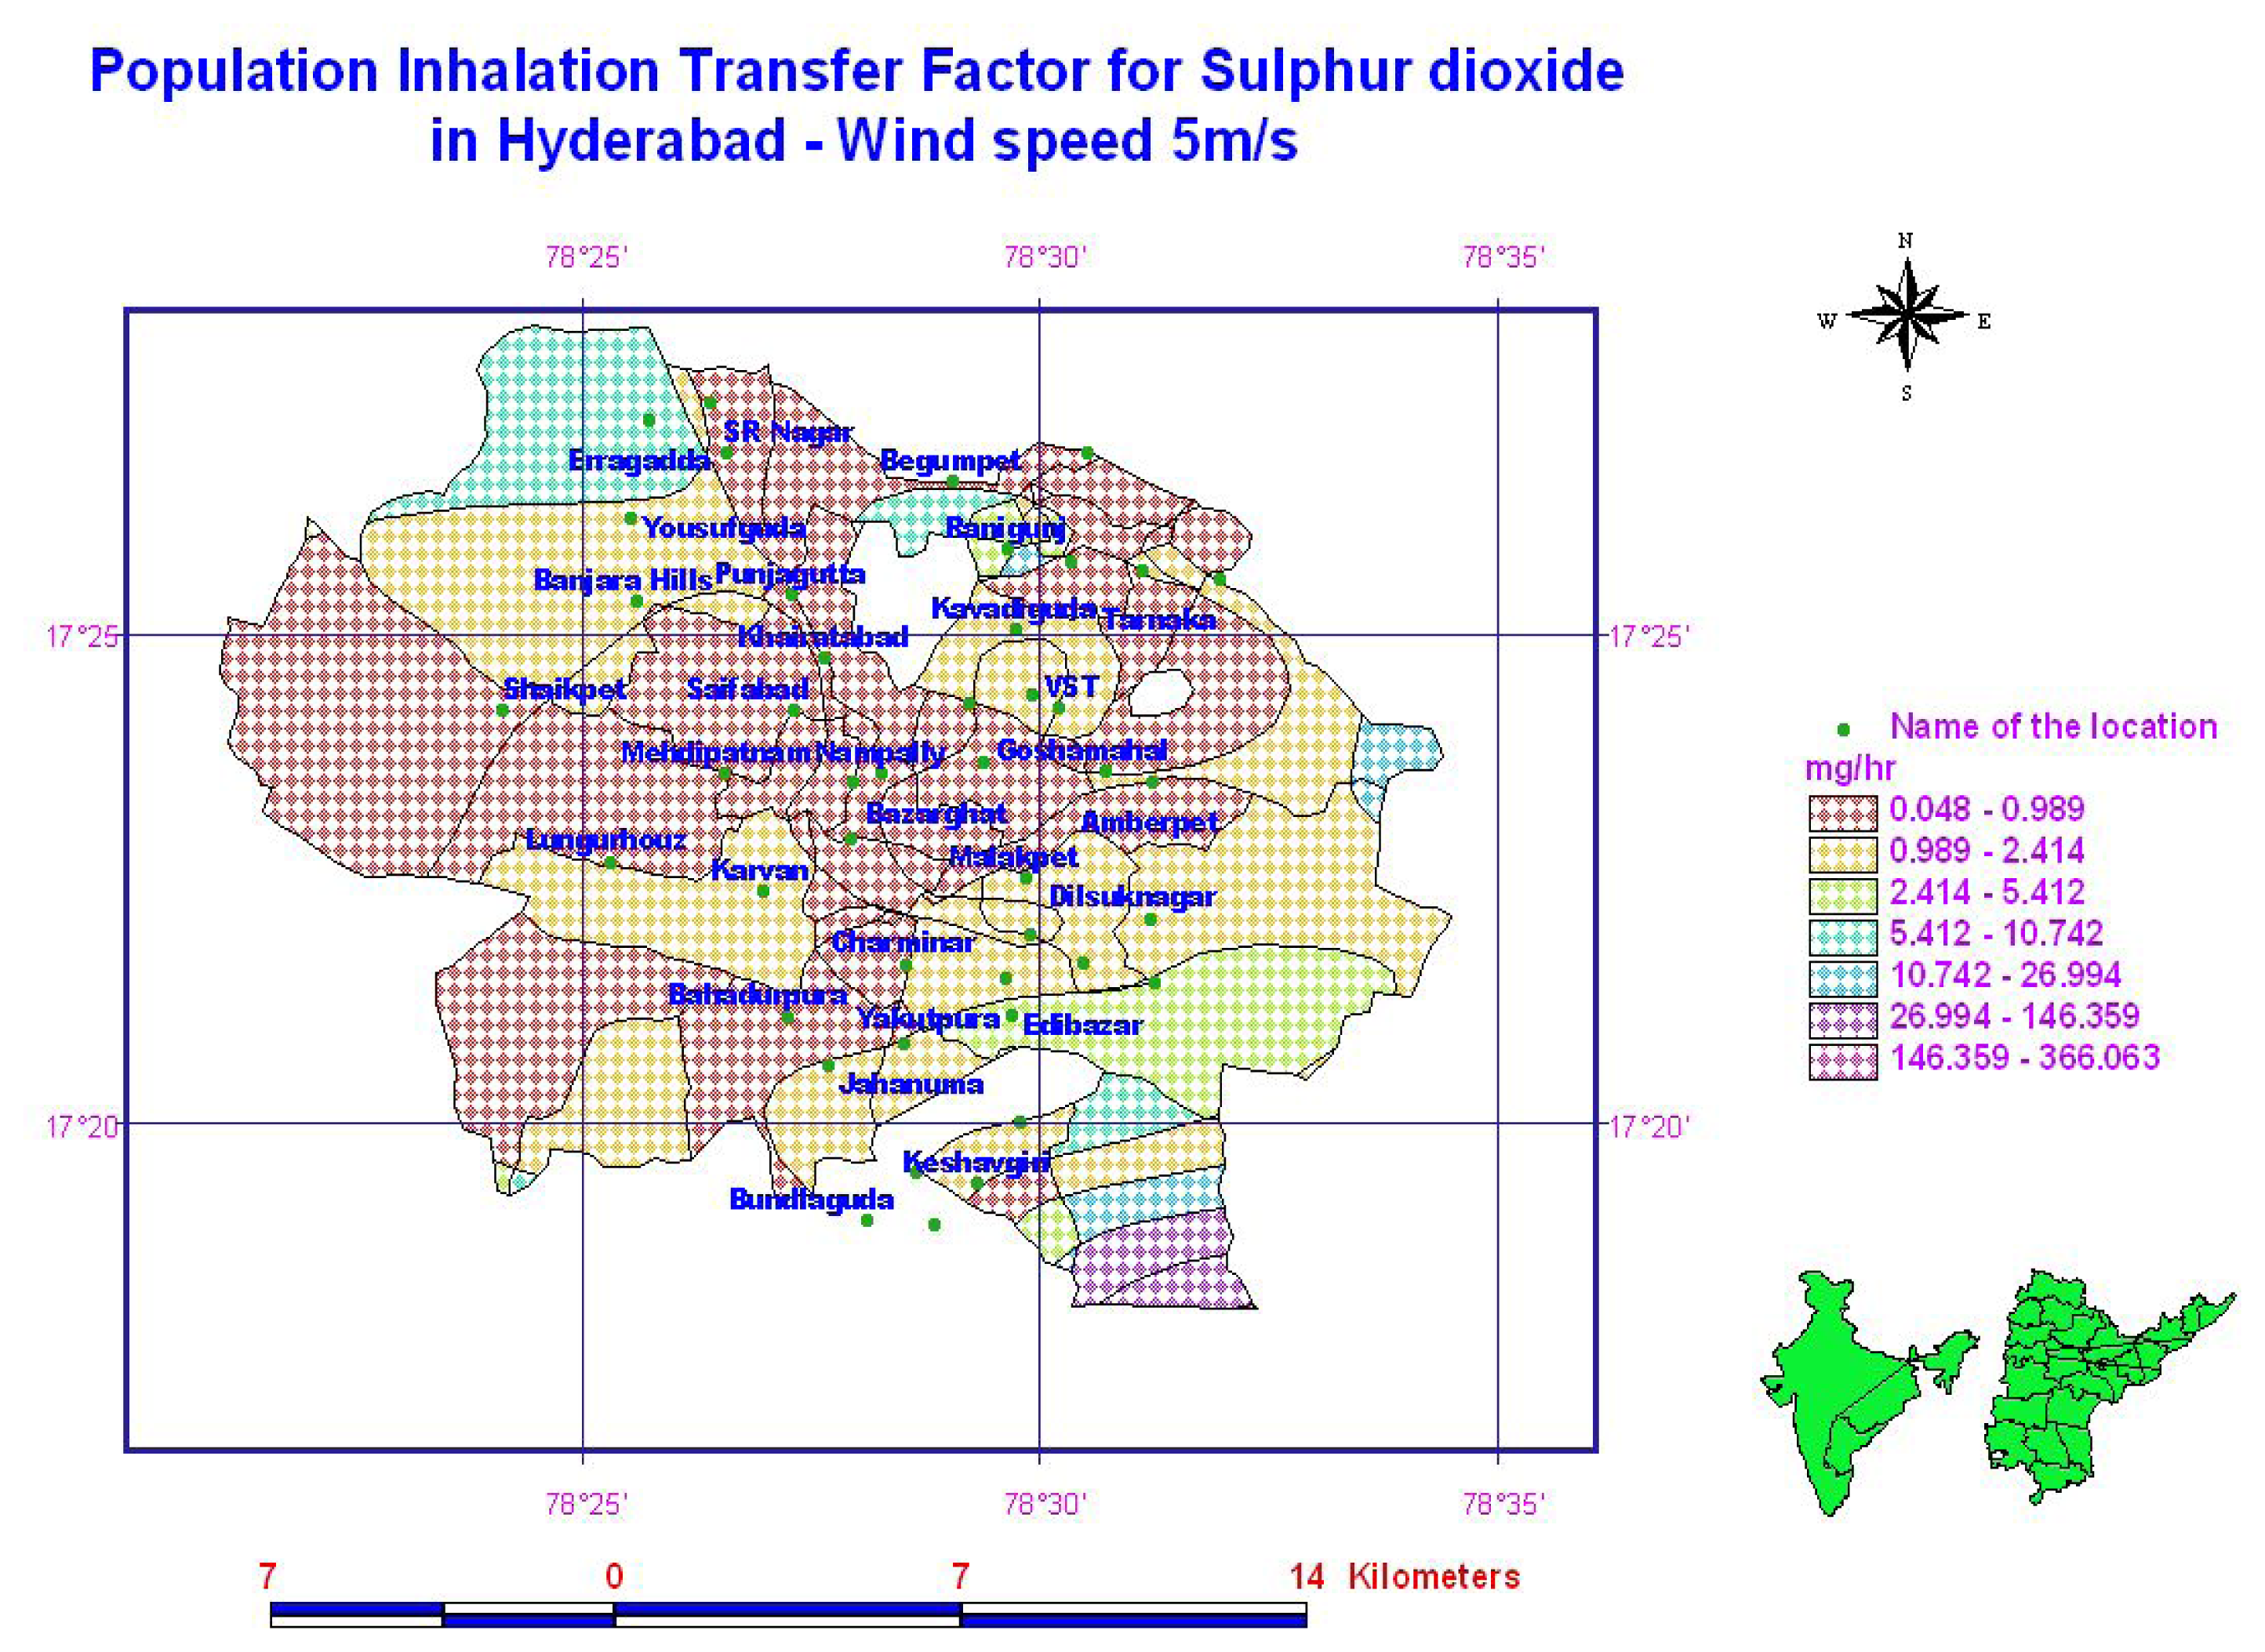
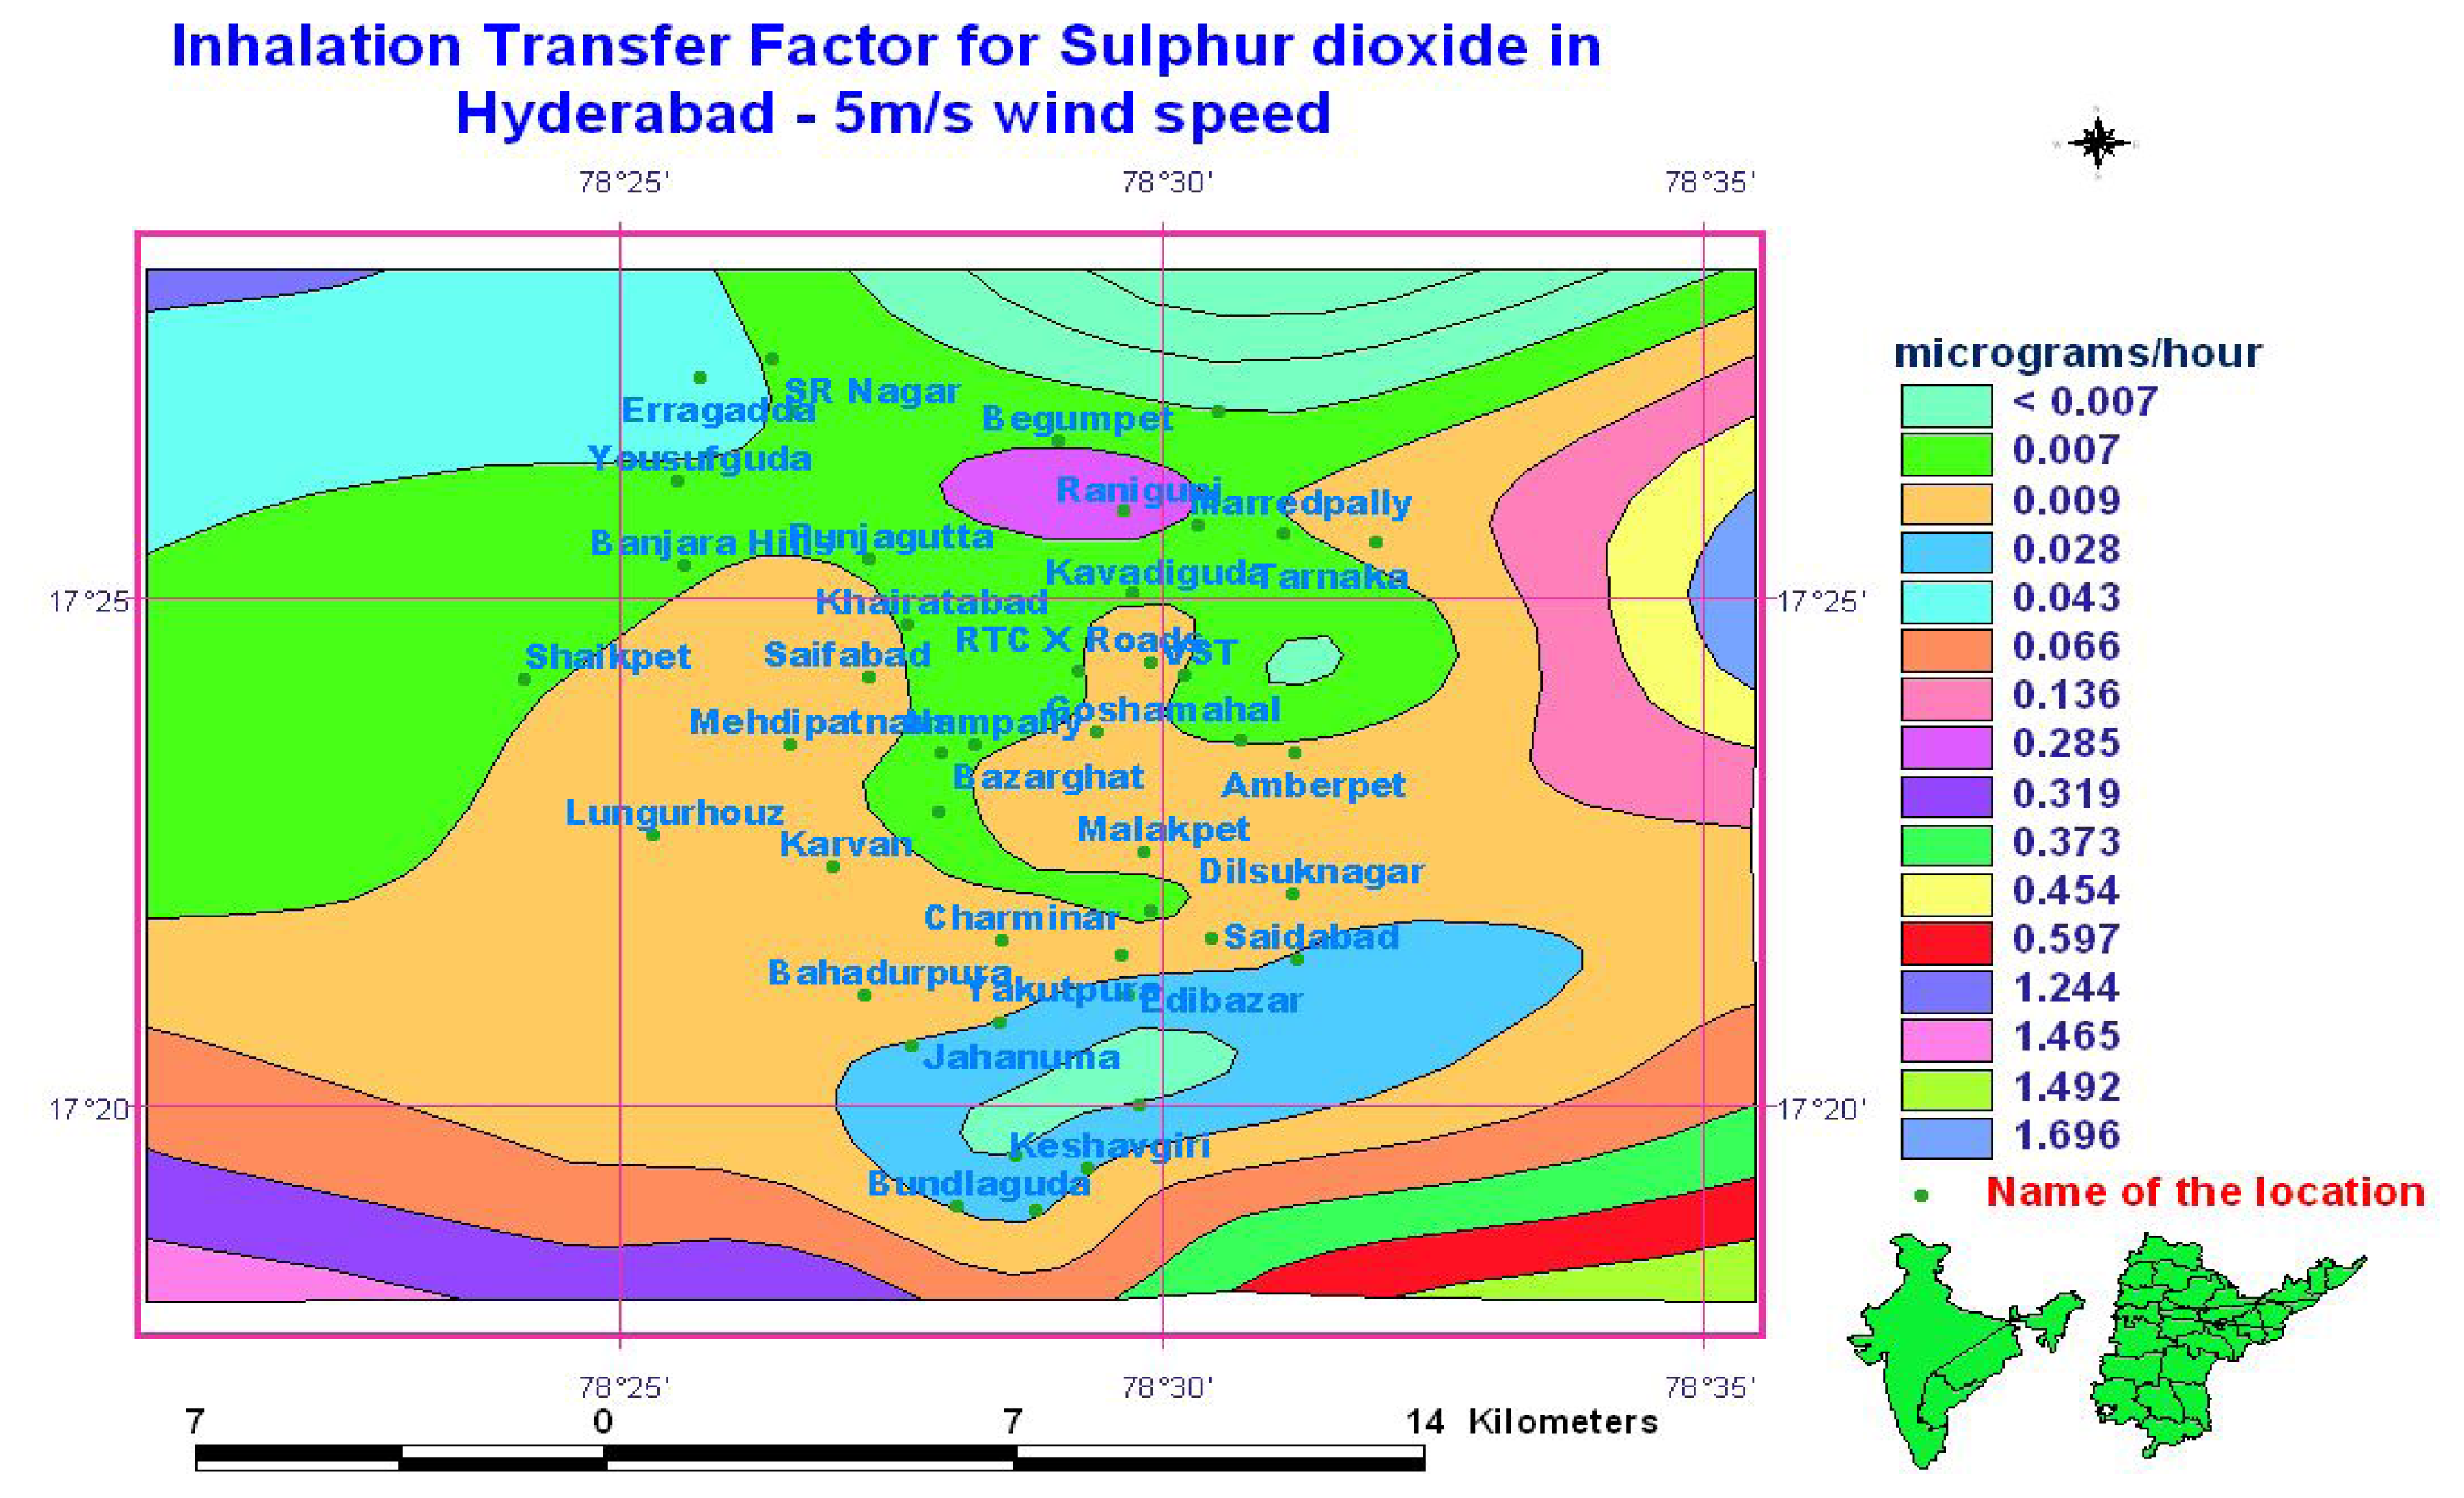
Figures 9–
15 shows the ITFs and PITFs inhalation transfer factors and Population inhalation factors for ambient and line source pollution in Hyderabad assuming a uniform wind speed of 5m/s and a population breathing rate of 0.78m
3/hr with a mixing height of 300m. The mean inhalation mass transfer factors observed are 0.4, 5.4, and 7.8 micrograms/hr for sulphur dioxide; oxides of nitrogen and RSPM, respectively. The population inhalation of RSPM is highest for the city average of 4.46 gm/hr.
The number for persons with respiratory and lung infections observed in Hyderabad over the study period are shown in
Figure 16. The number of pollution related diseases in different seasons shown clearly reveals the preliminary significance of pollution on health ailments in Hyderabad.
Conclusions
For the model studies, a number of potential monitoring sites were screened for general and site-specific criteria in a GIS environment that may, on a local basis, affect the representativeness of the data collected. Local features that may affect either the chemical or meteorological parameters are evaluated to assure a minimum of interference.
For monitoring air pollution, an online and real-time monitoring system has been designed using advanced electrochemical sensor systems (sulphur dioxide, oxides of nitrogen, carbon monoxide, hydrocarbons, ozone, mercaptans and hydrogen sulphide) and a particulate matter analyzer (TSPM, PM2.5 and PM10). The sensor and data acquisition system are programmed to monitor pollution levels at every half-hour duration during peak hours and at 1-hour interval during normal hours.
Preliminary statistical analyses carried out using ITF and PITFs have revealed the approximate amounts of pollution inhaled by the city dwellers in Hyderabad. We conclude that particulate matter is a significant factor in the development and exacerbation of respiratory illnesses in Hyderabad. Further studies are required on inhalation factors specific to age groups under different climatic conditions and also epidemiological data of hospital admissions in Hyderabad. Presently, extensive statistical and numerical simulations are being carried out at our center to correlate those subjects with respiratory infections with air pollution levels. The results of these ongoing studies will be reported later.
