
Dynamic Threshold Effect of Directed Technical Change Suppress on Urban Carbon Footprint in China

Abstract
:1. Introduction
2. Literature Review
2.1. Carbon Emissions
2.2. Directed Technical Change
2.3. The Relationship between Directed Technical Change and Carbon Emissions
3. Models and Data
3.1. Models
3.1.1. STIRPAT Model
3.1.2. Dynamic Threshold Regression Model
3.2. Data
3.2.1. Variables
- ①
- Explained variable: carbon footprint
- ②
- Core explanatory variables: directed technical change
- ③
- Mediating variables
- ④
- Threshold variable
- ⑤
- Control variables
3.2.2. Data Source
4. Results Analysis
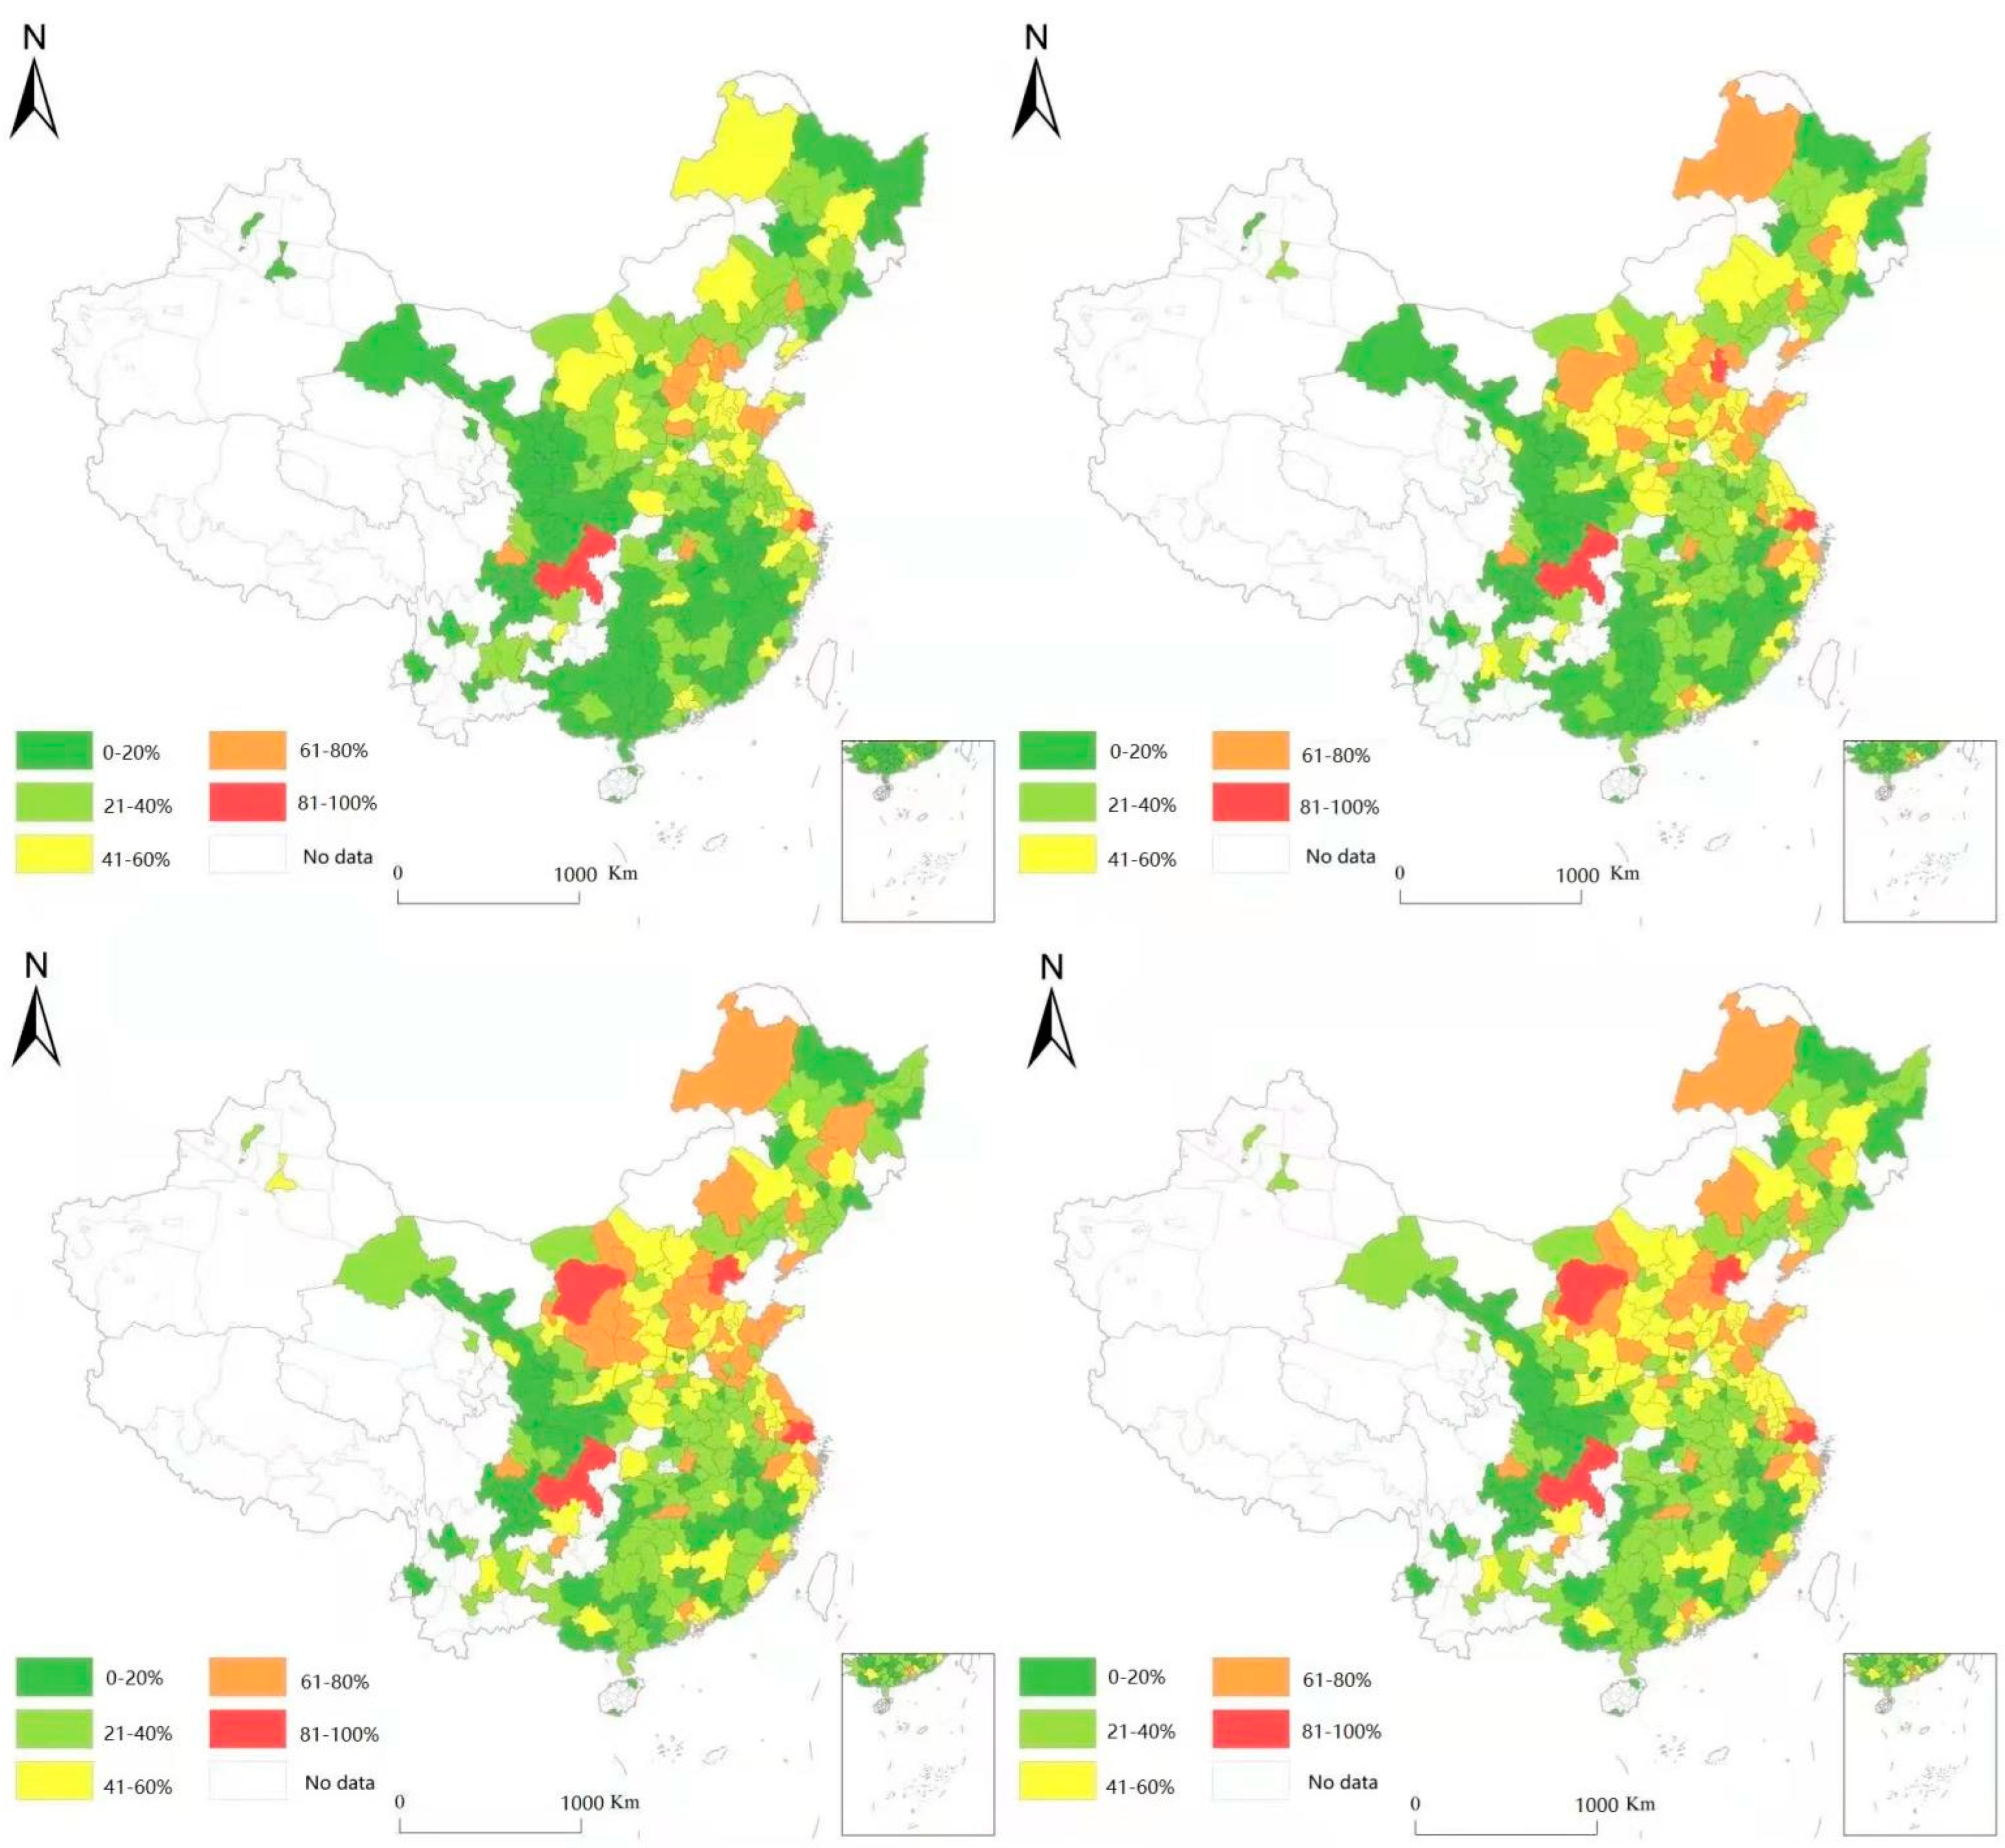
4.1. Regional Difference Analysis of Directed Technical Change on Carbon Footprint
4.2. Mediation Effect Regression Results
5. Conclusions
Author Contributions
Funding
Institutional Review Board Statement
Informed Consent Statement
Data Availability Statement
Conflicts of Interest
References
- Peterson, A.T.; Ortega-Huerta, M.A.; Bartley, J.; Sánchez-Cordero, V.; Soberón, J.; Buddemeier, R.H.; Stockwell, D.R. Future projections for Mexican faunas under global climate change scenarios. Nature 2002, 416, 626–629. [Google Scholar] [CrossRef] [PubMed]
- Zhang, T.; Ma, Y.; Li, A. Scenario analysis and assessment of China’s nuclear power policy based on the paris agreement: A dynamic cge model. Energy 2021, 228, 120541. [Google Scholar] [CrossRef]
- Wu, L.; Zhu, Q. Impacts of the carbon emission trading system on China’s carbon emission peak: A new data-driven approach. Nat. Hazards 2021, 107, 2487–2515. [Google Scholar] [CrossRef] [PubMed]
- Chen, L.; Li, K.; Chen, S.; Wang, X.; Tang, L. Industrial activity, energy structure, and environmental pollution in China. Energy Econ. 2021, 104, 105633. [Google Scholar] [CrossRef]
- Gong, P.P.; Liang, S.; Carlton, E.J.; Jiang, Q.; Remais, J.V. Urbanisation and health in China. Lancet 2012, 379, 843–852. [Google Scholar] [CrossRef]
- Hicks, J.R.S. The Theory of Wages; Macmillan: Basingstoke, UK, 1932. [Google Scholar]
- Malthus, T. An Essay on the Principle of Population (1798); Pickering & Chatto Publishers: London, UK, 1986. [Google Scholar]
- Commoner, B. The Closing Circle (1971); Courier Dover Publications: Mineola, NY, USA, 2020. [Google Scholar]
- Ehrlich, P.R.; Holden, J.P. Impact of population growth. Science 1971, 171, 1212–1217. [Google Scholar] [CrossRef]
- York, R.; Rosa, E.A.; Dietz, T. STIRPAT, IPAT and Impact: Analytic tools for unpacking the driving forces of environmental impacts. Ecol. Econ. 2003, 46, 351–365. [Google Scholar] [CrossRef]
- Dietz, T.; Rosa, E.A. Rethinking the environmental impacts of population, affluence and technology. Hum. Ecol. Rev. 1994, 1, 277–300. [Google Scholar]
- Benjaafar, S.; Li, Y.; Daskin, M. Carbon footprint and the management of supply chains: Insights from simple models. IEEE Trans. Autom. Sci. Eng. 2013, 10, 99–116. [Google Scholar] [CrossRef]
- Azam, M.; Rehman, Z.U.; Ibrahim, Y. Causal nexus in industrialization, urbanization, trade openness, and carbon emissions: Empirical evidence from OPEC economies. Environ. Dev. Sustain. 2022, 1–21. [Google Scholar] [CrossRef]
- Bouzid, M.; Masmoudi, O.; Yalaoui, A. Exact Methods and Heuristics for Order Acceptance Scheduling Problem under Time-of-Use Costs and Carbon Emissions. Appl. Sci. 2021, 11, 8919. [Google Scholar] [CrossRef]
- Jo, H.K. Impacts of urban greenspace on offsetting carbon emissions for middle Korea. J. Environ. Manag. 2002, 64, 115–126. [Google Scholar] [CrossRef] [PubMed]
- Carlson, K.M.; Curran, L.M.; Ratnasari, D.; Pittman, A.M.; Soares-Filho, B.S.; Asner, G.P.; Trigg, S.N.; Gaveau, D.A.; Lawrence, D.; Rodrigues, H.O. Committed carbon emissions, deforestation, and community land conversion from oil palm plantation expansion in west Kalimantan, Indonesia. Proc. Natl. Acad. Sci. USA 2012, 109, 7559–7564. [Google Scholar] [CrossRef] [PubMed] [Green Version]
- Clifton-brown, J.C.; Stampfl, P.F.; Jones, M.B. Miscanthus biomass production for energy in Europe and its potential contribution to decreasing fossil fuel carbon emissions. Glob. Change Biol. 2004, 10, 509–518. [Google Scholar] [CrossRef]
- Román-Collado, R.; Sanz-Díaz, M.T.; Loja Pacheco, C. Towards the decarbonisation of Ecuador: A multisectoral and multiregional analysis of its carbon footprint. Environ. Sci. Pollut. Res. 2021, 28, 53412–53431. [Google Scholar] [CrossRef]
- Martin-Gorriz, B.; Martínez-Alvarez, V.; Maestre-Valero, J.F.; Gallego-Elvira, B. Influence of the water source on the carbon footprint of irrigated agriculture: A regional study in South-Eastern Spain. Agronomy 2021, 11, 351. [Google Scholar] [CrossRef]
- Xie, D.D. A Generalized Fact and Model of Long-Run Economic Growth: Kaldor Fact as a Special Case; Peterson Institute for International Economics Working Paper: Washington, DC, USA, 2011; Volume 27, pp. 319–341. [Google Scholar]
- Sofi, A.A.; Bhat, M.Y.; Mishra, A.K. Testing spatial interactions in Kaldor’s growth laws: A cross-country analysis. J. Public Aff. 2020, e2536. [Google Scholar] [CrossRef]
- Maria, C.D.; Vander Werf, E. Carbon leakage revisited: Unilateral climate policy with directed technical change. Environ. Resour. Econ. 2008, 39, 55–74. [Google Scholar] [CrossRef]
- Grimaud, A.; Rouge, L. Environment, directed technical change and economic policy. Environ. Resour. Econ. 2008, 41, 439–463. [Google Scholar] [CrossRef]
- Blanchard, O.; Lawrence, F.K. What We Know and Do Not Know about the Natural Rate of Unemployment. J. Econ. Perspect. 1997, 11, 51–72. [Google Scholar] [CrossRef] [Green Version]
- Poterba, J.M. Demographic Change, Intergenerational Linkages, and Public Education. Am. Econ. Rev. 1998, 88, 315–320. [Google Scholar]
- Acemoglu, D. Directed technical change. Rev. Econ. Stud. 2002, 69, 781–809. [Google Scholar] [CrossRef] [Green Version]
- Acemoglu, D.; Aghion, P.; Zilibotti, F. Distance to frontier, selection, and economic growth. J. Eur. Econ. Assoc. 2006, 4, 37–74. [Google Scholar] [CrossRef]
- Acemoglu, D. Equilibrium bias of technology. Econometrica 2007, 75, 1371–1409. [Google Scholar] [CrossRef] [Green Version]
- Bampatsou, C.; Halkos, G.; Beneki, C. Energy and material flow management to improve EU productivity. Econ. Anal. Policy 2021, 70, 83–93. [Google Scholar] [CrossRef]
- Schiemann, M.; Bhm, B.; Chirone, R.; Senneca, O.; Vujanovic, M. Technical solutions to foster the global energy transition: Special issue on clean fuel conversion technologies for carbon dioxide and pollutant reduction. Renew. Sustain. Energy Rev. 2022, 154, 111770. [Google Scholar] [CrossRef]
- Hui, S.L.; Zhi, W.S.; Har, W.M.; Lee, S.Y. The Roles of Green Technology with the aids of Financial Development in Reducing Carbon Dioxide Emission. In Proceedings of the 2020 International Conference on Smart Grid and Clean Energy Technologies (ICSGCE), Kuching, Malaysia, 4–7 October 2020. [Google Scholar]
- Gu, W.; Chu, Z.; Wang, C. How do different types of energy technological progress affect regional carbon intensity? A spatial panel approach. Environ. Sci. Pollut. Res. 2020, 27, 44494–44509. [Google Scholar] [CrossRef]
- Smulders, S.; Maria, C.D. The Cost of Environmental Policy Under Induced Technical Change (July 19, 2012). CESifo Working Paper Series No. 3886. Available online: https://ssrn.com/abstract=2112952 (accessed on 15 March 2022).
- Van der Ploeg, R.; Rezai, A. Stranded Assets, the Social Cost of Carbon, and Directed Technical Change: Macroeconomic Dynamics of Optimal Climate Policy (February 2016). CESifo Working Paper Series No. 5787. Available online: https://ssrn.com/abstract=2754065 (accessed on 15 March 2022).
- Kobayashi, S.; Furuya, J. Development of a tool for socio-economic evaluation of agricultural technologies directed toward adaptation to climate change. JARQ Jpn. Agric. Res. Q. 2015, 49, 135–141. [Google Scholar] [CrossRef] [Green Version]
- Kronenberg, T. Energy conservation, unemployment and the direction of technical change. Port. Econ. J. 2010, 9, 1–17. [Google Scholar] [CrossRef]
- Weyer, I.S. Directed Technical Change in Clean and Dirty Technologies: Is It Possible to Redirect R&D in a Multi-Region World? Master’s Thesis, Department of Economics University of Oslo, Oslo, Norway, May 2015. Available online: http://urn.nb.no/URN:NBN:no-48630 (accessed on 15 March 2022).
- Li, S.; Wang, S. Examining the effects of socioeconomic development on China’s carbon productivity: A panel data analysis. Sci. Total Environ. 2019, 659, 681–690. [Google Scholar] [CrossRef]
- Parsons, D.J.; Chatterton, J.C. Guidance for the Calculation of Carbon Brainprints of Higher Education Institution Activities. Carbon Footprint. 2011. Available online: http://dspace.lib.cranfield.ac.uk/handle/1826/8236 (accessed on 15 March 2022).
- Ke, H.; Dai, S.; Yu, H. Spatial effect of innovation efficiency on ecological footprint: City-level empirical evidence from China. Environ. Technol. Innov. 2021, 22, 101536. [Google Scholar] [CrossRef]
- Wang, W.; Wang, D.; Ni, W.; Zhang, C. The impact of carbon emissions trading on the directed technical change in China. J. Clean. Prod. 2020, 272, 122891. [Google Scholar] [CrossRef]
- Xiu, J.; Zhang, G.X.; Hu, Y. Which kind of directed technical change does China’s economy have? from the perspective of energy-saving and low-carbon. J. Clean. Prod. 2019, 233, 160–168. [Google Scholar] [CrossRef]
- Hansen, B.E. Threshold effects in non-dynamic panels: Estimation, testing, and inference. J. Econom. 1999, 93, 345–368. [Google Scholar] [CrossRef] [Green Version]
- Kremer, D.; MMünster Freitag, M.; Stadler, S.; Schletz, A. Emerging Service Organization in Manufacturing Enterprises: A Dynamic Pathway Model of Servitization. In Proceedings of the XXIII International RESER Conference, Aix en Provence, France, 19–21 September 2013. [Google Scholar] [CrossRef]
- Kremer, S.; Bick, A.; Nautz, D. Inflation and growth: New evidence from a dynamic panel threshold analysis. Empir. Econ. 2013, 44, 861–878. [Google Scholar] [CrossRef] [Green Version]
- Hutama, A.B.; Muktiwibowo, A.K.; Saputra, K.E. Carrying capacity of land in bali based on ecological footprint. IOP Conf. Ser. Earth Environ. Sci. 2021, 903, 012014. [Google Scholar] [CrossRef]
- Tang, Z.; Shang, J.; Shi, C.B.; Liu, Z.; Bi, K.X. Decoupling indicators of CO2 emissions from the tourism industry in China: 1990–2012. Ecol. Indic. 2014, 46, 390–397. [Google Scholar] [CrossRef]
- Larsen, H.N.; Hertwich, E.G. Implementing carbon-footprint-based calculation tools in municipal greenhouse gas inventories. J. Ind. Ecol. 2010, 14, 965–977. [Google Scholar] [CrossRef]
- Mancia, A.; Chadwick, D.R.; Waters, S.M.; Krol, D.J. Uncertainties in direct N2O emissions from grazing ruminant excreta in national greenhouse gas inventories. Sci. Total Environ. 2022, 803, 149935. [Google Scholar] [CrossRef]
- Domazlicky, W. Total factor productivity growth in manufacturing: A regional approach using linear programming. Reg. Sci. Urban Econ. 1999, 29, 105–122. [Google Scholar]
- Färe, R.; Grosskopf, S.; Lovell, C.A.K.; Grifell-Tatjé, E. Biased Technical Change and the Malmquist Productivity Index. Scand. J. Econ. 1997, 99, 119–127. [Google Scholar] [CrossRef]
- Fare, R.; Grosskopf, M.; Zhang, Z. Productivity Growth, Technical Progress and Efficiency Changes in Industrialized Countries. Am. Econ. Rev. 1994, 101, 263–275. [Google Scholar]
- Cao, Y.; Chai, L.; Yan, X.; Liang, Y. Drivers of the growing water, carbon and ecological footprints of the chinese diet from 1961 to 2017. Int. J. Environ. Res. Public Health 2020, 17, 1803. [Google Scholar] [CrossRef] [PubMed] [Green Version]
- Cai, H.; Qu, S.; Wang, M. Changes in China’s carbon footprint and driving factors based on newly constructed time series input–output tables from 2009 to 2016. Sci. Total Environ. 2020, 711, 134555. [Google Scholar] [CrossRef] [PubMed]
- Elvidge, C.D.; Baugh, K.E.; Anderson, S.J.; Sutton, P.C.; Ghosh, T. The night light development index (nldi): A spatially explicit measure of human development from satellite data. Soc. Geogr. Discuss. 2012, 7, 23–35. [Google Scholar] [CrossRef]
- Fan, J.; Ma, T.; Zhou, C.; Zhou, Y.; Xu, T. Comparative estimation of urban development in China’s cities using socioeconomic and DMSP/OLS night light data. Remote Sens. 2014, 6, 7840–7856. [Google Scholar] [CrossRef] [Green Version]
- Huang, Y.; Yu, Q.; Wang, R. Driving factors and decoupling effect of carbon footprint pressure in China: Based on net primary production. Technol. Forecast. Soc. Change 2021, 167, 120722. [Google Scholar] [CrossRef]
- Despins, C.; Labeau, F.; Le Ngoc, T.; Labelle, R.; Cheriet, M.; Thibeault, C.; Gagnon, F.; Leon-Garcia, A.; Cherkaoui, O.; Arnaud, B.S.; et al. Leveraging green communications for carbon emission reductions: Techniques, testbeds, and emerging carbon footprint standards. IEEE Commun. Mag. 2011, 49, 101–109. [Google Scholar] [CrossRef]
- Xu, L.; Geng, Y.; Wu, D.; Zhang, C.; Xiao, S. Carbon footprint of residents’ housing consumption and its driving forces in China. Energies 2021, 14, 3890. [Google Scholar] [CrossRef]
- Yang, Y.; Zhao, T.; Wang, Y.; Shi, Z. Research on impacts of population-related factors on carbon emissions in beijing from 1984 to 2012. Environ. Impact Assess. Rev. 2015, 55, 45–53. [Google Scholar] [CrossRef]
- Xu, P.; Jin, P.; Cheng, Q. Mapping urbanization dynamic of mainland China using dmsp/ols night time light data. IOP Conf. Ser. Earth Environ. Sci. 2020, 569, 012063. [Google Scholar] [CrossRef]
- Xiaowei, C.; Li, L.; Huang, X.; Zhao, R.; Wang, W.; Chen, Z. Temporospatial changes of carbon footprint based on energy consumption in China. J. Geogr. Sci. 2012, 22, 110–124. [Google Scholar]
- Wang, M.; Cheng, Z.; Li, Y.; Li, J.; Guan, K. Impact of market regulation on economic and environmental performance: A game model of endogenous green technological innovation. J. Clean. Prod. 2020, 277, 123969. [Google Scholar] [CrossRef]

| Energy Types | Raw Coal | Coke | Crude Oil | Gasoline | Diesel Oil | Fuel Oil | Natural Gas | Heat | Electricity |
|---|---|---|---|---|---|---|---|---|---|
| coefficients | 0.4861 | 0.7482 | 0.8206 | 0.8071 | 0.8453 | 0.8657 | 5.3903 | 0.0279 | 0.1623 |
| Regions | National | Eastern | Central | Western | Northeastern |
|---|---|---|---|---|---|
| single threshold test | 41.565 *** | 19.203 * | 26.187 ** | 19.054 ** | 22.019 * |
| (5.29) | (1.78) | (2.20) | (2.01) | (1.70) | |
| double threshold test | 28.005 *** | 17.146 *** | 22.436 *** | 20.183 *** | 27.043 ** |
| (3.09) | (4.17) | (6.88) | (5.90) | (2.09) | |
| triple threshold test | 11.001 * | 9.076 ** | 12.261 *** | 8.238 | 0.000 |
| (1.77) | (1.99) | (6.01) | (0.47) | (0.12) |
| Single-Threshold Estimate (δ1) | 95% Confidence Interval | Double-Threshold Estimate (δ2) | 95% Confidence Interval | |
|---|---|---|---|---|
| Entire country | 6864.52 | (5903.09, 7215.83) | 8136.44 | (7965.84, 9019.78) |
| East | 5824.17 | (4978.69, 6070.11) | 7211.86 | (6553.07, 7422.84) |
| Central | 7802.36 | (7255.39, 8104.61) | 8427.30 | (7909.68, 8577.93) |
| West | 6780.19 | (6407.63, 6978.26) | 8469.38 | (7719.36, 9066.78) |
| Northeast | 9245.32 | (8905.83, 9763.15) | 10,705.68 | (9758.89, 11,003.25) |
| Variables | Model (1) | Model (2) | Model (3) | Model (4) | Model (5) |
|---|---|---|---|---|---|
| Entire Country | East | Central | West | Northeast | |
| lnecit-1 | 2.0725 *** | 1.2073 *** | 1.0413 *** | 1.6073 *** | 1.0266 *** |
| (4.13) | (3.06) | (5.88) | (4.01) | (6.06) | |
| lnecit-2 | 1.8547 *** | 0.9877 *** | 0.8765 *** | 0.9463 *** | 0.9029 *** |
| (3.24) | (4.17) | (5.78) | (4.09) | (3.62) | |
| lndtc (Tit < δ1) | −0.2077 *** | −1.0208 *** | −0.0097 *** | −0.0038 ** | −0.7021 |
| (−5.73) | (−4.17) | (−3.08) | (−2.10) | (0.88) | |
| lndtc (δ1 ≤ Tit < δ2) | −0.3003 *** | −1.0302 *** | −0.1015 *** | −0.0705 *** | −0.9006 |
| (−3.01) | (−4.47) | (−5.13) | (−3.68) | (1.20) | |
| lndtc (Tit ≥ δ2) | −0.3428 *** | −1.3063 *** | −0.2705 *** | −1.0003 *** | −1.0216 ** |
| (−3.17) | (−5.44) | (−3.35) | (−5.08) | (−1.98) | |
| lnpopit | 0.9037 *** | 0.8025 *** | 1.0004 *** | −0.0713 *** | 0.5946 *** |
| (3.79) | (−3.29) | (6.09) | (−5.17) | (−4.16) | |
| lngdpit | 1.0005 *** | 0.9801 *** | 0.7975 *** | 0.8009 *** | 0.0429 *** |
| (3.91) | (3.83) | (3.46) | (4.08) | (5.91) | |
| lnfdiit | −0.9358 *** | −1.0133 *** | −0.2046 *** | −0.7085 *** | −0.1129 *** |
| (−4.55) | (−5.06) | (−5.97) | (−4.83) | (−6.04) | |
| lnthirdit | −0.9031 *** | −0.6708 *** | −0.4079 *** | −0.3397 *** | −0.4289 *** |
| (−4.00) | (−3.46) | (−4.82) | (−7.03) | (−5.62) | |
| lntransit | 0.0740 | 0.0526 | 0.0899 | 0.0645 | 0.1012 |
| (0.45) | (1.02) | (1.23) | (0.97) | (1.38) | |
| lntechsit | −1.0802 | −0.9153 *** | −1.0246 | −0.9011 | −1.2038 |
| (−0.94) | (−1.02) | (−0.68) | (−0.93) | (−1.01) | |
| lnpollutionit | −1.2463 *** | −1.0589 *** | −0.9976 *** | −1.0205 ** | −1.6173 *** |
| (−4.07) | (−3.28) | (−4.03) | (−2.39) | (−3.04) | |
| C | 6.533 *** | 5.087 *** | 3.014 *** | 4.006 *** | 3.498 *** |
| (7.33) | (5.10) | (3.47) | (3.96) | (5.08) |
| Variables | Model (1) lnecit | Model (2) lndensit | Model (3) lnecit | Model (4) lnecit | Model (5) lninsit | Model (6) lnecit |
|---|---|---|---|---|---|---|
| lndensit | −0.0987 ** | −0.9045 *** | ||||
| (−2.20) | (−3.67) | |||||
| lndtcit | −0.0804 *** | −1.9421 *** | −0.9478 *** | −0.2766 *** | −0.4709 *** | −0.6570 ** |
| (−4.05) | (−3.00) | (−2.71) | (−4.88) | (−3.70) | −2.5 | |
| lnpopit | 0.0608 *** | 0.0931 *** | 0.0833 ** | 0.7302 *** | 0.4331 ** | 0.5062 *** |
| −5.47 | −3.99 | −2.39 | −4.07 | −2.22 | −5.78 | |
| lngdpit | 0.7576 *** | 0.0922 ** | 1.0273 *** | 0.0994 *** | 0.0871 *** | 0.9204 *** |
| −4.67 | −2.12 | −4.08 | −3.27 | −3.1 | −4.45 | |
| lnfdiit | −0.9760 *** | −0.6834 ** | −0.0901 *** | −1.0742 ** | −0.9776 ** | −0.3802 *** |
| (−2.99) | (−2.07) | (−3.88) | (−2.62) | (−2.47) | (−5.06) | |
| lnthirdit | −0.4698 *** | −0.0926 ** | −0.6609 *** | −0.0076 *** | −0.0328 * | −0.1059 *** |
| (−3.93) | (−1.98) | (−4.04) | (−3.97) | −1.84 | (−4.75) | |
| lntransit | 0.0411 *** | −0.0289 *** | 0.0738 *** | 0.3776 *** | 0.2588 *** | 0.0901 *** |
| (−4.83) | (−5.07) | (−4.56) | (4.19) | −5.32 | −3.66 | |
| lntechsit | −0.0095 | −0.0702 | −0.0548 | −0.1023 | −0.3864 | −0.8991 |
| (−0.01) | (−0.49) | (−1.32) | (−0.99) | (−1.37) | (−0.71) | |
| lnpollutionit | −1.2205 *** | −0.1988 *** | −0.4759 *** | −0.1209 *** | −0.3765 *** | −0.8201 *** |
| (−4.30) | (−3.41) | (−3.26) | (−4.48) | (−3.70) | (−3.26) | |
| Time fixed effect | Control | Control | Control | Control | Control | Control |
| Individual fixed effects | Control | Control | Control | Control | Control | Control |
| Constant | 0.1920 *** | −0.9928 *** | 0.8330 *** | 3.8029 *** | −4.7280 *** | 3.6004 *** |
| −3.93 | (−3.30) | −4.99 | −3.43 | (−4.65) | −6.03 | |
| R2 | 0.758 | 0.7869 | 0.7761 | 0.7361 | 0.7822 | 0.7553 |
| Sobel | |Z| = 0.8703 ** | |Z| = 2.6935 ** | ||||
| Mediating effect | No mediating effect | Partial mediating effect | ||||
| Variables | Model (1) lnecit | Model (2) lnensit | Model (3) lnecit | Model (4) lnecit | Model (5) lnieit | Model (6) lnecit |
|---|---|---|---|---|---|---|
| lndensit | −0.9877 *** | −0.9832 *** | ||||
| (−3.70) | (−6.26) | |||||
| lndtcit | −0.1921 *** | −1.3706 *** | −0.4559 ** | −0.1937 *** | −2.0505 *** | −1.0841 ** |
| (−5.17) | (−4.65) | −2.33 | (−4.51) | (−3.89) | −2.45 | |
| lnpopit | 0.7325 *** | 0.6822 ** | 0.0905 *** | 0.0681 *** | 0.4073 ** | 0.0943 *** |
| −6.1 | −2.24 | −4.15 | −4.28 | −2.17 | −4.05 | |
| lngdpit | 0.0916 *** | 0.8807 ** | 0.1065 *** | 0.9925 *** | 0.9028 ** | 1.0085 *** |
| −4.09 | −2 | −3.9 | −3.85 | −2.19 | −5.68 | |
| lnfdiit | −0.1050 ** | −0.3629 ** | −0.7609 *** | −0.9630 ** | −0.8240 ** | −0.9064 *** |
| (−2.18) | (−2.46) | (−4.57) | (−2.21) | (−2.36) | (−3.69) | |
| lnthirdit | −0.9903 *** | −0.6304 * | −0.4937 *** | −0.6977 *** | −1.0025 ** | −0.7793 *** |
| (−4.03) | −1.86 | (−3.69) | −4.08 | −5.78 | −4.32 | |
| lntransit | 0.9607 *** | 0.8219 *** | 0.6503 *** | 0.9118 *** | 0.9376 *** | 0.8762 *** |
| −4.66 | −7.9 | −4.89 | −3.95 | −4.26 | −5.07 | |
| lntechsit | −1.3227 | −0.8746 | −0.9972 | −0.9950 | −0.0617 | −1.0815 |
| (−0.98) | (−1.21) | (−0.79) | (−0.87) | (−1.06) | −0.69 | |
| lnpollutionit | −0.0736 *** | −0.1028 *** | −0.0977 *** | −0.5876 *** | −0.4210 *** | −0.3599 *** |
| (−3.28) | (−5.72) | (−5.68) | (−4.15) | (−3.09) | (−4.77) | |
| Time fixed effect | Control | Control | Control | Control | Control | Control |
| Individual fixed effects | Control | Control | Control | Control | Control | Control |
| Constant | 2.8240 *** | −5.9070 *** | 3.6094 *** | 1.0705 *** | −1.6368 *** | 3.9784 *** |
| −6.73 | (−4.22) | −3.94 | −5.21 | (−4.16) | −3.77 | |
| R2 | 0.7582 | 0.7981 | 0.7802 | 0.7258 | 0.7387 | 0.7972 |
| Sobel | |Z| = 2.0065 ** | |Z| = 1.9896 ** | ||||
| Mediating effect | Partial mediating effect | Partial mediating effect | ||||
Publisher’s Note: MDPI stays neutral with regard to jurisdictional claims in published maps and institutional affiliations. |
© 2022 by the authors. Licensee MDPI, Basel, Switzerland. This article is an open access article distributed under the terms and conditions of the Creative Commons Attribution (CC BY) license (https://creativecommons.org/licenses/by/4.0/).
Share and Cite
Lyu, X.; Ke, H. Dynamic Threshold Effect of Directed Technical Change Suppress on Urban Carbon Footprint in China. Int. J. Environ. Res. Public Health 2022, 19, 5151. https://doi.org/10.3390/ijerph19095151
Lyu X, Ke H. Dynamic Threshold Effect of Directed Technical Change Suppress on Urban Carbon Footprint in China. International Journal of Environmental Research and Public Health. 2022; 19(9):5151. https://doi.org/10.3390/ijerph19095151
Chicago/Turabian StyleLyu, Xiaojun, and Haiqian Ke. 2022. "Dynamic Threshold Effect of Directed Technical Change Suppress on Urban Carbon Footprint in China" International Journal of Environmental Research and Public Health 19, no. 9: 5151. https://doi.org/10.3390/ijerph19095151
APA StyleLyu, X., & Ke, H. (2022). Dynamic Threshold Effect of Directed Technical Change Suppress on Urban Carbon Footprint in China. International Journal of Environmental Research and Public Health, 19(9), 5151. https://doi.org/10.3390/ijerph19095151