
The Impacts of Housing Characteristics and Built-Environment Features on Mental Health


Abstract
:1. Introduction
2. Method
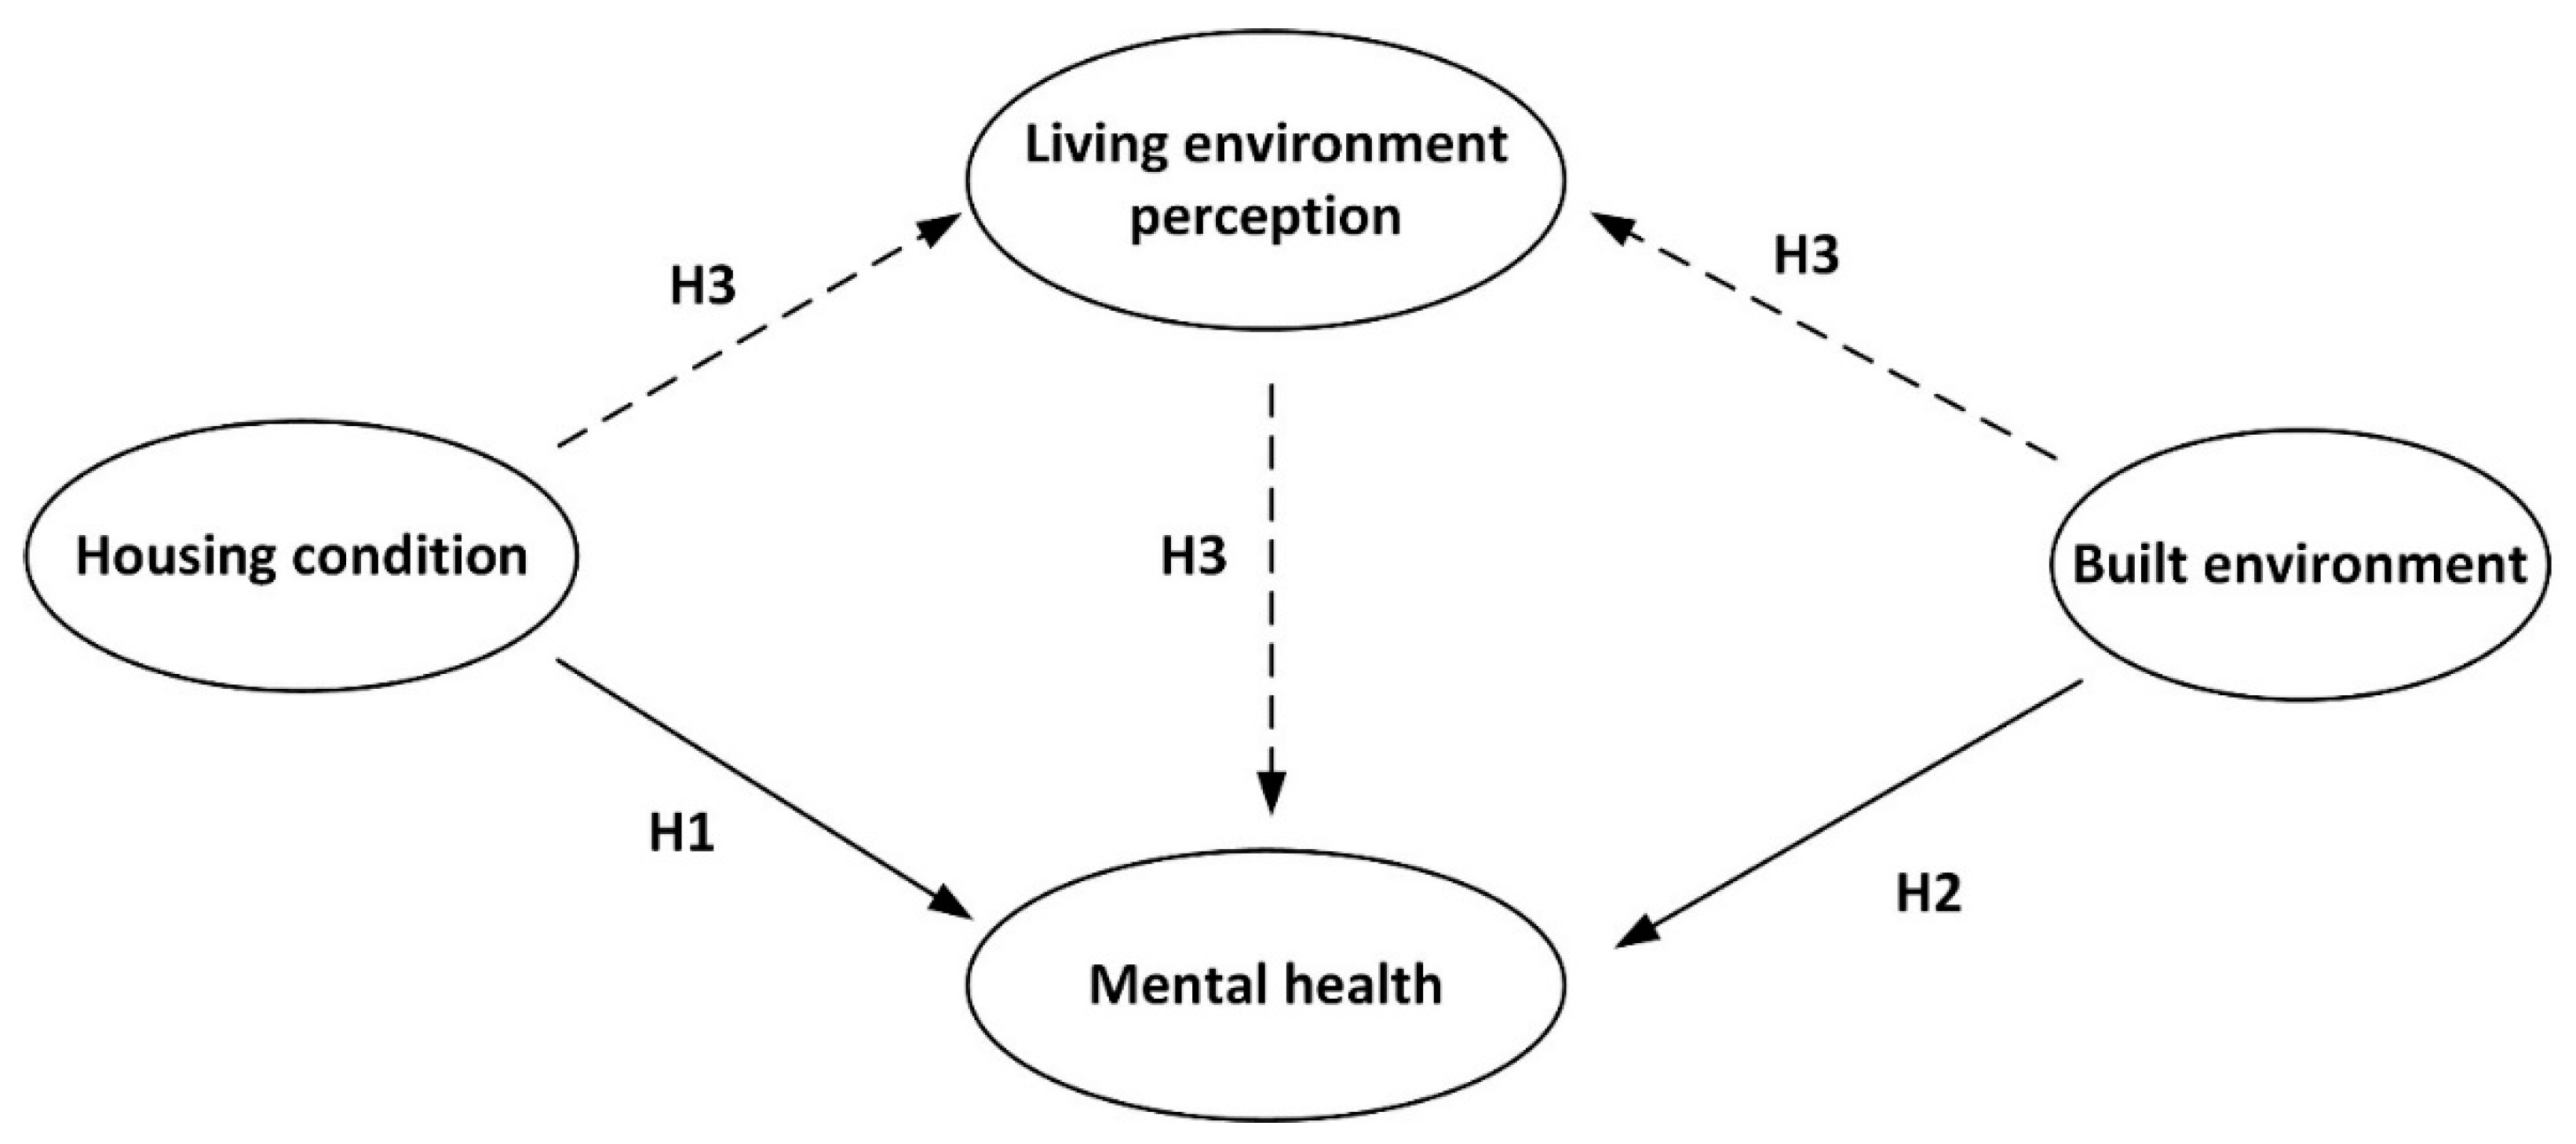
2.1. Conceptual Framework and Hypothesis
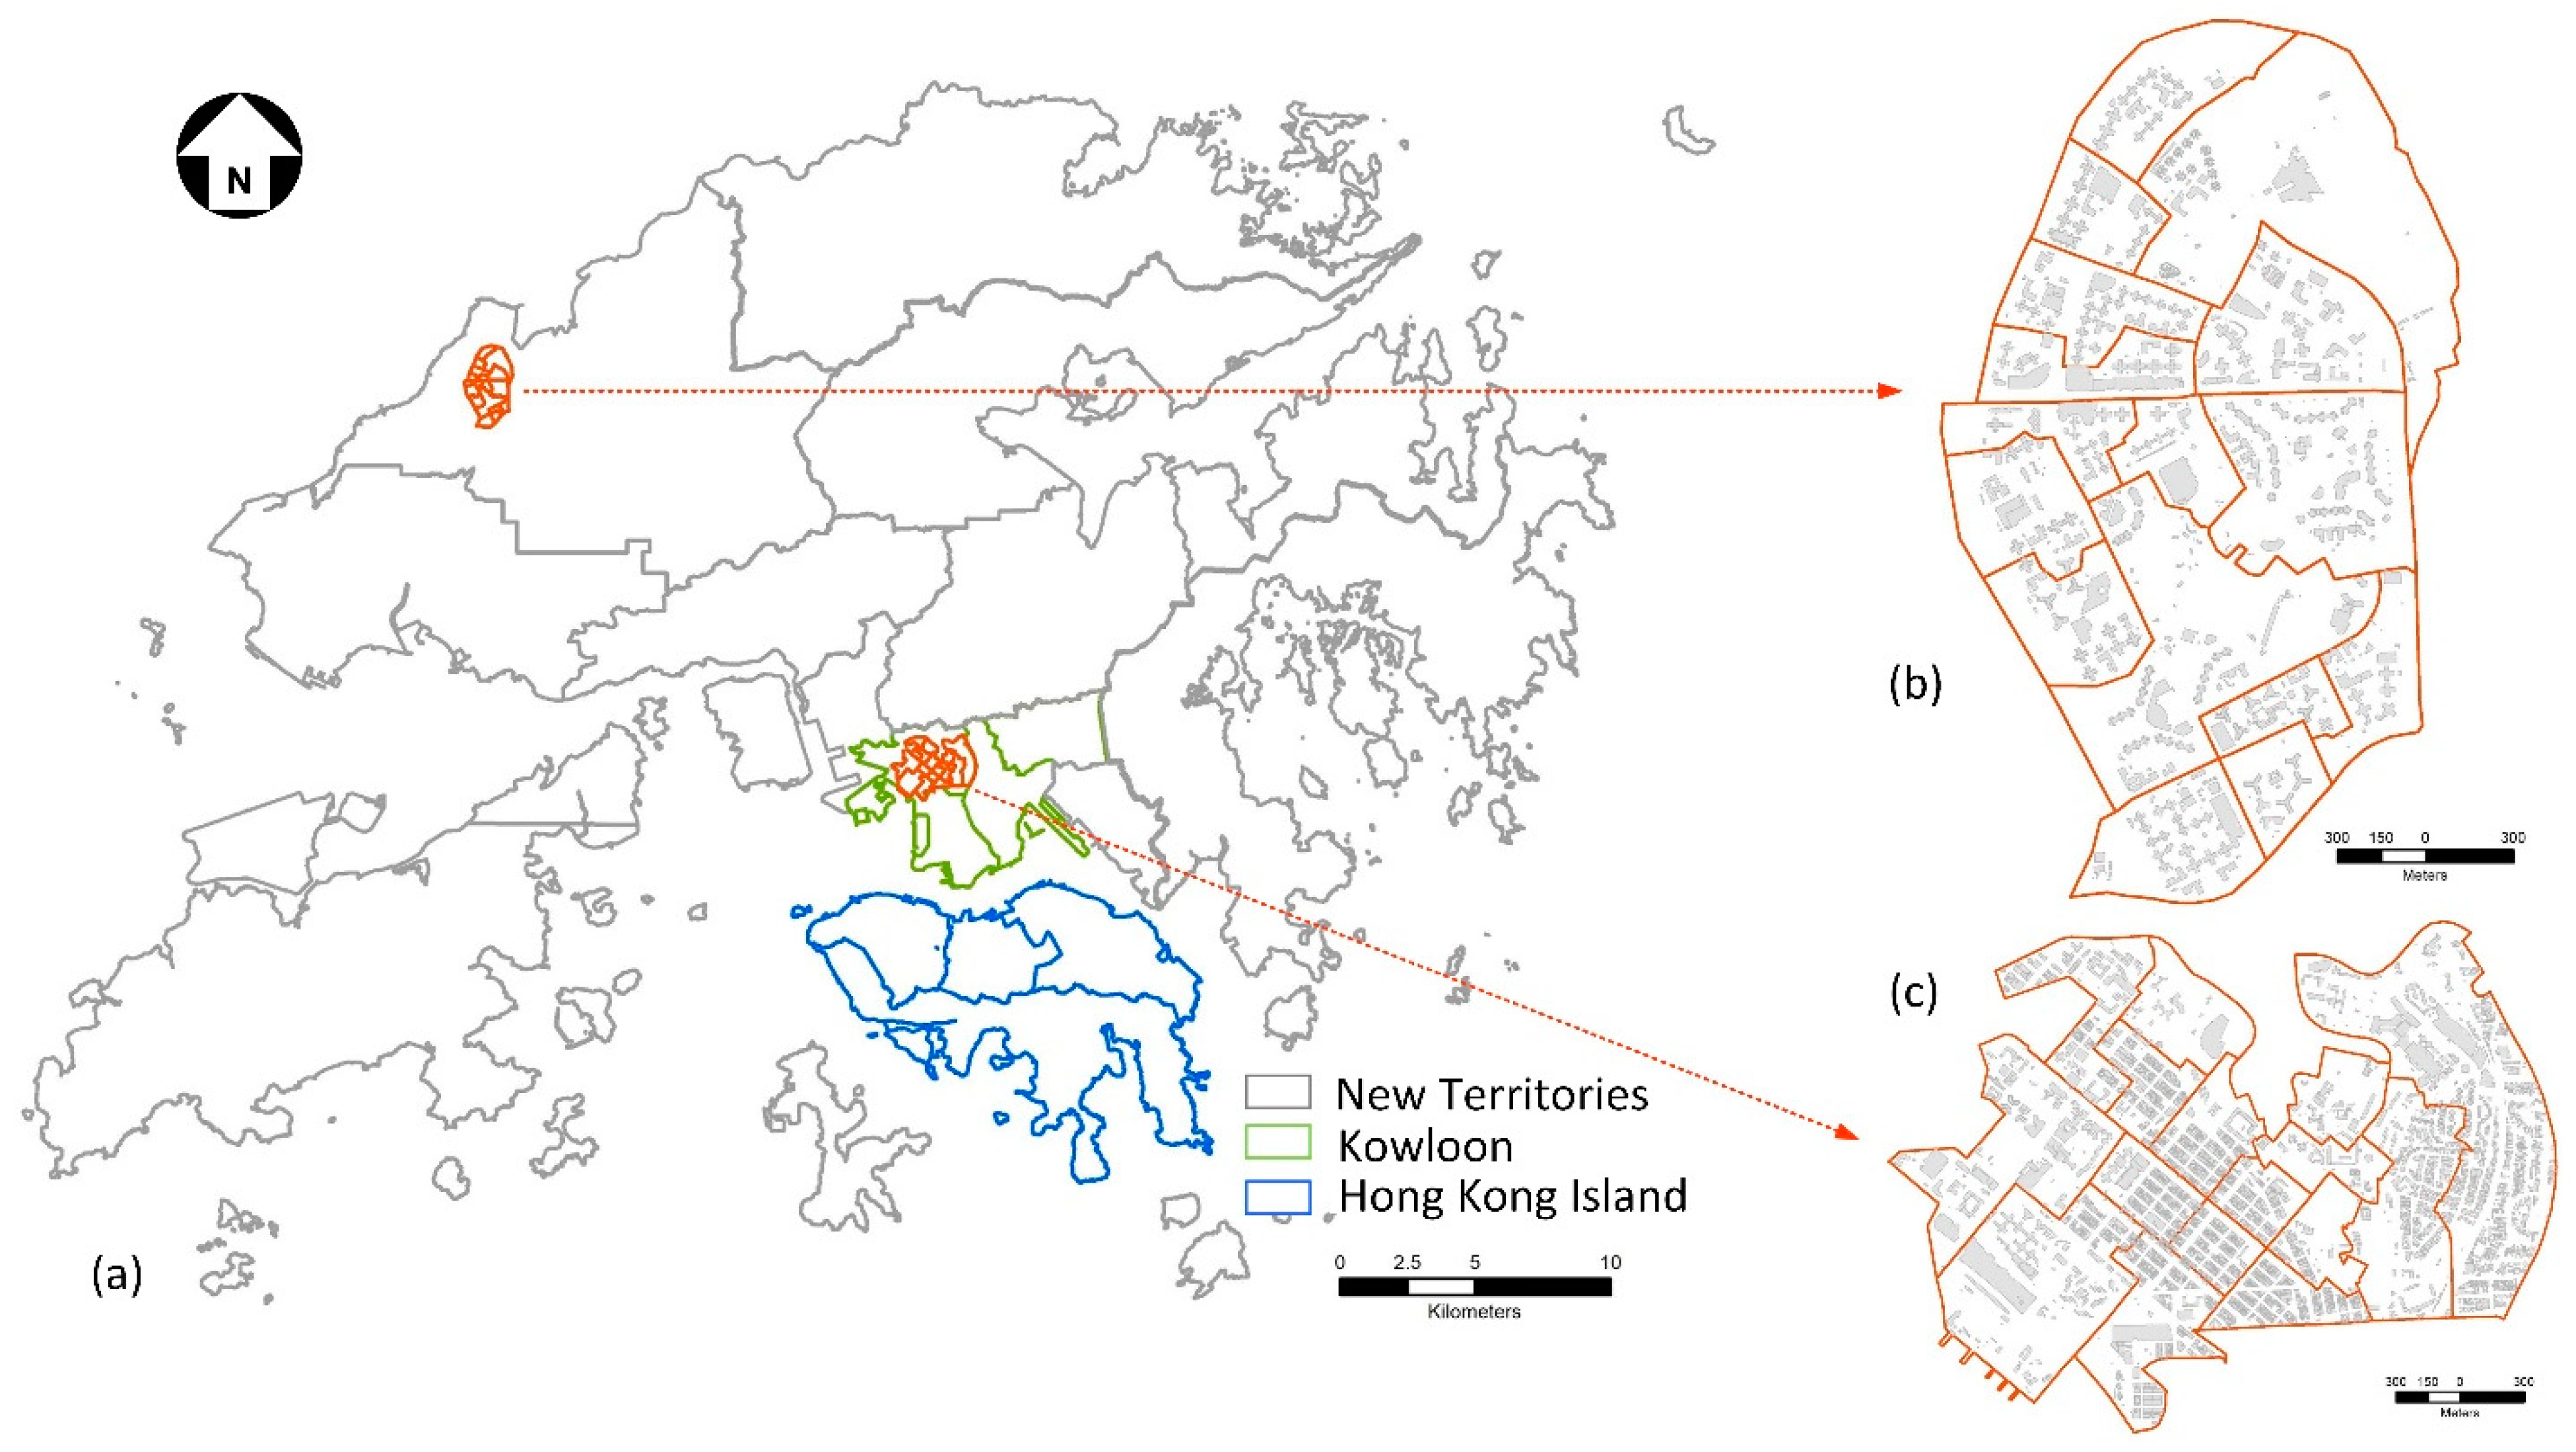
2.2. Study Area and Data Sources
- (1)
- Study area
- (2)
- Data
2.3. Measures and Statistical Model
2.3.1. Measures
- (1)
- Housing Characteristics
- (2)
- Built-Environment Features
- (3)
- Perceived Living Environment
- (4)
- Reported Mental Health
2.3.2. Statistical Method
3. Results
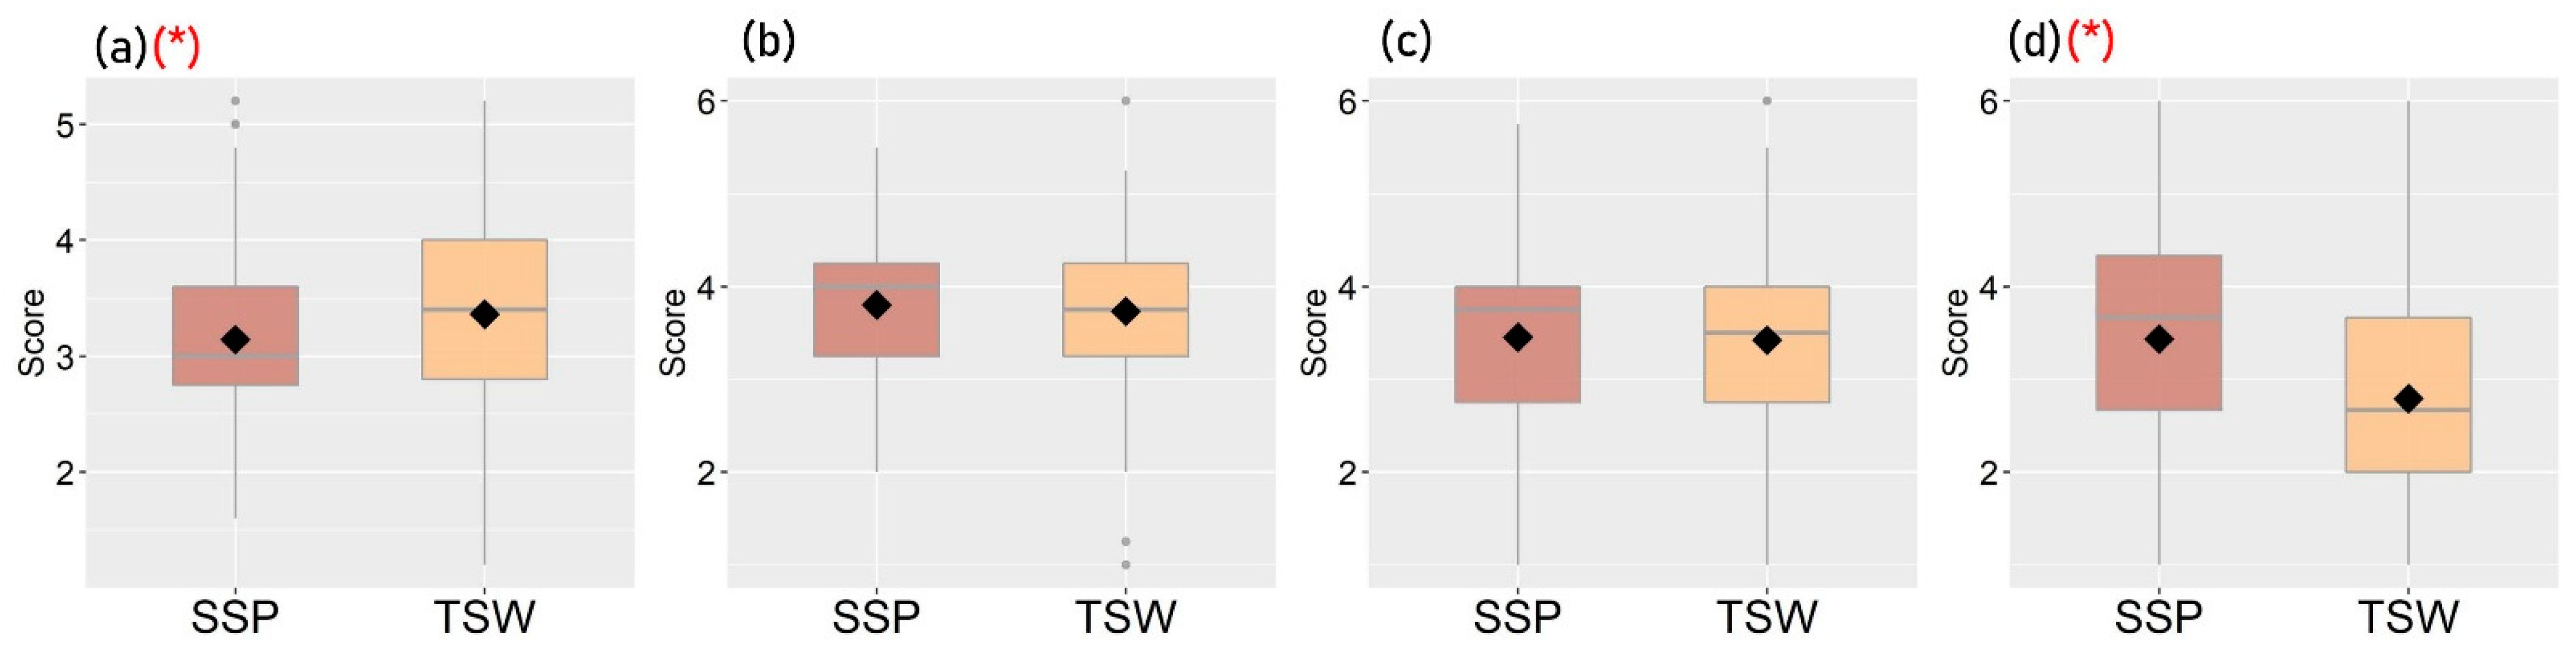
3.1. Descriptive Analysis
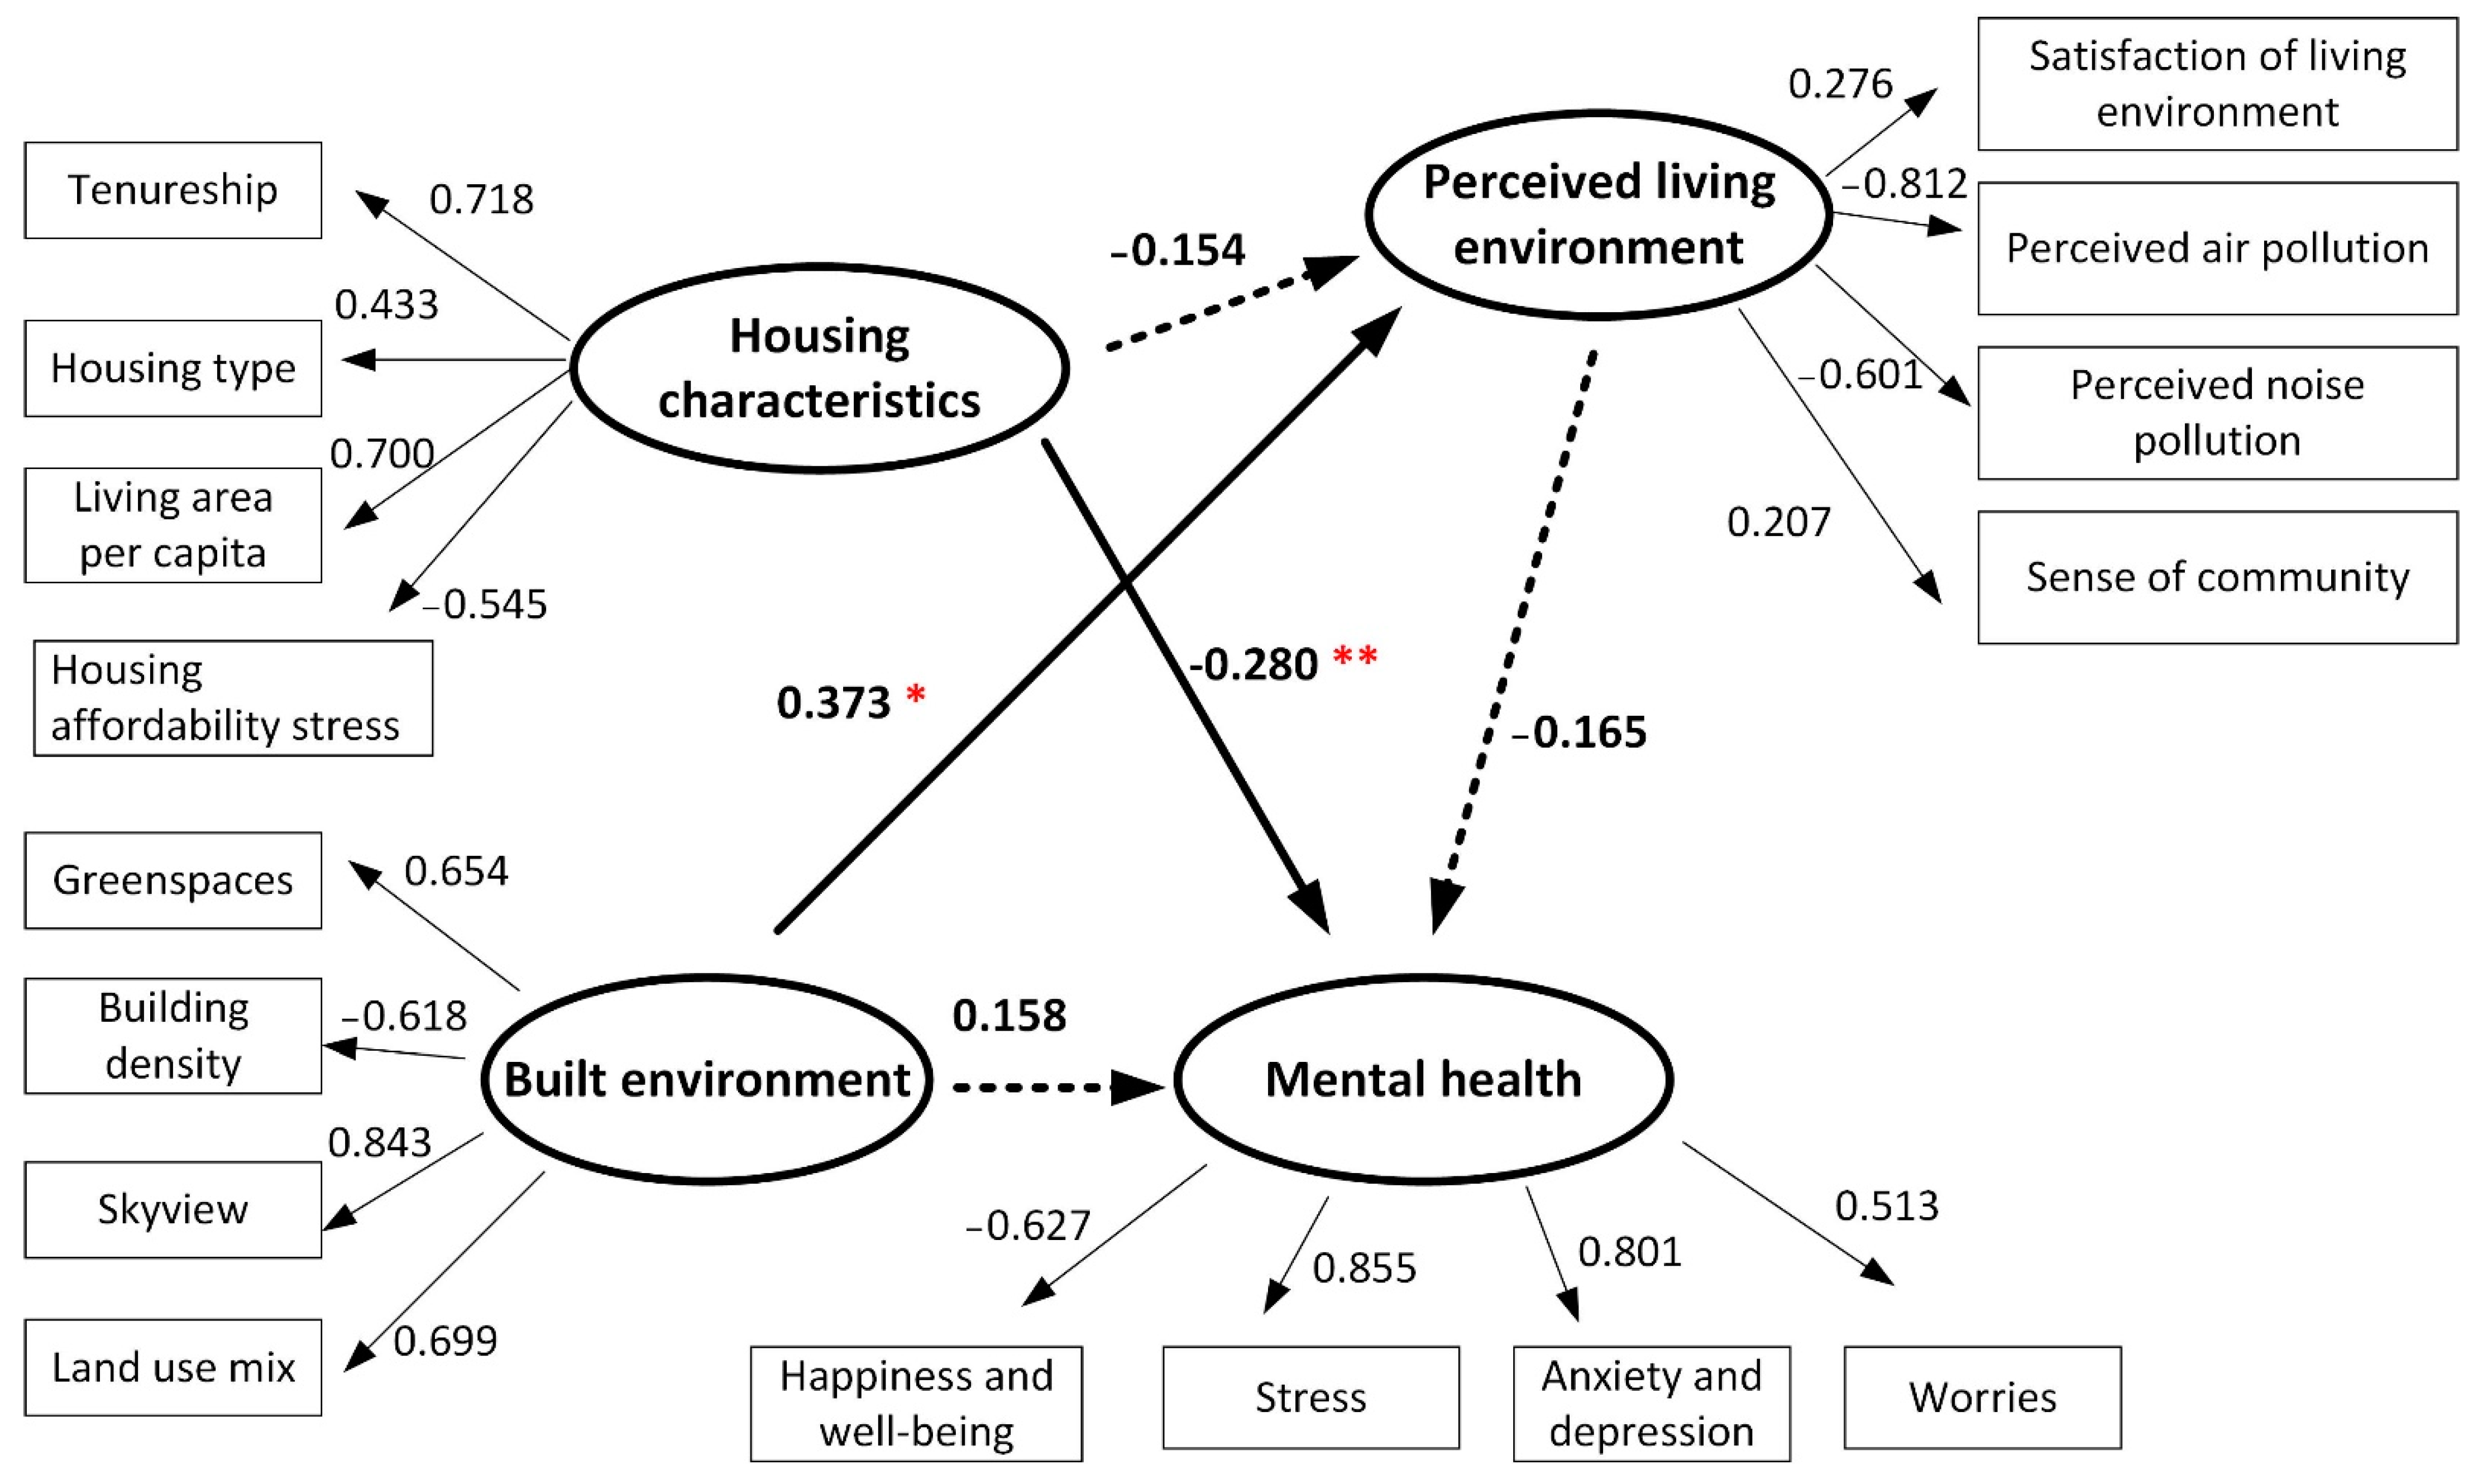
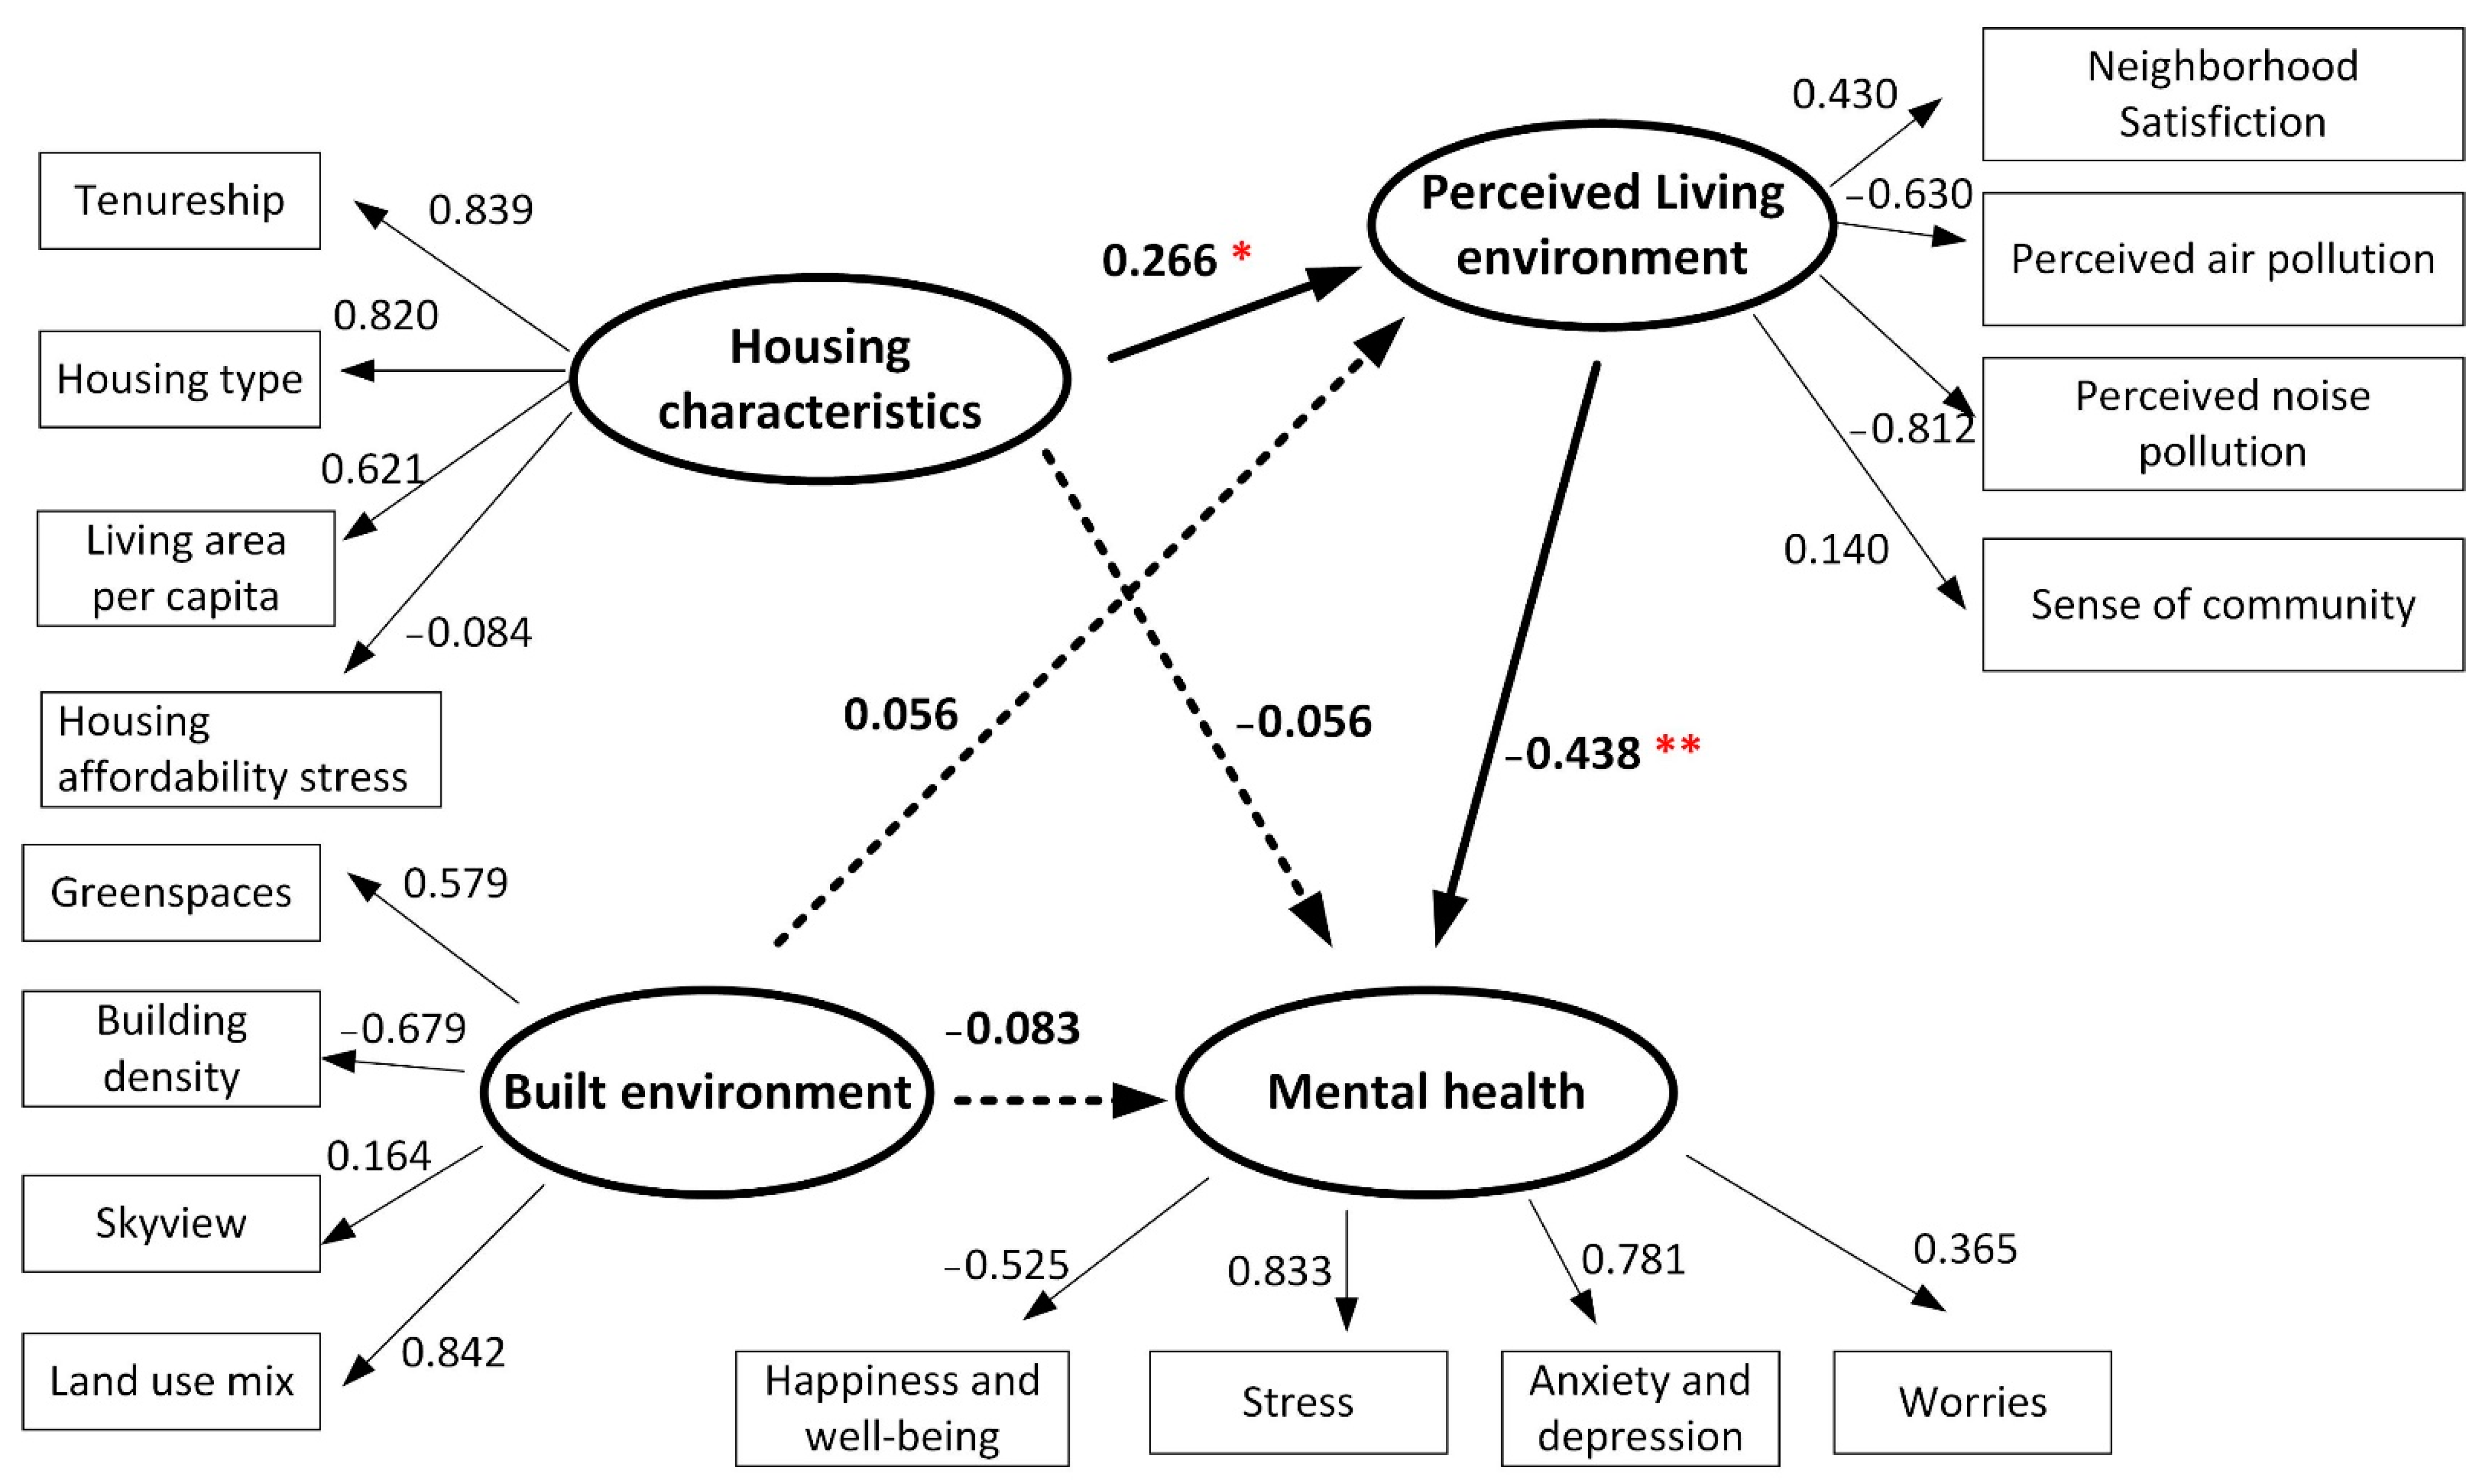
3.2. Results of Structural Equation Models
4. Discussion
5. Conclusions
Author Contributions
Funding
Institutional Review Board Statement
Informed Consent Statement
Conflicts of Interest
References
- Mair, C.; Roux, A.D.; Galea, S. Are neighbourhood characteristics associated with depressive symptoms? A review of evidence. J. Epidemiol. Community Health 2008, 62, 940–946. [Google Scholar]
- Xiao, Y.; Miao, S.; Sarkar, C.; Geng, H.; Lu, Y. Exploring the impacts of housing condition on migrants’ mental health in nanxiang, shanghai: A structural equation modelling approach. Int. J. Environ. Res. Public Health 2018, 15, 225. [Google Scholar] [CrossRef] [PubMed] [Green Version]
- Galea, S.; Ahern, J.; Rudenstine, S.; Wallace, Z.; Vlahov, D. Urban built environment and depression: A multilevel analysis. J. Epidemiol. Community Health 2005, 59, 822–827. [Google Scholar] [CrossRef] [PubMed] [Green Version]
- Green, R.D.; Kouassi, M.; Venkatachalam, P.; Daniel, J. The impact of housing stressors on the mental health of a low-income African-American population. Rev. Black Political Econ. 2013, 40, 53–100. [Google Scholar] [CrossRef]
- World Health Organization (WHO). Housing and Health Guidelines. Available online: http://apps.who.int/iris/bitstream/handle/10665/276001/9789241550376-eng.pdf (accessed on 10 March 2022).
- Baker, E.; Bentley, R.; Mason, K. The mental health effects of housing tenure: Causal or compositional? Urban Stud. 2013, 50, 426–442. [Google Scholar] [CrossRef]
- Evans, G.W.; Palsane, M.N.; Lepore, S.J.; Martin, J. Residential density and psychological health: The mediating effects of social support. J. Personal. Soc. Psychol. 1989, 57, 994. [Google Scholar] [CrossRef]
- Singh, A.; Daniel, L.; Baker, E.; Bentley, R. Housing disadvantage and poor mental health: A systematic review. Am. J. Prev. Med. 2019, 57, 262–272. [Google Scholar] [CrossRef]
- Bentley, R.J.; Pevalin, D.; Baker, E.; Mason, K.; Reeves, A.; Beer, A. Housing affordability, tenure and mental health in Australia and the United Kingdom: A comparative panel analysis. Hous. Stud. 2016, 31, 208–222. [Google Scholar] [CrossRef] [Green Version]
- Park, G.R.; Seo, B.K. Revisiting the relationship among housing tenure, affordability and mental health: Do dwelling conditions matter? Health Soc. Care Community 2020, 28, 2225–2232. [Google Scholar] [CrossRef] [PubMed]
- Suglia, S.F.; Duarte, C.S.; Sandel, M.T. Housing quality, housing instability, and maternal mental health. J. Urban Health 2011, 88, 1105–1116. [Google Scholar] [CrossRef] [Green Version]
- Sarkar, C.; Webster, C.; Gallacher, J. Healthy Cities: Public Health through Urban Planning; Edward Elgar Publishing: Cheltenham, UK, 2014. [Google Scholar]
- Kearns, A.; Whitley, E.; Mason, P.; Bond, L. ‘Living the high life’? Residential, social and psychosocial outcomes for high-rise occupants in a deprived context. Hous. Stud. 2012, 27, 97–126. [Google Scholar] [CrossRef]
- Kalantari, S.; Shepley, M. Psychological and social impacts of high-rise buildings: A review of the post-occupancy evaluation literature. Hous. Stud. 2021, 36, 1147–1176. [Google Scholar] [CrossRef]
- Sharifi, V.; Amin-Esmaeili, M.; Hajebi, A.; Motevalian, A.; Radgoodarzi, R.; Hefazi, M.; Rahimi-Movaghar, A. Twelve-month prevalence and correlates of psychiatric disorders in Iran: The Iranian Mental Health Survey, 2011. Arch. Iran. Med. 2015, 18, 76. [Google Scholar]
- Romans, S.; Cohen, M.; Forte, T. Rates of depression and anxiety in urban and rural Canada. Soc. Psychiatry Psychiatr. Epidemiol. 2011, 46, 567–575. [Google Scholar] [CrossRef] [PubMed]
- Wiens, K.; Williams, J.V.; Lavorato, D.H.; Bulloch, A.G.; Patten, S.B. The prevalence of major depressive episodes is higher in urban regions of Canada. Can. J. Psychiatry 2017, 62, 57–61. [Google Scholar] [CrossRef] [PubMed] [Green Version]
- Zijlema, W.L.; Klijs, B.; Stolk, R.P.; Rosmalen, J.G. (Un) healthy in the city: Respiratory, cardiometabolic and mental health associated with urbanity. PLoS ONE 2015, 10, e0143910. [Google Scholar] [CrossRef]
- Chen, J.; Chen, S.; Landry, P.F.; Davis, D.S. How dynamics of urbanization affect physical and mental health in urban China. China Q. 2014, 220, 988–1011. [Google Scholar] [CrossRef]
- Wang, R.; Xue, D.; Liu, Y.; Chen, H.; Qiu, Y. The relationship between urbanization and depression in China: The mediating role of neighborhood social capital. Int. J. Equity Health 2018, 17, 105. [Google Scholar] [CrossRef] [Green Version]
- Okulicz-Kozaryn, A. Happiness and Place: Why Life is Better Outside of the City; Springer: Berlin/Heidelberg, Germany, 2015. [Google Scholar]
- Blay, S.L.; Schulz, A.J.; Mentz, G. The relationship of built environment to health-related behaviors and health outcomes in elderly community residents in a middle income country. J. Public Health Res. 2015, 4, 548. [Google Scholar] [CrossRef] [PubMed] [Green Version]
- Beyer, K.M.; Kaltenbach, A.; Szabo, A.; Bogar, S.; Nieto, F.J.; Malecki, K.M. Exposure to neighborhood green space and mental health: Evidence from the survey of the health of Wisconsin. Int. J. Environ. Res. Public Health 2014, 11, 3453–3472. [Google Scholar] [CrossRef] [PubMed] [Green Version]
- Wood, L.; Hooper, P.; Foster, S.; Bull, F. Public green spaces and positive mental health–investigating the relationship between access, quantity and types of parks and mental wellbeing. Health Place 2017, 48, 63–71. [Google Scholar] [CrossRef] [PubMed]
- Dadvand, P.; Bartoll, X.; Basagaña, X.; Dalmau-Bueno, A.; Martinez, D.; Ambros, A.; Cirach, M.; Triguero-Mas, M.; Gascon, M.; Borrell, C. Green spaces and general health: Roles of mental health status, social support, and physical activity. Environ. Int. 2016, 91, 161–167. [Google Scholar] [CrossRef] [PubMed] [Green Version]
- Simone, C.; Carolin, L.; Max, S.; Reinhold, K. Associations between community characteristics and psychiatric admissions in an urban area. Soc. Psychiatry Psychiatr. Epidemiol. 2013, 48, 1797–1808. [Google Scholar] [CrossRef]
- Khan, N.Y.; Ghafoor, N.; Iftikhar, R.; Malik, M. Urban annoyances and mental health in the city of Lahore, Pakistan. J. Urban Aff. 2012, 34, 297–315. [Google Scholar] [CrossRef]
- Miles, R.; Coutts, C.; Mohamadi, A. Neighborhood urban form, social environment, and depression. J. Urban Health 2012, 89, 1–18. [Google Scholar] [CrossRef] [PubMed] [Green Version]
- Melis, G.; Gelormino, E.; Marra, G.; Ferracin, E.; Costa, G. The effects of the urban built environment on mental health: A cohort study in a large northern Italian city. Int. J. Environ. Res. Public Health 2015, 12, 14898–14915. [Google Scholar] [CrossRef]
- Kwan, M.-P. The stationarity bias in research on the environmental determinants of health. Health Place 2021, 70, 102609. [Google Scholar] [CrossRef]
- Ng, M.K.; Yeung, T.C.; Kwan, M.P.; Tieben, H.; Lau, T.Y.T.; Zhu, J.; Xu, Y. Place qualities, sense of place and subjective well-being: A study of two typical urban neighbourhoods in Hong Kong. Cities Health 2021, 1–12. [Google Scholar] [CrossRef]
- Wang, J.; Long, R.; Chen, H.; Li, Q. Measuring the psychological security of urban residents: Construction and validation of a new scale. Front. Psychol. 2019, 10, 2423. [Google Scholar] [CrossRef] [Green Version]
- Zhang, L.; Wu, L. Effects of environmental quality perception on depression: Subjective social class as a mediator. Int. J. Environ. Res. Public Health 2021, 18, 6130. [Google Scholar] [CrossRef]
- Pedersen, E.; Waye, K.P. Wind turbine noise, annoyance and self-reported health and well-being in different living environments. Occup. Environ. Med. 2007, 64, 480–486. [Google Scholar] [CrossRef] [PubMed] [Green Version]
- Kou, L.; Tao, Y.; Kwan, M.-P.; Chai, Y. Understanding the relationships among individual-based momentary measured noise, perceived noise, and psychological stress: A geographic ecological momentary assessment (GEMA) approach. Health Place 2020, 64, 102285. [Google Scholar] [CrossRef] [PubMed]
- Dzhambov, A.M.; Markevych, I.; Tilov, B.; Arabadzhiev, Z.; Stoyanov, D.; Gatseva, P.; Dimitrova, D.D. Pathways linking residential noise and air pollution to mental ill-health in young adults. Environ. Res. 2018, 166, 458–465. [Google Scholar] [CrossRef] [PubMed]
- Tao, Y.; Kou, L.; Chai, Y.; Kwan, M.-P. Associations of co-exposures to air pollution and noise with psychological stress in space and time: A case study in Beijing, China. Environ. Res. 2021, 196, 110399. [Google Scholar] [CrossRef]
- Chen, C.; Luo, W.; Li, H.; Zhang, D.; Kang, N.; Yang, X.; Xia, Y. Impact of perception of green space for health promotion on willingness to use parks and actual use among young urban residents. Int. J. Environ. Res. Public Health 2020, 17, 5560. [Google Scholar] [CrossRef]
- Kothencz, G.; Kolcsár, R.; Cabrera-Barona, P.; Szilassi, P. Urban green space perception and its contribution to well-being. Int. J. Environ. Res. Public Health 2017, 14, 766. [Google Scholar] [CrossRef] [Green Version]
- Heerman, W.J.; Mitchell, S.J.; Thompson, J.; Martin, N.C.; Sommer, E.C.; Van Bakergem, M.; Taylor, J.L.; Buchowski, M.S.; Barkin, S.L. Parental perception of built environment characteristics and built environment use among Latino families: A cross-sectional study. BMC Public Health 2016, 16, 1–8. [Google Scholar] [CrossRef] [Green Version]
- McGinn, A.P.; Evenson, K.R.; Herring, A.H.; Huston, S.L.; Rodriguez, D.A. Exploring associations between physical activity and perceived and objective measures of the built environment. J. Urban Health 2007, 84, 162–184. [Google Scholar] [CrossRef] [Green Version]
- Lee, G.K.; Chan, E.H. Factors affecting urban renewal in high-density city: Case study of Hong Kong. J. Urban Plan. Dev. 2008, 134, 140–148. [Google Scholar] [CrossRef] [Green Version]
- He, Y.; Talamini, G.; Jiang, L. Does urban renewal impact social interaction in public open space? Evidence from Sham Shui Po, Hong Kong. Urbanie Urbanus 2021, 6, 24–35. [Google Scholar] [CrossRef]
- Mason, K.E.; Baker, E.; Blakely, T.; Bentley, R.J. Housing affordability and mental health: Does the relationship differ for renters and home purchasers? Soc. Sci. Med. 2013, 94, 91–97. [Google Scholar] [CrossRef] [PubMed]
- Bentley, R.; Baker, E.; Mason, K.; Subramanian, S.V.; Kavanagh, A.M. Association between housing affordability and mental health: A longitudinal analysis of a nationally representative household survey in Australia. Am. J. Epidemiol. 2011, 174, 753–760. [Google Scholar] [CrossRef] [PubMed] [Green Version]
- Gou, Z.; Xie, X.; Lu, Y.; Khoshbakht, M. Quality of Life (QoL) survey in Hong Kong: Understanding the importance of housing environment and needs of residents from different housing sectors. Int. J. Environ. Res. Public Health 2018, 15, 219. [Google Scholar] [CrossRef] [PubMed] [Green Version]
- Churchill, G.A.; Suprenant, C. A paradigm for developing better measures for marketing of consumer satisfaction. J. Mark. 1979, 16, 491–504. [Google Scholar]
- Taber, K.S. The use of Cronbach’s alpha when developing and reporting research instruments in science education. Res. Sci. Educ. 2018, 48, 1273–1296. [Google Scholar] [CrossRef]
- French, S.; Wood, L.; Foster, S.A.; Giles-Corti, B.; Frank, L.; Learnihan, V. Sense of community and its association with the neighborhood built environment. Environ. Behav. 2014, 46, 677–697. [Google Scholar] [CrossRef]
- Wang, P.; Goggins, W.B.; Zhang, X.; Ren, C.; Lau, K.K.L. Association of urban built environment and socioeconomic factors with suicide mortality in high-density cities: A case study of Hong Kong. Sci. Total Environ. 2020, 739, 139877. [Google Scholar] [CrossRef]
- Yang, J.; Wong, M.S.; Menenti, M.; Nichol, J. Modeling the effective emissivity of the urban canopy using sky view factor. ISPRS J. Photogramm. Remote Sens. 2015, 105, 211–219. [Google Scholar] [CrossRef]
- Guo, Y.; Liu, Y.; Lu, S.; Chan, O.F.; Chui, C.H.K.; Lum, T.Y.S. Objective and perceived built environment, sense of community, and mental wellbeing in older adults in Hong Kong: A multilevel structural equation study. Landsc. Urban Plan. 2021, 209, 104058. [Google Scholar] [CrossRef]
- Chen, J.; Chen, S. Mental health effects of perceived living environment and neighborhood safety in urbanizing China. Habitat Int. 2015, 46, 101–110. [Google Scholar] [CrossRef]
- Rugel, E.J.; Carpiano, R.M.; Henderson, S.B.; & Brauer, M. Exposure to natural space, sense of community belonging, and adverse mental health outcomes across an urban region. Environ. Res. 2019, 171, 365–377. [Google Scholar] [CrossRef]
- World Health Organization (WHO). Wellbeing Measures in Primary Health Care/the DepCare Project: Report on a WHO Meeting: Stockholm, Sweden, 12–13 February 1998; (No. WHO/EURO: 1998-4234-43993-62027); World Health Organization, Regional Office for Europe: Geneva, Switzerland, 1998. [Google Scholar]
- Topp, C.W.; Østergaard, S.D.; Søndergaard, S.; Bech, P. The WHO-5 Well-Being Index: A systematic review of the literature. Psychother. Psychosom. 2015, 84, 167–176. [Google Scholar] [CrossRef] [PubMed]
- Ma, J.; Li, C.; Kwan, M.P.; Chai, Y. A multilevel analysis of perceived noise pollution, geographic contexts and mental health in Beijing. Int. J. Environ. Res. Public Health 2018, 15, 1479. [Google Scholar] [CrossRef] [PubMed] [Green Version]
- Tao, Y.; Yang, J.; Chai, Y. The anatomy of health-supportive neighborhoods: A multilevel analysis of built environment, perceived disorder, social interaction and mental health in Beijing. Int. J. Environ. Res. Public Health 2020, 17, 13. [Google Scholar] [CrossRef] [PubMed] [Green Version]
- Kroenke, K.; Spitzer, R.L.; Williams, J.B.; Löwe, B. An ultra-brief screening scale for anxiety and depression: The PHQ–4. Psychosomatics 2009, 50, 613–621. [Google Scholar]
- Pouso, S.; Borja, Á.; Fleming, L.E.; Gómez-Baggethun, E.; White, M.P.; Uyarra, M.C. Contact with blue-green spaces during the COVID-19 pandemic lockdown beneficial for mental health. Sci. Total Environ. 2021, 756, 143984. [Google Scholar] [CrossRef]
- Jalloh, M.F.; Li, W.; Bunnell, R.E.; Ethier, K.A.; O’Leary, A.; Hageman, K.M.; Redd, J.T. Impact of Ebola experiences and risk perceptions on mental health in Sierra Leone, July 2015. BMJ Glob. Health 2018, 3, e000471. [Google Scholar] [CrossRef] [Green Version]
- Blix, I.; Birkeland, M.S.; Thoresen, S. Worry and mental health in the Covid-19 pandemic: Vulnerability factors in the general Norwegian population. BMC Public Health 2021, 21, 1–10. [Google Scholar] [CrossRef]
- Kämpfen, F.; Kohler, I.V.; Ciancio, A.; Bruine de Bruin, W.; Maurer, J.; Kohler, H.P. Predictors of mental health during the Covid-19 pandemic in the US: Role of economic concerns, health worries and social distancing. PLoS ONE 2020, 15, e0241895. [Google Scholar] [CrossRef]
- Skrondal, A.; Rabe-Hesketh, S. Structural equation modeling: Categorical variables. Encycl. Stat. Behav. Sci. 2005. [Google Scholar] [CrossRef] [Green Version]
- Weich, S.; Blanchard, M.; Prince, M.; Burton, E.; Erens, B.; Sproston, K. Mental health and the built environment: Cross–sectional survey of individual and contextual risk factors for depression. Br. J. Psychiatry 2002, 180, 428–433. [Google Scholar] [CrossRef] [PubMed]
- Guzman, V.; Garrido-Cumbrera, M.; Braçe, O.; Hewlett, D.; Foley, R. Associations of the natural and built environment with mental health and wellbeing during COVID-19: Irish perspectives from the GreenCOVID study. Lancet Glob. Health 2021, 9, S20. [Google Scholar] [CrossRef]
- Moore, T.; Kesten, J.; López-López, J.A.; Ijaz, S.; McAleenan, A.; Richards, A.; Gray, S.; Savović, J.; Audrey, S. The effects of changes to the built environment on the mental health and well-being of adults: Systematic review. Health Place 2018, 53, 237–257. [Google Scholar] [CrossRef] [PubMed]
- Domènech-Abella, J.; Switsers, L.; Mundó, J.; Dierckx, E.; Dury, S.; De Donder, L. The association between perceived social and physical environment and mental health among older adults: Mediating effects of loneliness. Aging Ment. Health 2021, 25, 962–968. [Google Scholar] [CrossRef]
- Tran, B.-L.; Chang, C.-C.; Hsu, C.-S.; Chen, C.-C.; Tseng, W.-C.; Hsu, S.-H. Threshold Effects of PM2. 5 exposure on particle-related mortality in China. Int. J. Environ. Res. Public Health 2019, 16, 3549. [Google Scholar] [CrossRef] [Green Version]
- Wu, X.; Tao, T.; Cao, J.; Fan, Y.; Ramaswami, A. Examining threshold effects of built environment elements on travel-related carbon-dioxide emissions. Transp. Res. Part D Transp. Environ. 2019, 75, 1–12. [Google Scholar] [CrossRef]
- Zhang, L.; Zhou, S.; Kwan, M.-P.; Chen, F.; Dai, Y. The threshold effects of bus micro-environmental exposures on passengers’ momentary mood. Transp. Res. Part D Transp. Environ. 2020, 84, 102379. [Google Scholar] [CrossRef]


| Housing Type | SSP | TSW |
|---|---|---|
| Public rental housing | 35.0% | 58.7% |
| Subsidized Home Ownership Housing | 5.0% | 20.8% |
| Private permanent housing | 59.0% | 20.5% |
| Others (Temporary housing, non-residential housing, collective housing) | 1.0% | 0.0% |
| Overall | 100% | 100% |
| Gender/Community | Overall | SSP | TSW |
|---|---|---|---|
| Female | 38.9 (12.4) | 38.1 (11.2) | 39.7 (13.6) |
| Male | 33.9 (11.2) | 37.5 (12.8) | 30.7 (10.3) |
| Overall | 36.6 (12.5) | 37.8 (11.9) | 35.5 (12.9) |
| Variables of Housing Characteristics | Participants’ Responses | Coded Value |
|---|---|---|
| Housing tenure | Rented | 1 |
| Owned with a mortgage | 2 | |
| Owned without a mortgage | 3 | |
| Housing affordability stress | Monthly mortgage or rent for the residential unit/monthly household income | Continuous |
| Type of housing | Temporary or non-residential housing | 1 |
| Sub-divided flat | 2 | |
| Public rental housing | 3 | |
| Subsidized homeownership housing | 4 | |
| Private permanent housing | 5 | |
| Living area per person | Size of residential unit/number of person living in the residential unit | Continuous |
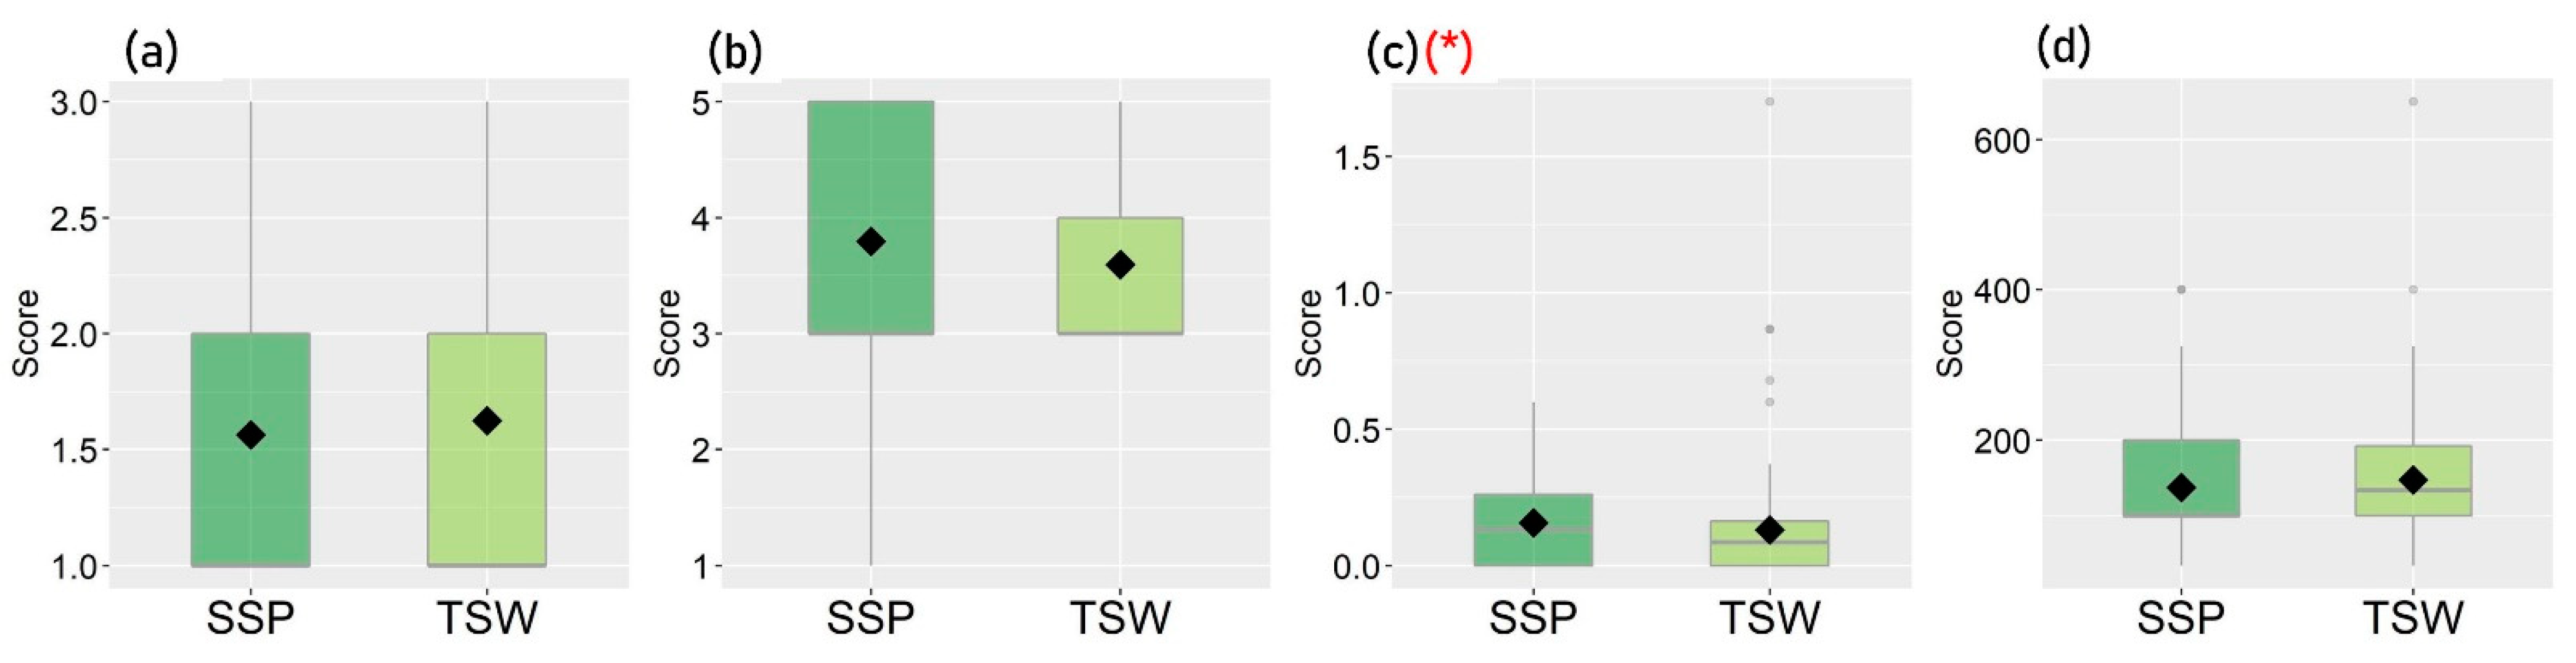
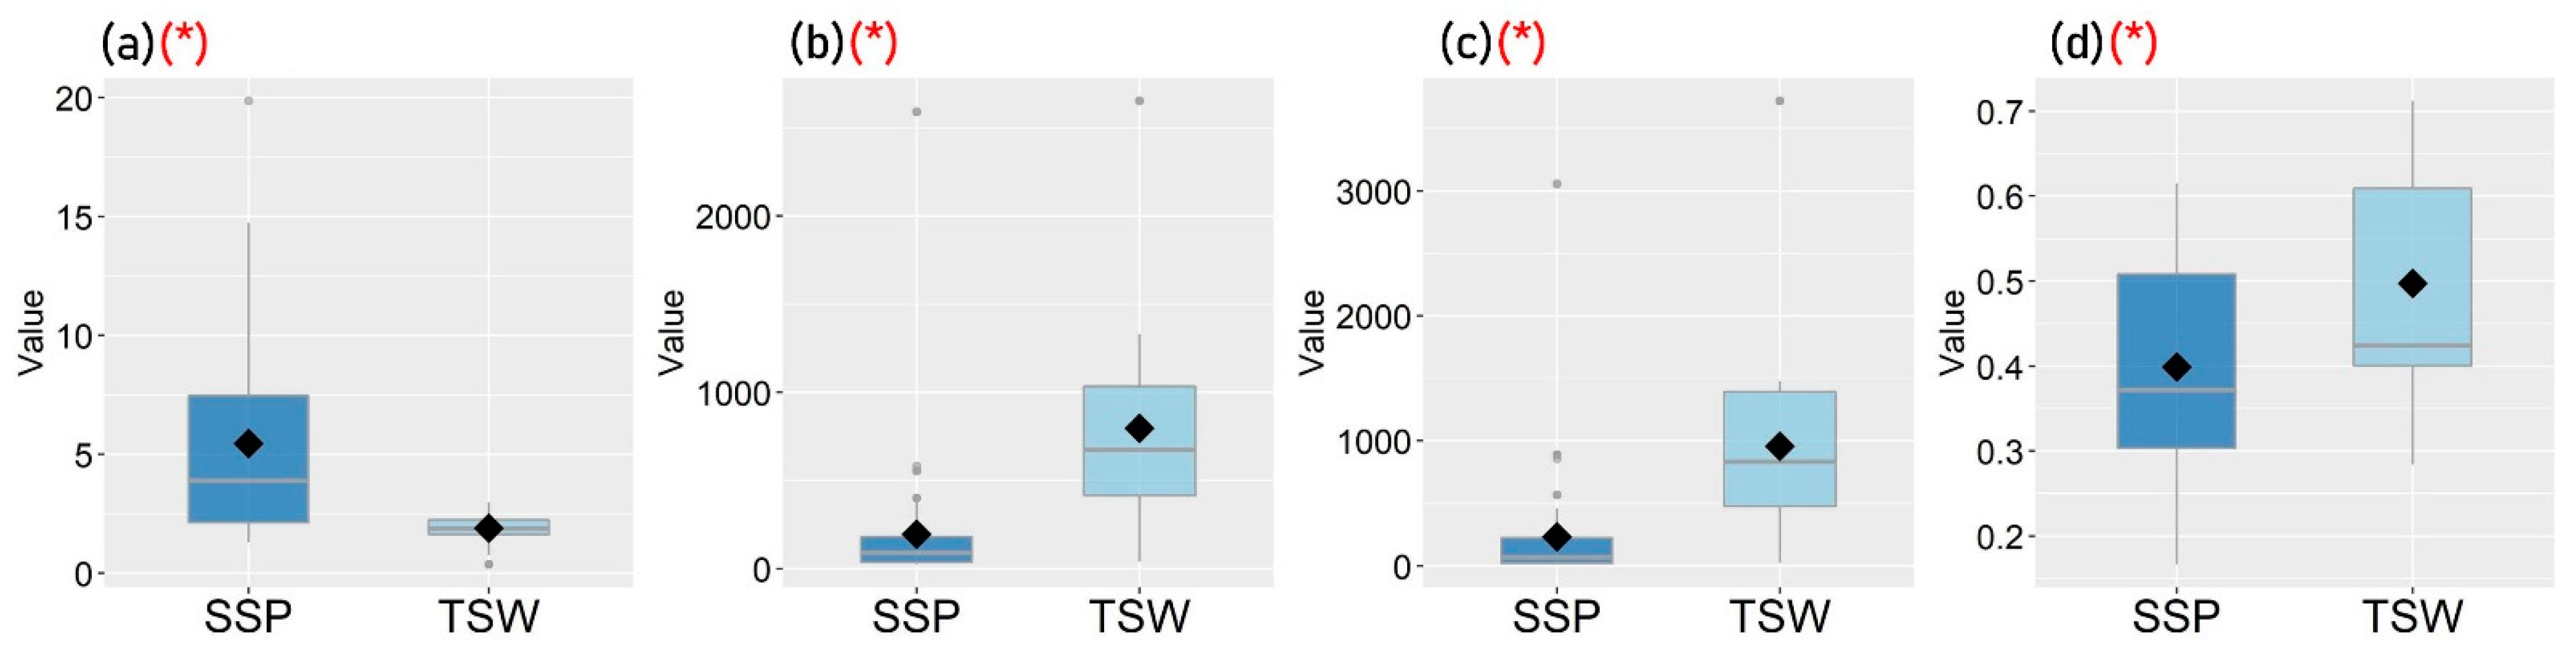
| SSP | TSW | |
|---|---|---|
| Building density (count/10,000 m2) | 5.45 (4.11) | 1.90 (0.58) |
| Sky view factor | 197.1 (366.3) | 797.1 (493.8) |
| Greenspaces | 231.5 (459.6) | 959.1 (667.9) |
| LUMI | 0.40 (0.12) | 0.49 (0.12) |
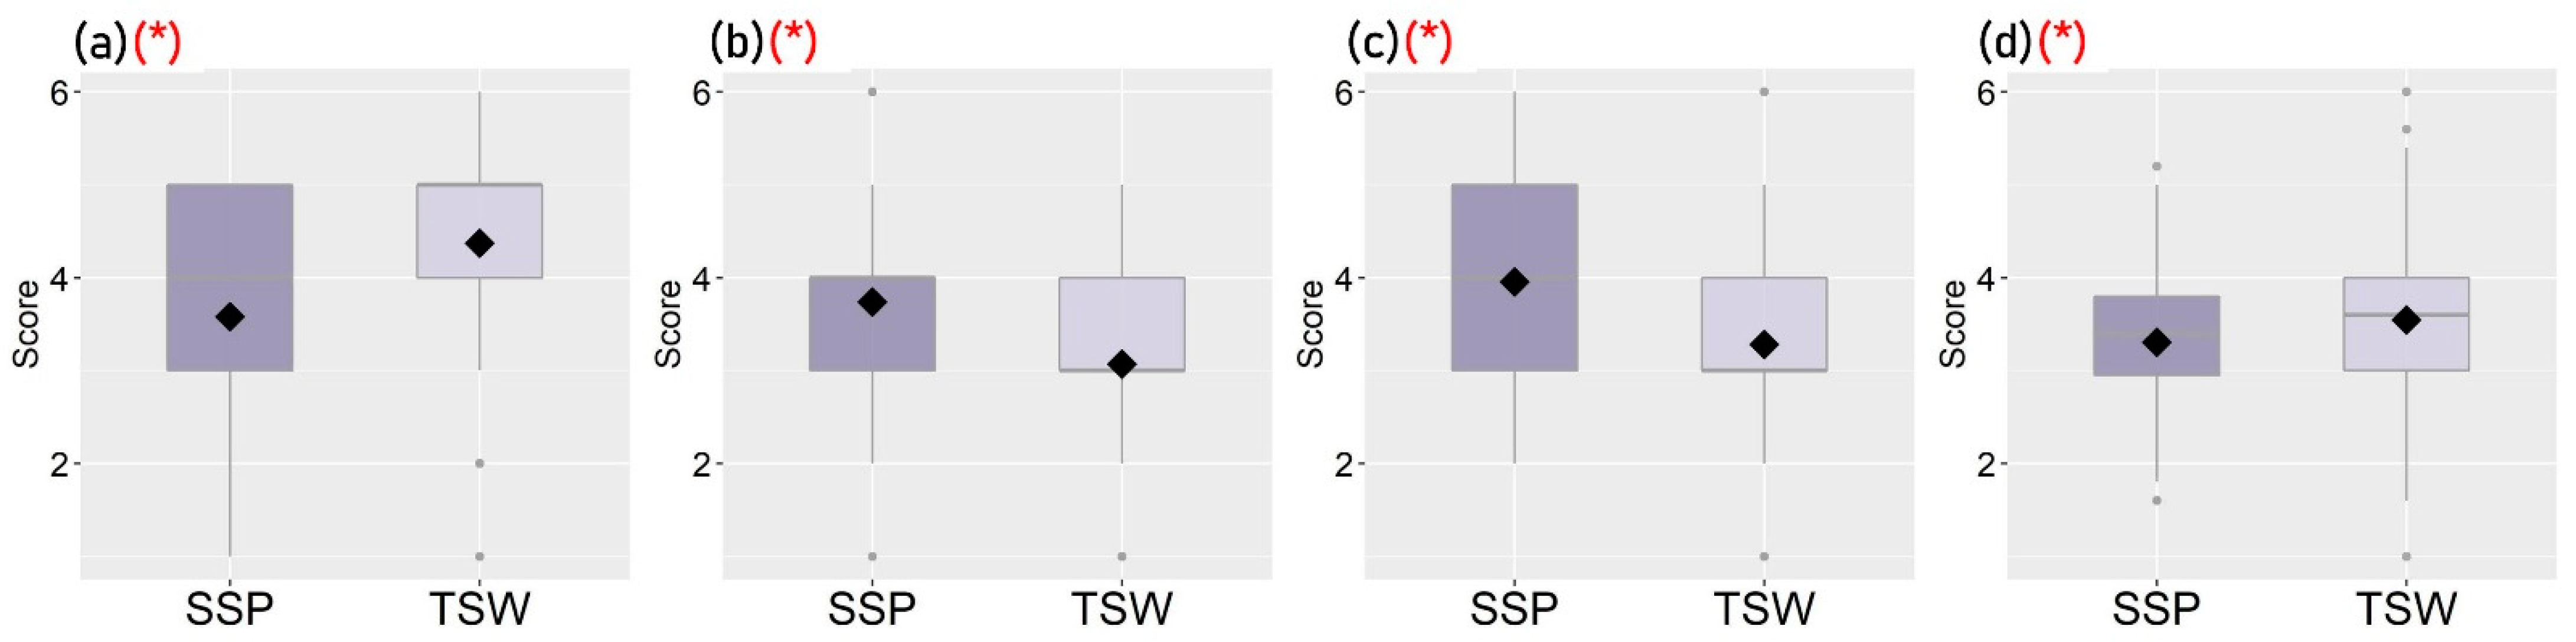
| Variables | Questions | Coded Values of the Scale (1 to 6) |
|---|---|---|
| Overall satisfaction with the living environment | Overall, to what extent are you satisfied with your living environment? | 1-Dissatisfied, 6-Very satisfied |
| Perceived air pollution level | To what extent do you think the air pollution in your neighborhood is serious? | 1-No pollution/noise problem, 6-Very serious |
| Perceived noise level | To what extent do you think the noises in your neighborhood are serious? | |
| Sense of community | People in the community are willing to help their neighbors | 1-Totally disagree, 6-Totally agree |
| This is a closely related community | ||
| People in this community can be trusted | ||
| People get along well in this community | ||
| People in this community can deal with problems together |
| Mental Health Variables | Questions or Response Items |
|---|---|
| Happiness and well-being: Please answer the following questions based on your feelings in the past two weeks. | I have felt cheerful and in good spirits |
| I have felt calm and relaxed | |
| I have felt active and vigorous | |
| I woke up feeling fresh and rested | |
| My daily life has been filled with things that interest me | |
| Stress: Over the past one year, have you been bothered by these problems? | Stressed |
| Have trouble in sleeping | |
| Regular fatigue | |
| Headache | |
| Anxiety and depression: Over the past two weeks, have you been bothered by these problems? | Feeling nervous, anxious, or on edge |
| Not being able to stop or control worrying | |
| Feeling down, depressed, or hopeless | |
| Little interest or pleasure in doing things | |
| Worries: Over the past year, how has your life been affected by COVID-19 pandemic? | Worry about unemployment |
| Worry about decreasing income | |
| More family conflicts |
| Variable | Description | SSP (n = 109) | TSW (n = 112) | ||
|---|---|---|---|---|---|
| n | Proportion | n | Proportion | ||
| Gender | Male | 48 | 44.04% | 52 | 46.43% |
| Female | 61 | 55.96% | 60 | 53.57% | |
| Age | 18–24 | 17 | 15.60% | 24 | 21.43% |
| 25–44 | 53 | 48.62% | 54 | 48.21% | |
| 45–64 | 39 | 35.78% | 34 | 30.36% | |
| Monthly household income | Less than HKD 9999 | 12 | 11.01% | 9 | 8.04% |
| HKD 10,000–19,999 | 37 | 33.94% | 23 | 20.53% | |
| HKD 20,000–29,999 | 20 | 18.35% | 25 | 22.32% | |
| HKD 30,000–39,000 | 14 | 12.85% | 24 | 21.43% | |
| More than HKD 40,000 | 26 | 23.85% | 31 | 27.68% | |
| Housing type | Public rental housing | 46 | 42.20% | 61 | 54.46% |
| Subsidized home ownership housing | 4 | 3.67% | 35 | 31.25% | |
| Private permanent housing | 49 | 44.95% | 16 | 14.29% | |
| Others (subdivided flat, etc.) | 10 | 9.17% | 0 | 0.00% | |
| Overall | 109 | 100% | 112 | 100% | |
| Models | Chi-Square/DF | GFI | CFI | AGFI | RMSEA |
|---|---|---|---|---|---|
| Model 1 | 2.672 | 0.867 | 0.805 | 0.820 | 0.087 |
| Model 2 | 2.515 | 0.874 | 0.824 | 0.829 | 0.083 |
| Model 3 | 2.722 | 0.862 | 0.796 | 0.814 | 0.089 |
| Proposed Model | 2.202 | 0.906 | 0.873 | 0.862 | 0.074 |
Publisher’s Note: MDPI stays neutral with regard to jurisdictional claims in published maps and institutional affiliations. |
© 2022 by the authors. Licensee MDPI, Basel, Switzerland. This article is an open access article distributed under the terms and conditions of the Creative Commons Attribution (CC BY) license (https://creativecommons.org/licenses/by/4.0/).
Share and Cite
Kan, Z.; Kwan, M.-P.; Ng, M.K.; Tieben, H. The Impacts of Housing Characteristics and Built-Environment Features on Mental Health. Int. J. Environ. Res. Public Health 2022, 19, 5143. https://doi.org/10.3390/ijerph19095143
Kan Z, Kwan M-P, Ng MK, Tieben H. The Impacts of Housing Characteristics and Built-Environment Features on Mental Health. International Journal of Environmental Research and Public Health. 2022; 19(9):5143. https://doi.org/10.3390/ijerph19095143
Chicago/Turabian StyleKan, Zihan, Mei-Po Kwan, Mee Kam Ng, and Hendrik Tieben. 2022. "The Impacts of Housing Characteristics and Built-Environment Features on Mental Health" International Journal of Environmental Research and Public Health 19, no. 9: 5143. https://doi.org/10.3390/ijerph19095143
APA StyleKan, Z., Kwan, M.-P., Ng, M. K., & Tieben, H. (2022). The Impacts of Housing Characteristics and Built-Environment Features on Mental Health. International Journal of Environmental Research and Public Health, 19(9), 5143. https://doi.org/10.3390/ijerph19095143