
Incentive Mechanisms for Carbon Emission Abatement Considering Consumers’ Low-Carbon Awareness under Cap-and-Trade Regulation


Abstract
:1. Introduction
2. Literature Review
2.1. Low-Carbon Supply Chains
2.2. Cooperation and Coordination in Supply Chain
2.3. Summary of the Literature Review
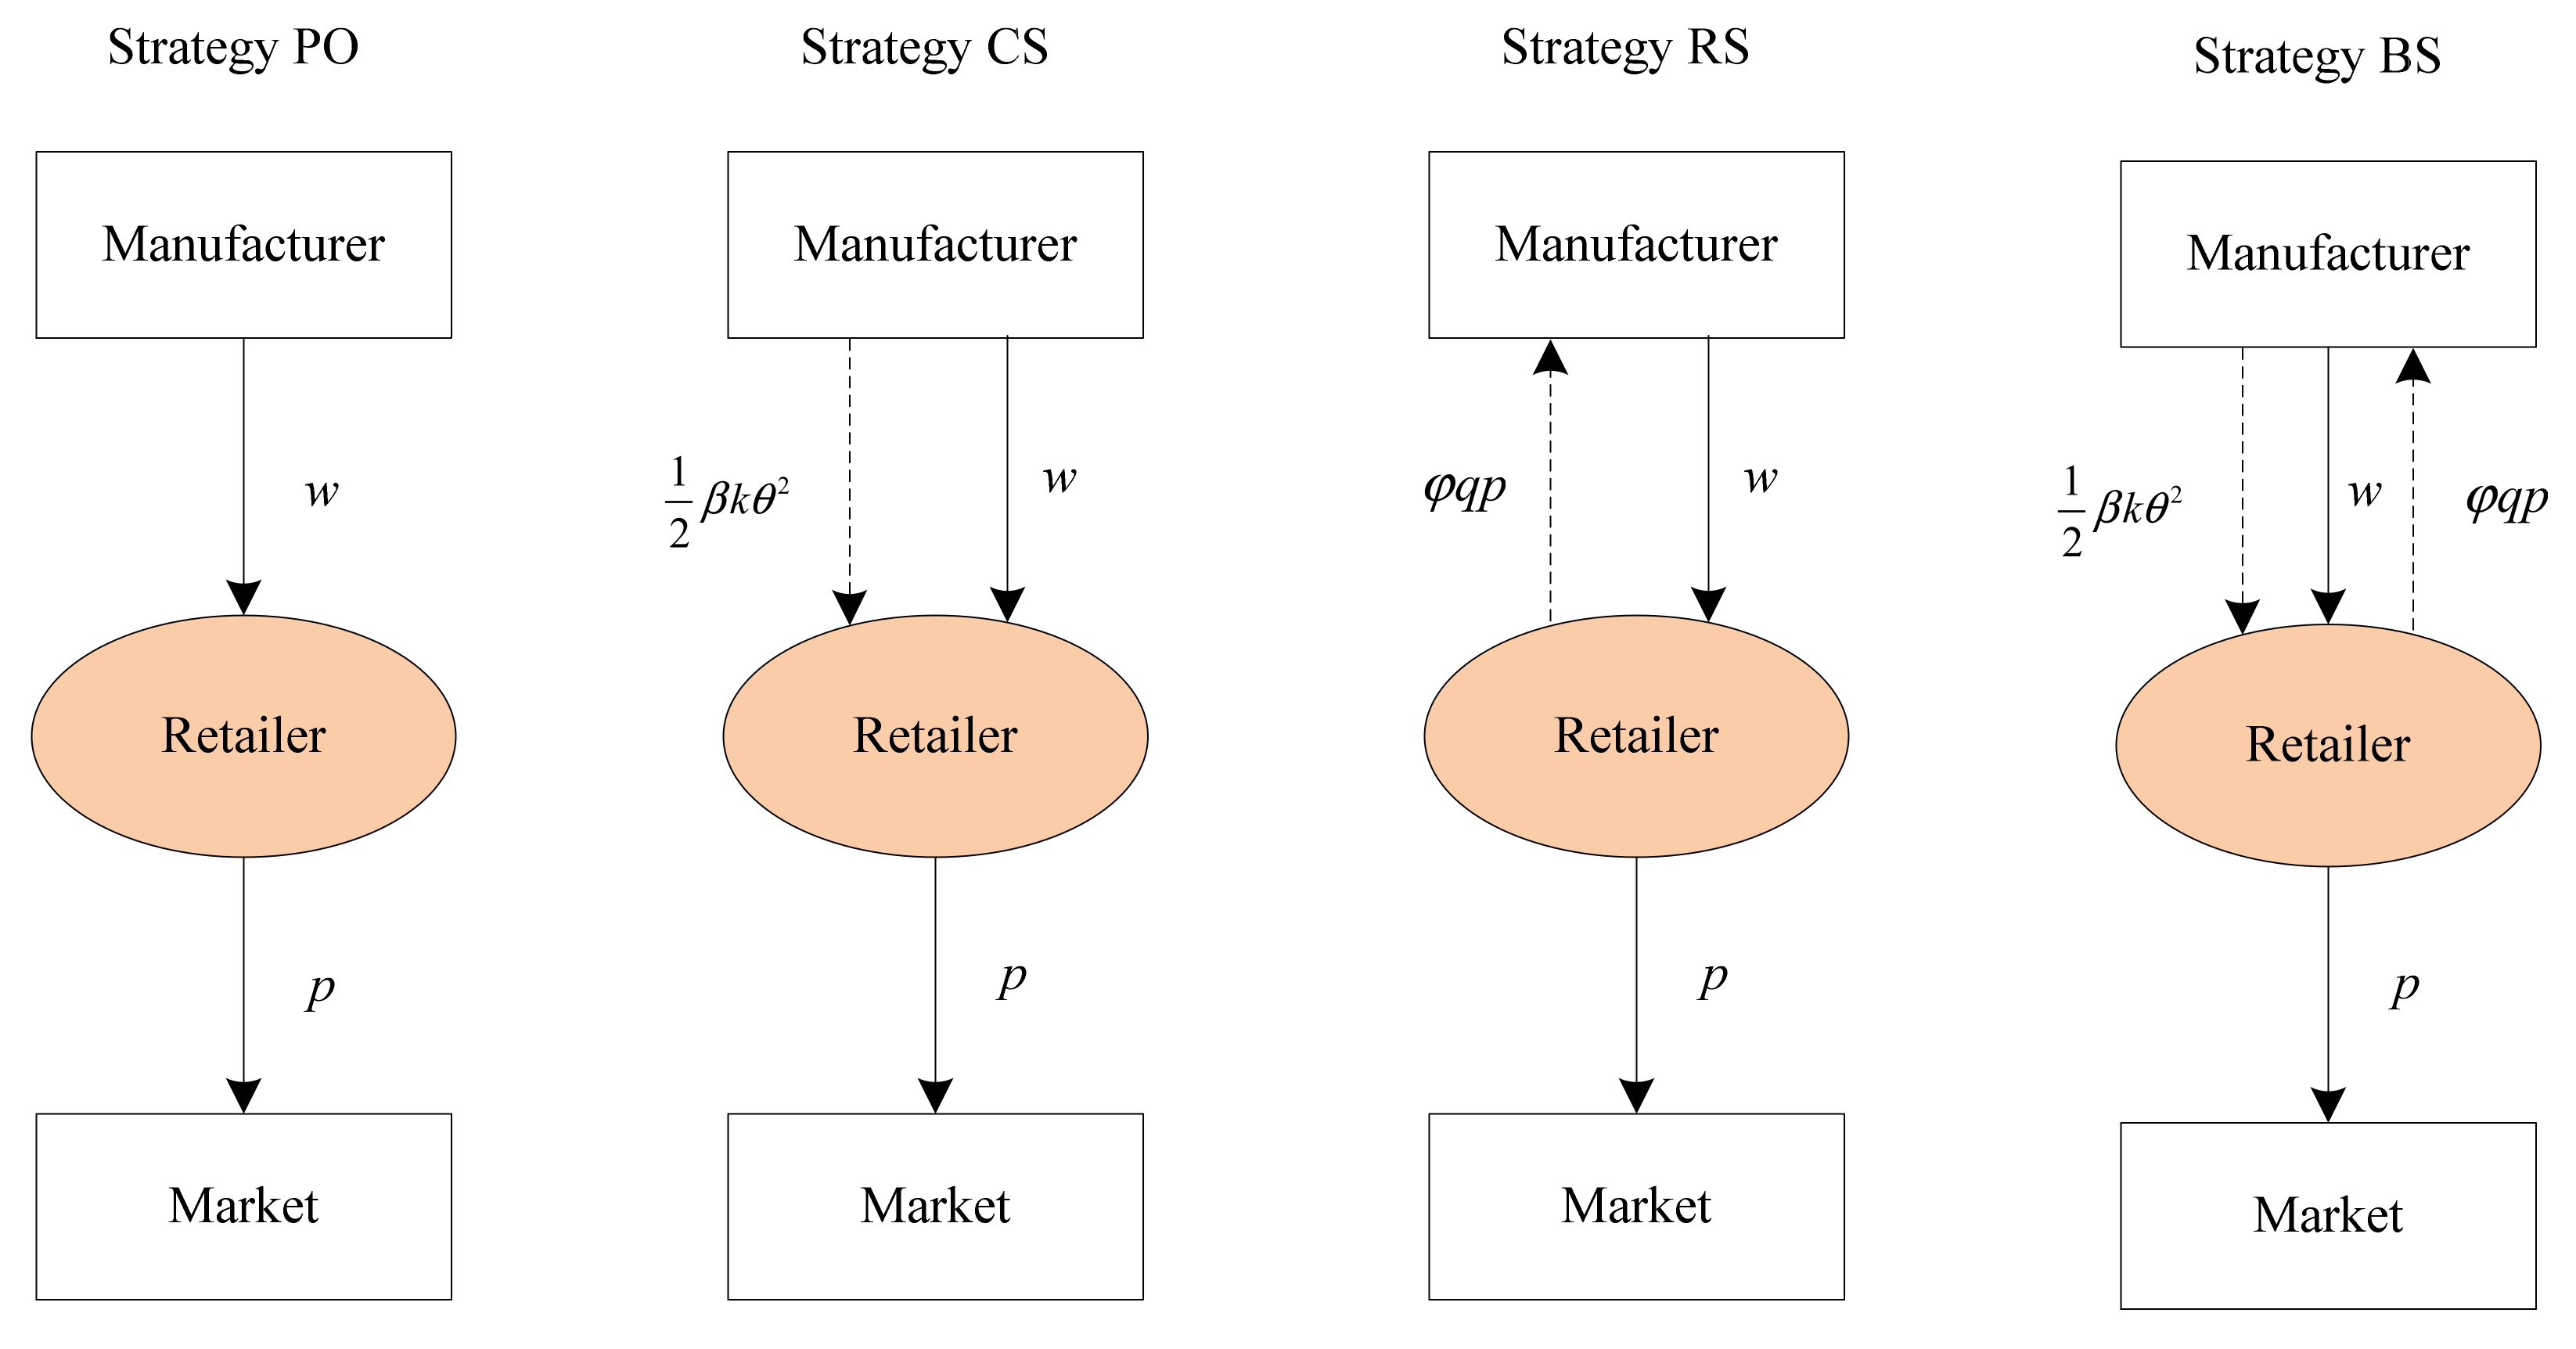
3. Model Descriptions
- (1)
- Price-only strategy (Strategy PO): This strategy corresponds to the scenario where and . In this strategy, the retailer shares neither the investment cost of CEA technology nor her revenue with the manufacturer. The manufacturer and retailer make independent decisions to maximize their own profit.
- (2)
- Cost-sharing strategy (Strategy CS): This strategy corresponds to the scenario where and . In this strategy, in order to stimulate the manufacturer to invest in developing low-carbon technology to produce low-carbon products, the retailer shares proportion of the total investment cost of CEA technology.
- (3)
- Revenue-sharing strategy (Strategy RS): This strategy corresponds to the scenario where and . Unlike Strategy CS, in this strategy, the downstream retailer shares proportion of her revenue with the upstream manufacturer.
- (4)
- Both-sharing strategy (Strategy BS): This strategy corresponds to the scenario where and . Strategy BS is a combination of Strategy CS and Strategy RS. In the BS strategy, the retailer shares both the investment cost of CEA technology and her revenue with her upstream manufacturer.
4. Equilibrium Solutions
4.1. Price-Only Strategy
- (i)
- (ii)
- .
4.2. Cost-Sharing Strategy
- (i)
- (ii)
- .
4.3. Revenue-Sharing Strategy
- (i)
- (ii)
- .
4.4. Both-Sharing Strategy
- (i)
- ;
- (ii)
- ;
- (iii)
- .
5. Full Channel Coordination
5.1. Centralized Supply Chain
5.2. Two-Part Tariff Contract
6. Comparisons and Analyses
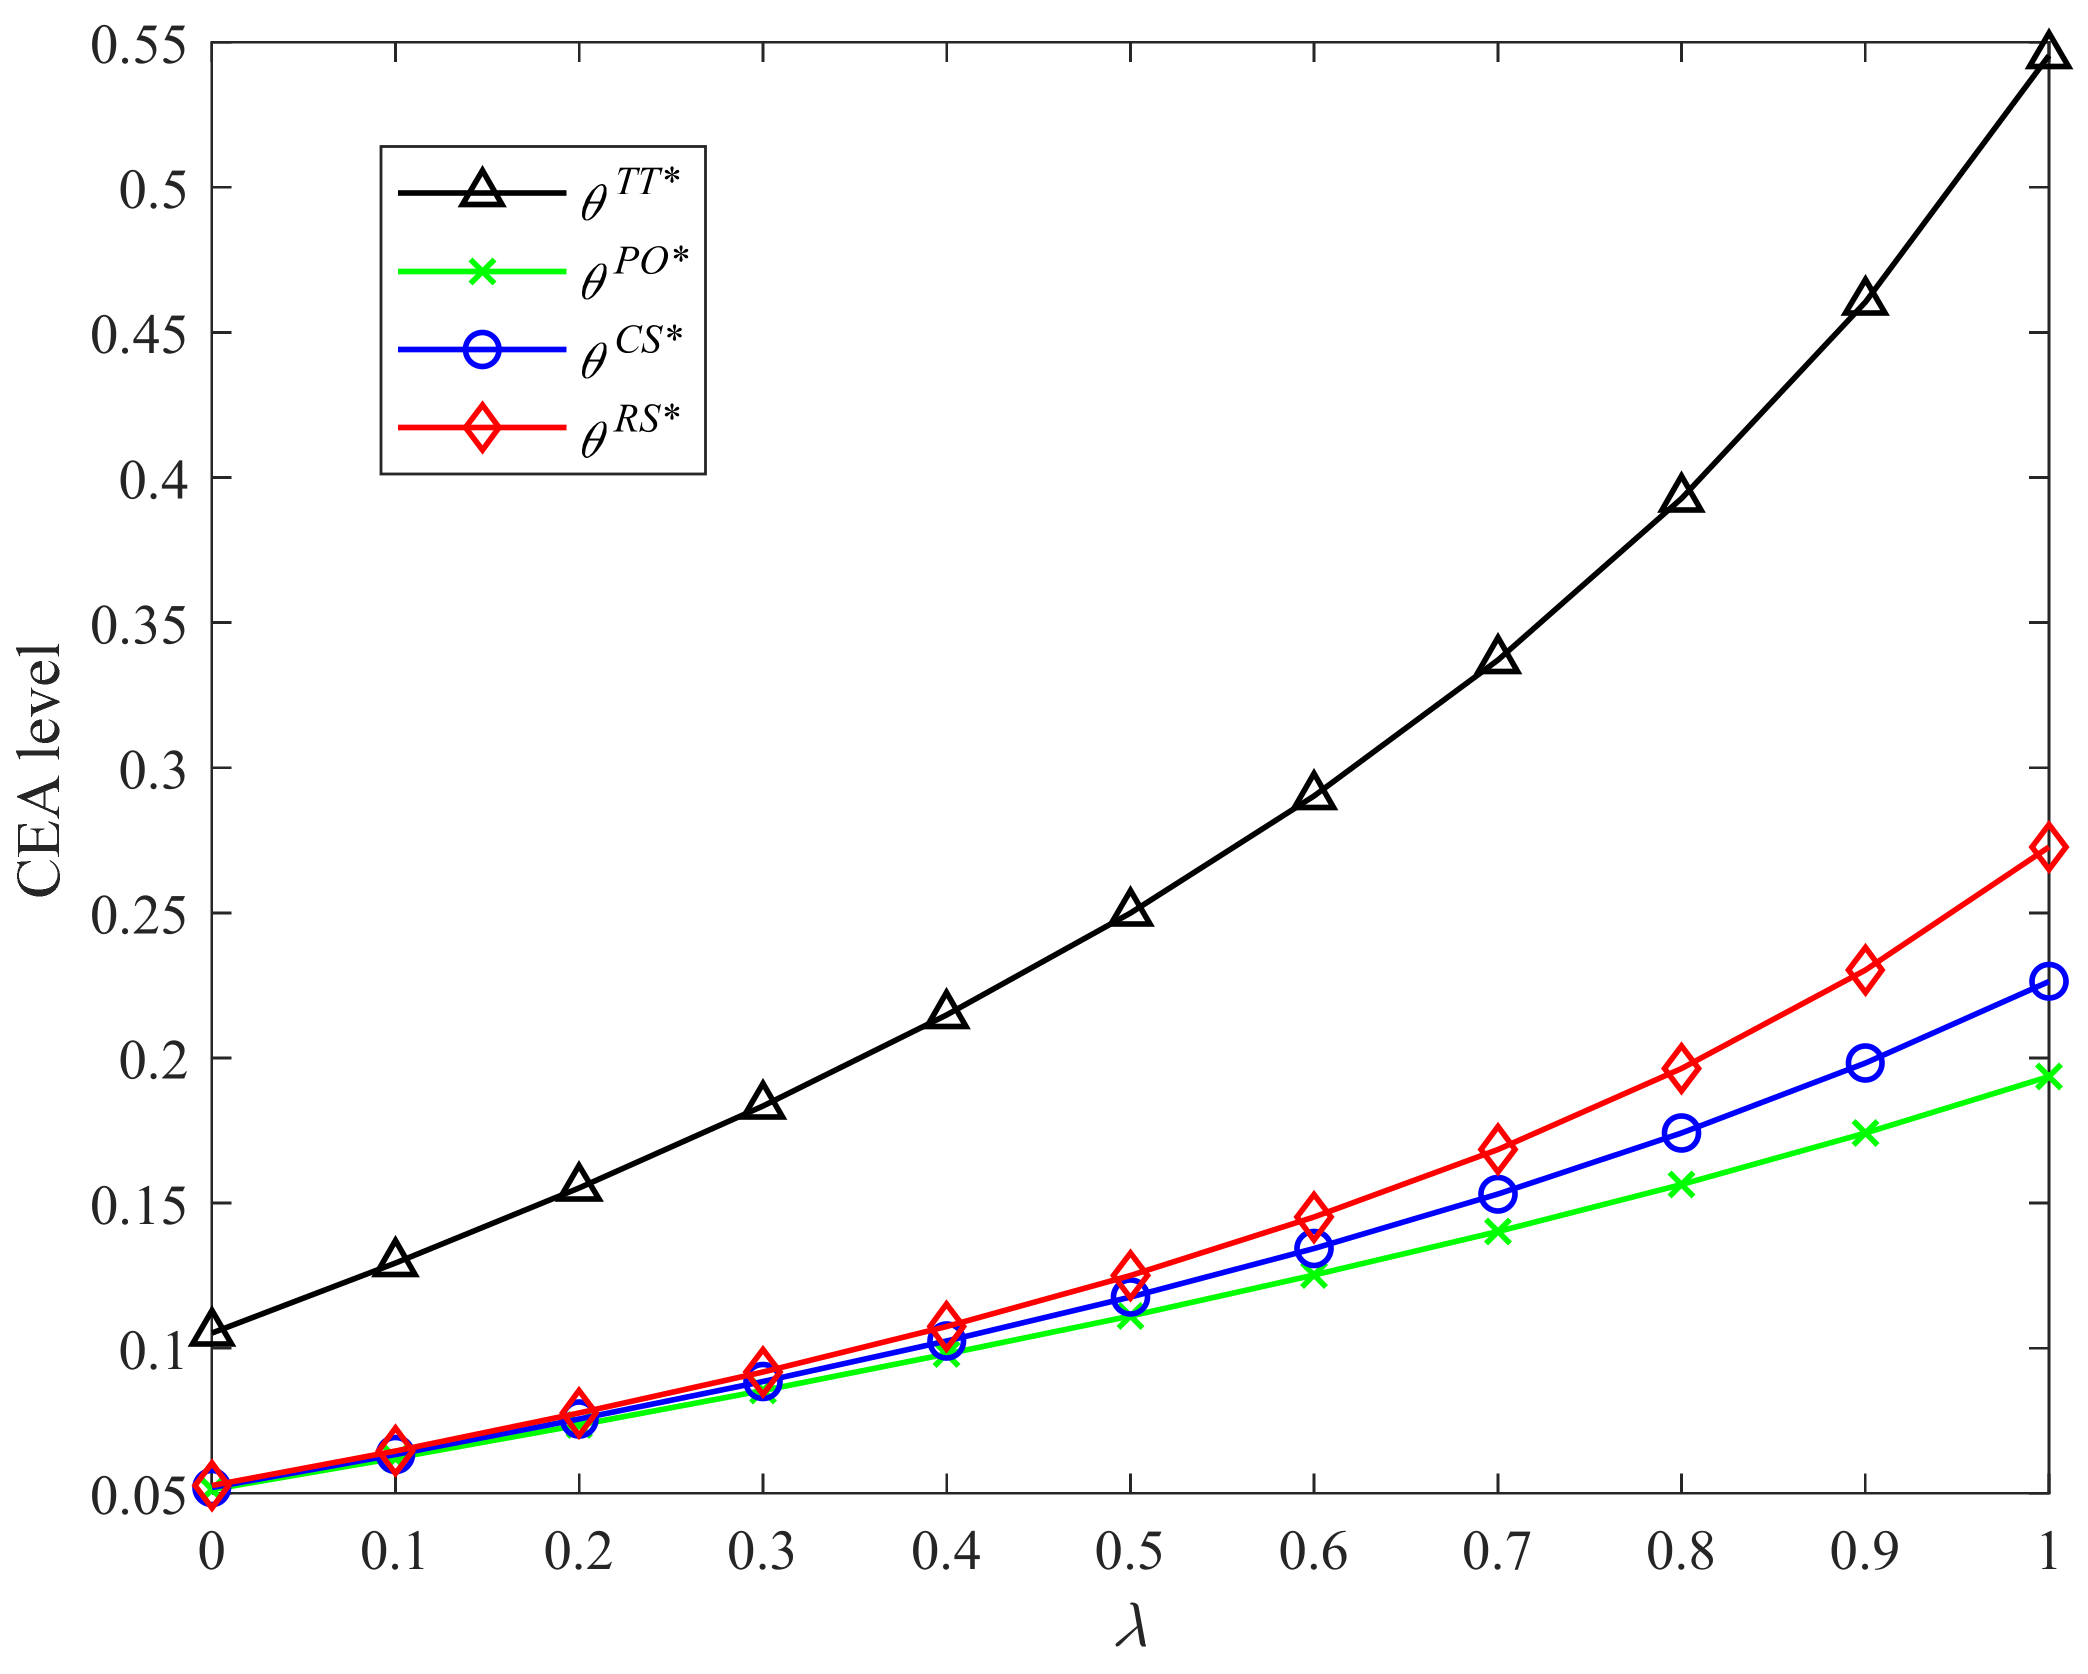
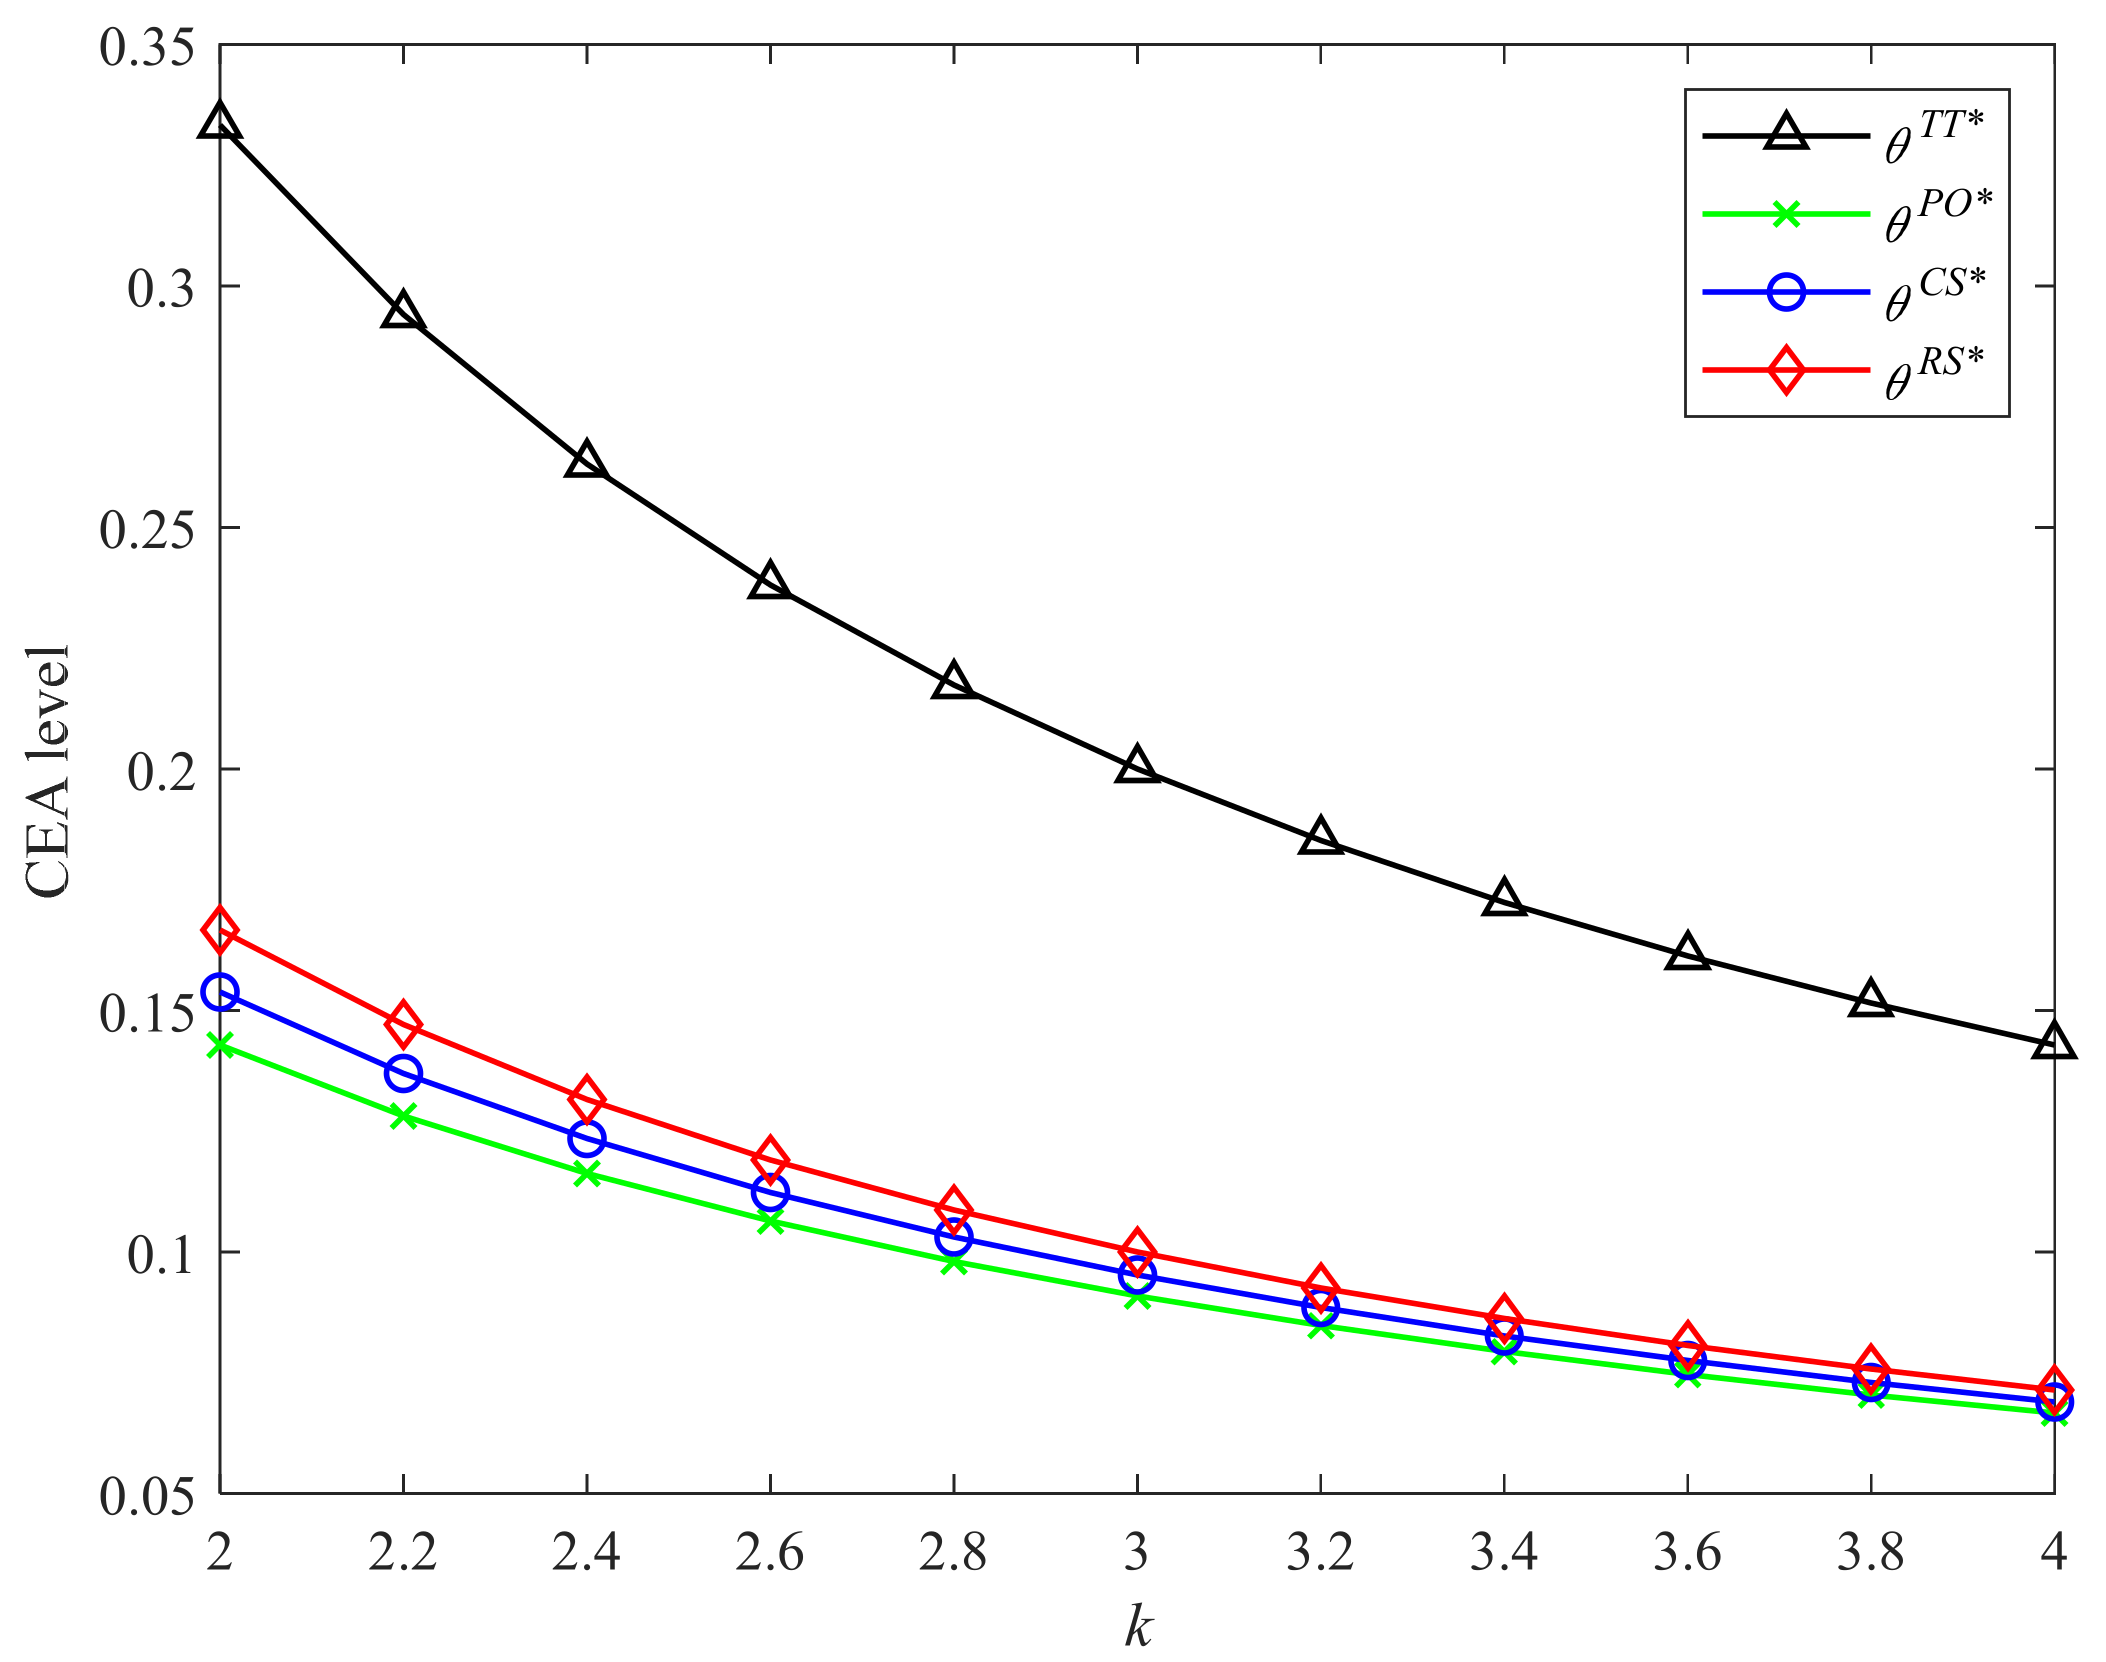
6.1. Impact of Incentive Strategies on the Manufacturer’s Carbon Emission Abatement
- (i)
- ;
- (ii)
- ;
- (iii)
- ;
- (iv)
- .
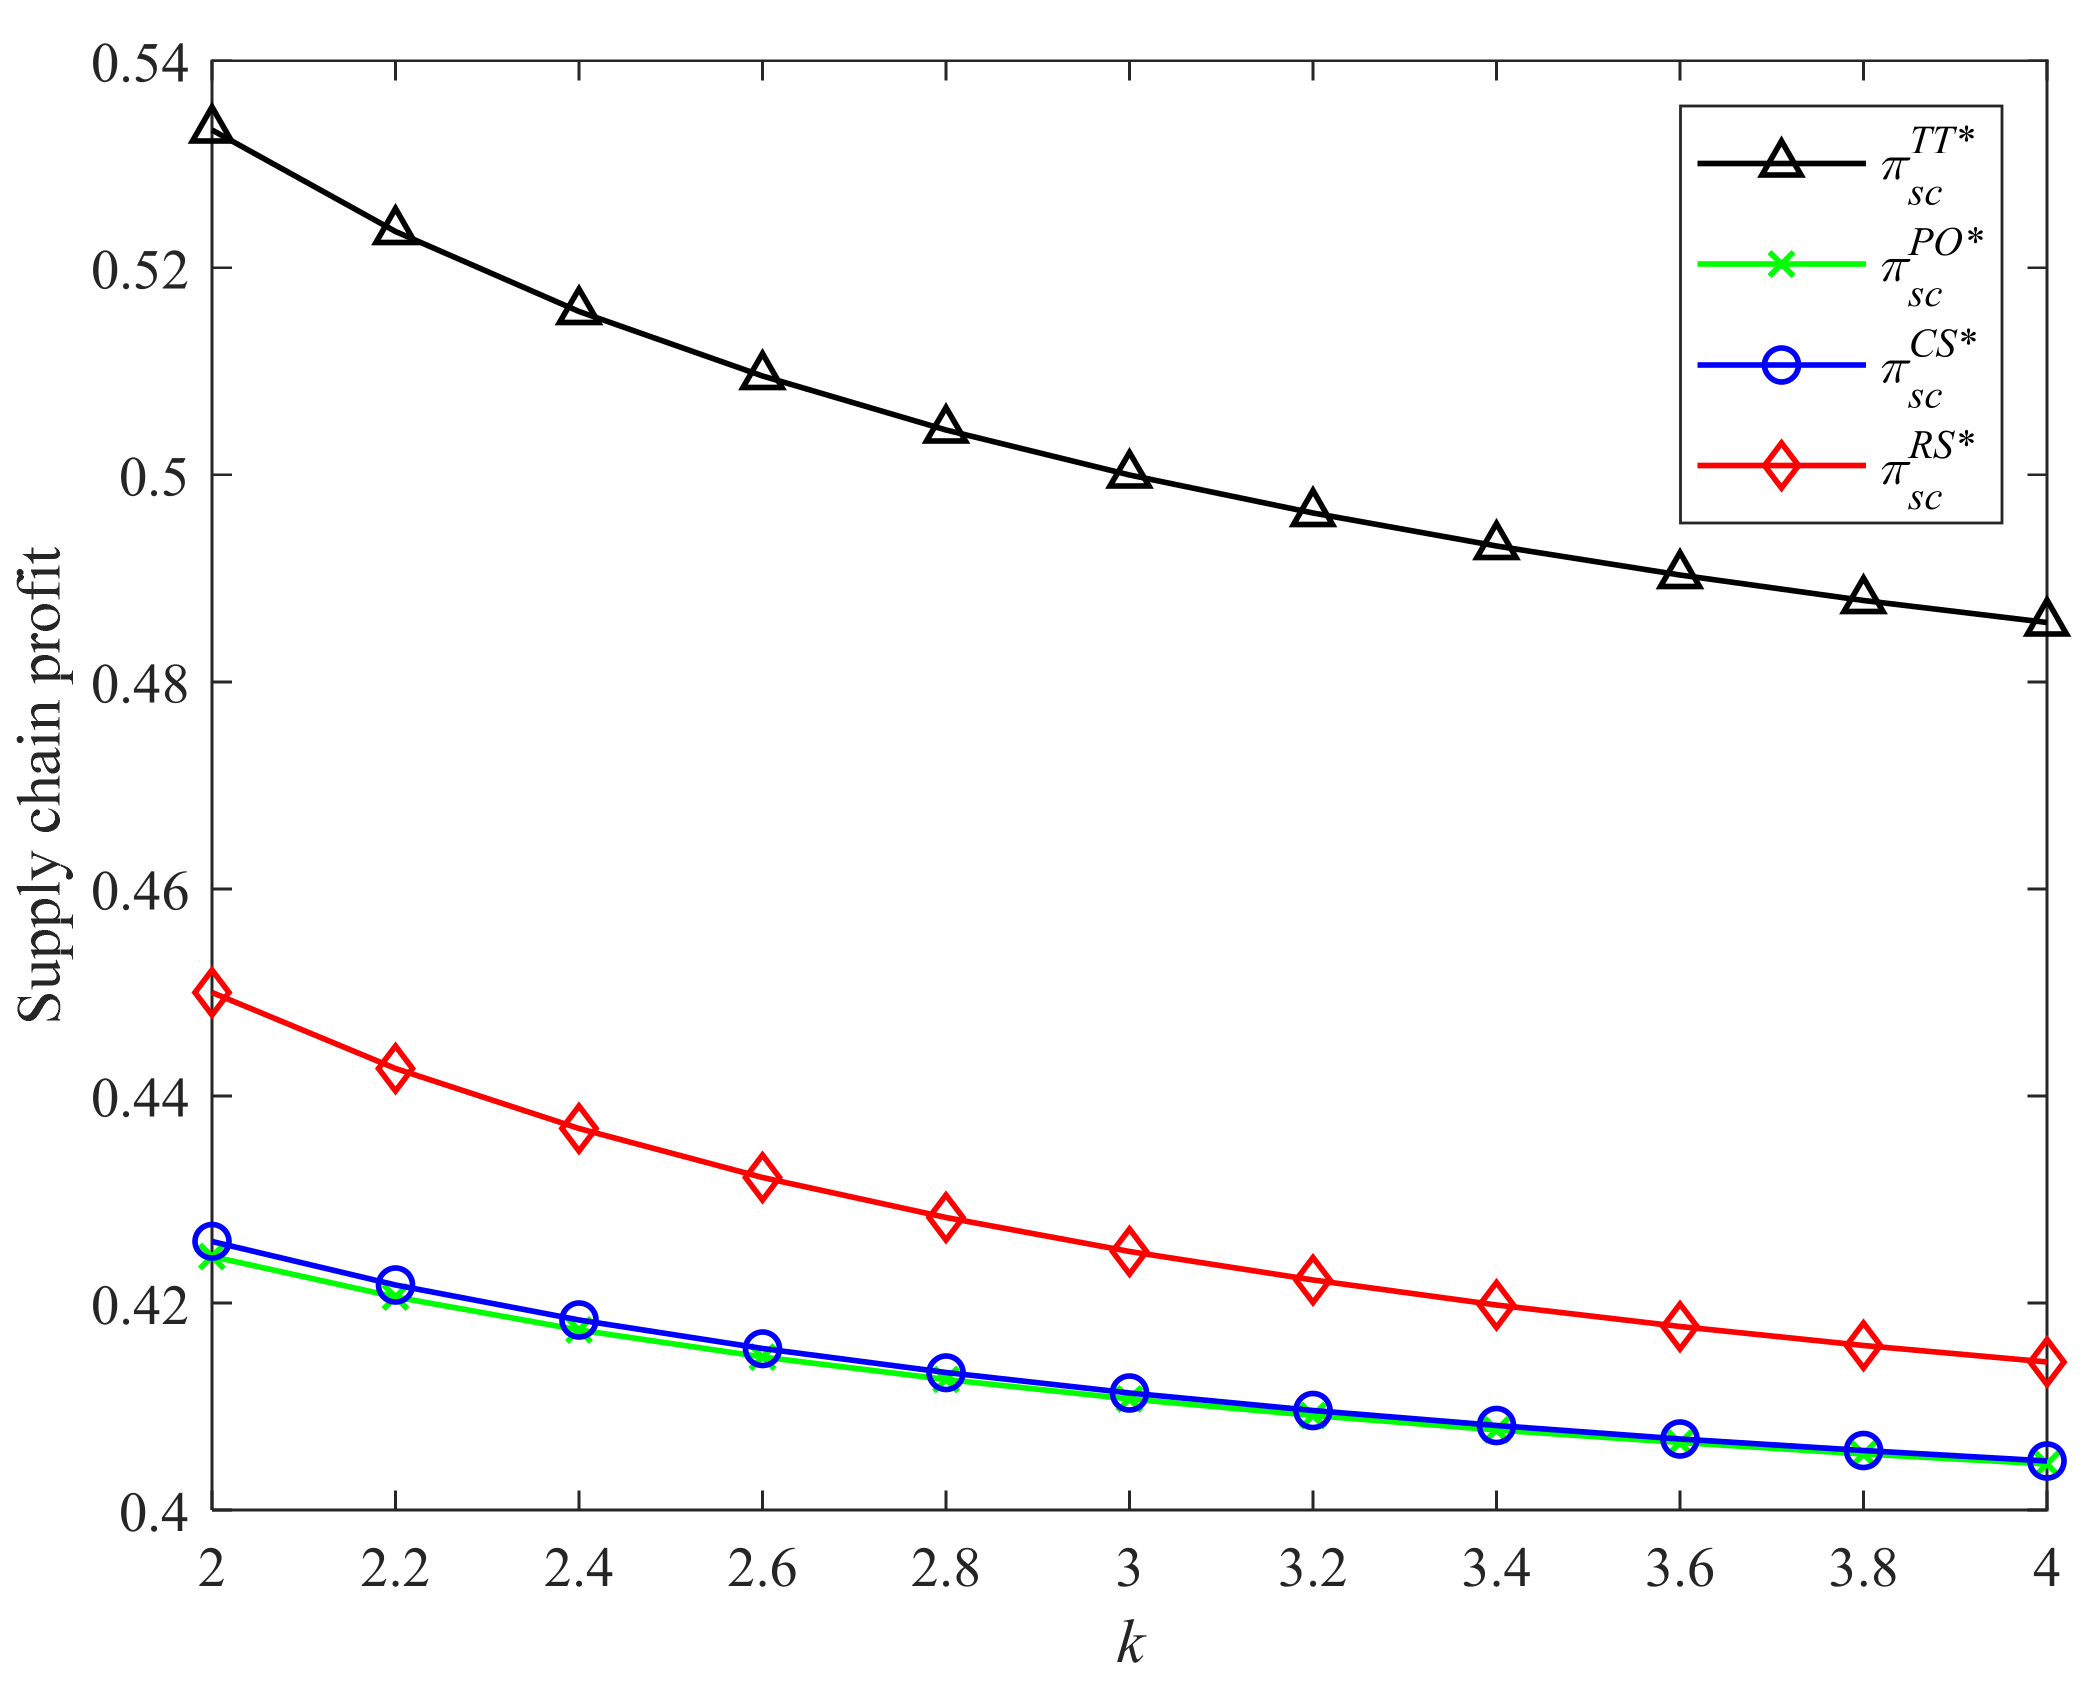
6.2. Equilibrium Incentive Strategy Preference and Choice
- (i)
- ;
- (ii)
- ;
- (iii)
- .
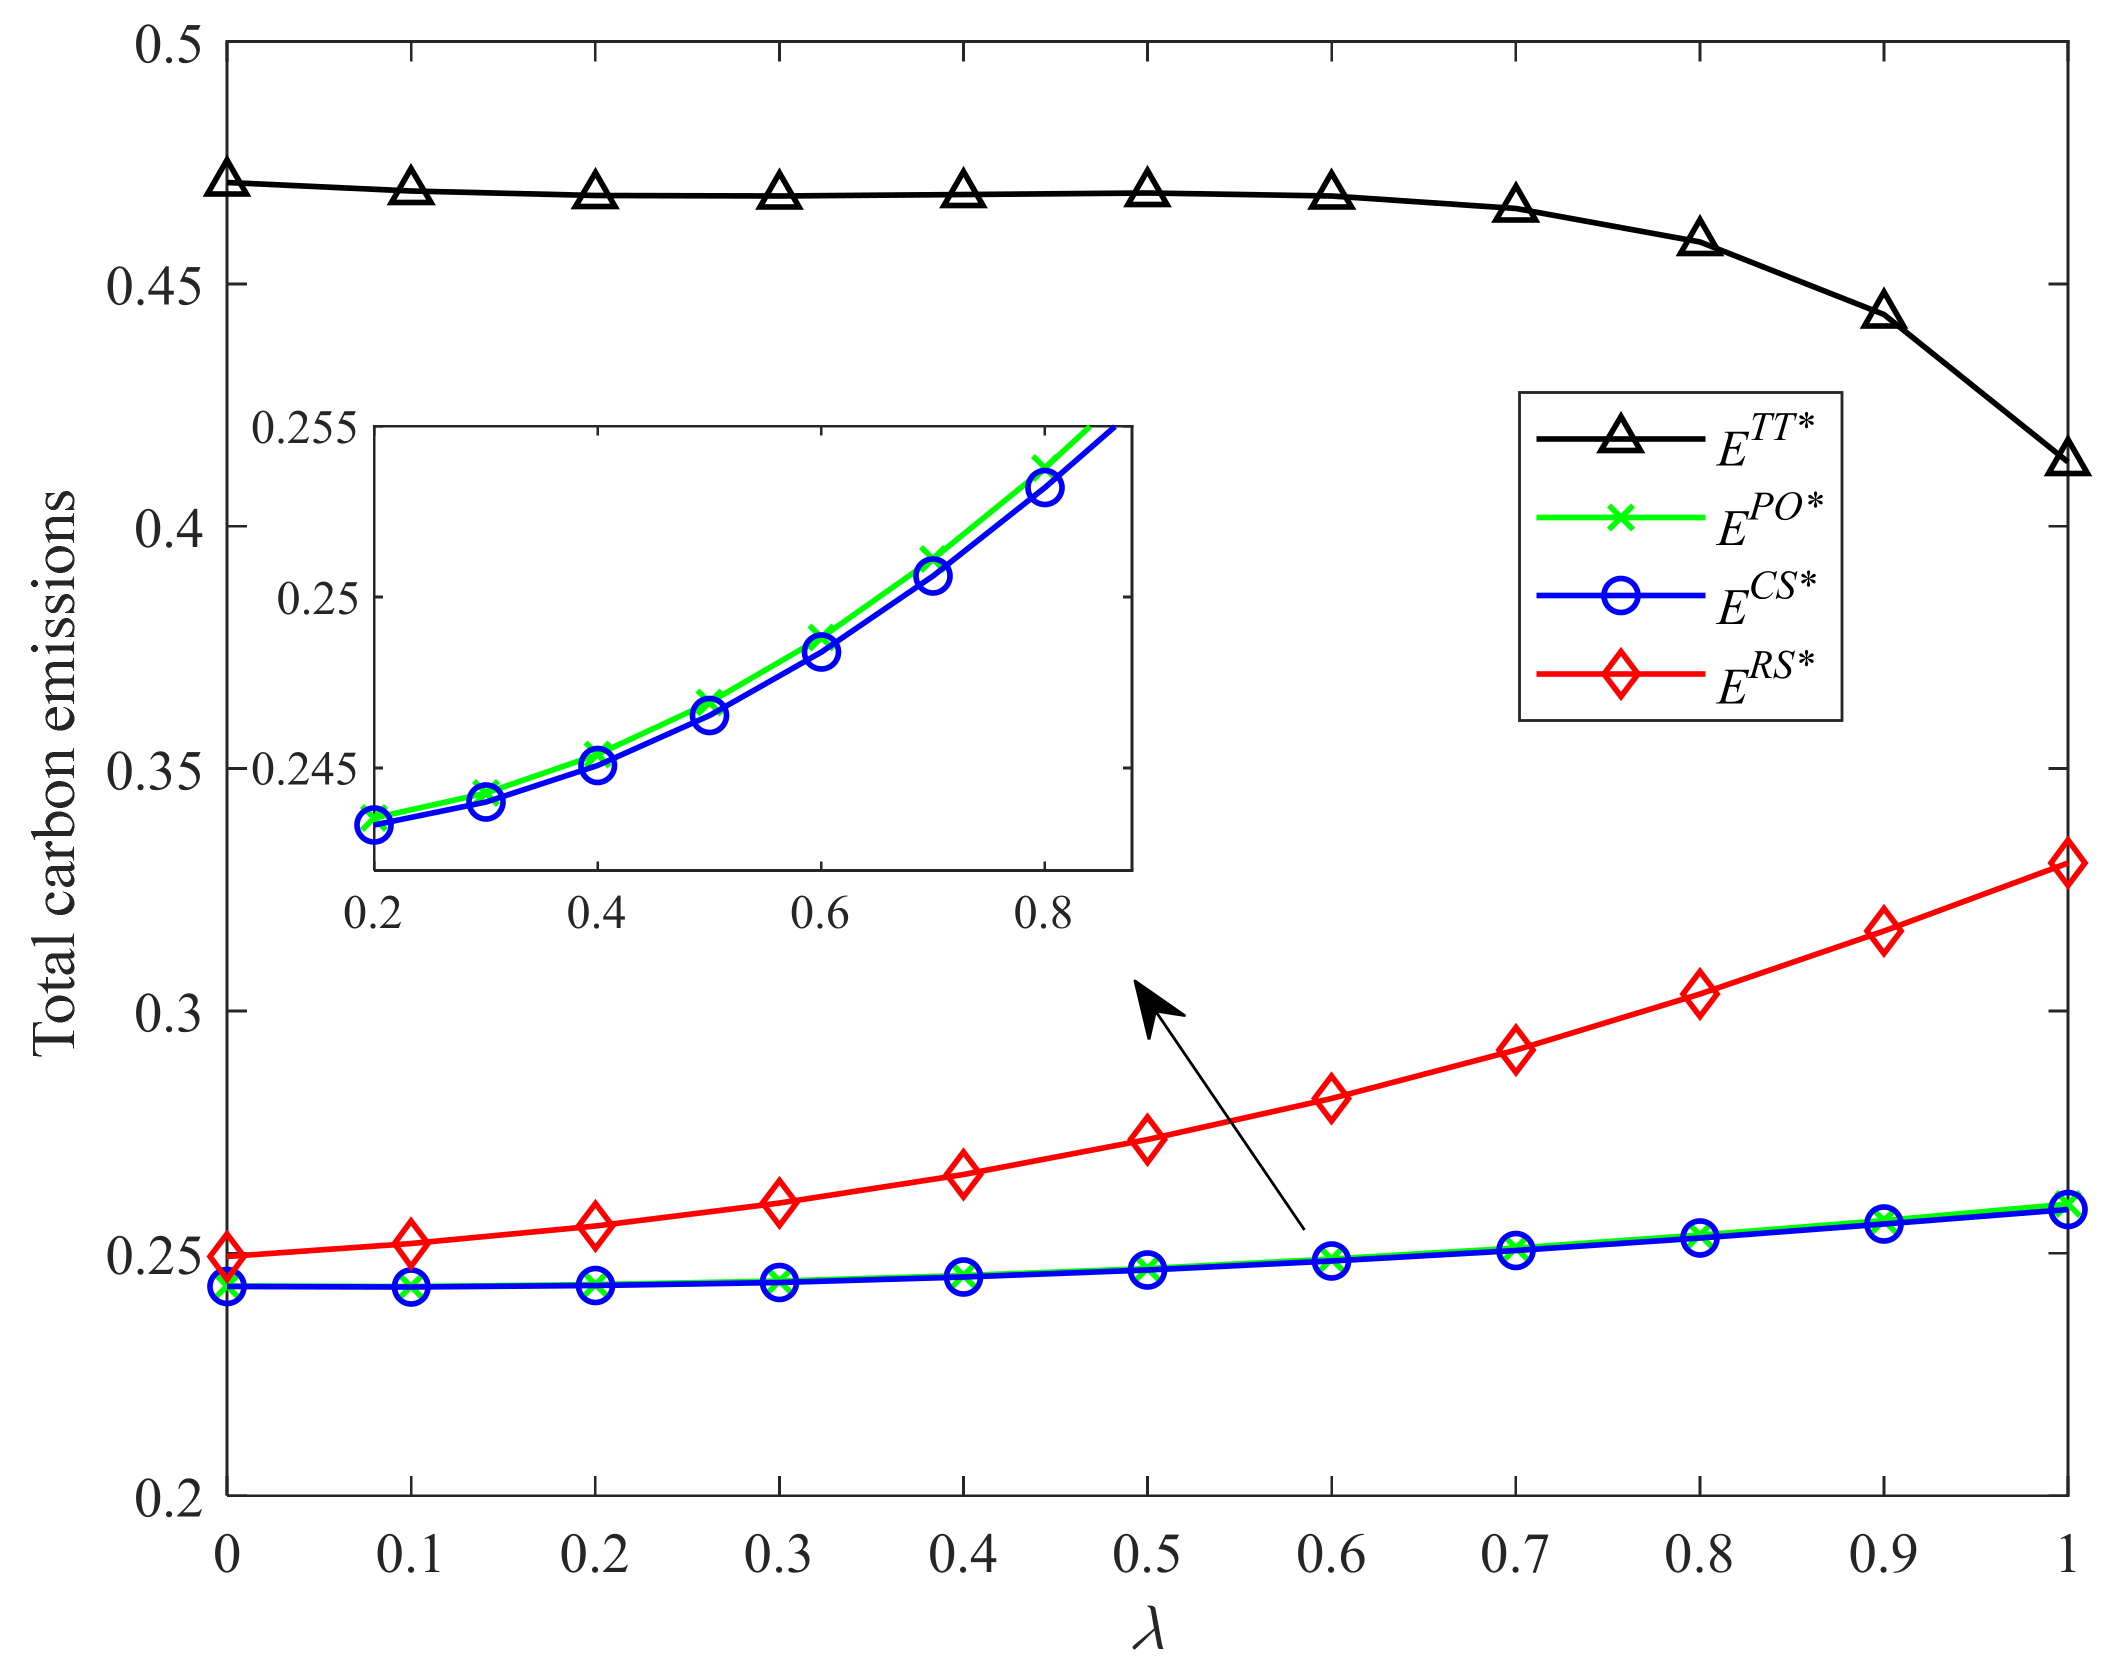
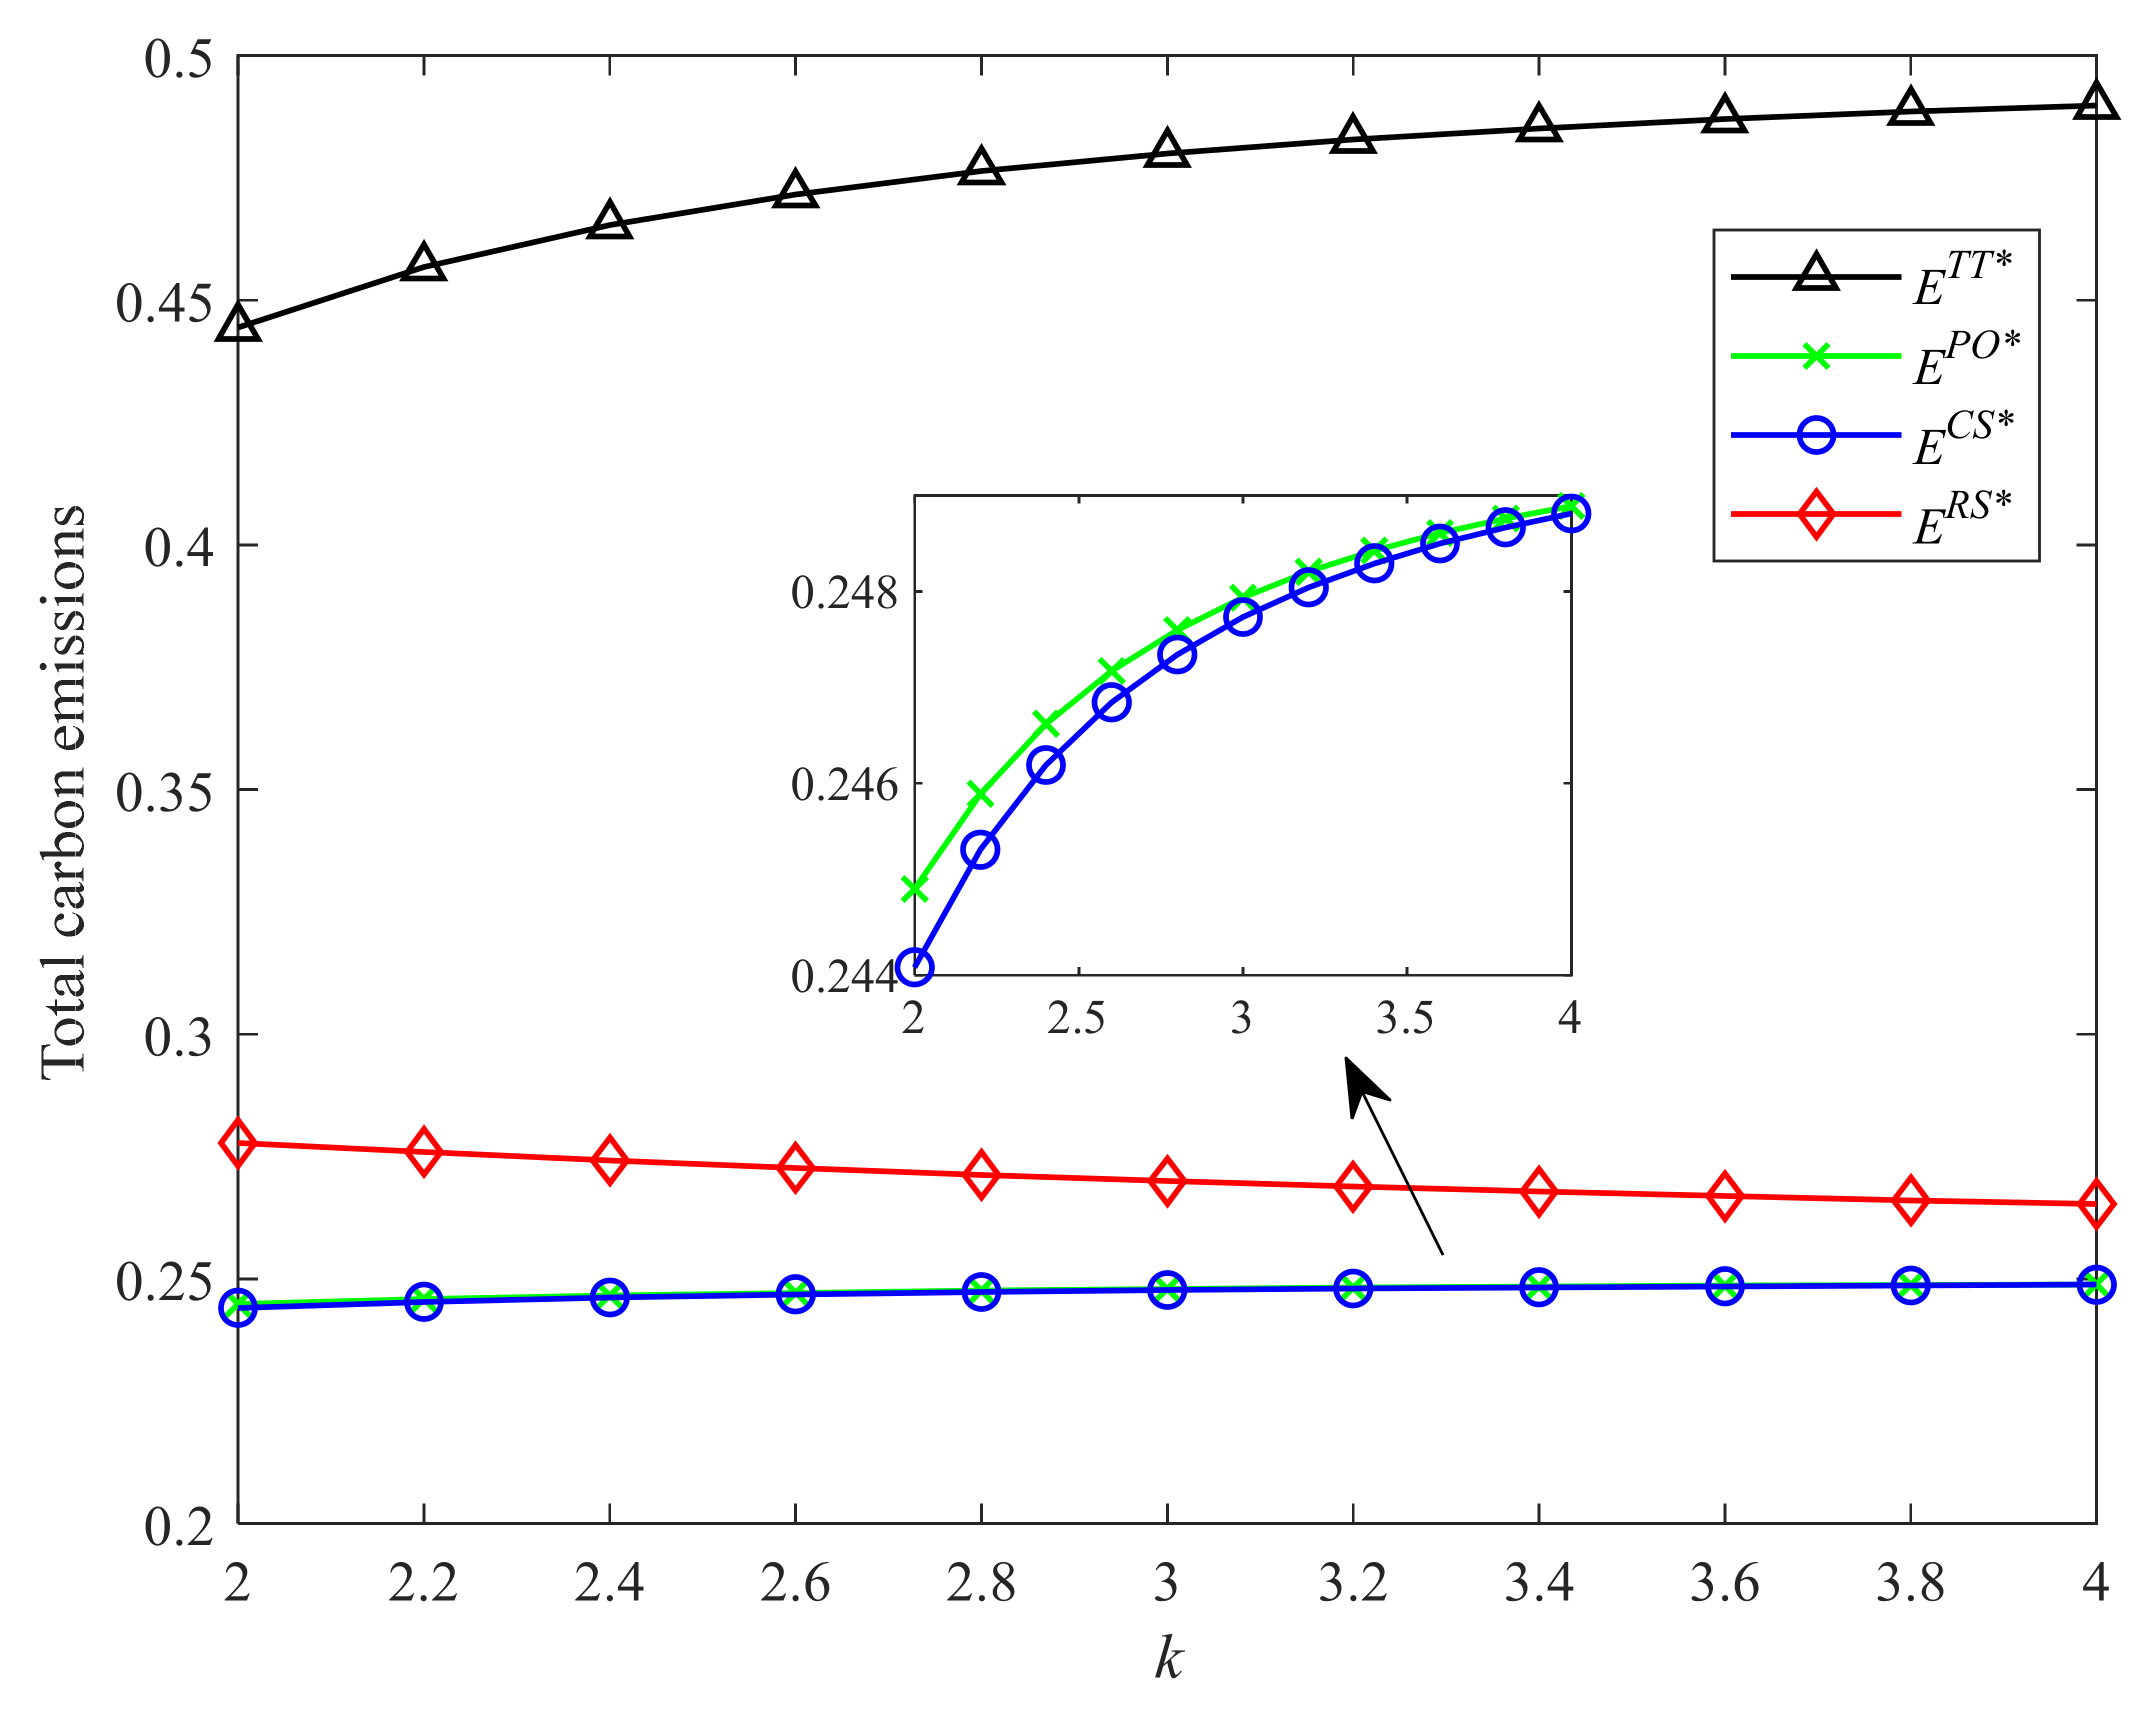
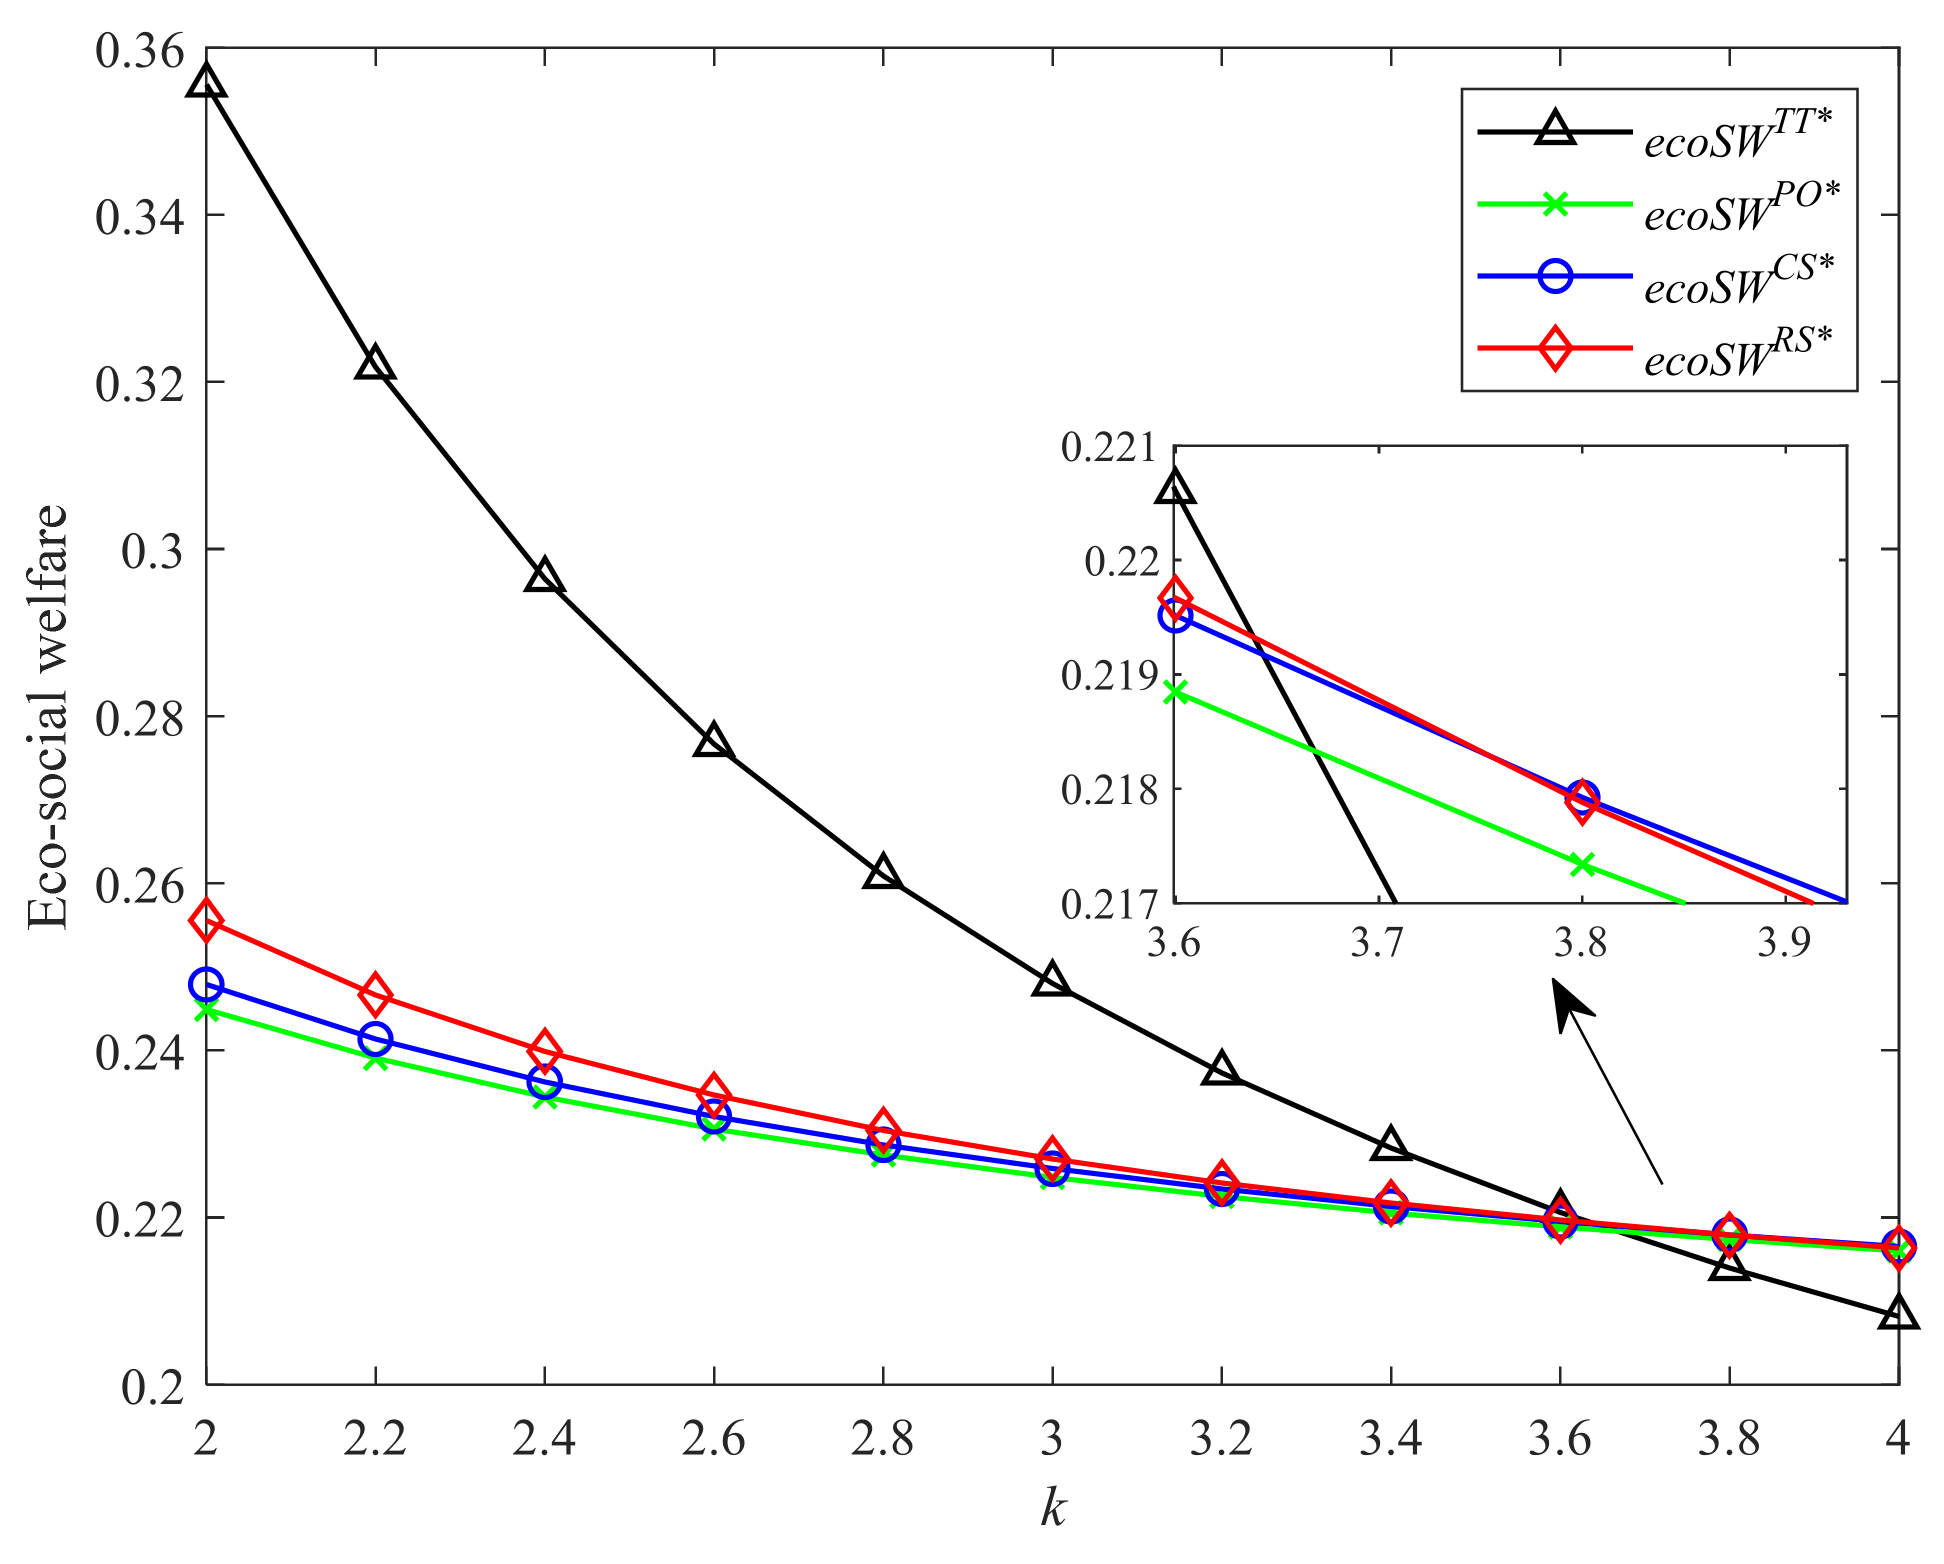
6.3. Environmental and Social Impacts of Different Incentive Strategies
6.3.1. Analysis of Total Carbon Emissions of Different Incentive Strategies
6.3.2. Analysis of Eco-Social Welfare under Different Incentive Strategies
7. Conclusions
- (1)
- In Strategies PO, CS, RS, and BS, the carbon quota given by the government has no impact on the equilibrium decisions of the low-carbon supply chain. A larger carbon quota can bring the manufacturer more profits while not affecting the retailer’s profit, which is similar to the findings of Xue and Sun [9]. Consumers’ higher low-carbon awareness can promote the manufacturer to invest more in CEA technology, thus increasing the manufacturer’s CEA level and the supply chain profit. If the CEA investment is expensive, the manufacturer is more inclined to buy extra carbon emission credits from the carbon trading market rather than invest in CEA technology. This gives us the vital management implication that cultivating consumers’ environmental awareness or improving CEA investment efficiency is conducive to the sustainable development of the low-carbon supply chain.
- (2)
- In both Strategies CS and RS, if the consumers exhibit higher low-carbon awareness or CEA technology is not so expensive, the retailer will share a bigger proportion of CEA investment cost and her sales revenue to incentivize her manufacturer for abatement. The cooperation level between the retailer and manufacturer in Strategy RS is higher than that in Strategy CS. That is to say, the retailer is willing to share a higher percentage of sales revenue in Strategy RS relative to the proportion of CEA investment cost borne in Strategy CS. It is more effective for the retailer to share her revenue to incentivize the manufacturer than to bear the investment cost of CEA. Our findings complement the research of Hong and Guo [44], and Li et al. [45]. Thus, Strategy BS is equivalent to Strategy RS. The equilibrium solutions in Strategy BS are identical to those in Strategy RS.
- (3)
- We propose a two-part tariff contract to coordinate the low-carbon supply chain, which is not investigated in Yang and Chen [49]. The low-carbon supply chain can be fully coordinated with the two-part tariff contract, where the optimal decisions can reach the best level. With the increase of cooperation level among the manufacturer and retailer, the manufacturer is becoming more willing to invest in CEA technology, thus increasing the profits of the supply chain members. Without channel coordination, Strategy RS (equivalent to Strategy BS) is the equilibrium strategy for both manufacturer and retailer. Considering the channel coordination, the two-part tariff contract is the equilibrium contract for both firms. To sum up, both firms hope to have a higher cooperation level.
- (4)
- Considering the environmental and social impacts, high profits are often accompanied by high carbon emissions under four incentive strategies and the two-part tariff contract. When the consumers exhibit higher low-carbon awareness (or CEA technology is not so expensive), the strategy which brings higher profit always generates more eco-social welfare at the same time. In other words, a higher cooperation level can bring higher ecological social welfare. However, when the consumers exhibit lower low-carbon awareness or CEA technology is more expensive, a higher cooperation level cannot bring higher eco-social welfare. Moreover, Strategy CS brings more eco-social welfare than Strategies PO, RS, BS, and the two-part tariff contract under certain conditions.
Author Contributions
Funding
Institutional Review Board Statement
Informed Consent Statement
Data Availability Statement
Conflicts of Interest
Appendix A
- (i)
- , , , , ;
- (ii)
- , , , , . □
- (i)
- It is easy to derive that , , , thus, ;
- (ii)
- It is easy to drive that , , , thus, ;
- (iii)
- It is easy to drive that , , thus, ;
- (iv)
- It is easy to drive that , , , thus, .
- (i)
- It is easy to drive that , , thus, ;
- (ii)
- It is easy to drive that , , thus, ;
- (iii)
- It is easy to drive that , , , thus, .
References
- Cai, Y.J.; Choi, T.M. A United Nations’ Sustainable Development Goals perspective for sustainable textile and apparel supply chain management. Transp. Res. Part E Logist. Transp. Rev. 2020, 141, 102010. [Google Scholar] [CrossRef] [PubMed]
- Wu, Z.; Pagell, M. Balancing priorities: Decision-making in sustainable supply chain management. J. Oper. Manag. 2011, 29, 577–590. [Google Scholar] [CrossRef]
- Cai, Y.J.; Choi, T.M.; Feng, L.; Li, Y. Producer’s choice of design-for-environment under environmental taxation. Eur. J. Oper. Res. 2022, 297, 532–544. [Google Scholar] [CrossRef]
- Germany Targets More Ambitious 2045 Net-Zero Emission Goal. Available online: https://www.bloomberg.com/news/articles/2021-05-05/germany-targets-more-ambitious-climate-neutrality-goal-of-2045 (accessed on 4 February 2022).
- Biden Order Would Make, U.S. Government Carbon Neutral by 2050. Available online: https://www.pbs.org/newshour/politics/biden-order-would-make-u-s-government-carbon-neutral-by-2050 (accessed on 4 February 2022).
- Xi Announces China Aims to Achieve Carbon Neutrality before 2060. Available online: https://www.bbc.com/news/world-europe-56828383 (accessed on 10 January 2022).
- Yang, L.; Ji, J.N.; Wang, M.Z.; Wang, Z.Z. The manufacturer’s joint decisions of channel selections and carbon emission reductions under the cap-and-trade regulation. J. Clean. Prod. 2018, 193, 506–523. [Google Scholar] [CrossRef]
- Bai, Q.G.; Xu, J.T.; Zhang, Y.Y. Emission reduction decision and coordination of a make-to-order supply chain with two products under cap-and-trade regulation. Comput. Ind. Eng. 2018, 119, 131–145. [Google Scholar] [CrossRef]
- Xue, K.L.; Sun, G.H. Impacts of Supply Chain Competition on Firms’ Carbon Emission Reduction and Social Welfare under Cap-and-Trade Regulation. Int. J. Environ. Res. Public Health 2022, 19, 3226. [Google Scholar] [CrossRef]
- Product Carbon Footprint Labelling: Consumer Research 2020. Available online: https://www.carbontrust.com/resources/product-carbon-footprint-labelling-consumer-research-2020 (accessed on 4 February 2022).
- Climate Explained: Are Consumers Willing to Pay More for Climate-Friendly Products? Available online: https://theconversation.com/climate-explained-are-consumers-willing-to-pay-more-for-climate-friendly-products-146757 (accessed on 4 February 2022).
- Chitra, K. In search of the green consumers: A perceptual study. J. Serv. Res. 2007, 7, 173–191. [Google Scholar]
- Xia, L.; Hao, W.; Qin, J.; Ji, F.; Yue, X. Carbon emission reduction and promotion policies considering social preferences and consumers’ low-carbon awareness in the cap-and-trade system. J. Clean. Prod. 2018, 195, 1105–1124. [Google Scholar] [CrossRef]
- Yang, L.; Zhang, Q.; Ji, J. Pricing and carbon emission reduction decisions in supply chains with vertical and horizontal cooperation. Int. J. Prod. Econ. 2017, 191, 286–297. [Google Scholar] [CrossRef]
- Suning Promotes Green Product Design Globally. Available online: http://www.cinn.cn/gysj/201804/t20180416_180606_wap.html (accessed on 4 February 2022).
- Bhaskaran, S.R.; Krishnan, V. Effort, revenue, and cost sharing mechanisms for collaborative new product development. Manag. Sci. 2009, 55, 1152–1169. [Google Scholar] [CrossRef] [Green Version]
- Xue, K.L.; Sun, G.H.; Wang, Y.Y.; Niu, S.Y. Optimal Pricing and Green Product Design Strategies in a Sustainable Supply Chain Considering Government Subsidy and Different Channel Power Structures. Sustainability 2021, 13, 12446. [Google Scholar] [CrossRef]
- Dong, C.W.; Liu, Q.Y.; Shen, B. To be or not to be green? Strategic investment for green product development in a supply chain. Transp. Res. Part E Logist. Transp. Rev. 2019, 131, 193–227. [Google Scholar] [CrossRef]
- Xia, L.; Guo, T.; Qin, J.; Yue, X.; Zhu, N. Carbon emission reduction and pricing policies of a supply chain considering reciprocal preferences in cap-and-trade system. Ann. Oper. Res. 2017, 268, 149–175. [Google Scholar] [CrossRef]
- Qi, Q.; Zhang, R.Q.; Bai, Q.G. Joint decisions on emission reduction and order quantity by a risk-averse firm under cap-and-trade regulation. Comput. Ind. Eng. 2021, 162, 107783. [Google Scholar] [CrossRef]
- Qin, J.J.; Fu, H.P.; Wang, Z.P.; Xia, L.J. Financing and carbon emission reduction strategies of capital-constrained manufacturers in E-commerce supply chains. Int. J. Prod. Econ. 2021, 241, 108271. [Google Scholar] [CrossRef]
- Xu, J.; Duan, Y. Pricing and greenness investment for green products with government subsidies: When to apply blockchain technology? Electron. Commer. Res. Appl. 2022, 51, 101108. [Google Scholar] [CrossRef]
- Benjaafar, S.; Li, Y.; Daskin, M. Carbon Footprint and the Management of Supply Chains: Insights From Simple Models. IEEE Trans. Autom. Sci. Eng. 2013, 10, 99–116. [Google Scholar] [CrossRef]
- Li, X.; Shi, D.; Li, Y.J.; Zhen, X.P. Impact of Carbon Regulations on the Supply Chain With Carbon Reduction Effort. IEEE Trans. Syst. Man Cybern. Syst. 2019, 49, 1218–1227. [Google Scholar] [CrossRef]
- He, P.; Zhang, W.; Xu, X.Y.; Bian, Y.W. Production lot-sizing and carbon emissions under cap-and-trade and carbon tax regulations. J. Clean. Prod. 2015, 103, 241–248. [Google Scholar] [CrossRef]
- Xu, X.Y.; Xu, X.P.; He, P. Joint production and pricing decisions for multiple products with cap-and-trade and carbon tax regulations. J. Clean. Prod. 2016, 112, 4093–4106. [Google Scholar] [CrossRef]
- Chen, X.; Yang, H.; Wang, X.J.; Choi, T.M. Optimal carbon tax design for achieving low carbon supply chains. Ann. Oper. Res. 2020, 1–28. [Google Scholar] [CrossRef]
- Fang, Y.; Yu, Y.; Shi, Y.; Liu, J. The effect of carbon tariffs on global emission control: A global supply chain model. Transp. Res. Part E Logist. Transp. Rev. 2020, 133, 101818. [Google Scholar] [CrossRef]
- Entezaminia, A.; Gharbi, A.; Ouhimmou, M. A joint production and carbon trading policy for unreliable manufacturing systems under cap-and-trade regulation. J. Clean. Prod. 2021, 293, 125973. [Google Scholar] [CrossRef]
- Huang, S.; Fan, Z.P.; Wang, X.H. Optimal financing and operational decisions of capital-constrained manufacturer under green credit and subsidy. J. Ind. Manag. Optim. 2021, 17, 261. [Google Scholar] [CrossRef] [Green Version]
- Huang, S.; Fan, Z.-P.; Wang, N. Green subsidy modes and pricing strategy in a capital-constrained supply chain. Transp. Res. Part E Logist. Transp. Rev. 2020, 136, 101885. [Google Scholar] [CrossRef]
- Yang, D.X.; Chen, Z.Y.; Yang, Y.C.; Nie, P.Y. Green financial policies and capital flows. Phys. A Stat. Mech. Its Appl. 2019, 522, 135–146. [Google Scholar] [CrossRef]
- Kang, H.; Jung, S.Y.; Lee, H. The impact of Green Credit Policy on manufacturers ‘efforts to reduce suppliers’ pollution. J. Clean. Prod. 2020, 248, 119271. [Google Scholar] [CrossRef]
- Zhao, H.; Song, S.J.; Zhang, Y.L.; Liao, Y.; Yue, F. Optimal decisions in supply chains with a call option contract under the carbon emissions tax regulation. J. Clean. Prod. 2020, 271, 122199. [Google Scholar] [CrossRef]
- Wu, D.D.; Yang, L.P.; Olson, D.L. Green supply chain management under capital constraint. Int. J. Prod. Econ. 2019, 215, 3–10. [Google Scholar]
- Cao, E.B.; Du, L.X.; Ruan, J.H. Financing preferences and performance for an emission-dependent supply chain: Supplier vs. bank. Int. J. Prod. Econ. 2019, 208, 383–399. [Google Scholar]
- Tang, R.H.; Yang, L. Impacts of financing mechanism and power structure on supply chains under cap-and-trade regulation. Transp. Res. Part E Logist. Transp. Rev. 2020, 139, 101957. [Google Scholar] [CrossRef]
- Li, B.; Geng, Y.; Xia, X.Q.; Qiao, D. The Impact of Government Subsidies on the Low-Carbon Supply Chain Based on Carbon Emission Reduction Level. Int. J. Environ. Res. Public Health 2021, 18, 7603. [Google Scholar] [CrossRef] [PubMed]
- An, S.M.; Li, B.; Song, D.P.; Chen, X. Green credit financing versus trade credit financing in a supply chain with carbon emission limits. Eur. J. Oper. Res. 2021, 292, 125–142. [Google Scholar] [CrossRef]
- Wang, Y.L.; Xu, X.; Zhu, Q.H. Carbon emission reduction decisions of supply chain members under cap-and-trade regulations: A differential game analysis. Comput. Ind. Eng. 2021, 162, 107711. [Google Scholar] [CrossRef]
- Wang, Q.P.; Zhao, D.Z.; He, L.F. Contracting emission reduction for supply chains considering market low-carbon preference. J. Clean. Prod. 2016, 120, 72–84. [Google Scholar] [CrossRef]
- Sun, J.S.; Li, G. Optimizing emission reduction task sharing: Technology and performance perspectives. Ann. Oper. Res. 2021. [Google Scholar] [CrossRef]
- Ghosh, D.; Shah, J. Supply chain analysis under green sensitive consumer demand and cost sharing contract. Int. J. Prod. Econ. 2015, 164, 319–329. [Google Scholar] [CrossRef]
- Hong, Z.F.; Guo, X.L. Green product supply chain contracts considering environmental responsibilities. Omega-Int. J. Manag. 2019, 83, 155–166. [Google Scholar] [CrossRef]
- Li, G.; Wu, H.M.; Sethi, S.P.; Zhang, X. Contracting green product supply chains considering marketing efforts in the circular economy era. Int. J. Prod. Econ. 2021, 234, 108041. [Google Scholar] [CrossRef]
- Bai, Q.G.; Xu, J.T.; Chauhan, S.S. Effects of sustainability investment and risk aversion on a two-stage supply chain coordination under a carbon tax policy. Comput. Ind. Eng. 2020, 142, 106324. [Google Scholar] [CrossRef]
- Xu, J.T.; Chen, Y.Y.; Bai, Q.G. A two-echelon sustainable supply chain coordination under cap-and-trade regulation. J. Clean. Prod. 2016, 135, 42–56. [Google Scholar] [CrossRef]
- Xu, X.P.; He, P.; Xu, H.; Zhang, Q.P. Supply chain coordination with green technology under cap-and-trade regulation. Int. J. Prod. Econ. 2017, 183, 433–442. [Google Scholar] [CrossRef]
- Yang, H.X.; Chen, W.B. Retailer-driven carbon emission abatement with consumer environmental awareness and carbon tax: Revenue-sharing versus Cost-sharing. Omega-Int. J. Manag. 2018, 78, 179–191. [Google Scholar] [CrossRef]
- Qian, X.H.; Chan, F.T.S.; Zhang, J.H.; Yin, M.Q.; Zhang, Q.Y. Channel coordination of a two-echelon sustainable supply chain with a fair-minded retailer under cap-and-trade regulation. J. Clean. Prod. 2020, 244, 118715. [Google Scholar] [CrossRef]
- Wei, J.; Zhao, J.; Li, Y.J. Price and warranty period decisions for complementary products with horizontal firms’ cooperation/noncooperation strategies. J. Clean. Prod. 2015, 105, 86–102. [Google Scholar] [CrossRef]
- Subramanian, R.; Gupta, S.; Talbot, B. Product design and supply chain coordination under extended producer responsibility. Prod. Oper. Manag. 2009, 18, 259–277. [Google Scholar] [CrossRef]
- Swami, S.; Shah, J. Channel coordination in green supply chain management. J. Oper. Res. Soc. 2013, 64, 336–351. [Google Scholar] [CrossRef]
- Hong, Z.F.; Wang, H.; Gong, Y.M. Green product design considering functional-product reference. Int. J. Prod. Econ. 2019, 210, 155–168. [Google Scholar] [CrossRef]
- Li, X.; Li, Y.J. On green market segmentation under subsidy regulation. Supply Chain. Manag. Int. J. 2017, 22, 284–294. [Google Scholar] [CrossRef]
- Krass, D.; Nedorezov, T.; Ovchinnikov, A. Environmental taxes and the choice of green technology. Prod. Oper. Manag. 2013, 22, 1035–1055. [Google Scholar] [CrossRef]
- Tang, W.; Du, S.; Hu, L.; Wang, B.; Zhu, Y. The effects of leadership in Clean Development Mechanism low-carbon operations. Transp. Res. Part E Logist. Transp. Rev. 2022, 158, 102575. [Google Scholar] [CrossRef]
- Li, Y.; Bai, X.; Xue, K. Business modes in the sharing economy: How does the OEM cooperate with third-party sharing platforms? Int. J. Prod. Econ. 2020, 221, 107467. [Google Scholar] [CrossRef]


| Articles | Strategy Type | Carbon Policy | Coordination Issue | Focus Point | |||
|---|---|---|---|---|---|---|---|
| PO | CS | RS | Cap-and-Trade | Carbon Tax | |||
| Ghosh and Shah [43] | √ | √ | P | ||||
| Qian et al. [50] | √ | √ | √ | P, E | |||
| Wang et al. [41] | √ | √ | √ | P | |||
| Yang and Chen [49] | √ | √ | √ | P, E | |||
| Hong and Guo [44] | √ | √ | √ | P, SW | |||
| Li et al. [45] | √ | √ | √ | P | |||
| Our paper | √ | √ | √ | √ | √ | P, SW, E | |
| Notations | Descriptions |
|---|---|
| Initial market demand potential for products | |
| Market demand for low-carbon products | |
| Demand sensitivity coefficient concerning the products’ CEA level | |
| Cost coefficient of CEA technology investment | |
| Production cost of the manufacturer | |
| Initial carbon emissions of unit product | |
| Impact coefficient of carbon emissions on social welfare | |
| Carbon emissions of the manufacturer | |
| Total carbon quota from the government | |
| Carbon trading amount of the manufacturer | |
| denote the manufacturer, retailer, supply chain, respectively | |
| denote the price-only strategy, cost-sharing strategy, revenue-sharing strategy, both-sharing strategy, two-part tariff contract, and centralized supply chain system, respectively | |
| Profit of i in Strategy j | |
| Social welfare in Strategy j | |
| Decision Variables | |
| Carbon emission abatement level of the manufacturer | |
| Proportion of CEA investment cost shared by the retailer | |
| Proportion of the retailer’s revenue shared by the manufacturer | |
| Wholesale price of low-carbon products | |
| Retail price of low-carbon products |
Publisher’s Note: MDPI stays neutral with regard to jurisdictional claims in published maps and institutional affiliations. |
© 2022 by the authors. Licensee MDPI, Basel, Switzerland. This article is an open access article distributed under the terms and conditions of the Creative Commons Attribution (CC BY) license (https://creativecommons.org/licenses/by/4.0/).
Share and Cite
Xue, K.; Sun, G.; Yao, T. Incentive Mechanisms for Carbon Emission Abatement Considering Consumers’ Low-Carbon Awareness under Cap-and-Trade Regulation. Int. J. Environ. Res. Public Health 2022, 19, 4104. https://doi.org/10.3390/ijerph19074104
Xue K, Sun G, Yao T. Incentive Mechanisms for Carbon Emission Abatement Considering Consumers’ Low-Carbon Awareness under Cap-and-Trade Regulation. International Journal of Environmental Research and Public Health. 2022; 19(7):4104. https://doi.org/10.3390/ijerph19074104
Chicago/Turabian StyleXue, Kelei, Guohua Sun, and Tongtong Yao. 2022. "Incentive Mechanisms for Carbon Emission Abatement Considering Consumers’ Low-Carbon Awareness under Cap-and-Trade Regulation" International Journal of Environmental Research and Public Health 19, no. 7: 4104. https://doi.org/10.3390/ijerph19074104
APA StyleXue, K., Sun, G., & Yao, T. (2022). Incentive Mechanisms for Carbon Emission Abatement Considering Consumers’ Low-Carbon Awareness under Cap-and-Trade Regulation. International Journal of Environmental Research and Public Health, 19(7), 4104. https://doi.org/10.3390/ijerph19074104