
Evaluation of Tourism Development Efficiency and Spatial Spillover Effect Based on EBM Model: The Case of Hainan Island, China


Abstract
:1. Introduction
2. The Theoretical Analysis
3. Methodology and Data Sources
3.1. Evaluation of Urban Tourism Development Efficiency
3.1.1. Index System Construction
3.1.2. Measurement of Tourism Efficiency
3.2. Spatial Panel Econometric Model
3.2.1. Space Weight Matrix Settings
3.2.2. Selection Method of Space Panel Metering Model
3.2.3. Spatial Effect Decomposition
3.3. Data Source and Processing
4. Results Analysis
4.1. Evaluation Results of Hainan Tourism Development Efficiency
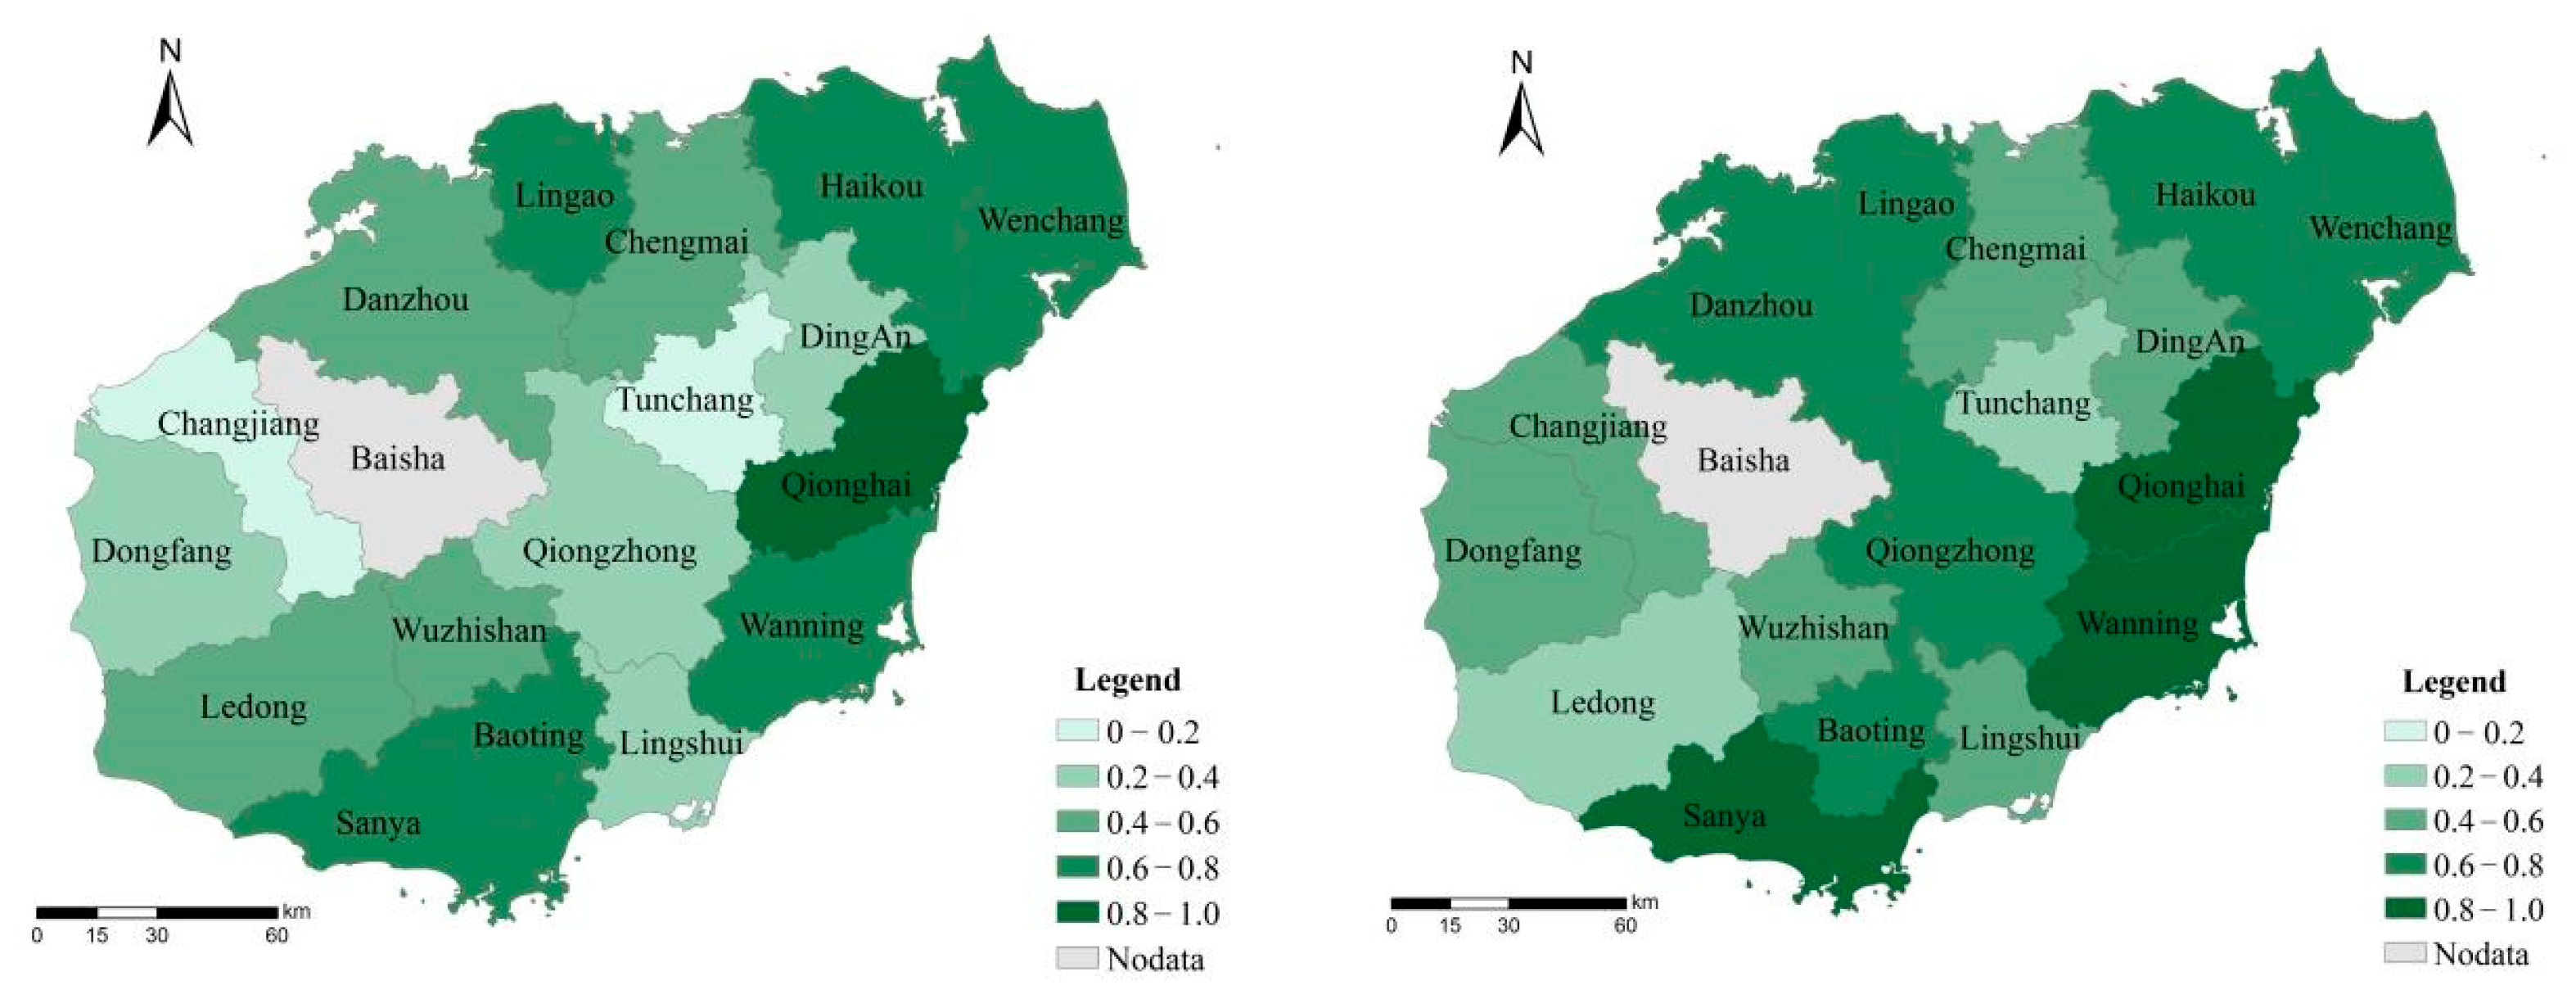
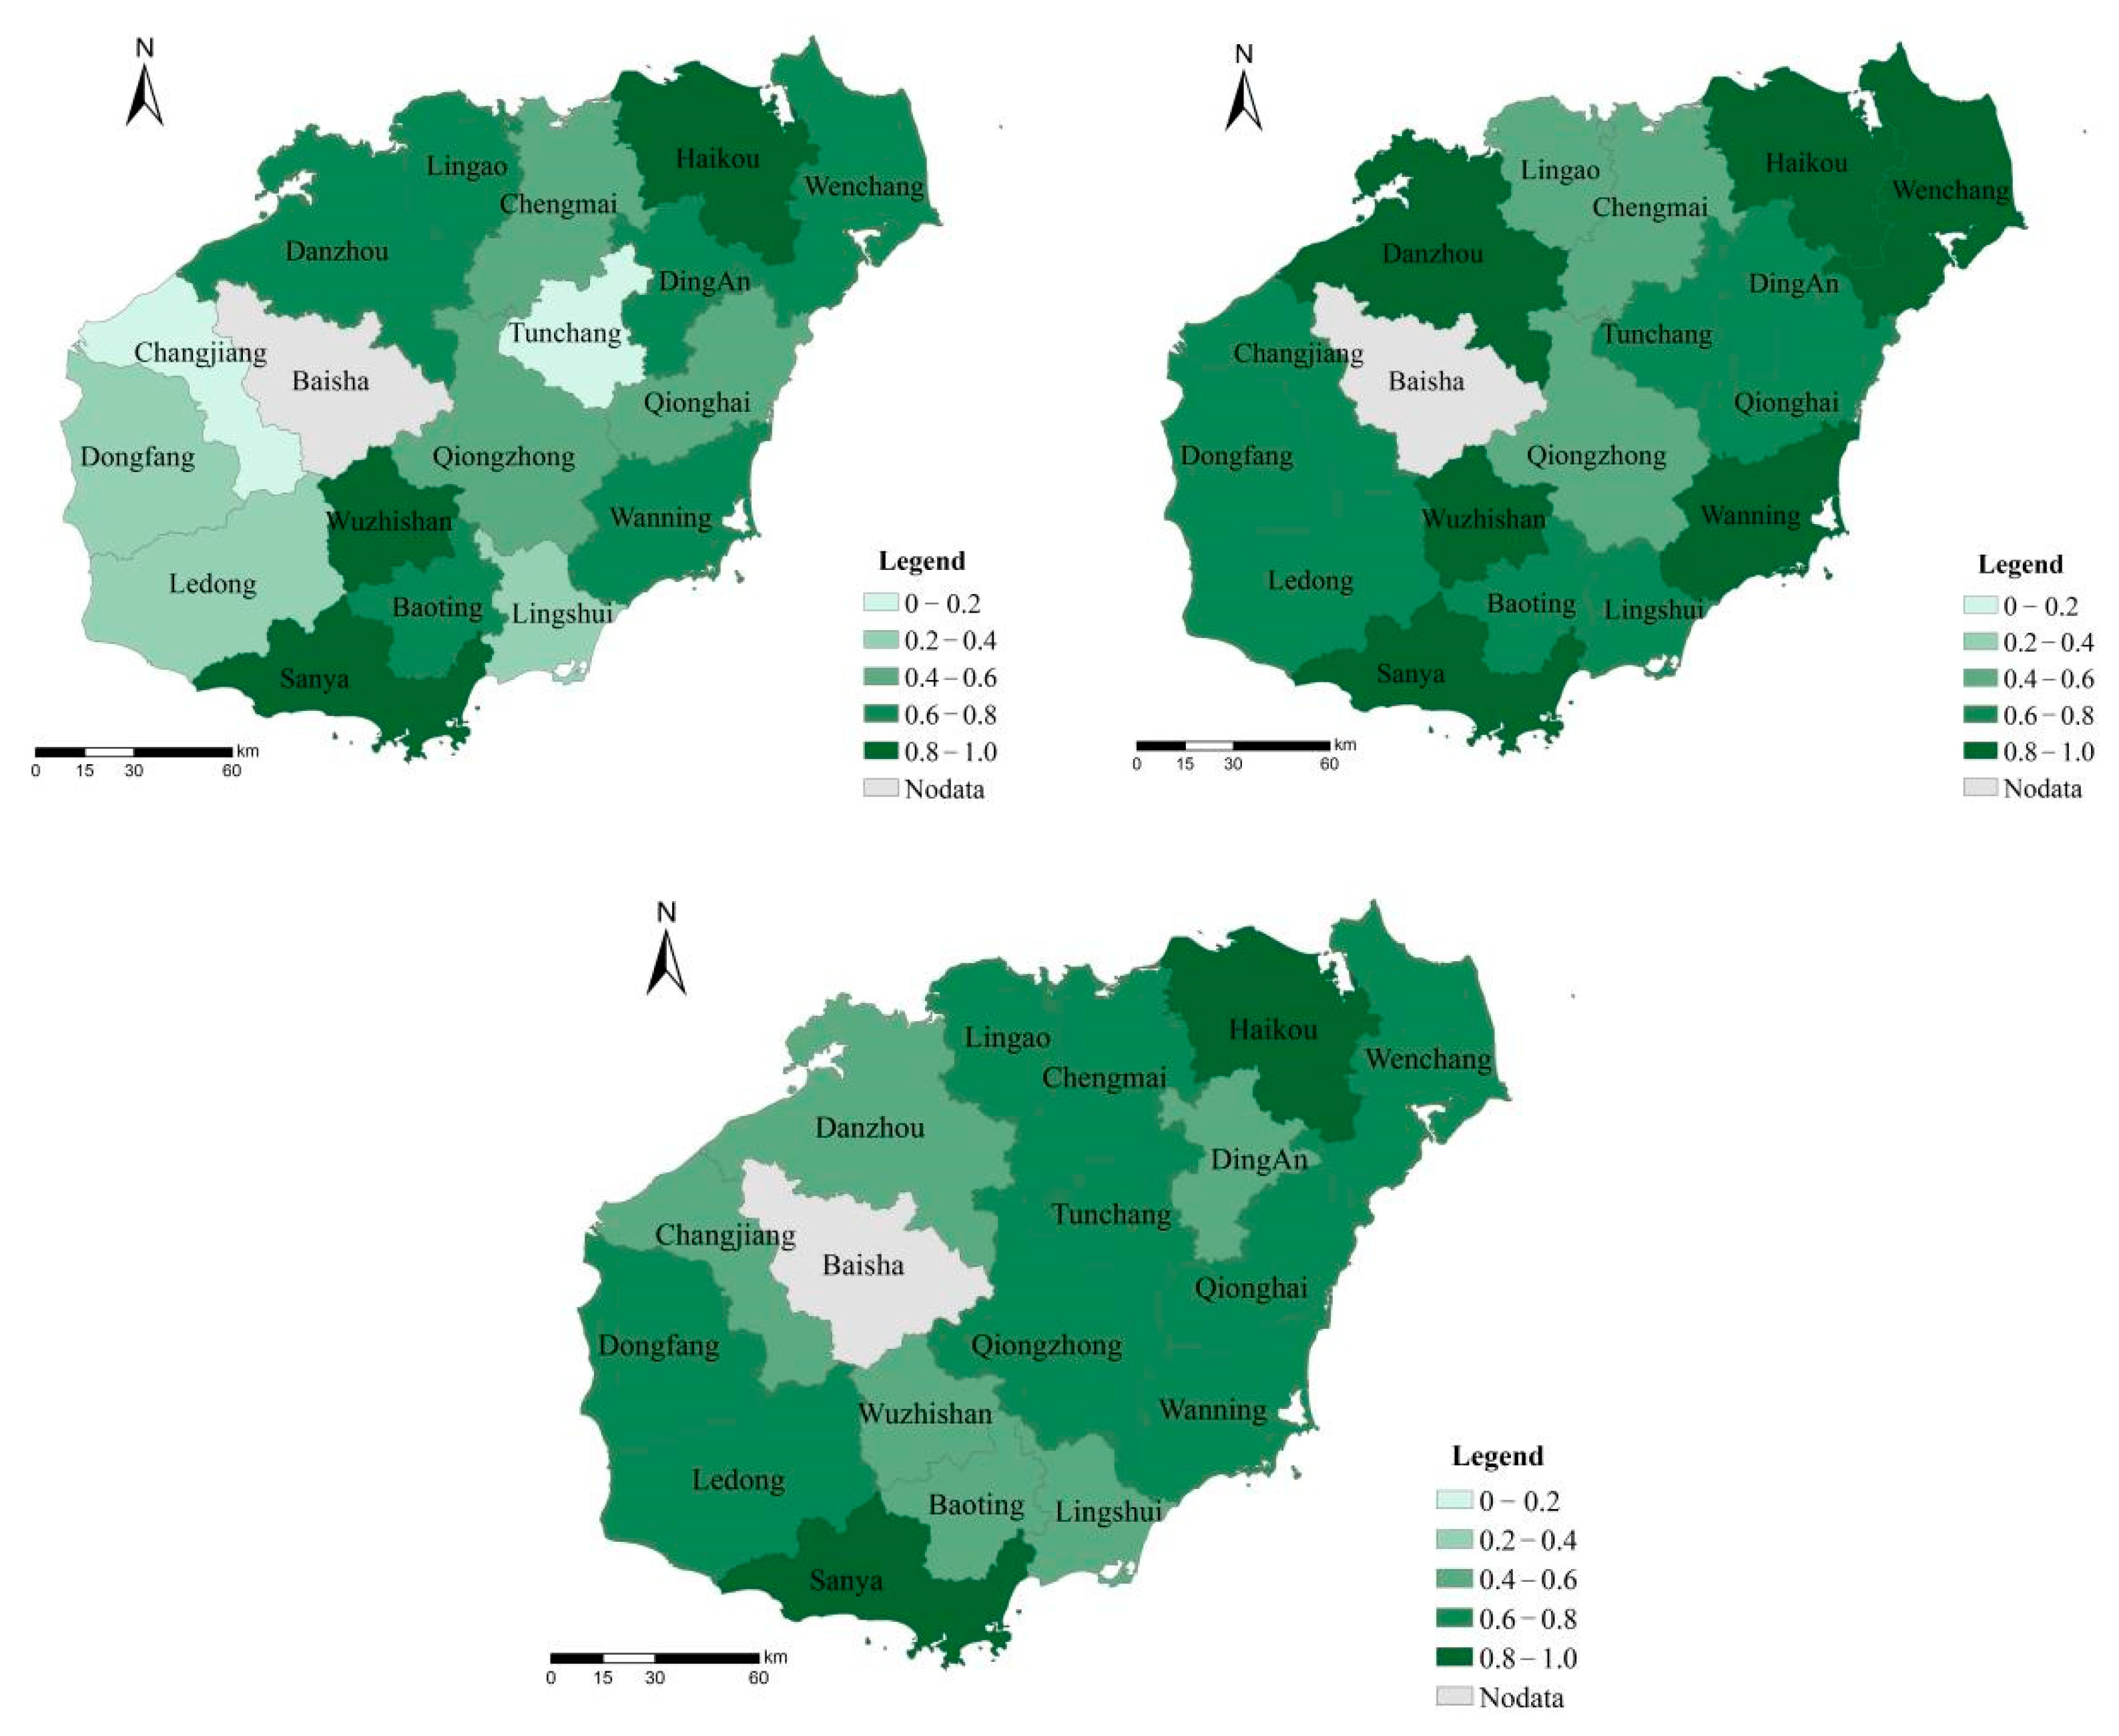
4.1.1. The Changing Trend and Regional Difference of Tourism Development Efficiency
4.1.2. Potential Index of Tourism Development Efficiency Improvement in Hainan Island
4.2. Spatial Spillover Effect of Tourism Development Efficiency
4.2.1. Model Setting and Validation
4.2.2. Estimation of Tourism Development Effects
5. Discussion
6. Conclusions
6.1. Concluding Remarks
6.2. Limitations and Future Research
Author Contributions
Funding
Institutional Review Board Statement
Informed Consent Statement
Data Availability Statement
Acknowledgments
Conflicts of Interest
References
- Song, R.; Jin, Z.; Zang, Y. The New trend of world tourism economy and China’s new development strategy. Financ. Econ. Think Tank. 2021, 6, 64–86, 142–143. [Google Scholar]
- Tong, Y.; Liu, H.; Ma, Y.; Liu, J.; Zhang, R. The impact of tourism economy on urban green development and its spatial spillover effect in China. Acta Geogr. Sin. 2021, 76, 2504–2521. [Google Scholar]
- Marrocu, E.; Paci, R. They arrive with new information. Tourism flows and production efficiency in the European regions. Tour. Manag. 2011, 32, 750–758. [Google Scholar] [CrossRef] [Green Version]
- Kim, Y.R.; Williams, A.M.; Park, S.; Chen, J.L. Spatial spillovers of agglomeration economies and productivity in the tourism industry: The case of the UK. Tour. Manag. 2021, 82, 104201. [Google Scholar] [CrossRef]
- Nurmatov, R.; Lopez, X.L.F.; Millan, P.P.C. Tourism, hospitality, and DEA: Where do we come from and where do we go? Int. J. Hosp. Manag. 2021, 95, 102883. [Google Scholar] [CrossRef]
- Fang, Y.L.; Huang, Z.F.; Wang, K.; Tu, W. The spatial analysis of relative efficiency agglomeration about Chinese star-rated hotels and promotion strategies. Hum. Geogr. 2013, 28, 121–127. [Google Scholar]
- Peng, J.J.; Chen, H. A study on the efficiency of star-rated hotels: A case study on the relative efficiency of Beijing, Shanghai and Guangzhou province. Tour. Trib. 2004, 19, 59–62. [Google Scholar]
- Barros, C.P. Measuring efficiency in the hotel sector. Ann. Tour. Res. 2005, 32, 456–477. [Google Scholar] [CrossRef]
- Parkan, C. Measuring the performance of hotel operations. Socio-Econ. Plan. Sci. 1996, 30, 257–292. [Google Scholar] [CrossRef]
- Zhang, Y.F. Spatial and temporal evolution of star-rated hotels’ efficiency in China based on DEA-Malmquist model. Sci. Geogr. Sin. 2017, 37, 406–415. [Google Scholar]
- Hu, Y.N.; Mei, L.; Wei, J.G. Spatial differentiation and dynamic mechanism of regional travel agency efficiency in China based on GWR model. Sci. Geogr. Sin. 2018, 38, 107–113. [Google Scholar]
- Fuentes, R. Efficiency of travel agencies: A case study of Alicante, Spain. Tour. Manag. 2011, 32, 75–87. [Google Scholar] [CrossRef]
- Fernandes, E.; Pacheco, R.R. Efficient use of airport capacity. Transp. Res. Part A Policy Pract. 2002, 36, 225–238. [Google Scholar] [CrossRef]
- Cao, F.D.; Cao, Z.F.; Yu, F.L.; Wu, L.M. The spatial evolution of travel efficiency of China’s National Scenic Areas and its driving mechanism. Geogr. Res. 2014, 33, 1151–1166. [Google Scholar]
- Wang, Z.F.; Liu, Q.F. The spatio-temporal evolution of tourism eco-efficiency in the Yangtze River Economic Belt and its interactive response with tourism economy. J. Nat. Resour. 2019, 34, 1945–1961. [Google Scholar]
- Zha, J.P.; Wang, T.Z. Estimation of tourism efficiency and tourism productivity of scenic areas under environmental constraints. China Population. Resour. Environ. 2015, 25, 92–99. [Google Scholar]
- Charnes, A.; Cooper, W.W.; Rhodes, E. Measuring the efficiency of decision making units. Eur. J. Oper. Res. 1978, 2, 429–444. [Google Scholar] [CrossRef]
- Wei, Q.L. To Evaluate the Relative Effectiveness of DEA Method: New Field of Operations Research; China Renmin University Press: Beijing, China, 1988; pp. 1–8. [Google Scholar]
- Krugman, P.R. The Myth of Asian Miracle. Abstr. Mod. Foreign Philos. Soc. Sci. 1995, 7, 13–16. [Google Scholar]
- Sun, P.P.; Xia, J.C. The efficiency of China’s inter-provincial tourism industry: Index construction and empirical analysis. Econ. Manag. Res. 2014, 12, 70–79. [Google Scholar]
- Zhang, S.N.; Li, Y.Q.; Ruan, W.Q. Research on the measurement of tourism development efficiency and its influencing factors in Chengyu Economic Zone. Resour. Dev. Mark. 2017, 33, 1523–1528. [Google Scholar]
- Wang, Z.F.; Zhao, S.S. The temporal and spatial dynamic evolution and influencing factors of the efficiency of the tourism industry in Hunan province based on the DEA-Malmquist model. Resour. Environ. Yangtze River Basin 2019, 28, 1886–1897. [Google Scholar]
- Guo, X.Y.; Mu, X.Q.; Ming, Q.Z. Spatial differentiation and driving factors of tourism efficiency in border provinces: Taking Yunnan province as an example. World Geogr. Res. 2020, 29, 416–427. [Google Scholar]
- Sheng, Y.C.; Liu, Q. Study on the spatial difference of human capital promoting the efficiency of regional tourism economy. Geogr. Sci. 2020, 40, 1710–1719. [Google Scholar]
- Pace, L.A. How do tourism firms innovate for sustainable energy consumption? A capabilities perspective on the adoption of energy efficiency in tourism accommodation establishments. J. Clean. Prod. 2016, 111, 409–420. [Google Scholar] [CrossRef]
- Sami, C. China’s regional tourism efficiency: A two-stage double bootstrap data envelopment analysis. J. Destin. Mark. Manag. 2017, 11, 183–191. [Google Scholar]
- Maria, F.C.; Peter, N.; Piet, R. Assessment of Tourism Competitiveness by Analysing Destination Efficiency. Tour. Econ. 2008, 14, 325–342. [Google Scholar]
- Xosé, L.F.; Pablo, C.M.; Benito, D.M. The impact of tourism on airport efficiency: The Spanish case. Util. Policy 2018, 55, 52–58. [Google Scholar]
- Gupta, M.R.; Dutta, P.B. Tourism development, environmental pollution and economic growth: A theoretical analysis. J. Int. Trade Econ. Dev. 2018, 27, 125–144. [Google Scholar] [CrossRef]
- Pan, S.Y.; Gao, M.Y.; Kim, H.; Shah, K.; Pei, S.L.; Chiang, P.C. Advances and challenges in sustainable tourism toward a green economy. Sci. Total Environ. 2018, 635, 452–469. [Google Scholar] [CrossRef]
- Wang, Z.F.; Yang, X. A study on the efficiency evaluation of tourism industry of urban agglomeration in Central China: Based on DEA-Malmquist model. Tour. Sci. 2018, 32, 27–38. [Google Scholar]
- Wei, J.; Hu, J.; Zhu, L.; Yu, J. Spatial-temporal differentiation and influencing mechanism of tourism development efficiency in Hubei province and Anhui province. Econ. Geogr. 2018, 38, 187–195. [Google Scholar]
- Li, R.; Wu, D.T.; Yin, H.M.; Zhang, H.; Zhu, T.X. Spatial characteristics of development efficiency for urban tourism in eastern China: A case study of six coastal urban agglomerations. J. Geogr. Sci. 2014, 24, 1175–1197. [Google Scholar] [CrossRef]
- Yi, T.T.; Liang, M.Z. Evolutional Model of Tourism Efficiency Based on the DEA Method: A Case Study of Cities in Guangdong Province, China. Asia Pac. J. Tour. Res. 2015, 20, 789–806. [Google Scholar] [CrossRef]
- Ohe, Y. Assessing Managerial Efficiency of Educational Tourism in Agriculture: Case of Dairy Farms in Japan. Sustainability 2017, 9, 1931. [Google Scholar] [CrossRef] [Green Version]
- Cao, F.D.; Huang, Z.F.; Jin, C. Influence of Chinese economic fluctuations on tourism efficiency in national scenic areas. Tour. Econ. 2016, 22, 884–907. [Google Scholar] [CrossRef]
- Wang, Y.B.; Sun, C.L.; Jiang, J.P. The efficiency and empirical research of cultural tourism based on the three-stage DEA model: Taking Gansu province as an example. Resour. Dev. Mark. 2016, 32, 125–128. [Google Scholar]
- Yang, C.M.; Zhao, B.F. Analysis on the efficiency of China’s ice and snow tourism industry based on data envelopment analysis. Resour. Environ. Arid. Areas 2014, 28, 169–174. [Google Scholar]
- Yu, R.Y.; Liang, L.K.; Sun, Y.N.; Li, J.H.; Su, X.Y. Analysis of village-scale tourism efficiency and accessibility research in Luoyang city. Reg. Res. Dev. 2020, 39, 105–109. [Google Scholar]
- Long, Z.K.; Li, X.M.; Kong, X.J. Research on the development efficiency and scale of folklore tourism:Taking Beijing as an example. J. Huaqiao Univ. Philos. Soc. Sci. Ed. 2017, 4, 81–93. [Google Scholar]
- Wang, K.L.; Liu, Y.; Shi, L.J.; Liu, L.; Meng, X.R.; Yang, B.C. Yangtze River Economic Zone spatial and temporal disparities in industrial green water resource efficiency and influencing factors based on two-step analysis of EBM-Tobit Model. Resour. Sci. 2017, 399, 1522–1534. [Google Scholar]
- Li, L.B.; Liu, B.L. Efficiency measurement and factors recognition of China’s high technology industry. Econ. Dyn. 2014, 9, 1–10. [Google Scholar]
- Tone, K.; Tsutsui, M. An epsilon-based measure of efficiency in DEA: A third pole of technical efficiency. Eur. J. Oper. Res. 2010, 207, 1554–1563. [Google Scholar] [CrossRef]
- Avci, U.; Madanoglu, M.; Okumus, F. Strategic orientation and performance of tourism firms: Evidence from a developing country. Tour. Manag. 2011, 32, 147–157. [Google Scholar] [CrossRef]
- Ruben, L.S.; Luis, O.G.; Milagros, V.B.; Onofre, M.C. Impact of location on profitability in the Spanish hotel sector. Tour. Manag. 2016, 52, 405–415. [Google Scholar]
- Guo, L.J.; Li, C.; Peng, H.S.; Zhong, S.E.; Zhang, J.H.; Yu, H. Evaluation and spatial pattern of tourism eco-efficiency in China under the constraint of energy conservation and emission reduction. Prog. Geogr. 2021, 40, 1284–1297. [Google Scholar] [CrossRef]
- Tang, C.C.; Zhong, L.S.; Jiang, Q.O. Energy efficiency and carbon efficiency of tourism industry in destination. Energy Effic. 2018, 11, 539–558. [Google Scholar] [CrossRef]
- Zhao, L.; Fang, C.; Wu, X. Tourism development, spatial spillovers and economic growth: Empirical evidence from China. Tour. Trib. 2014, 29, 16–30. [Google Scholar]
- Gossling, S.; Peeters, P.; Ceron, J.P.; Dubois, G.; Patterson, T.; Richardson, R.B. The eco-efficiency of tourism. Ecol. Econ. 2005, 54, 417–434. [Google Scholar] [CrossRef]
- Sun, Y.Y. Decomposition of tourism greenhouse gas emissions: Revealing the dynamics between tourism economic growth, technological efficiency, and carbon emissions. Tour. Manag. 2016, 55, 326–336. [Google Scholar] [CrossRef]
- Liu, J.; Zhang, J.F.; Fu, Z.B. Tourism eco-efficiency of Chinese coastal cities-Analysis based on the DEA-Tobit model. Ocean. Coast. Manag. 2017, 148, 164–170. [Google Scholar] [CrossRef]
- Wagner, J.M.; Shimshak, D.G. Stepwise selection of variables in data envelopment analysis: Procedures and managerial perspectives. Eur. J. Oper. Res. 2007, 180, 57–67. [Google Scholar] [CrossRef]
- Lu, Z.L.; Lu, J.L.; Li, Y.Y. Overseas review on ecological environment influence in scenic area. Econ. Geogr. 2009, 29, 130–133. [Google Scholar]
- Feng, X.X. The Correlation between universal tourism and regional green development. Reform 2018, 2, 122–131. [Google Scholar]
- Wang, L.J.; Yuan, F.Y.; He, Q.F. Application of spatial Econometric Method to the Relationship between provincial tourism development and economic growth in China. Tour. Sci. 2010, 24, 49–54. [Google Scholar]
- Wu, Y.M. Spatial panel econometric analysis of tourism economic growth and its spillover effects. Tour. Trib. 2014, 29, 16–24. [Google Scholar]
- Xie, L.L.; Wang, Y.J. The spatial spillover effect of tourism industry agglomeration on economic growth: Empirical evidence from the Yangtze River Delta region. Shanghai Econ. 2018, 4, 17–32. [Google Scholar]
- Xia, L.H.; Chen, Q.C.; Jiang, L. A study on the spatial spillover effects of tourism development and carbon emissions in China. J. Taishan Univ. 2017, 39, 19–26. [Google Scholar]
- Yang, L.; Chen, J.; Shi, P.; Huang, G. Evaluation and Influencing Factors of red tourism development efficiency: A case study of Qianbei qianxi Red Tourism area. J. Nat. Resour. 2021, 36, 2763–2777. [Google Scholar]
- Xu, D.; Huang, Z.F.; Hu, X.H.; Lv, D.; Cao, F.D. The evolution of the spatial pattern of tourism efficiency in Zhejiang provinces and its influencing factors. Econ. Geogr. 2018, 38, 197–207. [Google Scholar]
- Schandl, H.; Hatfield-Dodds, S.; Wiedmann, T.; Geschke, A.; Cai, Y.Y.; West, J.; Newth, D.; Baynes, T.; Lenzen, M.; Owen, A. Decoupling global environmental pressure and economic growth: Scenarios for energy use, materials use and carbon emissions. J. Clean. Prod. 2016, 132, 45–56. [Google Scholar] [CrossRef]
- Zhou, X.; Wang, P.F. Spatial differentiation and influencing factors of resource and environmental pressure in China’s industrial development. Geogr. Res. 2018, 37, 1541–1557. [Google Scholar]
- Kuosmanen, T.; Kortelainen, M. Measuring eco-efficiency of production with data envelopment analysis. J. Ind. Ecol. 2005, 9, 59–72. [Google Scholar] [CrossRef]
- Picazo-Tadeo, A.J.; Reig-Martinez, E.; Gomez-Limon, J.A. Assessing farming eco-efficiency: A data envelopment analysis approach. J. Environ. Manag. 2011, 92, 1154–1164. [Google Scholar] [CrossRef]
- Wang, H.G.; Shen, L.S. A spatial panel statistical analysis on Chinese economic growth and energy consumption. J. Quant. Tech. Econ. 2007, 24, 98–107. [Google Scholar]
- Xu, D.; Huang, Z.F.; Huang, R. The spatial effects of haze on tourism flows of Chinese cities: Empirical research based on the spatial panel econometric model. Acta Geogr. Sin. 2019, 74, 814–830. [Google Scholar]
- Shi, Y.Q.; Yu, H.; Chen, T.; Deng, H.B. Evolution stages, characteristics and spatial differentiation effect of urban tourism efficiency: A case study of Hainan International Tourism Island. Econ. Geogr. 2015, 35, 202–209. [Google Scholar]
- Wang, X.; Yao, H.X. The non-linear and dynamic effects of OFDI in Yangtze River Delta on regional technology innovation: An empirical analysis based on absorptive capacity and panel smooth transition regression model. World Econ. Stud. 2016, 11, 86–100+136–137. [Google Scholar]
- Yuan, H.X.; Liu, Y.B.; Feng, Y.D. How does financial agglomeration affect green development Efficiency? Empirical analysis of SPDM and PTR models considering spatio-temporal double fixation. Chin. J. Manag. Sci. 2019, 27, 61–75. [Google Scholar]
- Lesage, J.P.; Pace, P.K. Introduce to Spatial Econometrics; Taylor & Francis: Boca Raton, FL, USA, 2009; pp. 23–36. [Google Scholar]
- Gunter, U.; Onder, I. Forecasting international city tourism demand for Paris: Accuracy of uni- and multivariate models employing monthly data. Tour. Manag. 2015, 46, 123–135. [Google Scholar] [CrossRef]
- Maxim, C. Challenges faced by world tourism cities-London’s perspective. Curr. Issues Tour. 2019, 22, 1006–1024. [Google Scholar] [CrossRef]
- Tong, Y.; Zhang, R.; He, B. The Carbon Emission Reduction Effect of Tourism Economy and Its Formation Mechanism: An Empirical Study of China’s 92 Tourism-Dependent Cities. Int. J. Environ. Res. Public Health 2022, 19, 1824. [Google Scholar] [CrossRef] [PubMed]
- Sun, Y.; Hou, G. Analysis on the Spatial-Temporal Evolution Characteristics and Spatial Network Structure of Tourism Eco-Efficiency in the Yangtze River Delta Urban Agglomeration. Int. J. Environ. Res. Public Health 2021, 18, 2577. [Google Scholar] [CrossRef] [PubMed]
- Liu, Y.; Suk, S. Coupling and Coordinating Relationship between Tourism Economy and Ecological Environment—A Case Study of Nagasaki Prefecture, Japan. Int. J. Environ. Res. Public Health 2021, 18, 12818. [Google Scholar] [CrossRef] [PubMed]
- Butler, R. COVID-19 and its potential impact on stages of tourist Destination Development. Curr. Issues Tour. 2021, 1–4. [Google Scholar] [CrossRef]
- Albaladejo, I.P.; Gonzalez-Martinez, M. Congestion affecting the dynamic of tourism demand: Evidence from the most popular destinations in Spain. Curr. Issues Tour. 2019, 22, 1638–1652. [Google Scholar] [CrossRef]


| The Index Type | Index | Variable | Unit |
|---|---|---|---|
| Input indicators | Number of tertiary industry employees | X1 | Ten thousand people |
| Investment in urban fixed assets | X2 | Ten thousand yuan | |
| Number of star hotel rooms | X3 | The room | |
| Tourism resources endowment | X4 | - | |
| Knowledge innovation | X5 | - | |
| Output indicators | Tourist Reception | Y1 | Person-time |
| Total income from tourism | Y2 | One hundred million yuan | |
| Environmental health quality | Y3 | % |
| Period | TE:EBM-I-C | PTE:EBM-I-V | SE:EBM-I-V | CCR-I-C | SBM-I-C |
|---|---|---|---|---|---|
| 2001 | 0.6561 | 0.9671 | 0.6697 | 0.7243 | 0.5458 |
| 2002 | 0.6367 | 0.9636 | 0.6532 | 0.7314 | 0.5060 |
| 2003 | 0.4964 | 0.9513 | 0.5131 | 0.5514 | 0.4170 |
| 2004 | 0.7183 | 0.9626 | 0.7368 | 0.8125 | 0.5977 |
| 2005 | 0.6963 | 0.9607 | 0.7169 | 0.8081 | 0.5596 |
| 2006 | 0.7093 | 0.9440 | 0.7458 | 0.8219 | 0.5578 |
| 2007 | 0.7058 | 0.9667 | 0.7305 | 0.8679 | 0.5132 |
| 2008 | 0.7684 | 0.9668 | 0.7941 | 0.9110 | 0.6110 |
| 2009 | 0.7172 | 0.8886 | 0.8054 | 0.8362 | 0.5398 |
| 2010 | 0.6886 | 0.9804 | 0.6980 | 0.7488 | 0.6098 |
| 2011 | 0.5302 | 0.9486 | 0.5551 | 0.5869 | 0.4407 |
| 2012 | 0.8699 | 0.9514 | 0.9169 | 0.9142 | 0.7975 |
| 2013 | 0.8538 | 0.9228 | 0.9242 | 0.8957 | 0.7861 |
| 2014 | 0.8451 | 0.9216 | 0.9150 | 0.8777 | 0.7982 |
| 2015 | 0.9246 | 0.9614 | 0.9580 | 0.9511 | 0.8875 |
| 2016 | 0.8148 | 0.9214 | 0.8753 | 0.8536 | 0.7524 |
| 2017 | 0.7525 | 0.9045 | 0.8318 | 0.7893 | 0.6820 |
| 2018 | 0.9149 | 0.9440 | 0.9662 | 0.9421 | 0.8593 |
| 2019 | 0.8708 | 0.9481 | 0.9173 | 0.9091 | 0.8057 |
| 2020 | 0.7010 | 0.8366 | 0.8392 | 0.7509 | 0.5733 |
| Mean value | 0.7435 | 0.9406 | 0.7881 | 0.8142 | 0.6420 |
| City | TE:EBM-I-C | PTE:EBM-I-V | SE:EBM-I-V |
|---|---|---|---|
| Haikou | 0.9782 | 0.9795 | 0.9984 |
| Sanya | 0.9942 | 1.0000 | 0.9942 |
| Danzhou | 0.6596 | 0.8321 | 0.8073 |
| Wuzhishan | 0.6035 | 0.9543 | 0.6348 |
| Qionghai | 0.7788 | 0.8696 | 0.8983 |
| Wenchang | 0.9510 | 0.9666 | 0.9840 |
| Wanning | 0.9444 | 0.9658 | 0.9695 |
| Dongfang | 0.6808 | 0.9483 | 0.7154 |
| Chengmai | 0.8361 | 0.9148 | 0.9044 |
| Dingan | 0.5591 | 0.8729 | 0.6361 |
| Tunchang | 0.5712 | 0.9781 | 0.5832 |
| Lingao | 0.7846 | 0.9504 | 0.8177 |
| Changjiang | 0.6193 | 0.9399 | 0.6464 |
| Ledong | 0.5853 | 0.9136 | 0.6528 |
| Lingshui | 0.6685 | 0.9233 | 0.7177 |
| Baoting | 0.6946 | 0.9847 | 0.7053 |
| Qiongzhong | 0.7310 | 0.9965 | 0.7327 |
| Total | 0.7435 | 0.9406 | 0.7881 |
| Variable | Geographical Distance Weight Matrix | Economic Distance Weight Matrix | ||
|---|---|---|---|---|
| Coefficient | p Values | Coefficient | p Values | |
| lnIIUFA | 0.5098 ** | 0.037 | 0.4091 | 0.196 |
| (2.09) | (1.29) | |||
| lnNOTIE | 1.0871 *** | 0.000 | 0.3426 | 0.257 |
| (3.86) | (1.13) | |||
| lnNOSHR | 0.2354 | 0.141 | −0.0817 | 0.655 |
| (1.47) | (−0.45) | |||
| lnTRE | 1.1202 *** | 0.000 | 0.9643 *** | 0.000 |
| (8.74) | (6.49) | |||
| lnKI | 0.8646 | 0.167 | 1.4382 * | 0.072 |
| (1.38) | (1.80) | |||
| W*lnIIUFA | −2.6000 | 0.119 | 3.8044 *** | 0.000 |
| (−1.56) | (5.38) | |||
| W*lnNOTIE | 10.3377 *** | 0.000 | − 0.6950 | 0.274 |
| (5.39) | (−1.09) | |||
| W*lnNOSHR | 0.3480 | 0.724 | −1.6883 *** | 0.000 |
| (0.35) | (−3.57) | |||
| W*lnTRE | 5.0744 *** | 0.000 | 0.8831 ** | 0.015 |
| (5.99) | (2.43) | |||
| W*lnKI | −4.388 | 0.225 | 5.3116 ** | 0.014 |
| (−1.21) | (2.44) | |||
| Space effect | control | control | ||
| Time effect | control | control | ||
| Log-likelihood | 827.6163 | 855.2701 | ||
| R party | 0.4356 | 0.4537 | ||
| Variable | Direct Effect | Indirect Effect | Total Effect | ||||
|---|---|---|---|---|---|---|---|
| Coefficient | p Values | Coefficient | p Values | Coefficient | p Values | ||
| Geographical distance weight matrix | lnIIUFA | 0.8603 *** | 0.002 | −1.4939 ** | 0.023 | −0.6335 | 0.283 |
| (3.14) | (−2.28) | (−1.07) | |||||
| lnNOTIE | 0.3044 | 0.321 | 3.3518 *** | 0.000 | 3.6563 *** | 0.000 | |
| (0.99) | (4.43) | (5.28) | |||||
| lnNOSHR | 0.2668 | 0.170 | −0.0814 | 0.834 | 0.1854 | 0.555 | |
| (1.37) | (−0.21) | (0.59) | |||||
| lnTRE | 0.8425 *** | 0.000 | 1.1754 *** | 0.001 | 2.0179 *** | 0.000 | |
| (5.73) | (3.32) | (6.92) | |||||
| lnKI | 1.4576 ** | 0.037 | −2.5965 * | 0.072 | −1.1389 | 0.366 | |
| (2.08) | (−1.8) | (−0.9) | |||||
| Economic distance weight matrix | lnIIUFA | 0.2450 | 0.468 | 3.2316 *** | 0.000 | 3.4766 *** | 0.000 |
| (0.73) | (5.5) | (6.16) | |||||
| lnNOTIE | 0.3652 | 0.225 | −0.6770 | 0.236 | −0.3118 | 0.628 | |
| (1.21) | (−1.18) | (−0.48) | |||||
| lnNOSHR | 0.0143 | 0.936 | −1.4727 *** | 0.000 | −1.4585 *** | 0.000 | |
| (0.08) | (−3.86) | (− 3.63) | |||||
| lnTRE | 0.9201 *** | 0.000 | 0.6116 ** | 0.034 | 1.5317 *** | 0.000 | |
| (6.68) | (2.13) | (5.02) | |||||
| lnKI | 1.2244 | 0.109 | 4.4281 ** | 0.016 | 5.6525 *** | 0.01 | |
| (1.6) | (2.4) | (2.56) | |||||
Publisher’s Note: MDPI stays neutral with regard to jurisdictional claims in published maps and institutional affiliations. |
© 2022 by the authors. Licensee MDPI, Basel, Switzerland. This article is an open access article distributed under the terms and conditions of the Creative Commons Attribution (CC BY) license (https://creativecommons.org/licenses/by/4.0/).
Share and Cite
Zhang, P.; Yu, H.; Shen, M.; Guo, W. Evaluation of Tourism Development Efficiency and Spatial Spillover Effect Based on EBM Model: The Case of Hainan Island, China. Int. J. Environ. Res. Public Health 2022, 19, 3755. https://doi.org/10.3390/ijerph19073755
Zhang P, Yu H, Shen M, Guo W. Evaluation of Tourism Development Efficiency and Spatial Spillover Effect Based on EBM Model: The Case of Hainan Island, China. International Journal of Environmental Research and Public Health. 2022; 19(7):3755. https://doi.org/10.3390/ijerph19073755
Chicago/Turabian StyleZhang, Pengfei, Hu Yu, Mingzhe Shen, and Wei Guo. 2022. "Evaluation of Tourism Development Efficiency and Spatial Spillover Effect Based on EBM Model: The Case of Hainan Island, China" International Journal of Environmental Research and Public Health 19, no. 7: 3755. https://doi.org/10.3390/ijerph19073755
APA StyleZhang, P., Yu, H., Shen, M., & Guo, W. (2022). Evaluation of Tourism Development Efficiency and Spatial Spillover Effect Based on EBM Model: The Case of Hainan Island, China. International Journal of Environmental Research and Public Health, 19(7), 3755. https://doi.org/10.3390/ijerph19073755