
Altered Visual Reliance Induced by Stroboscopic Glasses during Postural Control

Abstract
:1. Introduction
2. Materials and Methodology
2.1. Participants
2.2. Experimental Procedures
2.3. Data Processing
2.4. Statistical Analysis
3. Results
3.1. Static Postural Control
3.2. Dynamic Postural Control
4. Discussion
4.1. Clinical Implication
4.2. Limitations
5. Conclusions
Author Contributions
Funding
Institutional Review Board Statement
Informed Consent Statement
Data Availability Statement
Acknowledgments
Conflicts of Interest
Appendix A

| Variables | Surface | Visual Condition, Mean (SD) | |||
|---|---|---|---|---|---|
| EO | HSV | LSV | EC | ||
| CoP-ML (cm) | Firm | 3.49 (0.57) | 4.89 (1.79) | 4.60 (1.45) | 5.14 (1.61) |
| Foam | 4.53 (0.92) | 7.20 (1.89) | 7.16 (1.61) | 7.38 (1.45) | |
| CoP-AP (cm) | Firm | 3.83 (0.59) | 5.07 (1.25) | 4.92 (1.00) | 5.37 (1.16) |
| Foam | 5.24 (1.16) | 8.57 (1.92) | 8.11 (1.45) | 8.39 (1.54) | |
| Area of 95% ellipse of CoP path (cm2) | Firm | 4.56 (2.13) | 17.80 (10.04) | 14.60 (7.01) | 18.74 (7.76) |
| Foam | 7.51 (3.57) | 29.76 (10.92) | 27.95 (10.53) | 29.17 (8.63) | |
Appendix B
| Variables | Surface | Visual Condition, Mean (SD) | ||
|---|---|---|---|---|
| EO | HSV | LSV | ||
| DPSI | Firm | 0.42 (0.04) | 0.49 (0.06) | 0.51 (0.06) |
| Foam | 0.50 (0.06) | 0.49 (0.07) | 0.49 (0.06) | |
| MLSI | Firm | 0.07 (0.01) | 0.11 (0.03) | 0.11 (0.03) |
| Foam | 0.09 (0.02) | 0.11 (0.02) | 0.12 (0.03) | |
| APSI | Firm | 0.21 (0.03) | 0.24 (0.02) | 0.24 (0.03) |
| Foam | 0.23 (0.03) | 0.22 (0.03) | 0.23 (0.02) | |
| VSI | Firm | 0.41 (0.07) | 0.42 (0.07) | 0.43 (0.07) |
| Foam | 0.43 (0.08) | 0.42 (0.08) | 0.42 (0.07) | |
| YBT-A (%/LL) | Firm | 0.71 (0.06) | 0.69 (0.06) | 0.68 (0.06) |
| Foam | 0.68 (0.08) | 0.66 (0.08) | 0.64 (0.08) | |
| YBT-PM (%/LL) | Firm | 1.13 (0.10) | 1.09 (0.12) | 1.04 (0.09) |
| Foam | 1.11 (0.09) | 1.02 (0.13) | 1.00 (0.08) | |
| YBT-PL (%/LL) | Firm | 0.10 (0.05) | 0.10 (0.12) | 1.07 (0.11) |
| Foam | 0.99 (0.12) | 0.98 (0.14) | 0.93 (0.09) | |
References
- Horak, F.B.; MacPherson, J.M. Postural orientation and equilibrium. Handb. Physiol. 1996, 1, 255–292. [Google Scholar]
- Assländer, L.; Peterka, R.J. Sensory reweighting dynamics in human postural control. J. Neurophysiol. 2014, 111, 1852–1864. [Google Scholar] [CrossRef] [PubMed] [Green Version]
- Nashner, L.; Berthoz, A. Visual contribution to rapid motor responses during postural control. Brain Res. 1978, 150, 403–407. [Google Scholar] [CrossRef]
- Honeine, J.-L.; Schieppati, M. Time-interval for integration of stabilizing haptic and visual information in subjects balancing under static and dynamic conditions. Front. Syst. Neurosci. 2014, 8, 190. [Google Scholar] [CrossRef] [PubMed] [Green Version]
- Grooms, D.R.; Page, S.J.; Nichols-Larsen, D.S.; Chaudhari, A.M.; White, S.E.; Onate, J.A. Neuroplasticity Associated with Anterior Cruciate Ligament Re-construction. J. Orthop. Sports Phys. Ther. 2017, 47, 180–189. [Google Scholar] [CrossRef] [PubMed]
- Song, K.; Burcal, C.J.; Hertel, J.; Wikstrom, E.A. Increased Visual Use in Chronic Ankle Instability: A Meta-analysis. Med. Sci. Sports Exerc. 2016, 48, 2046–2056. [Google Scholar] [CrossRef] [PubMed]
- Kim, K.-M.; Kim, J.-S.; Grooms, D.R. Stroboscopic Vision to Induce Sensory Reweighting During Postural Control. J. Sport Rehabil. 2017, 26, 1–11. [Google Scholar] [CrossRef] [PubMed] [Green Version]
- Song, K.; Rhodes, E.; Wikstrom, E. Balance Training Does Not Alter Reliance on Visual Information during Static Stance in Those with Chronic Ankle Instability: A Systematic Review with Meta-Analysis. Sports Med. 2018, 48, 893–905. [Google Scholar] [CrossRef] [PubMed]
- Clark, J.F.; Ellis, J.K.; Bench, J.; Khoury, J.; Graman, P. High-Performance Vision Training Improves Batting Statistics for University of Cincinnati Baseball Players. PLoS ONE 2012, 7, e29109. [Google Scholar] [CrossRef] [PubMed] [Green Version]
- Kim, H.; Son, S.J.; Seeley, M.K.; Hopkins, J.T. Kinetic Compensations due to Chronic Ankle Instability during Landing and Jumping. Med. Sci. Sports Exerc. 2018, 50, 308–317. [Google Scholar] [CrossRef] [PubMed]
- Wikstrom, E.A.; Tillman, M.D.; Smith, A.N.; Borsa, P.A. A new force-plate technology measure of dynamic postural stability: The dynamic postural stability index. J. Athl. Train. 2005, 40, 305–309. [Google Scholar] [PubMed]
- Hertel, J.; Braham, R.A.; Hale, S.A.; Olmsted-Kramer, L.C. Simplifying the Star Excursion Balance Test: Analyses of Subjects with and Without Chronic Ankle Instability. J. Orthop. Sports Phys. Ther. 2006, 36, 131–137. [Google Scholar] [CrossRef] [PubMed] [Green Version]
- Tjernström, F.; Björklund, M.; Malmström, E.M. Romberg ratio in quiet stance posturography test-to-retest reliabil-ity. Gait Posture 2015, 42, 27–31. [Google Scholar] [CrossRef] [PubMed] [Green Version]
- Lacour, M.; Barthelemy, J.; Borel, L.; Magnan, J.; Xerri, C.; Chays, A.; Ouaknine, M. Sensory strategies in human postural control before and after unilateral vestibular neurotomy. Exp. Brain Res. 1997, 115, 300–310. [Google Scholar] [CrossRef] [PubMed]
- Isableu, B.; Ohlmann, T.; Crémieux, J.; Amblard, B. Differential approach to strategies of segmental stabilisation in postural control. Exp. Brain Res. 2003, 150, 208–221. [Google Scholar] [CrossRef] [PubMed]
- Kim, K.-M.; Kim, J.-S.; Oh, J.; Grooms, D.R. Stroboscopic Vision as a Dynamic Sensory Reweighting Alternative to the Sensory Organization Test. J. Sport Rehabil. 2021, 30, 166–172. [Google Scholar] [CrossRef] [PubMed]
- Peterka, R.J.; Loughlin, P.J. Dynamic Regulation of Sensorimotor Integration in Human Postural Control. J. Neurophysiol. 2004, 91, 410–423. [Google Scholar] [CrossRef] [PubMed] [Green Version]
- Mckeon, P.O.; Ingersoll, C.D.; Kerrigan, D.C.; Saliba, E.; Bennett, B.C.; Hertel, J. Balance Training Improves Function and Postural Control in Those with Chronic Ankle Instability. Med. Sci. Sports Exerc. 2008, 40, 1810–1819. [Google Scholar] [CrossRef] [PubMed]
- Grooms, D.; Appelbaum, G.; Onate, J. Neuroplasticity Following Anterior Cruciate Ligament Injury: A Framework for Visual-Motor Training Approaches in Rehabilitation. J. Orthop. Sports Phys. Ther. 2015, 45, 381–393. [Google Scholar] [CrossRef] [PubMed]


| Characteristics | Participants, Mean (SD) |
|---|---|
| Sex, male/female | 12/12 |
| Age, y | 21.8 (2.5) |
| Height, cm | 172.0 (7.8) |
| Mass, kg | 73.6 (23.3) |
| FAAM-ADL, % | 0.0 (0.0) |
| FAAM-Sport, % | 0.0 (0.0) |
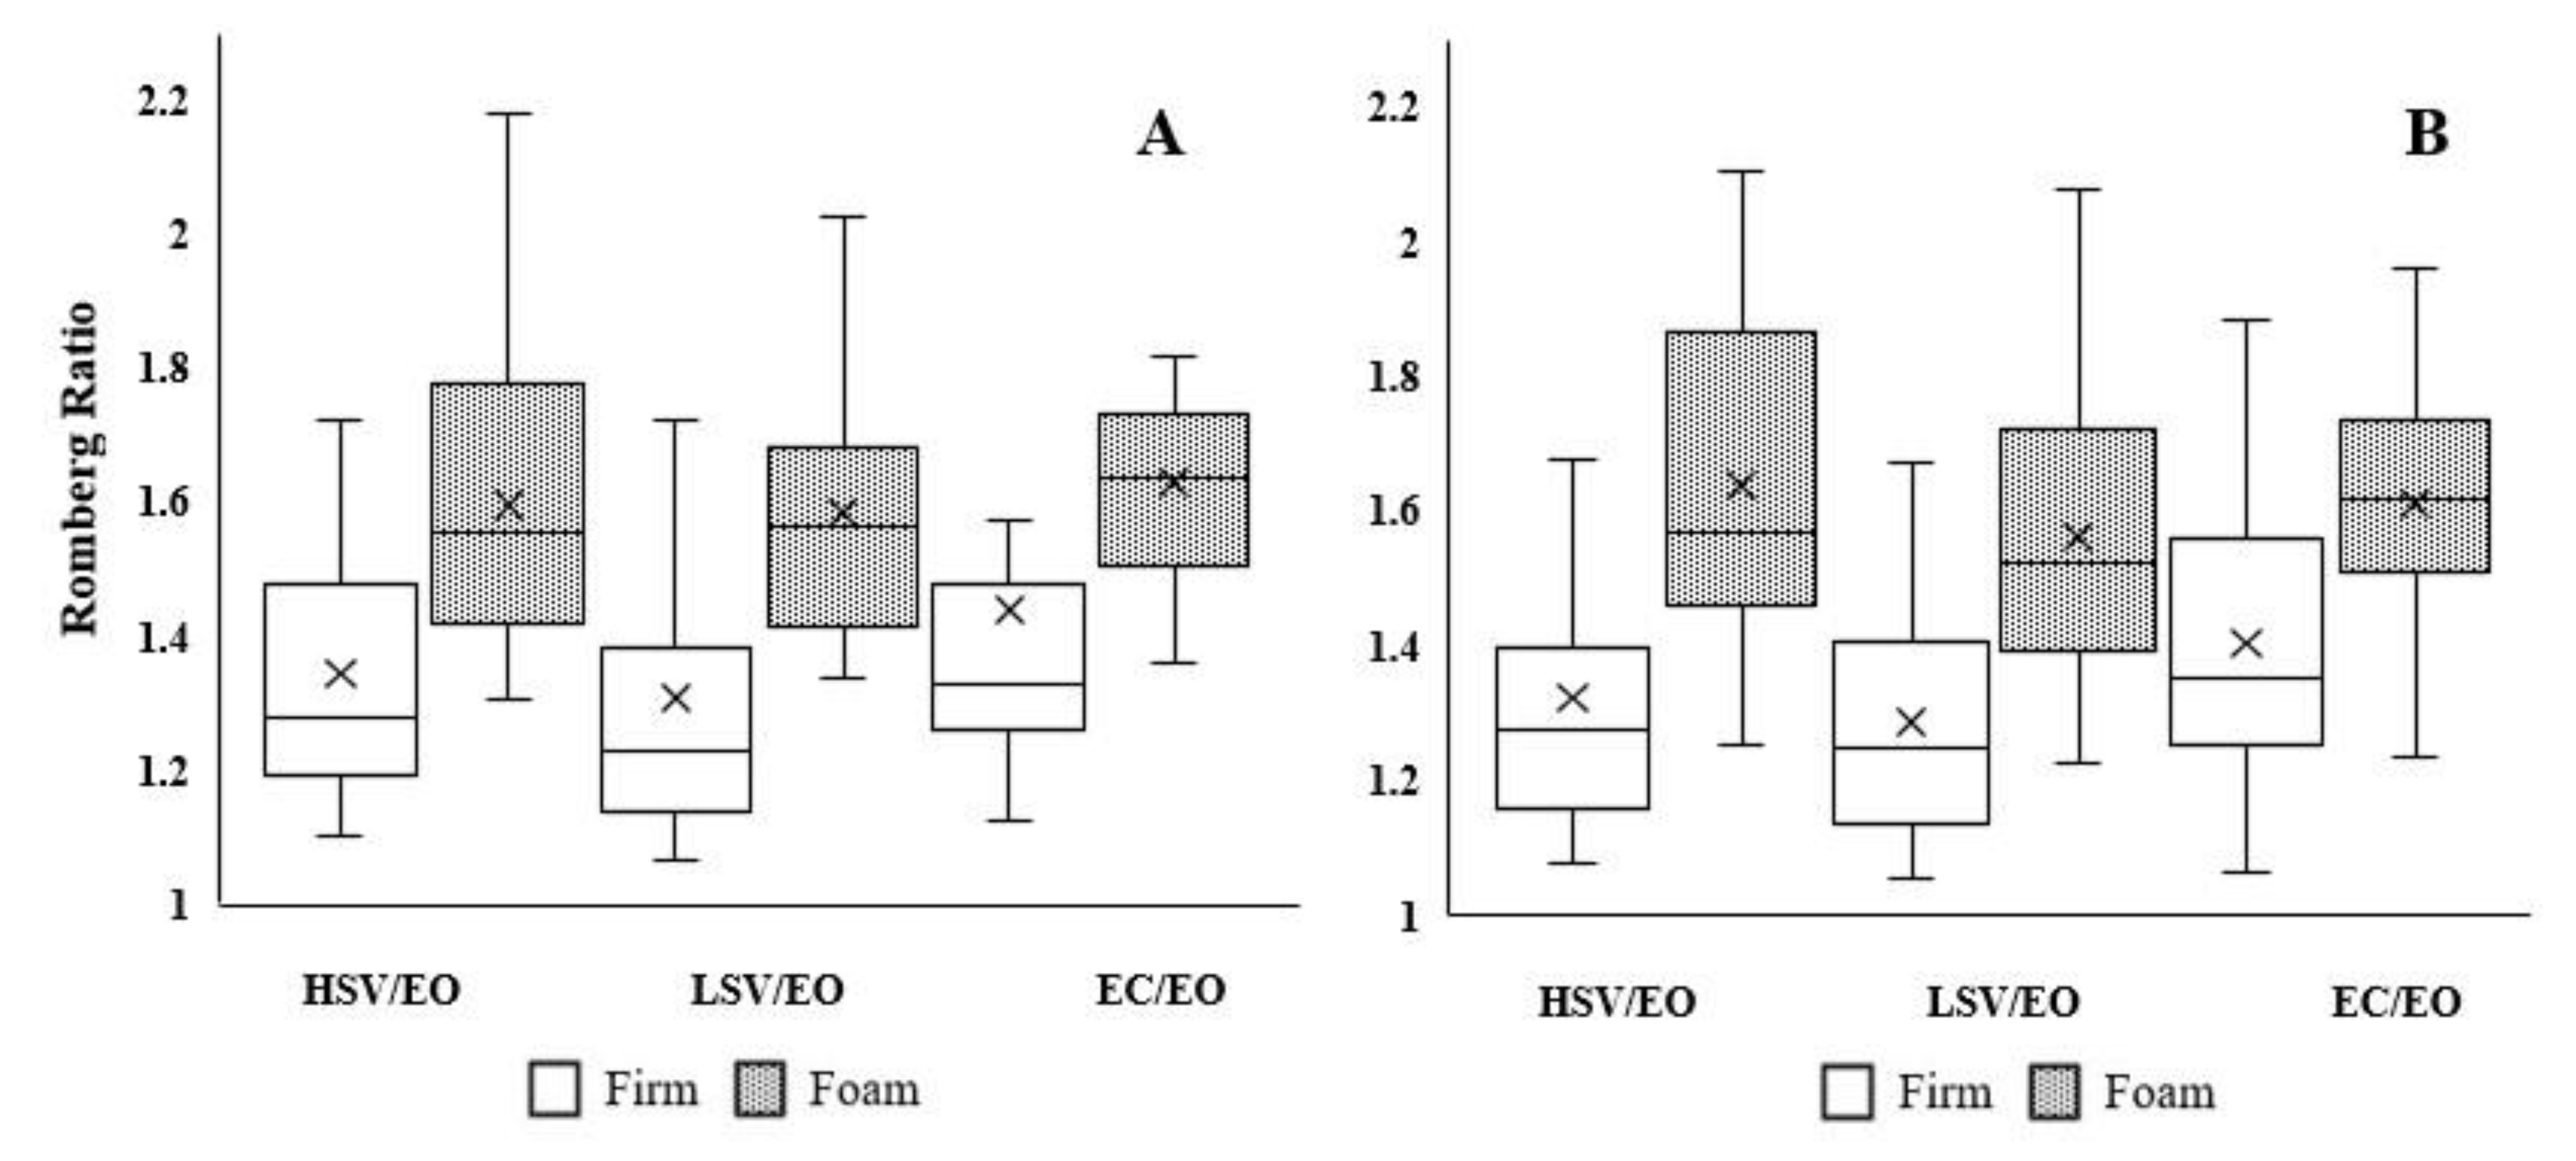
| Romberg Ratio, Mean (SD) | RMANOVA | Effect Size, Cohen’s d (95%) | |||||
|---|---|---|---|---|---|---|---|
| Visual Condition | Firm Surface | Foam Surface | Surface Main Effect | Visual Condition Main Effect | Interaction | Firm vs. Foam | |
| CoP-ML a | HSV/EO | 1.38 (0.31) | 1.59 (0.23) | F5,138 = 31.79 p < 0.0001 | F5,138 = 1.96 p = 0.15 | F5,138 = 0.57 p = 0.56 | 0.88 (0.30–1.45) |
| LSV/EO | 1.29 (0.25) | 1.59 (0.21) | 1.18 (0.59–1.76) | ||||
| EC/EO | 1.45 (0.26) | 1.63 (0.17) | 0.76 (0.18–1.33) | ||||
| CoP-AP a | HSV/EO | 1.32 (0.22) | 1.64 (0.25) | F5,138 = 58.93 p < 0.0001 | F5,138 = 1.99 p = 0.14 | F5,138 = 0.85 p = 0.43 | 1.52 (0.92–2.11) |
| LSV/EO | 1.29 (0.17) | 1.56 (0.21) | 1.32 (0.73–1.91) | ||||
| EC/EO | 1.40 (0.20) | 1.61 (0.20) | 0.99 (0.42–1.57) | ||||
| Area of 95% ellipse of CoP total path | HSV/EO | 4.59 (2.82) | 4.57 (2.38) | F5,138 = 0.03 p = 0.28 | F5,138 = 1.27 p = 0.28 | F5,138 = 0.43 p = 0.65 | 0.01 (−5.84–5.86) |
| LSV/EO | 3.69 (1.99) | 4.20 (1.80) | 2.42 (−3.45–8.28) | ||||
| EC/EO | 4.68 (2.09) | 4.38 (1.63) | 1.45 (−4.41–7.30) | ||||
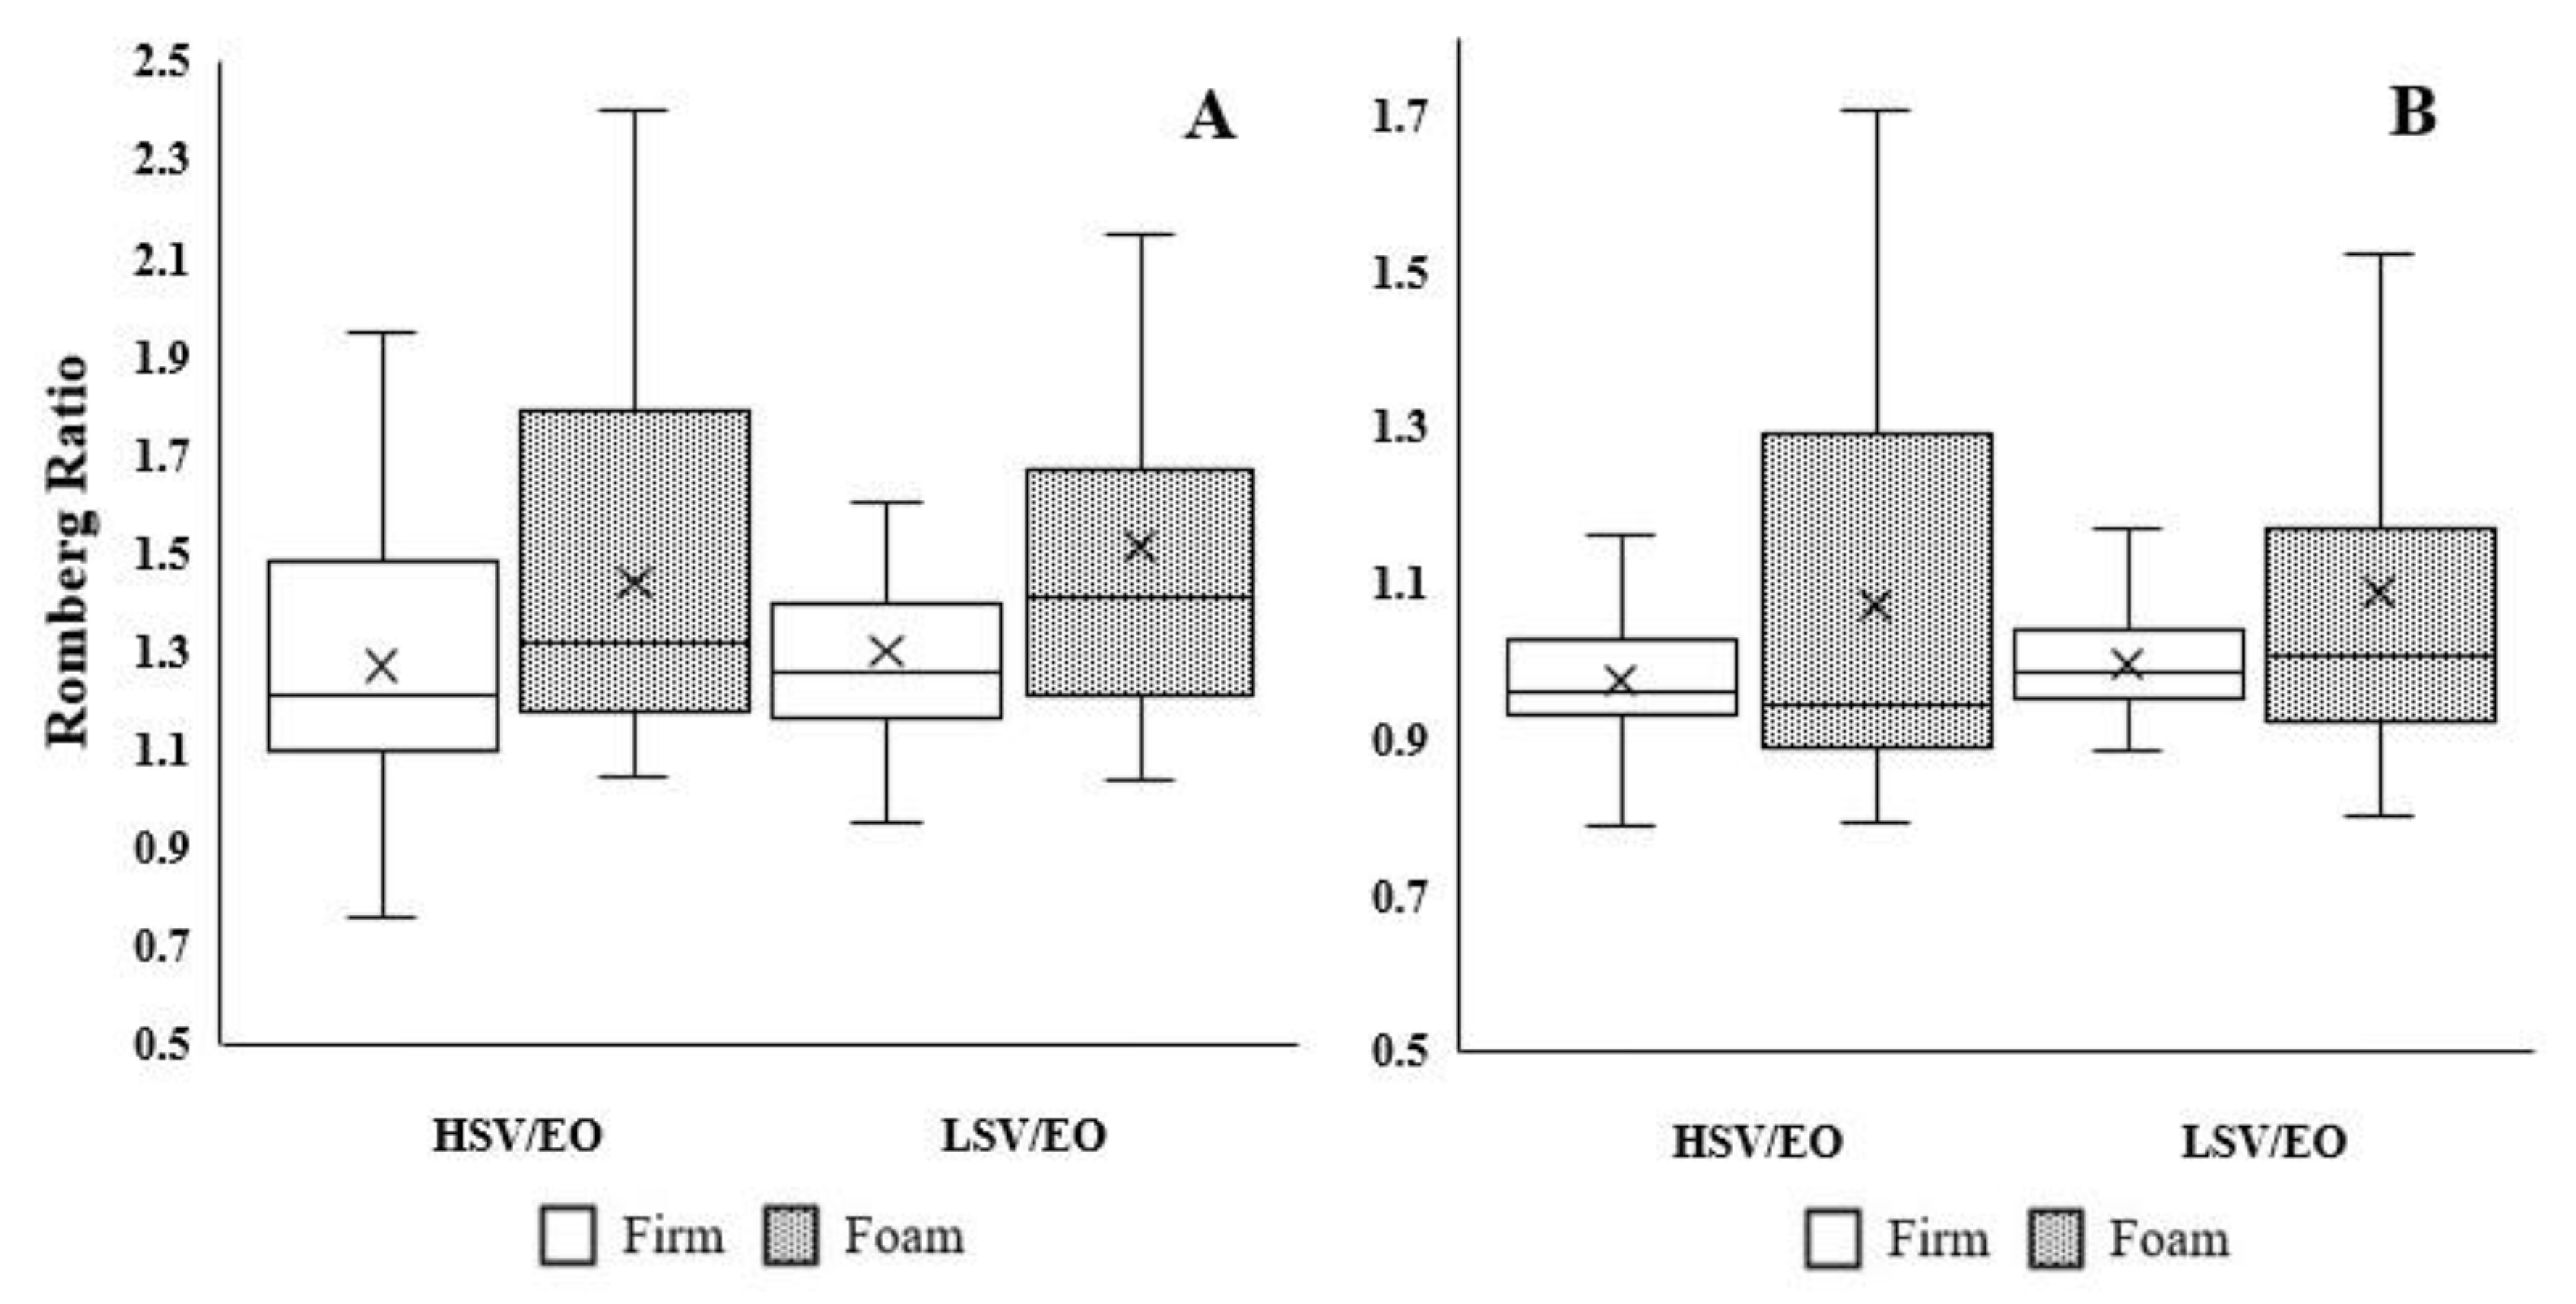
| Romberg Ratio, Mean (SD) | RMANOVA | Effect Size, Cohen’s d (95%) | |||||
|---|---|---|---|---|---|---|---|
| Visual Condition | Firm Surface | Foam Surface | Surface Main Effect | Visual Condition Main Effect | Interaction | Firm vs. Foam | |
| DPSI | HSV/EO | 1.15 (0.14) | 1.19 (0.10) | F3,92 = 1.54 p = 0.22 | F3,92 = 0.75 p = 0.39 | F3,92 = 0.12 p = 0.71 | 0.18 (−0.38–0.75) |
| LSV/EO | 1.16 (0.15) | 1.22 (0.08) | 0.32 (−0.25–0.89) | ||||
| MLSIa | HSV/EO | 1.27 (0.29) | 1.44 (0.34) | F3,92 = 8.01 p = 0.01 | F3,92 = 0.61 p = 0.44 | F3,92 = 0.12 p = 0.73 | 0.51 (−0.06–1.08) |
| LSV/EO | 1.30 (0.24) | 1.51 (0.42) | 0.65 (0.07–1.22) | ||||
| APSIa | HSV/EO | 0.98 (0.28) | 1.07 (0.25) | F3,92 = 6.42 p = 0.01 | F3,92 = 0.27 p = 0.61 | F3,92 = 0.01 p = 0.94 | 0.53 (−0.04–1.10) |
| LSV/EO | 1.00 (0.27) | 1.09 (0.24) | 0.50 (−0.07–1.07) | ||||
| VSI | HSV/EO | 0.99 (0.10) | 0.99 (0.08) | F3,92 = 0.28 p = 0.59 | F3,92 = 0.53 p = 0.47 | F3,92 = 0.32 p = 0.57 | 0.01 (−0.55–0.57) |
| LSV/EO | 0.99 (0.11) | 1.02 (0.09) | 0.22 (−0.34–0.79) | ||||
| YBT-A | HSV/EO | 0.98 (0.05) | 0.98 (0.05) | F3,92 = 0.40 p = 0.53 | F3,92 = 5.13 p = 0.03 | F3,92 = 0.08 p = 0.77 | 0.07 (−0.50–0.63) |
| LSV/EO | 0.96 (0.04) | 0.95 (0.05) | 0.19 (−0.38–0.75) | ||||
| YBT-PL b | HSV/EO | 1.00 (0.12) | 0.98 (0.07) | F3,92 = 0.10 p = 0.75 | F3,92 = 7.14 p = 0.01 | F3,92 = 0.27 p = 0.60 | 0.17 (−0.40–0.74) |
| LSV/EO | 0.94 (0.08) | 0.95 (0.07) | 0.04 (−0.52–0.61) | ||||
| YBT-PM a | HSV/EO | 0.97 (0.08) | 0.92 (0.07) | F3,92 = 7.32 p = 0.01 | F3,92 = 1.03 p = 0.31 | F3,92 = 0.03 p = 0.87 | 0.59 (0.01–1.16) |
| LSV/EO | 0.95 (0.07) | 0.91 (0.07) | 0.52 (−0.05–1.09) | ||||
Publisher’s Note: MDPI stays neutral with regard to jurisdictional claims in published maps and institutional affiliations. |
© 2022 by the authors. Licensee MDPI, Basel, Switzerland. This article is an open access article distributed under the terms and conditions of the Creative Commons Attribution (CC BY) license (https://creativecommons.org/licenses/by/4.0/).
Share and Cite
Lee, H.; Han, S.; Hopkins, J.T. Altered Visual Reliance Induced by Stroboscopic Glasses during Postural Control. Int. J. Environ. Res. Public Health 2022, 19, 2076. https://doi.org/10.3390/ijerph19042076
Lee H, Han S, Hopkins JT. Altered Visual Reliance Induced by Stroboscopic Glasses during Postural Control. International Journal of Environmental Research and Public Health. 2022; 19(4):2076. https://doi.org/10.3390/ijerph19042076
Chicago/Turabian StyleLee, Hyunwook, Seunguk Han, and Jon Ty Hopkins. 2022. "Altered Visual Reliance Induced by Stroboscopic Glasses during Postural Control" International Journal of Environmental Research and Public Health 19, no. 4: 2076. https://doi.org/10.3390/ijerph19042076
APA StyleLee, H., Han, S., & Hopkins, J. T. (2022). Altered Visual Reliance Induced by Stroboscopic Glasses during Postural Control. International Journal of Environmental Research and Public Health, 19(4), 2076. https://doi.org/10.3390/ijerph19042076