2.2. Experimental Equipment and Questionnaire
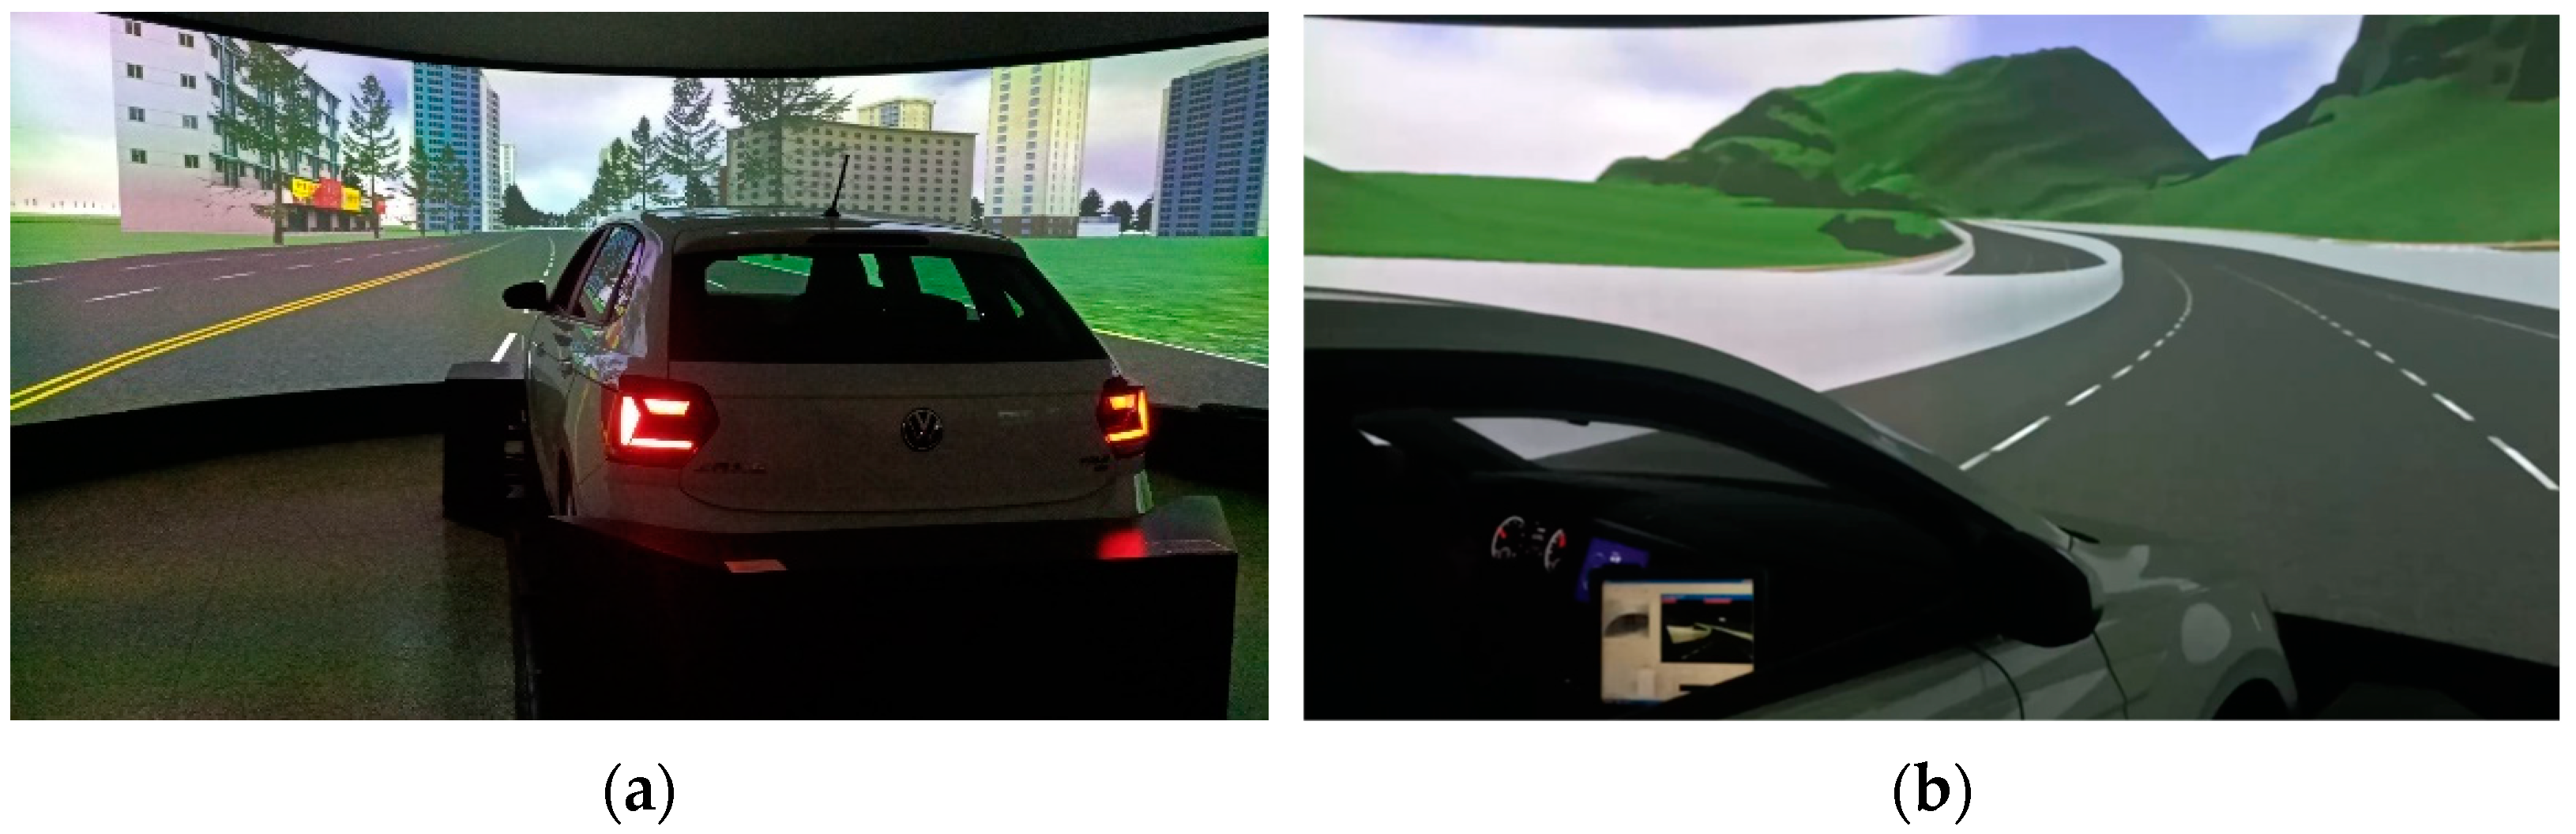
In this experiment, UC-WIN /Road13.0 software (FORUM8, Tokyo, Japan) was used to design a simulated experiment driving scene, and the simulator was modified from a Shanghai Volkswagen POLO car, shown in
Figure 1. UC-win /Road13.0 software controlled 7 computers, among which 2 computers generated the simulated scenes of left and right rearview mirrors and sent them to the small LCD screens acting as rearview mirrors on both sides of the simulator. Five computers generated simulated road scenes, and scenes were delivered to five large display screens in front of the simulator to form a simulated driving environment.
- 2.
NASA-TLX scale
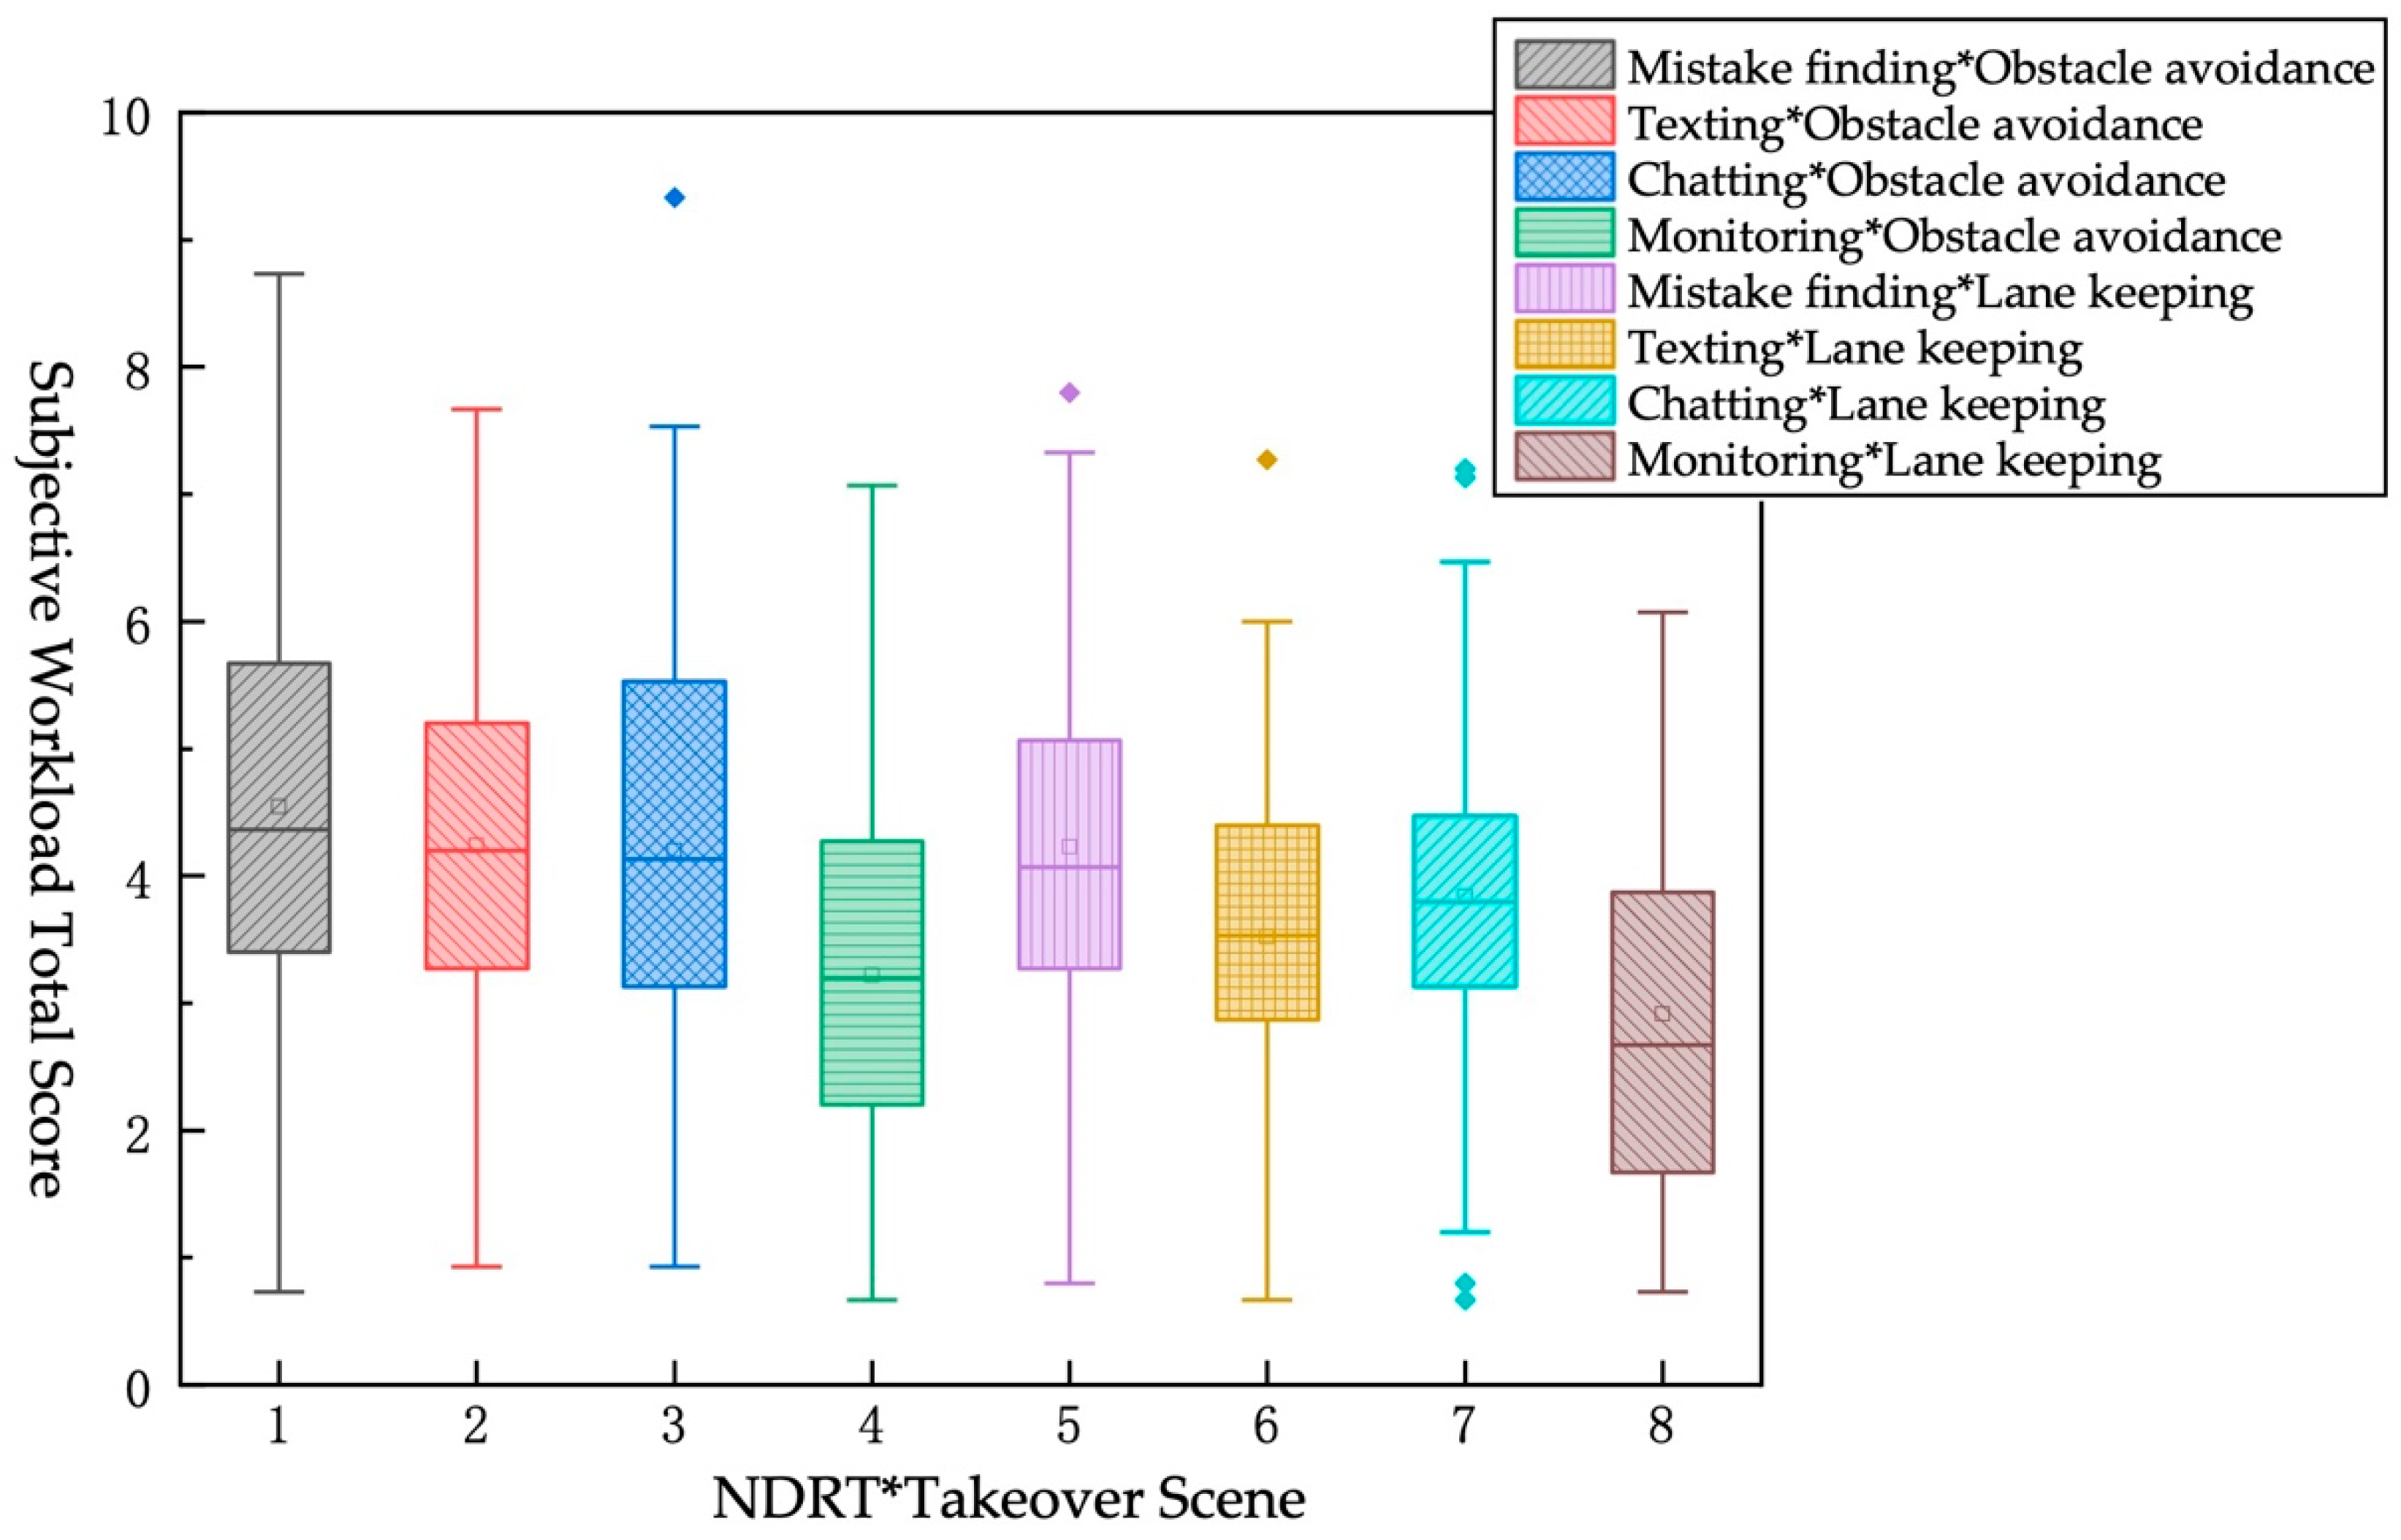
The NASA-TLX scale was used to evaluate the subjective workload in this experiment, which contained six indicators: mental demand, physical demand, time demand, satisfaction, effort level, and frustration level. The 6 indicators of the NASA-TLX scale are divided into 10 grades according to requirements or degrees, and they are ranked from the first to the sixth according to the degree of correlation to the total load, and thus, the final total subjective workload score was calculated. NASA-TLX scale is shown in the attachment.
- 3.
Dikablis Glasses Eye Tracker
The eye tracker is widely used to measure workers’ situation awareness from objective aspect [
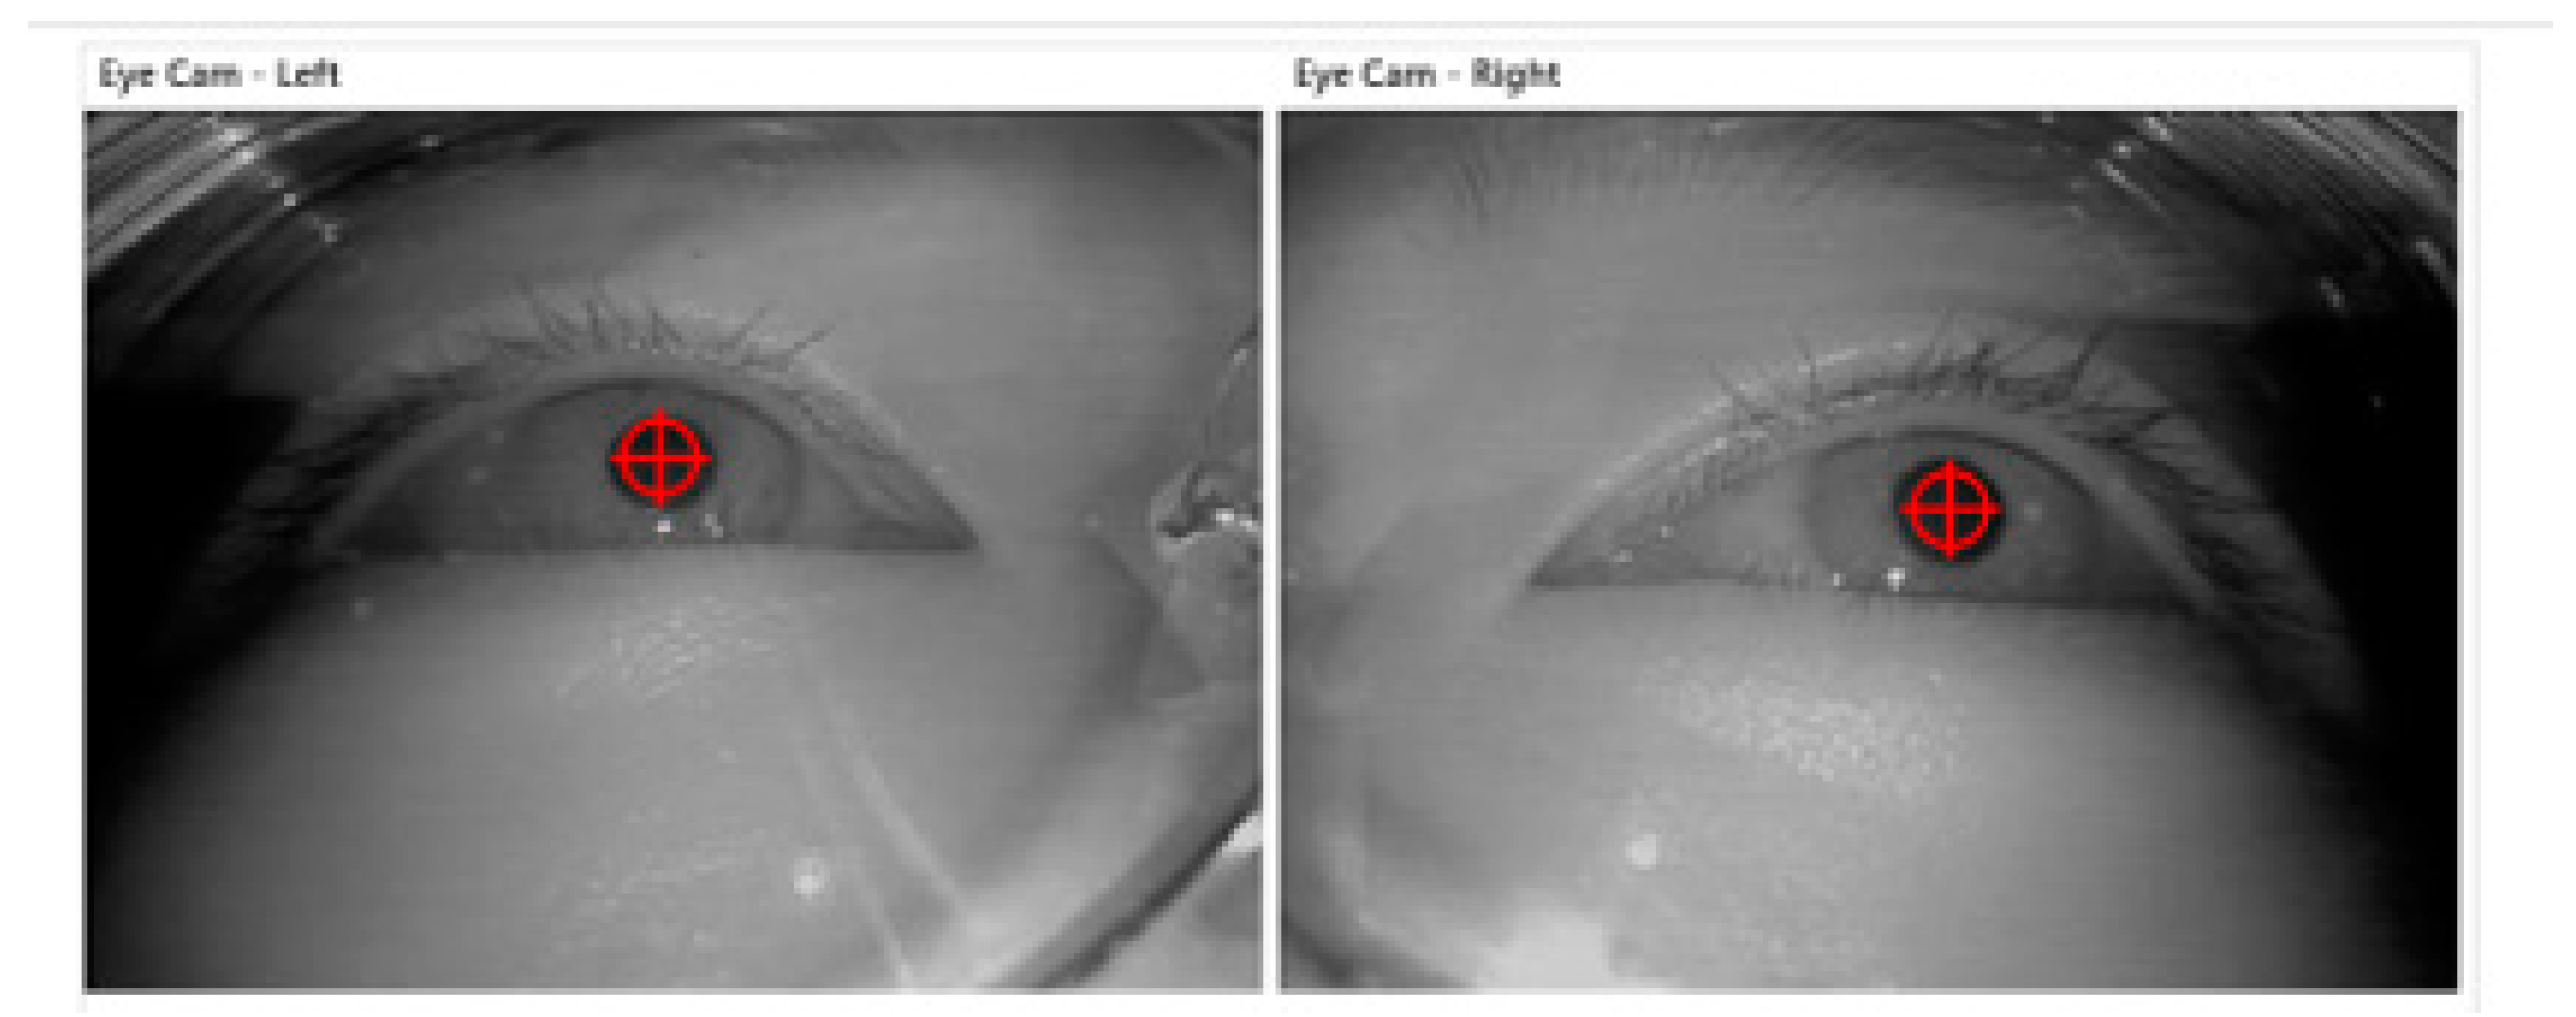
29]. Dikablis Glasses eye tracker is a non-invasive eye tracking system consisting of three channel cameras. The first and second cameras for visual characteristics are responsible for collecting eye movement data of left and right eyes, shown in
Figure 2; the third camera is responsible for collecting scene information in front of drivers. It can collect the driver’s line of sight, area of interest, PERCLOS, gaze, saccade, pupil, and other data.
2.4. Data Analysis
A total of 560 NASA-TLX valid questionnaires from 35 participants were obtained after selection. Next, we input the questionnaire data filled out by the participants into the SPSS software and calculated the weight of each indicator according to the ranking of the contribution to the total load and finally calculated the total subjective workload score based on the weight and the scores of 6 dimensions, calculated as follows:
where
S is the total score of NASA-TLX subjective workload,
Xi is the score of the
i dimension, and
Wi is the weight of the
i dimension.
To obtain the consistency or reliability of the questionnaire data, SPSS software was used to analyze the reliability of the NASA-TLX questionnaire, and the Cronbach’s alpha was 0.763, indicating that the questionnaire has good reliability and consistency. KMO (Kaiser–Meyer–Olkin) and Bartlett sphere test were performed on the NASA-TLX questionnaire; the KMO value was 0.854, and the Sig. value of Bartlett sphere test was 0.00, which is far less than 0.01, reaching the significance level and indicating that the questionnaire data were suitable for factor analysis.
Before performing variance analysis and correlation analysis, it was necessary to check whether the original data obeyed a normal distribution or an approximate normal distribution. The original data sample size used in this study is less than 5000, so it is more suitable to choose the non-parametric test method, such as Shapiro–Wilk test, which is suitable for small sample data. Under the test level of α = 0.05, the W test result of the subjective workload total score is 0.04, p = 0.04 < 0.05, and the sample data of the subjective workload total score do not follow a normal distribution. The W test result of the distraction degree score is 0.11, p = 0 < 0.05, and the sample data of the distraction degree score also do not obey the normal distribution.
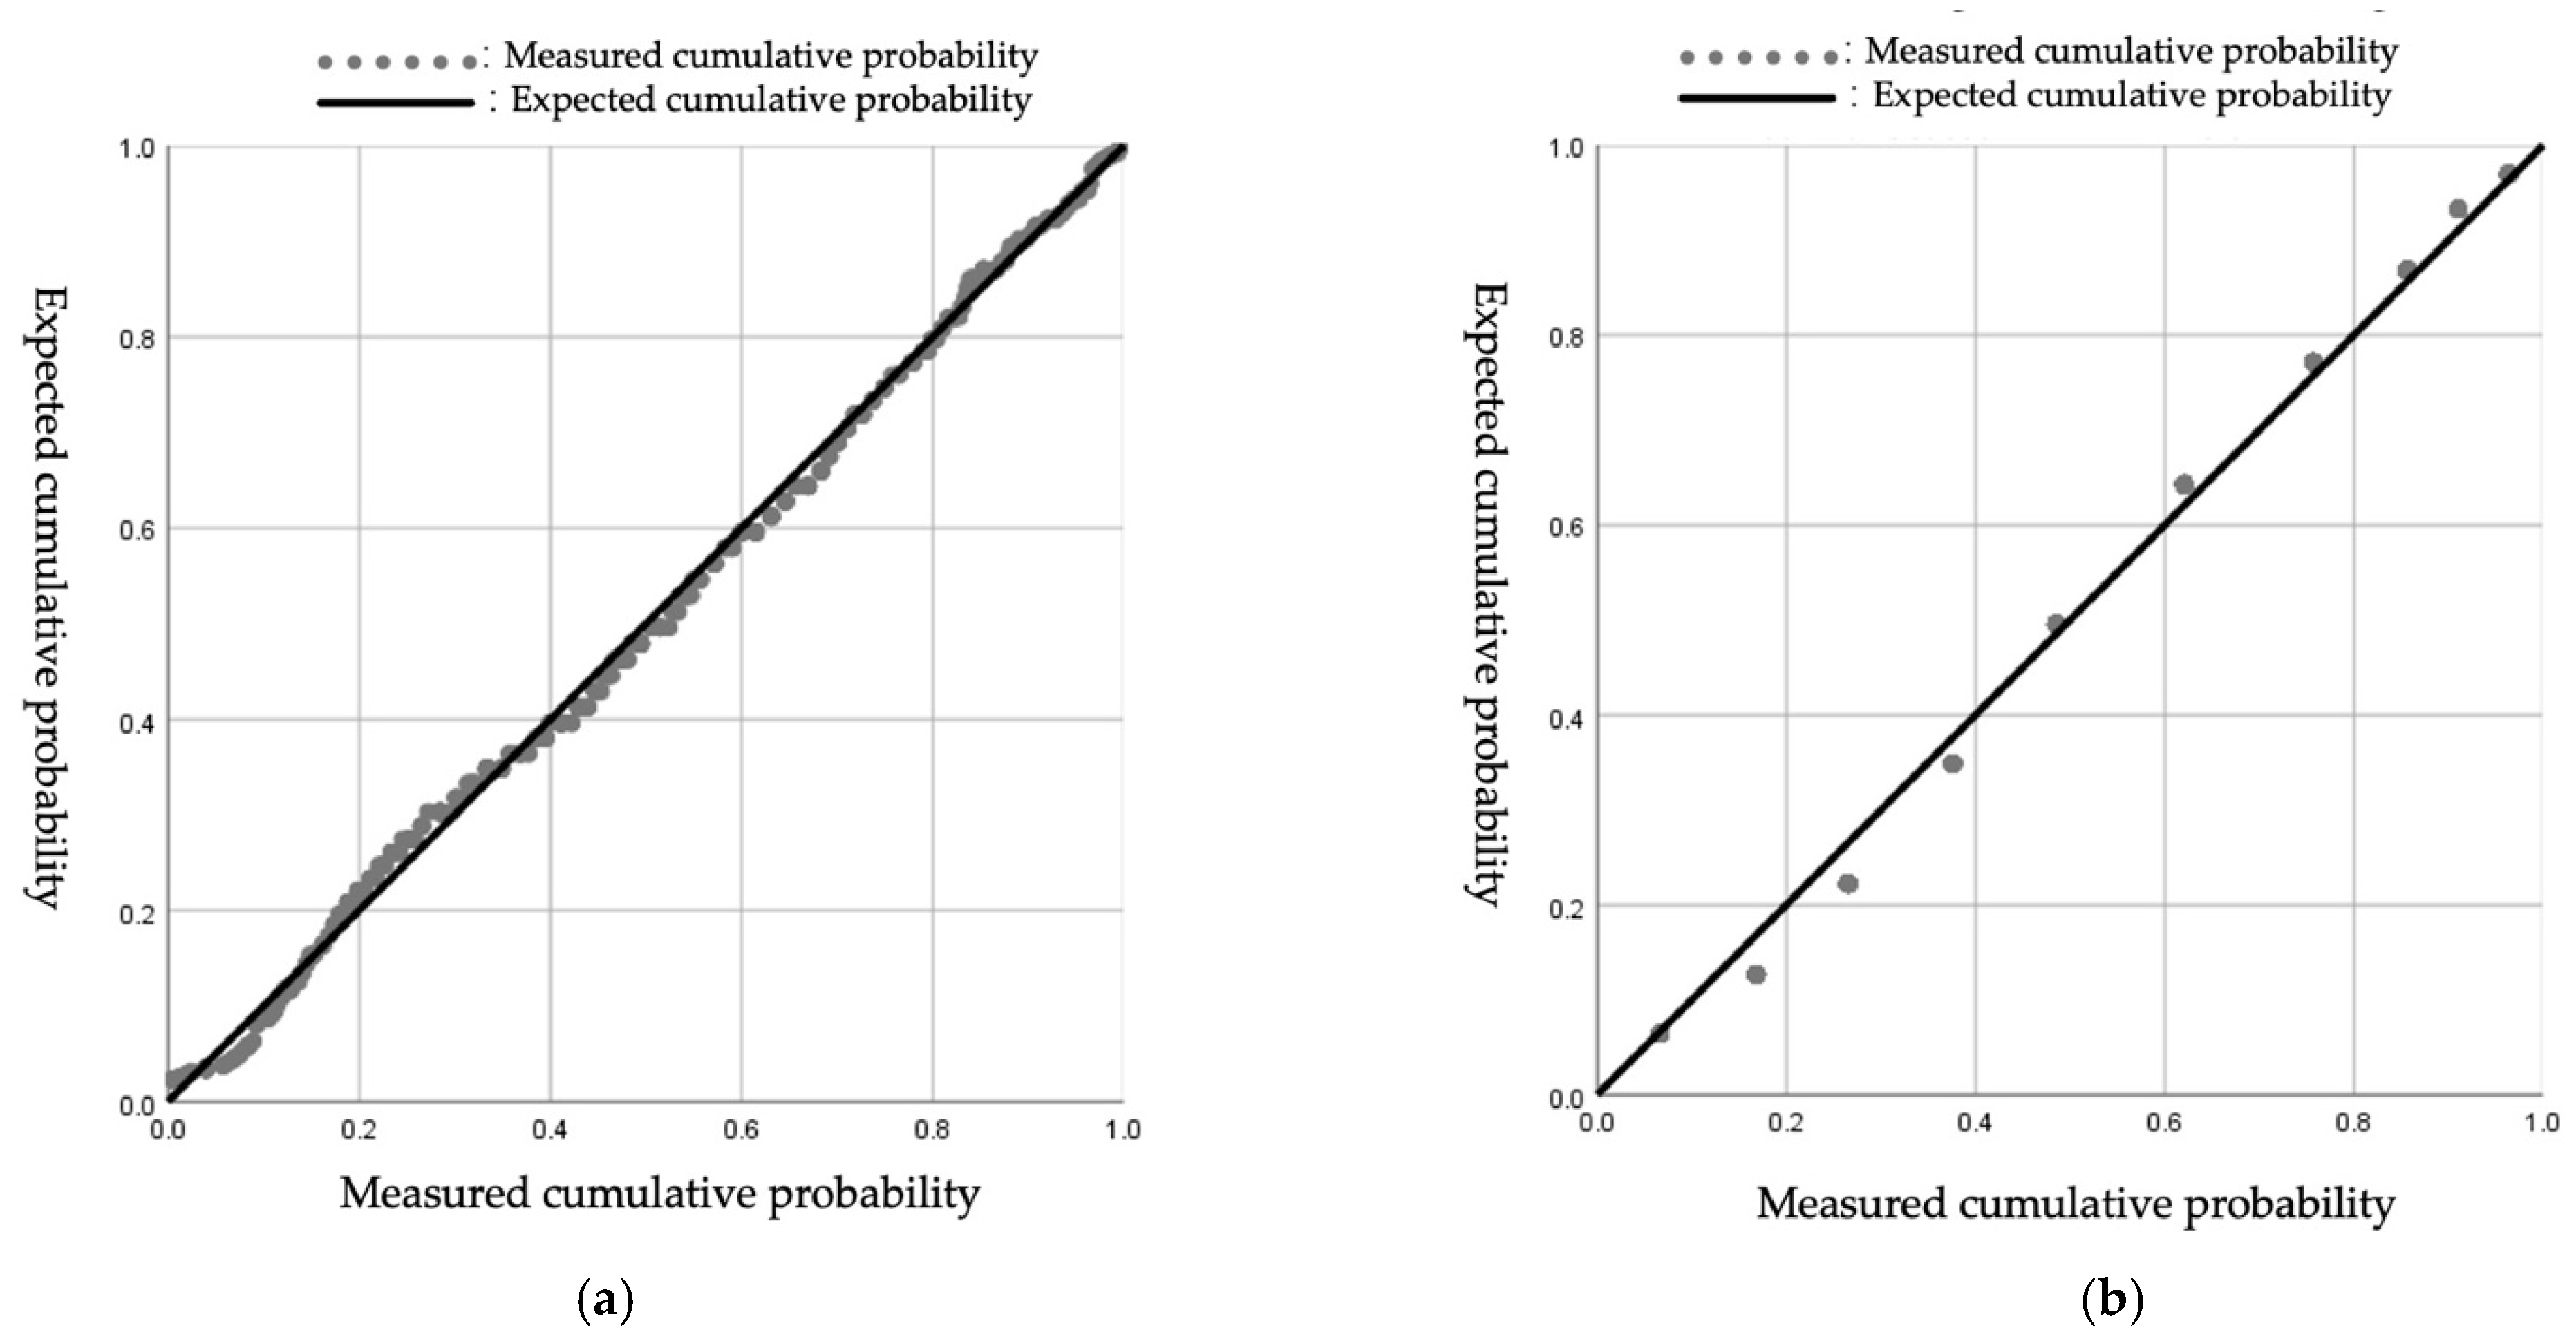
When using the non-parametric test method, it will be affected by the data sample size. It is necessary to combine histograms, P-P diagrams, and other methods to make a comprehensive judgment to determine whether the original data obey the normal distribution. The normal P-P diagram of subjective workload total score and the distraction degree score are as follows: it can be seen from
Figure 4 that the data points mostly overlap with the theoretical diagonal, indicating that the data are considered to obey a normal distribution.
Due to the different results of the previous two methods, the descriptive statistical function in SPSS was used to make a basic statistical description of the subjective workload total score and distraction degree score. The detailed description statistics are shown in
Table 3.
The skewness value of the subjective workload total score data distribution is 0.17 (0.11), the skewness Z-score = 0.17/0.11 = 1.55, the kurtosis value −0.03 (0.23), and the kurtosis Z-score = −0.03/0.23 = −0.13. The skewness value is approximately equal to 0, and the kurtosis value is also approximately equal to 0. Both the skewness Z-score and the kurtosis Z-score are in the range of (−1.96, +1.96), so the total score of subjective workload is considered to obey the normal distribution.
The skewness value of the distraction degree score data distribution is 0.14 (0.10), the skewness Z-score = 0.14/0.10 = 1.41, the kurtosis value is −0.93 (0.20), and the kurtosis Z-score = −0.93/0.20 = −4.58. The skewness value is approximately equal to 0, the kurtosis value is approximately equal to 1, and the skewness Z-score is in the range of (−1.96, +1.96), but the kurtosis Z-score is not, so the distraction degree score data do not follow a normal distribution.
Comprehensively judging from three normal distribution test methods, it is believed that the subjective workload total score obeys the normal distribution or the approximate normal distribution, and the original data of the distraction degree score do not obey the normal distribution or the approximate normal distribution.
- 2.
Eye Tracker Data
Existing research shows that [
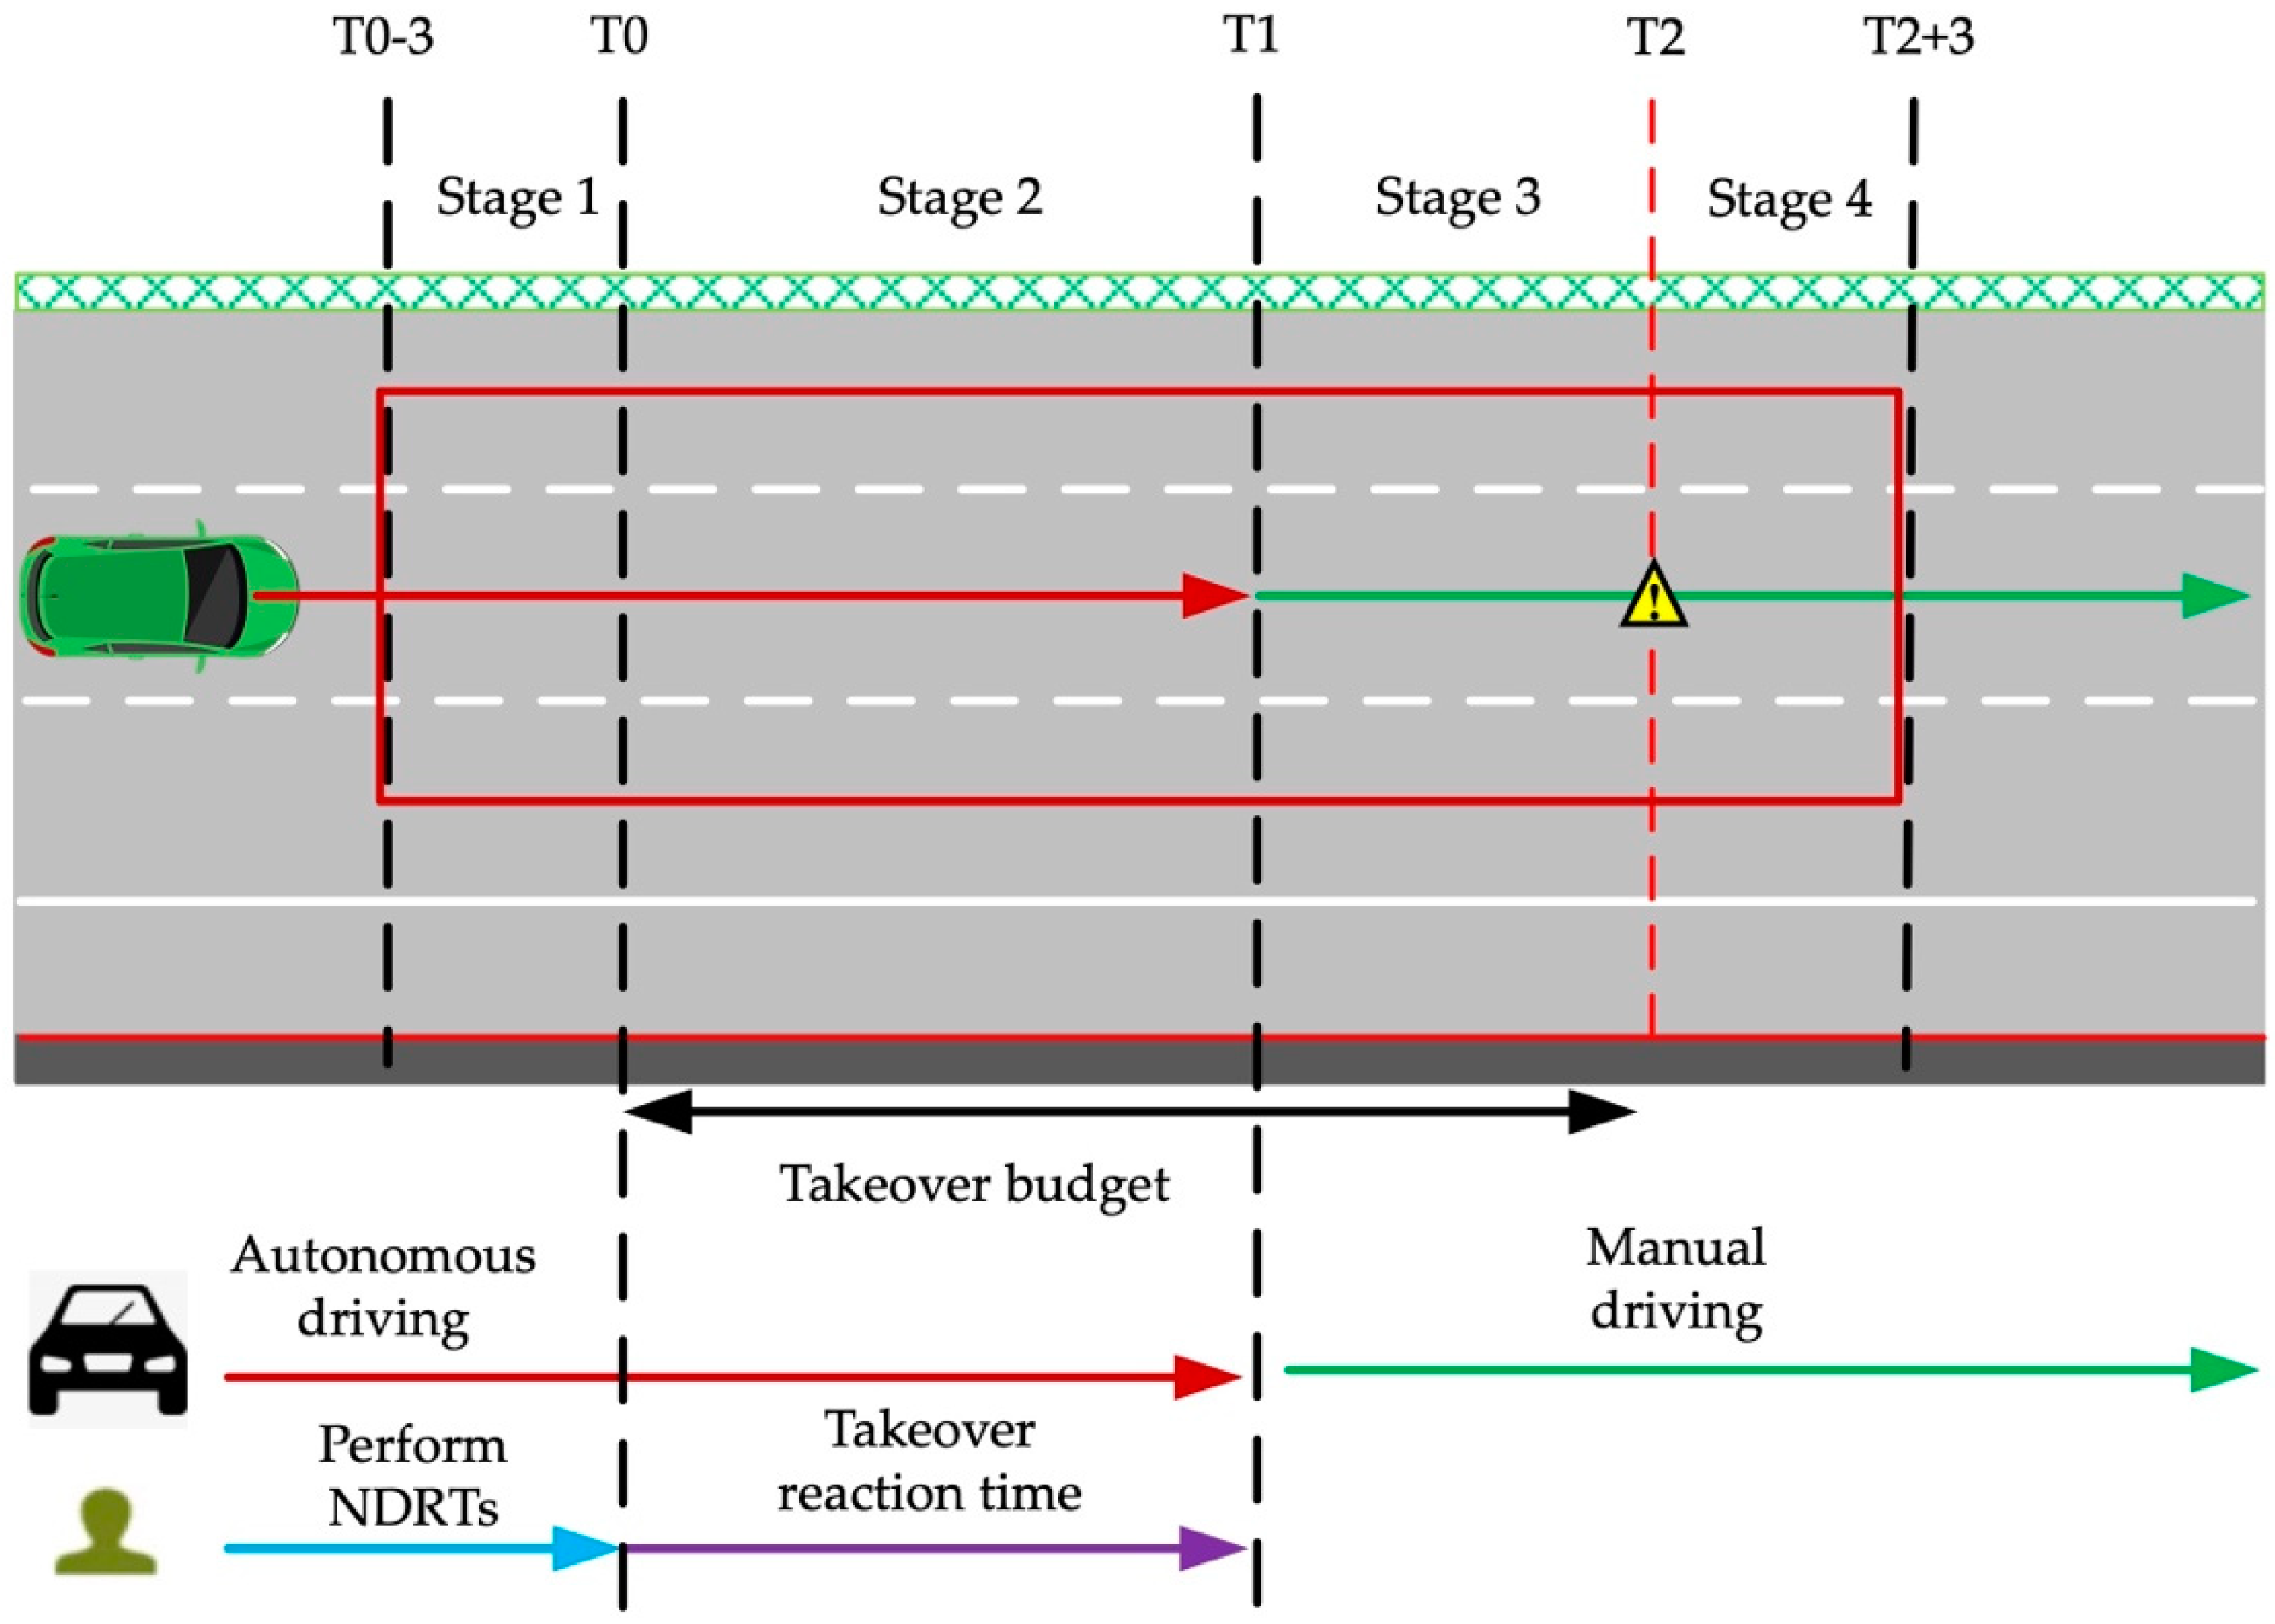
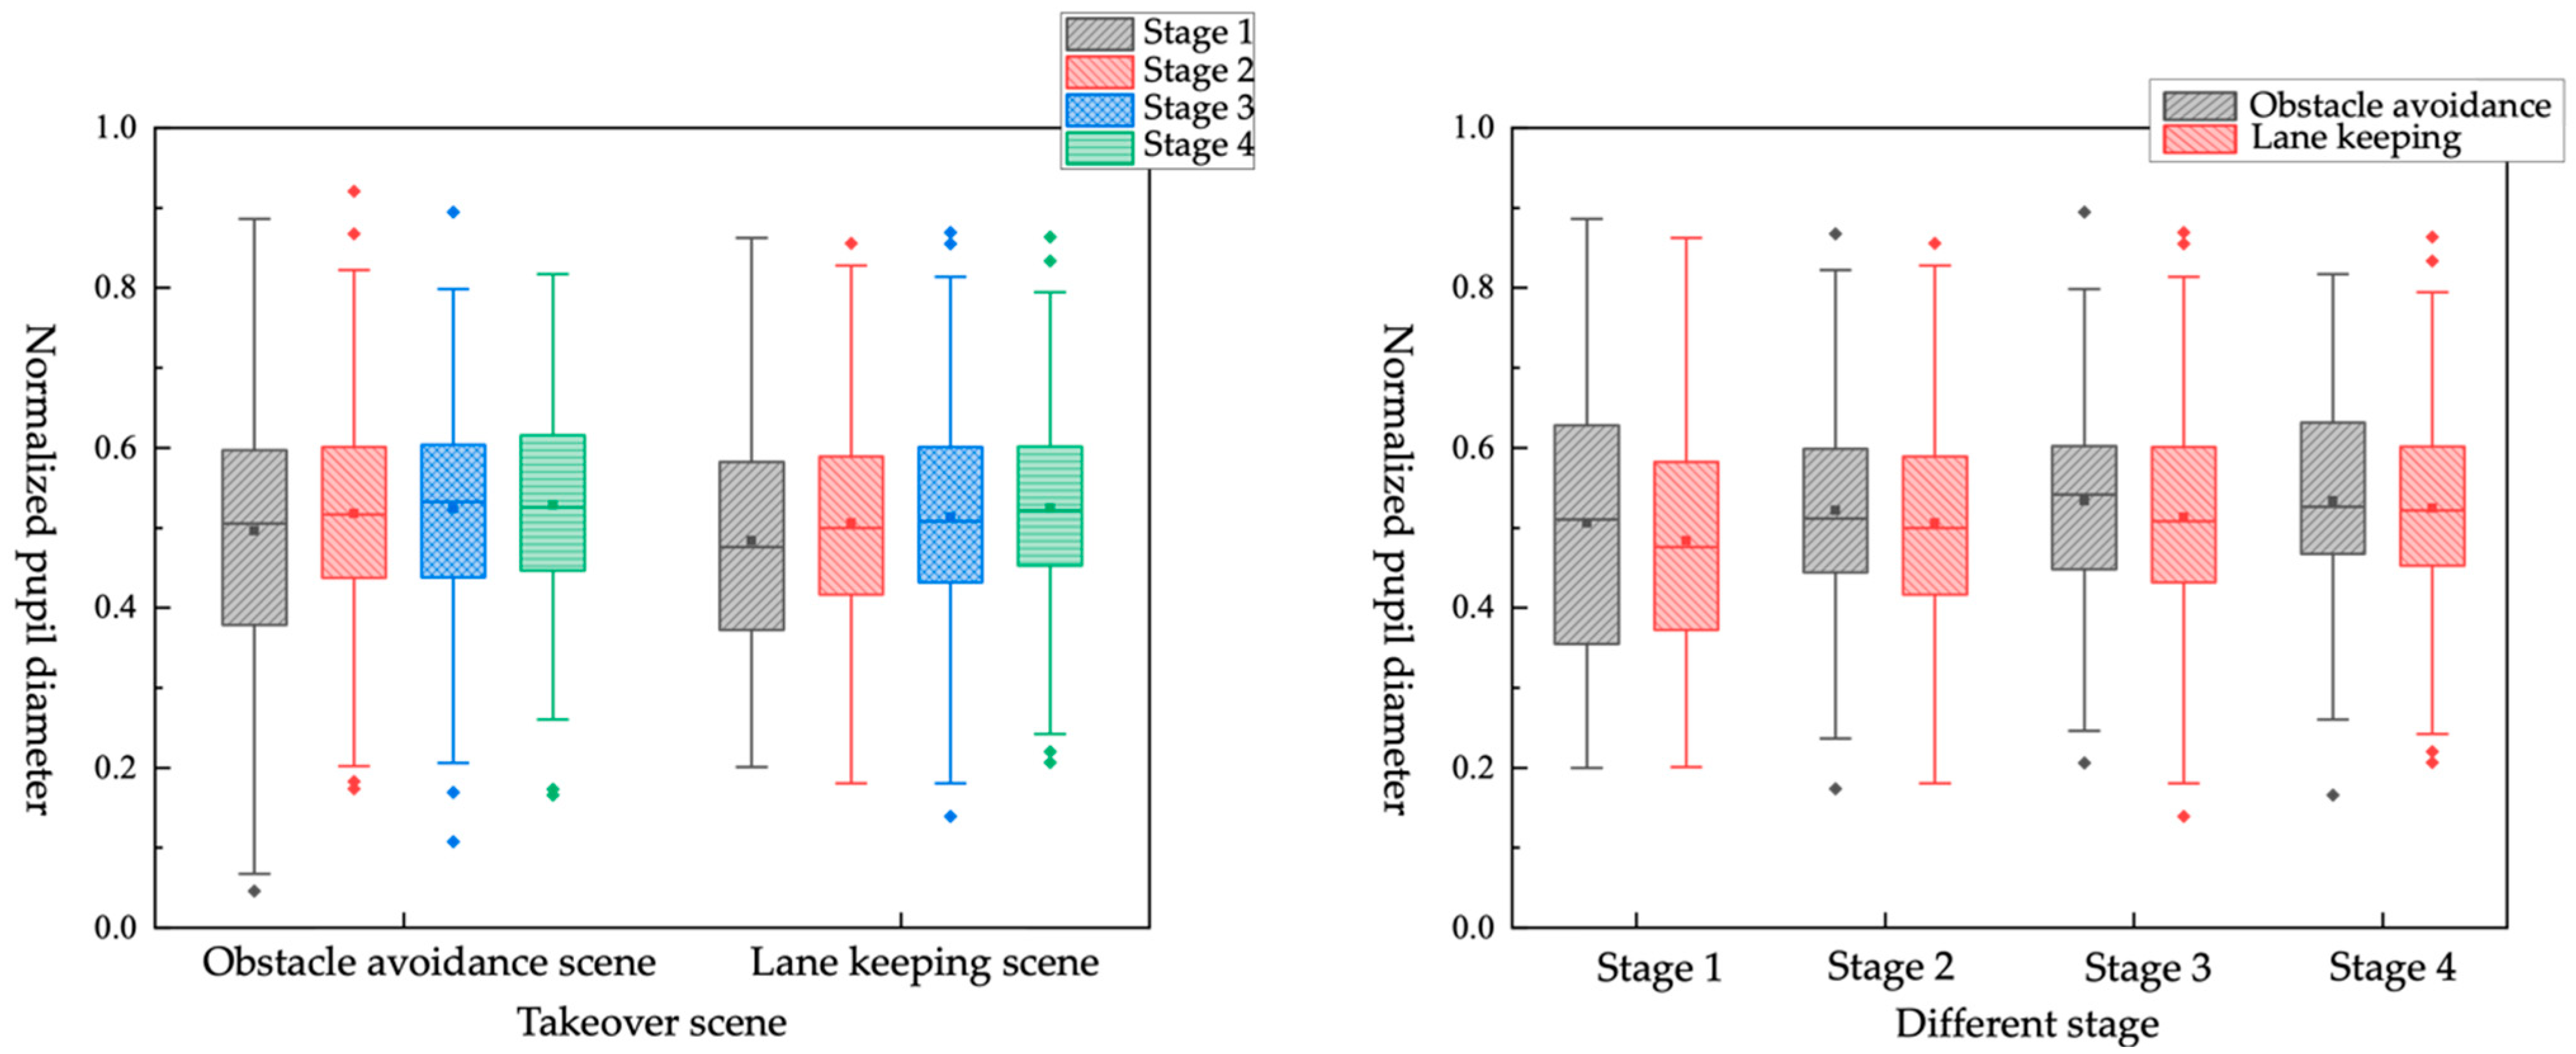
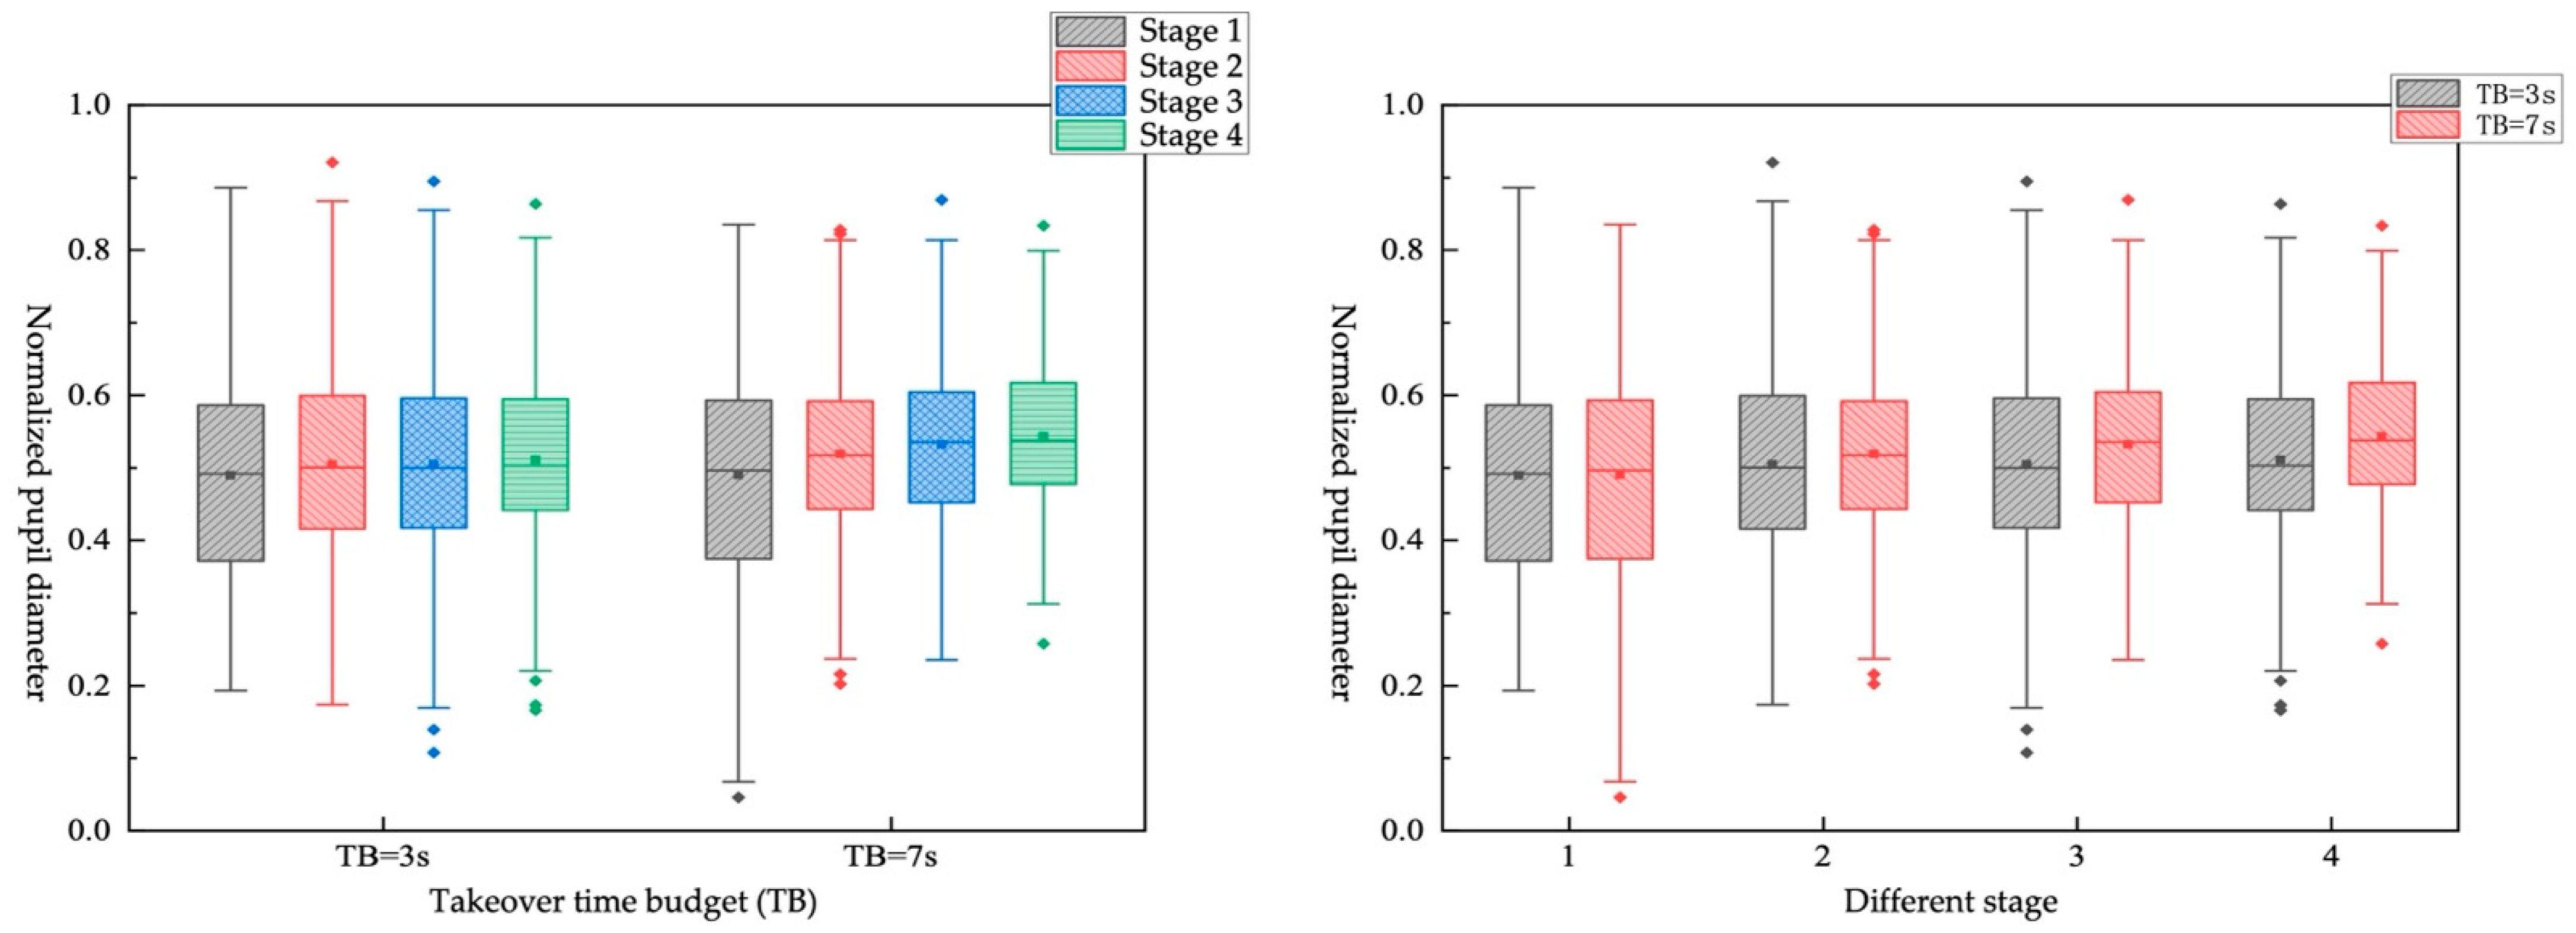
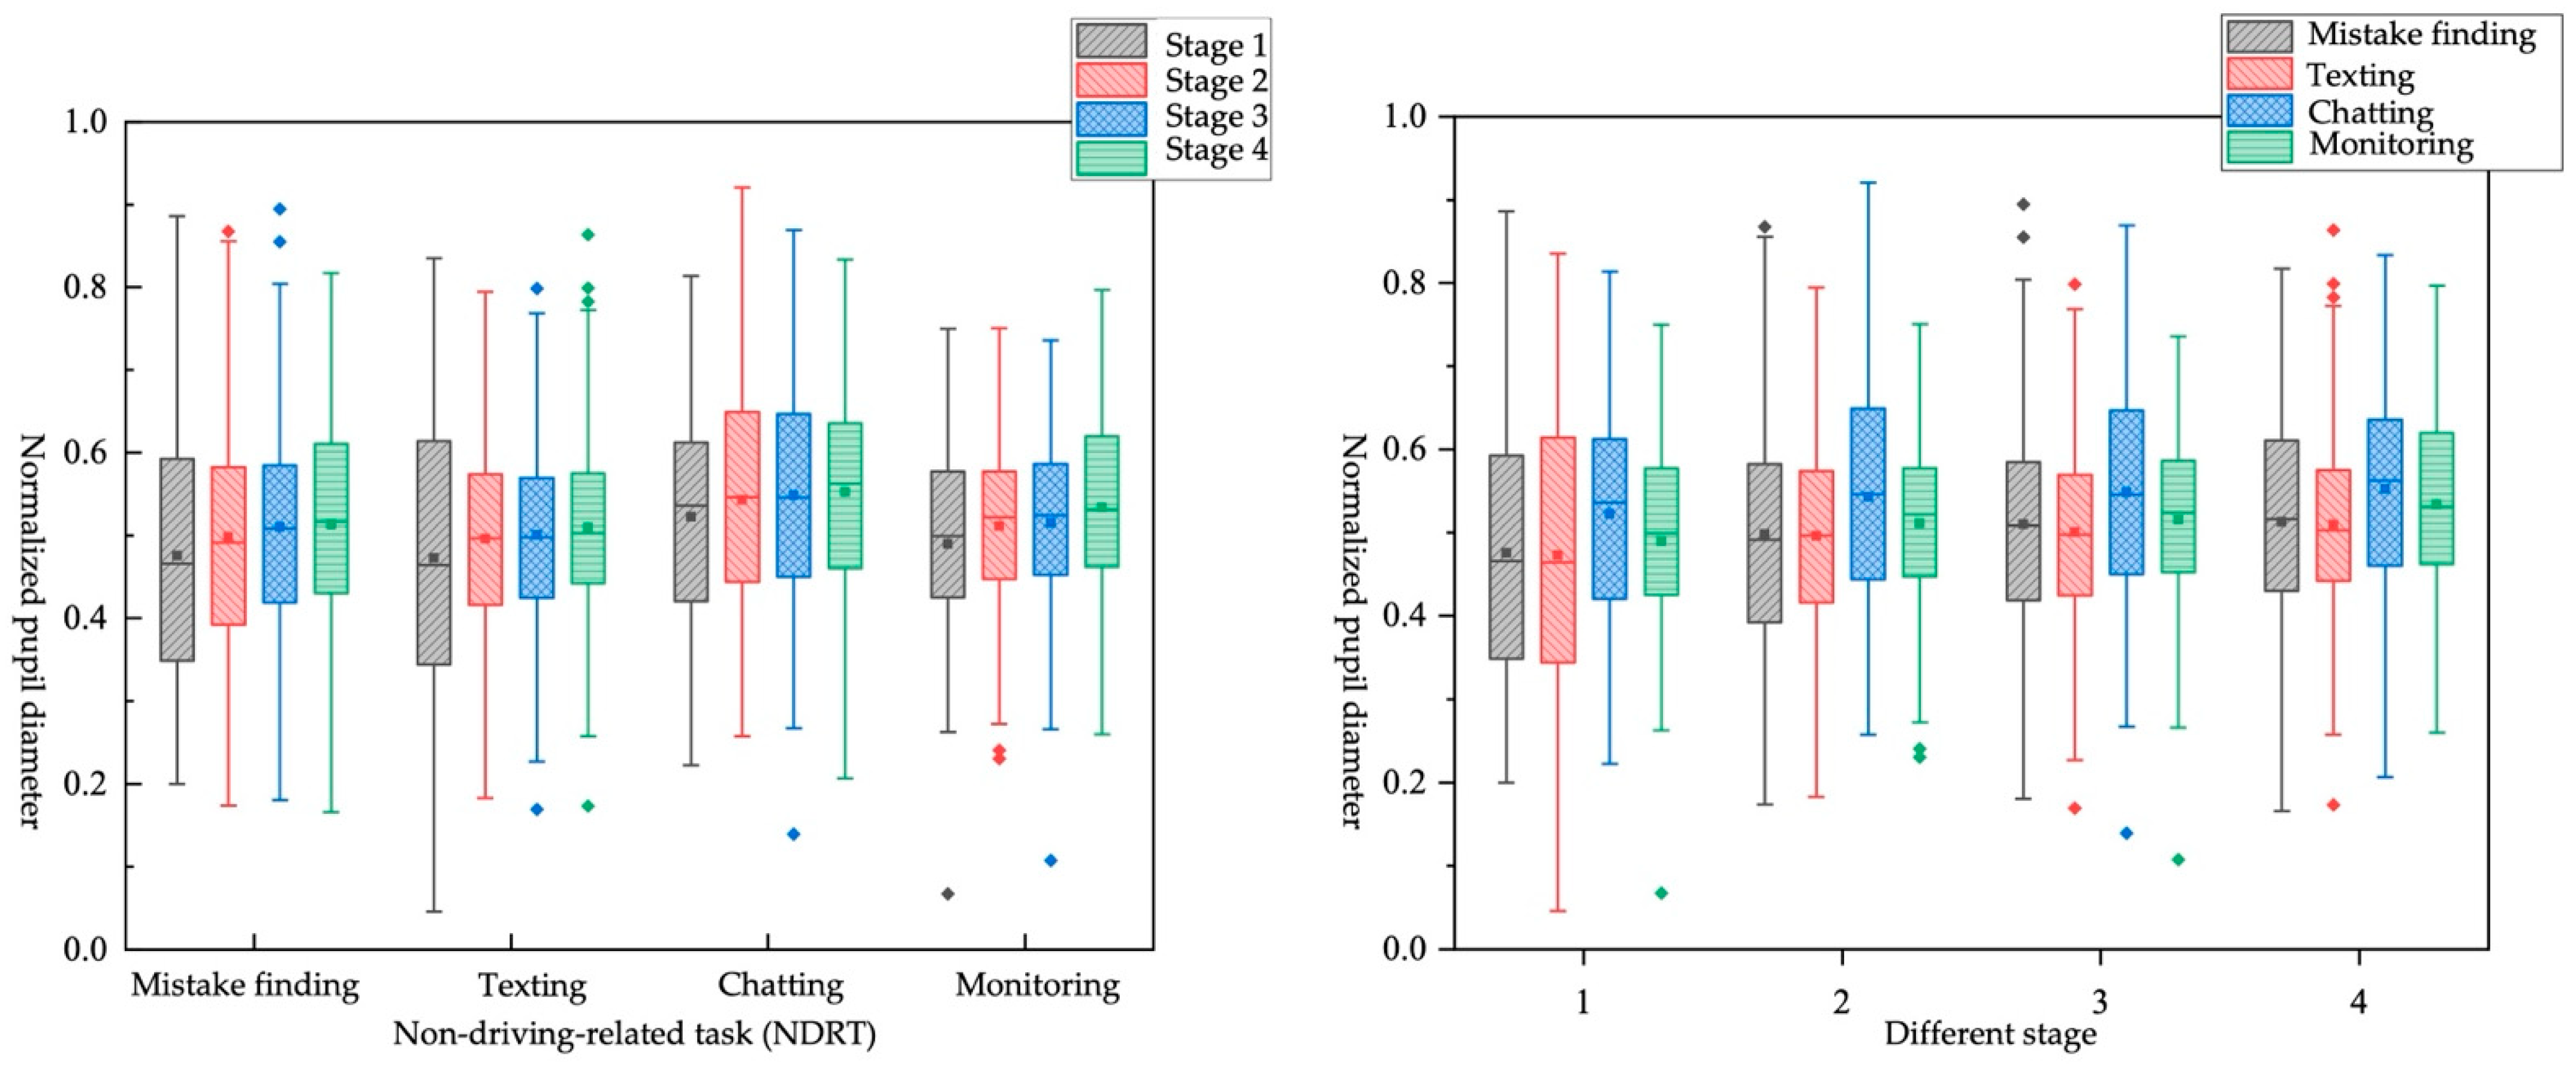
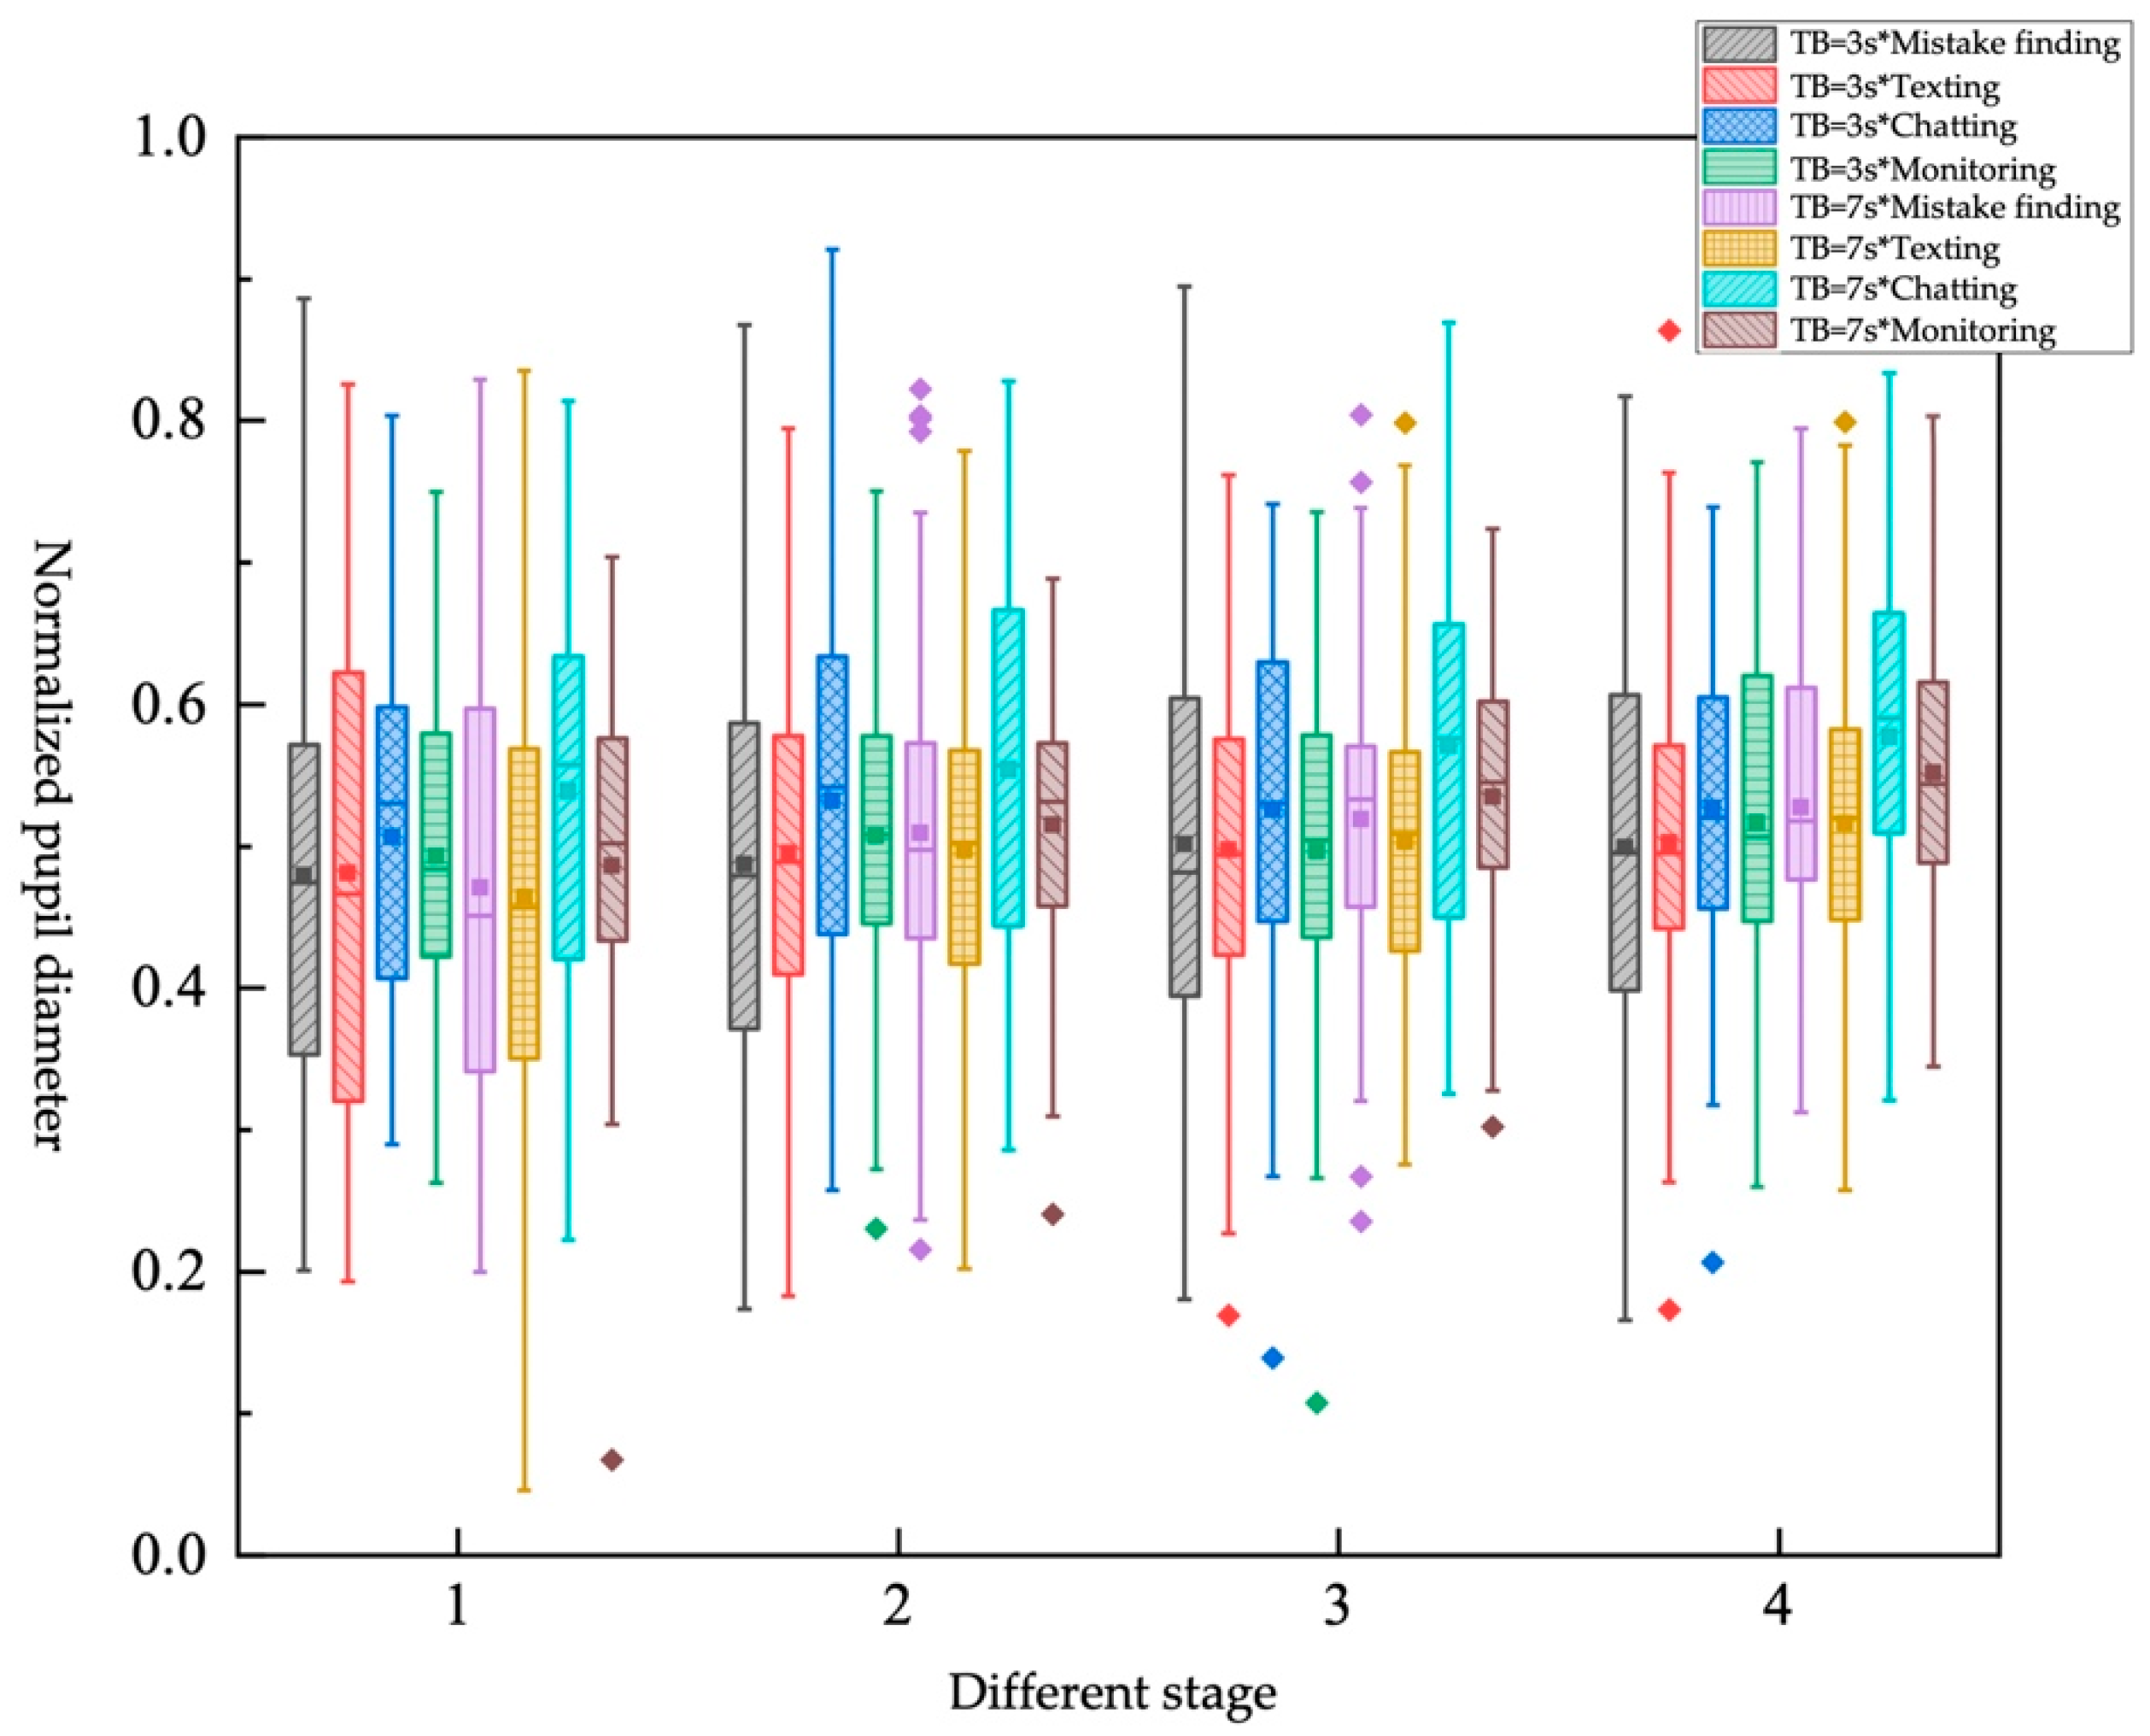
30] when workload or psychological pressure increases, the pupils can expand involuntarily. When workload or psychological pressure decreases, the pupils can return to normal state. Since the shared driving simulated experiment is carried out indoors under the same light, the influence of light on pupil area can be ignored. Studies have shown that when drivers are tired, it can also affect the size of their pupils. In conclusion, the change of pupil diameter can reflect the change of driver’s workload. Therefore, the pupil diameter was selected as the characteristic indicator to measure driver’s objective workload. When the pupil diameter is larger, it indicates that the driver’s workload is higher. In this study, pupil-diameter data are divided into four stages, and the range and description of the four stages are shown in
Figure 5 and
Table 4.
When the driver blinks, the eye tracker cannot recognize the complete pupil, which will cause the pupil diameter at the corresponding time to be 0. Therefore, the pupil-diameter data at the time of blinking needs to be deleted. We replaced the value of 0 in the original data with a moving median of window length 5 (including the left and right 5 data points). In this study, the 3σ principle was used to eliminate outliers. However, the data should obey normal distribution or approximate normal distribution.
It had been verified that the skewness coefficient and kurtosis coefficient of pupil-diameter data are both less than 1, and the P-P graph obeyed the normal standard. The data are considered to be approximately normal distribution, and the 3σ criterion was adopted to eliminate the outliers. In order to eliminate the influence of the individual difference in the original pupil diameter of drivers on the experimental data, the data were normalized by Min-Max standard, and the function is as follows:
where
is the pupil diameter of the participant j after normalization,
Pj is the pupil diameter of the participant j before normalization,
Pjmax is the maximum value of pupil diameter, and
Pjmin is the minimum value of pupil diameter.
In this study, the change of pupil diameter was analyzed by means of normalized mean and standard deviation of pupil diameter. The mean pupil diameter
Pmean and standard deviation
Pstd from stage 1 to 4 are calculated as follows:
where
N is the number of sampling points in each stage of the pupil area data, and
is the pupil area corresponding to the sampling point
i.
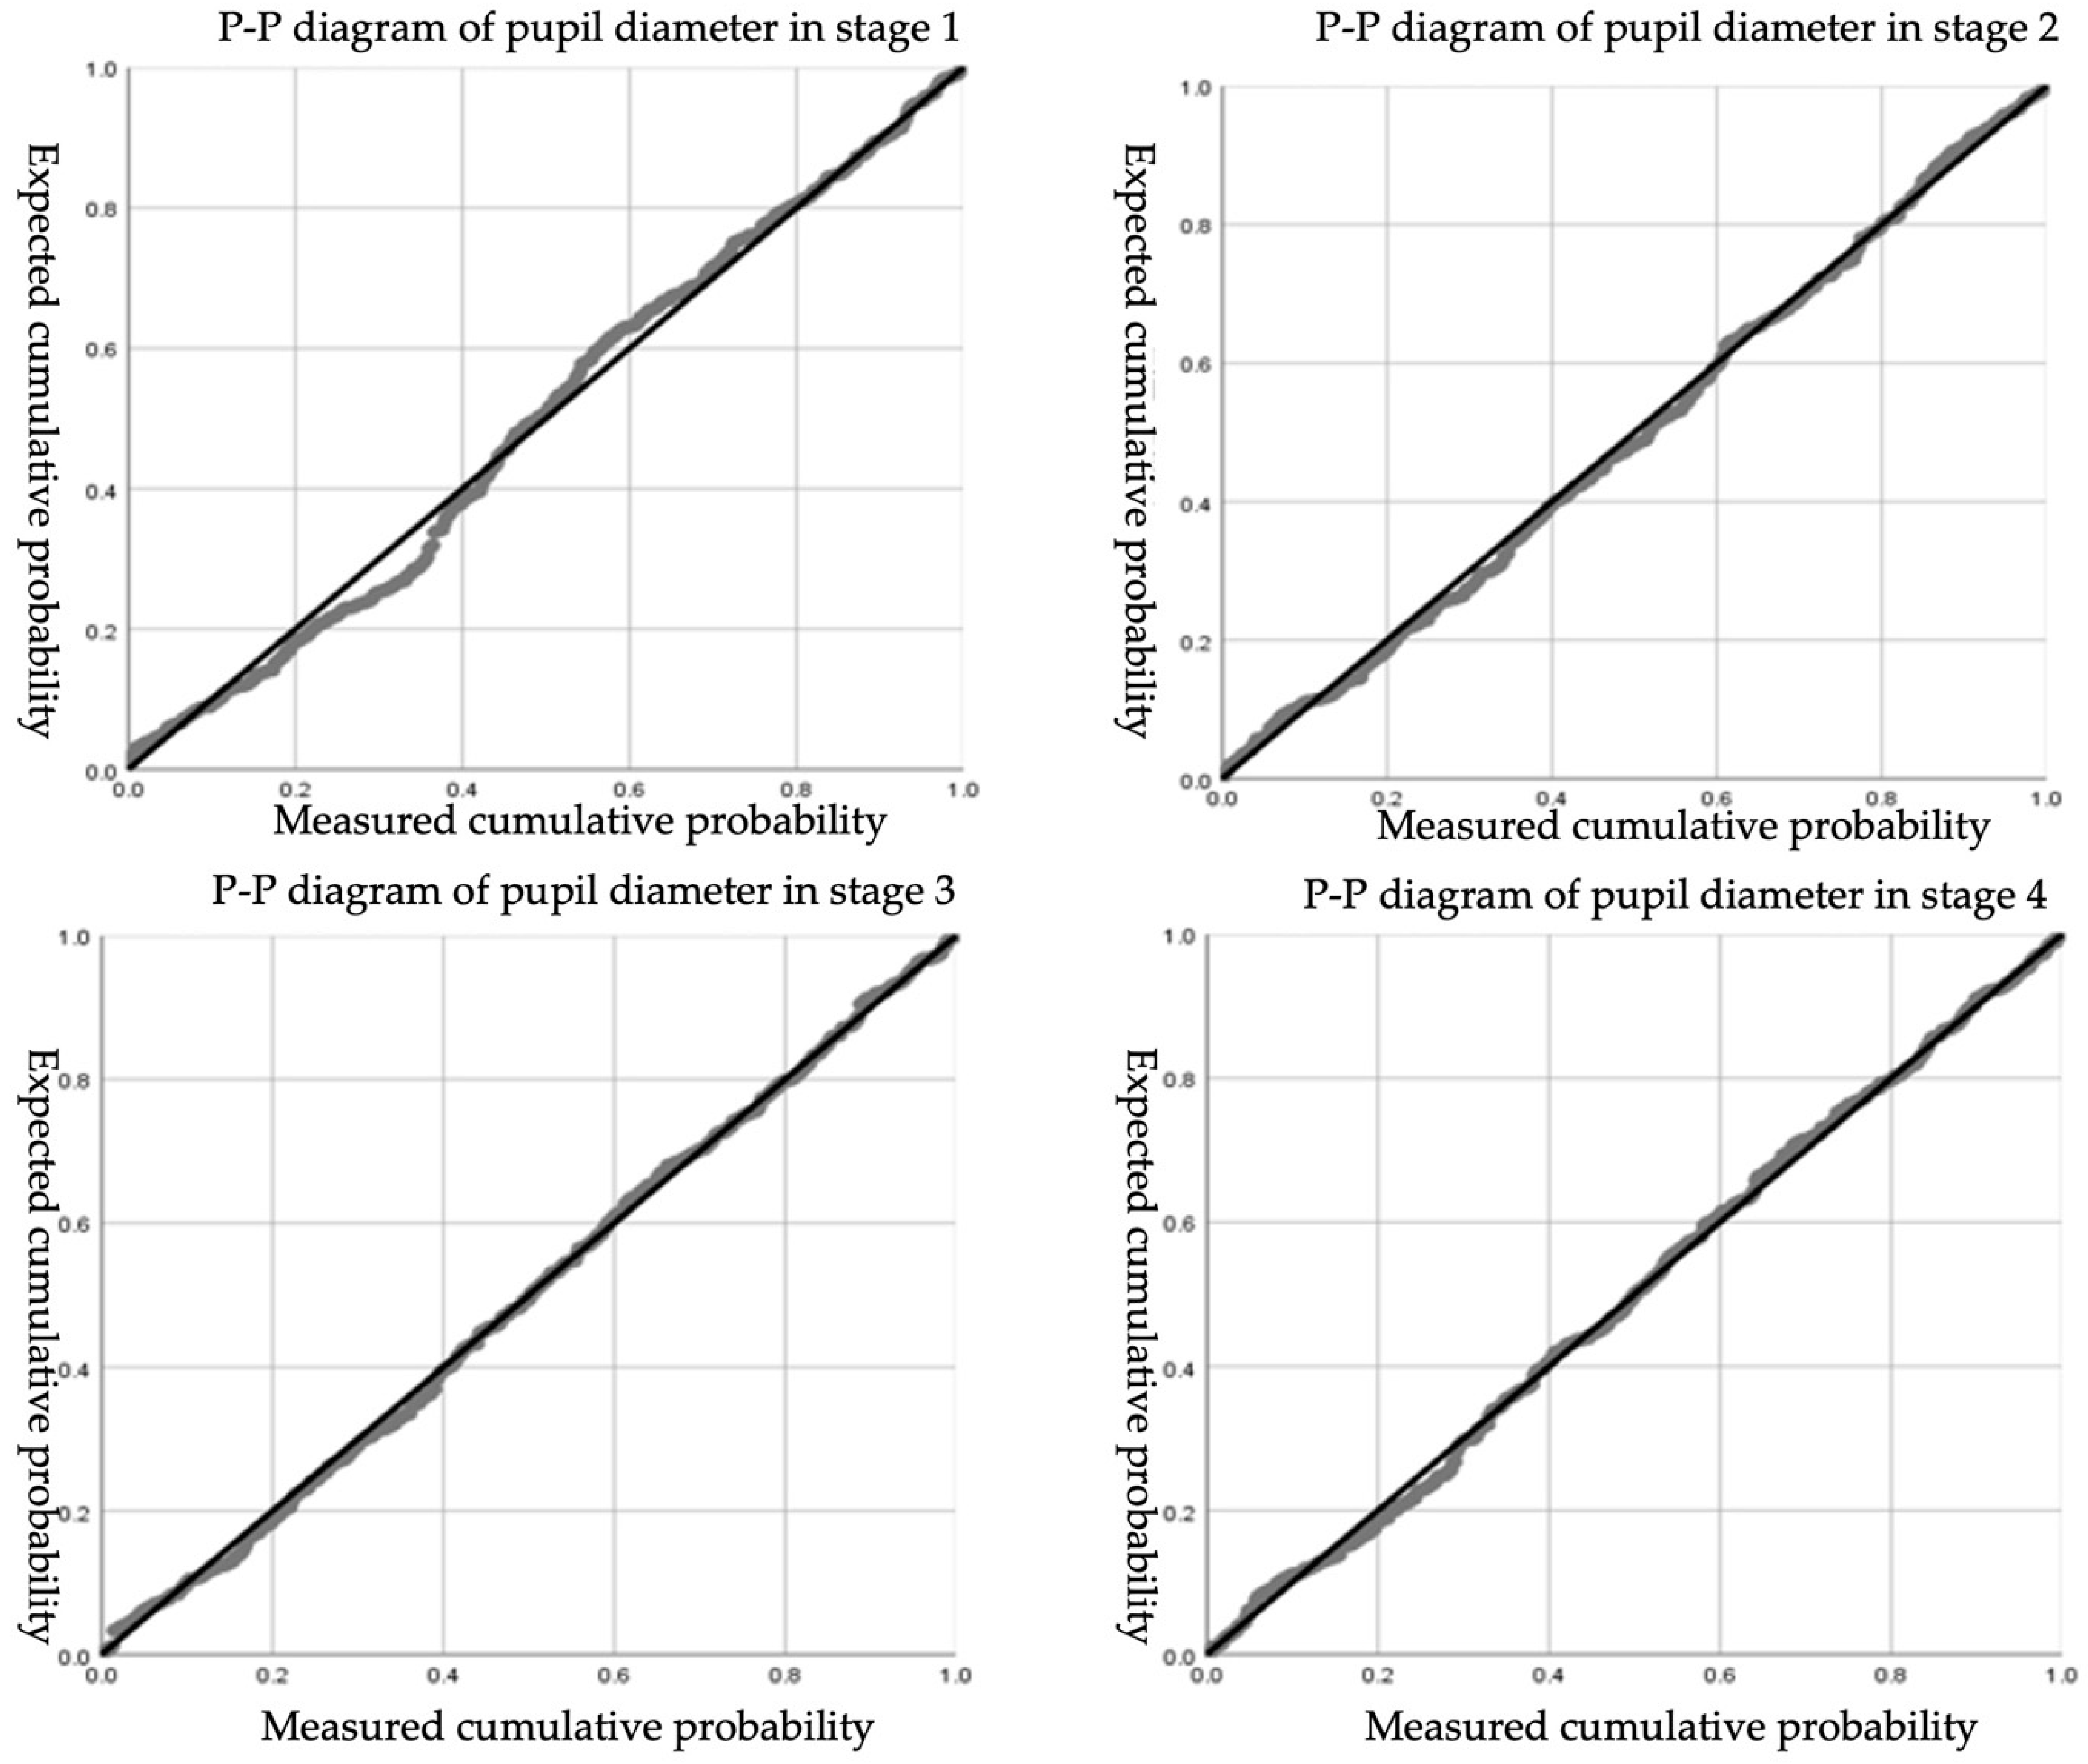
Normalized pupil diameter of all participants in the four stages is tested for normal distribution, and the P-P diagram and the results of the normality test are shown in
Figure 6 and
Table 5. The data in the four stages are all normally distributed.


