
Energy Intake from Healthy Foods Is Associated with Motor Fitness in Addition to Physical Activity: A Cross-Sectional Study of First-Grade Schoolchildren in Japan

 , , , and
Abstract
:1. Introduction
2. Materials and Methods
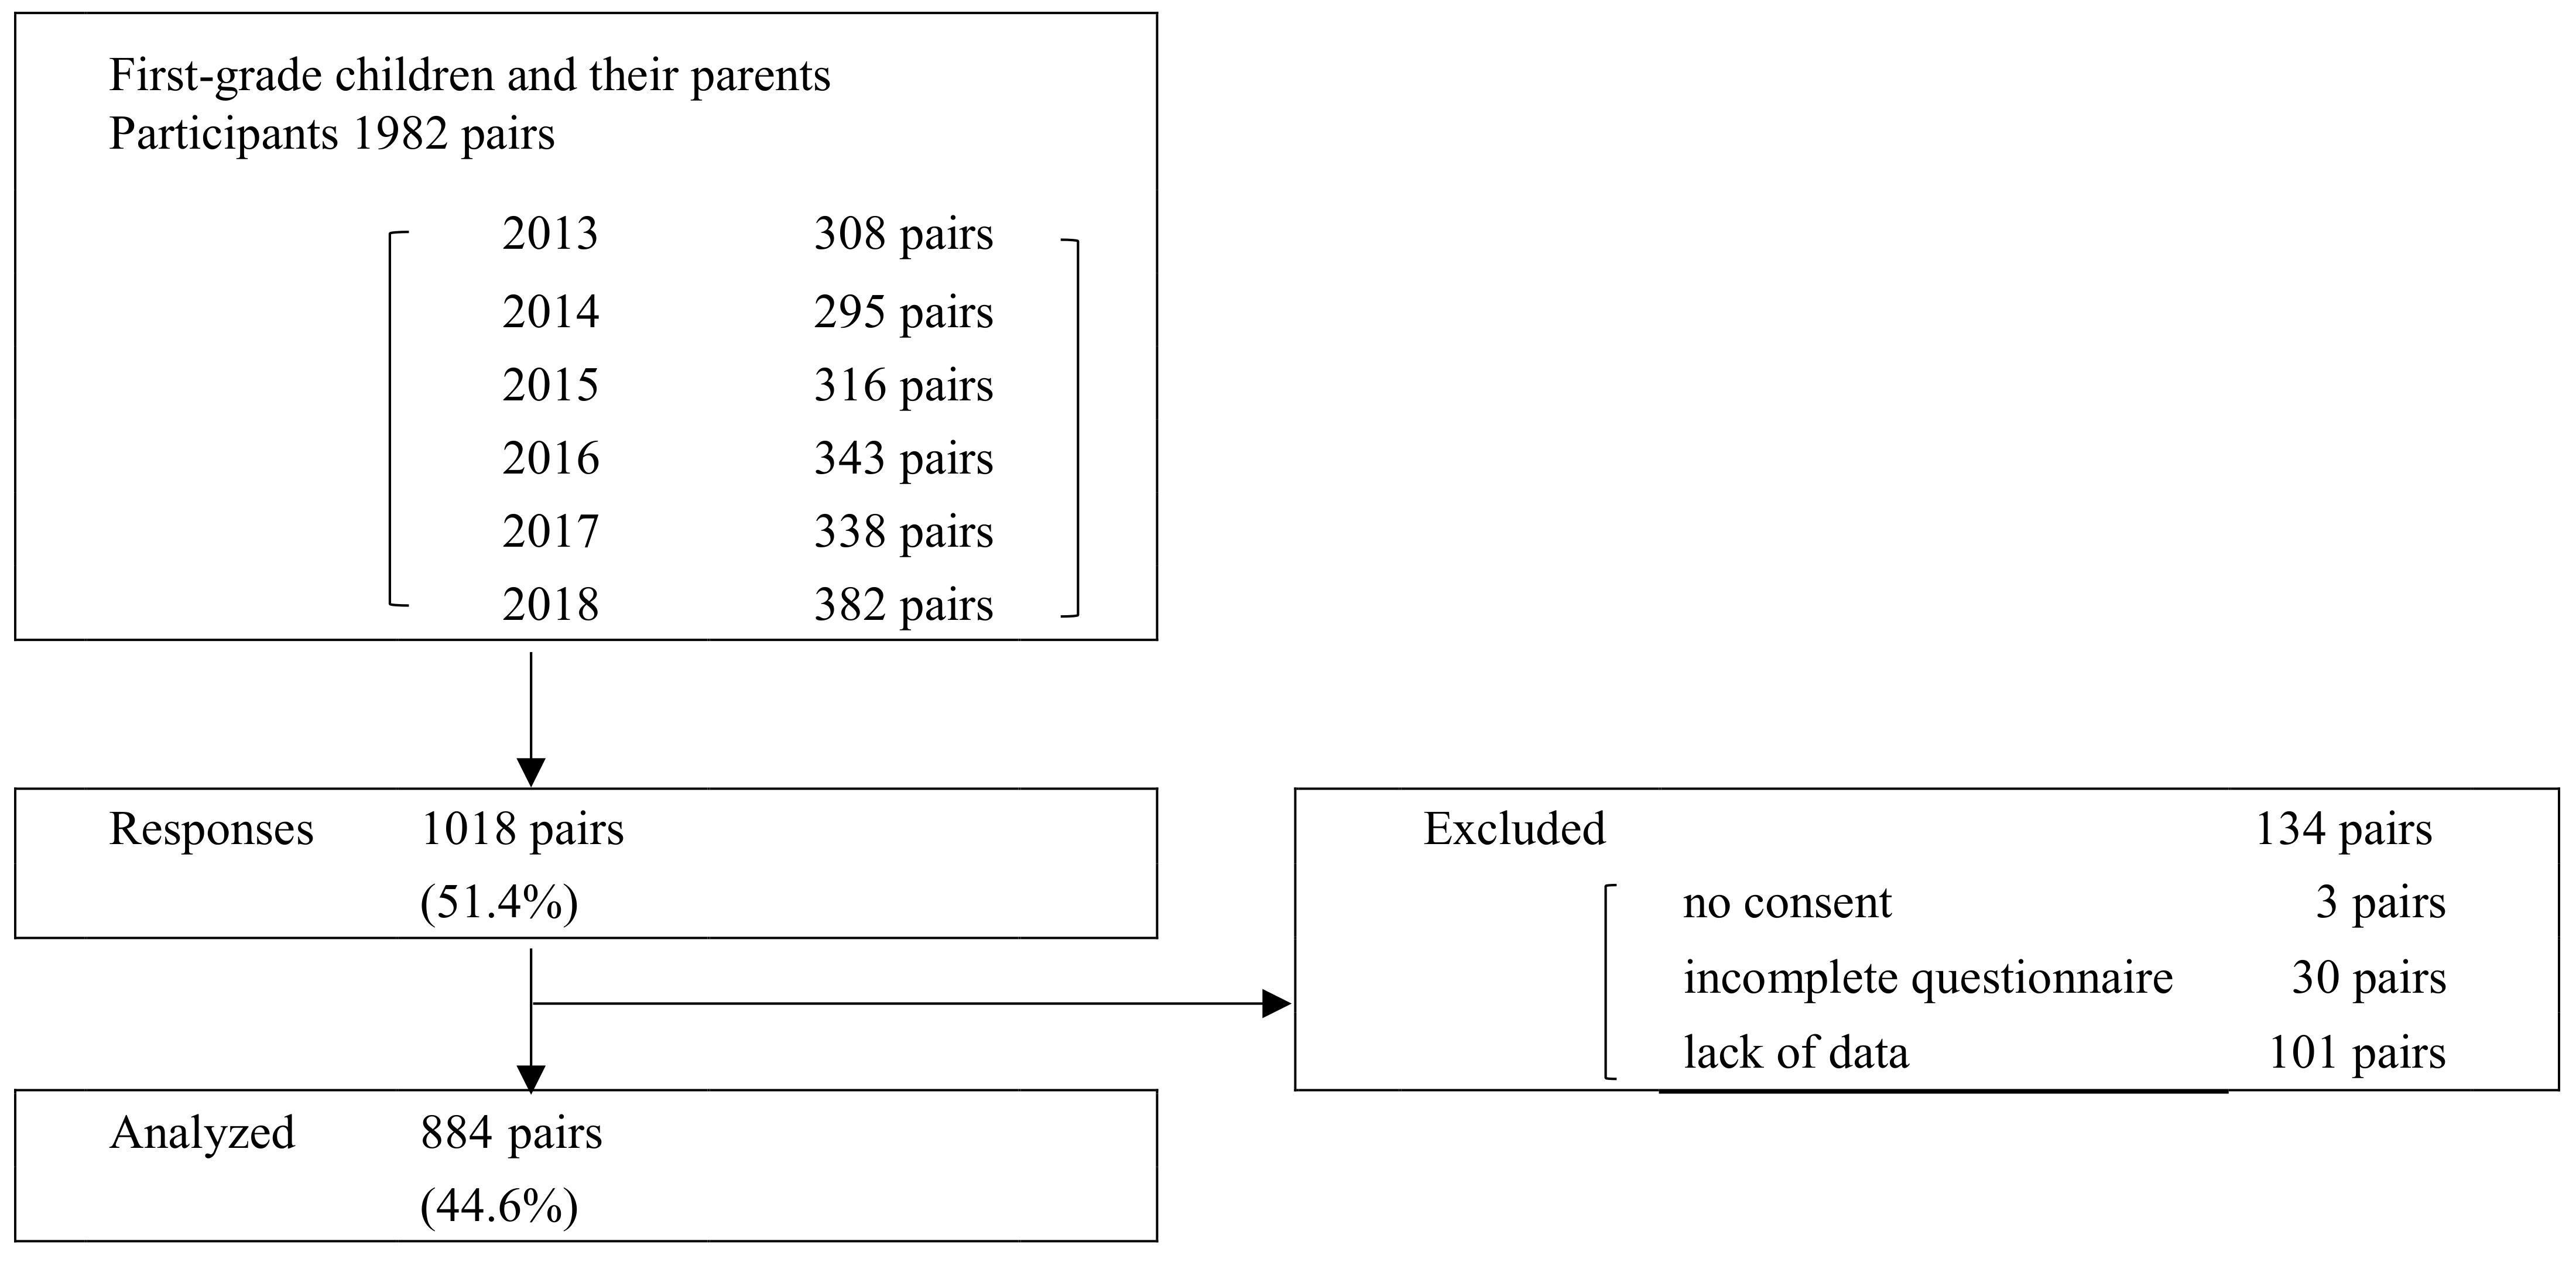
2.1. Participants
2.2. Data Collection
2.3. Measures
2.3.1. Motor Fitness (New Physical Fitness Test Score)
2.3.2. Characteristics and Lifestyle Habits of Children
2.3.3. Children’s Dietary Habits
- (1)
- Breakfast, dinner, and between-meal eating at home
- (2)
- Lunch (school lunch)
- (3)
- Nutritional value calculation
- (4)
- Breakdown of energy intake
2.3.4. Statistical Analysis
3. Results
3.1. Characteristics of Participants
3.2. Dietary Intake and New Physical Fitness Test Score
4. Discussion
5. Conclusions
Supplementary Materials
Author Contributions
Funding
Institutional Review Board Statement
Informed Consent Statement
Data Availability Statement
Acknowledgments
Conflicts of Interest
References
- Ortega, F.B.; Ruiz, J.R.; Castillo, M.J.; Sjöström, M. Physical fitness in childhood and adolescence: A powerful marker of health. Int. J. Obes. 2008, 32, 1–11. [Google Scholar] [CrossRef] [Green Version]
- García-Hermoso, A.; Ramírez-Campillo, R.; Izquierdo, M. Is Muscular Fitness Associated with Future Health Benefits in Children and Adolescents? A Systematic Review and Meta-Analysis of Longitudinal Studies. Sports Med. 2019, 49, 1079–1094. [Google Scholar] [CrossRef] [PubMed]
- Ministry of Education, Culture, Sports, Science and Technology. Results of the FY2015 Survey on Physical Fitness and Motor Abilities. Available online: https://warp.ndl.go.jp/info:ndljp/pid/11293659/www.mext.go.jp/component/english/__icsFiles/afieldfile/2017/01/25/1381545_002.pdf (accessed on 1 January 2022).
- Tanaka, C.; Tremblay, M.S.; Okuda, M.; Tanaka, S. Association between 24-hour movement guidelines and physical fitness in children. Pediatr. Int. 2020, 62, 1381–1387. [Google Scholar] [CrossRef] [PubMed]
- Chen, W.; Hammond-Bennett, A.; Hypnar, A.; Mason, S. Health-related physical fitness and physical activity in elementary school students. BMC Public Health 2018, 18, 195. [Google Scholar] [CrossRef] [PubMed] [Green Version]
- Sandercock, G.R.H.; Voss, C.; Dye, L. Associations between habitual school-day breakfast consumption, body mass index, physical activity and cardiorespiratory fitness in English schoolchildren. Eur. J. Clin. Nutr. 2010, 64, 1086–1092. [Google Scholar] [CrossRef] [PubMed] [Green Version]
- Zaqout, M.; Vyncke, K.; Moreno, L.A.; De Miguel-Etayo, P.; Lauria, F.; Molnar, D.; Lissner, L.; Hunsberger, M.; Veidebaum, T.; Tornaritis, M.; et al. Determinant factors of physical fitness in European children. Int. J. Public Health 2016, 61, 573–582. [Google Scholar] [CrossRef] [PubMed] [Green Version]
- Ministry of Health, Labour and Wellfare. Dietary Reference Intakes for Japanese. 2015. Available online: https://www.mhlw.go.jp/file/06-Seisakujouhou-10900000-Kenkoukyoku/Full_DRIs2015.pdf (accessed on 1 January 2022).
- Emmett, P.M.; Jones, L.R. Diet, growth, and obesity development throughout childhood in the Avon Longitudinal Study of Parents and Children. Nutr. Rev. 2015, 73, 175–206. [Google Scholar] [CrossRef] [PubMed] [Green Version]
- Jacka, F.N.; Rothon, C.; Taylor, S.; Berk, M.; Stansfeld, S.A. Diet quality and mental health problems in adolescents from East London: A prospective study. Soc. Psychiatry 2012, 48, 1297–1306. [Google Scholar] [CrossRef] [PubMed]
- Lachat, C.; Hawwash, D.; Ocké, M.C.; Berg, C.; Forsum, E.; Hörnell, A.; Larsson, C.; Sonestedt, E.; Wirfält, E.; Åkesson, A.; et al. Strengthening the Reporting of Observational Studies in Epidemiology—Nutritional Epidemiology (STROBE-nut): An Extension of the STROBE Statement. PLOS Med. 2016, 13, e1002036. [Google Scholar] [CrossRef] [PubMed] [Green Version]
- Ministry of Education, Culture, Sports, Science and Technology. Implementation Guidance of New Physical Fitness Test for Children Aged 6 to 11 Years. (In Japanese). Available online: http://www.mext.go.jp/a_menu/sports/stamina/05030101/001.pdf (accessed on 1 January 2022).
- Ministry of Education, Culture, Sports, Science and Technology. Japanese School Lunch Implementation Standards. (In Japanese). Available online: https://www.mext.go.jp/content/20201228-mxt_kenshoku-100003354_01.pdf (accessed on 1 January 2022).
- Ministry of Education, Culture, Sports, Science and Technology. Standard Tables of Food Composition in Japan (Seventh Revised Version). 2015. Available online: https://www.mext.go.jp/en/policy/science_technology/policy/title01/detail01/1374030.htm (accessed on 1 January 2022).
- Yoshiike, N.; Hayashi, F.; Takemi, Y.; Mizoguchi, K.; Seino, F. A New Food Guide in Japan: The Japanese Food Guide Spinning Top. Nutr. Rev. 2008, 65, 149–154. [Google Scholar] [CrossRef] [PubMed]
- Isanejad, M.; Mursu, J.; Sirola, J.; Kröger, H.; Rikkonen, T.; Tuppurainen, M.; Erkkilä, A.T. Dietary protein intake is associated with better physical function and muscle strength among elderly women. Br. J. Nutr. 2016, 115, 1281–1291. [Google Scholar] [CrossRef] [PubMed] [Green Version]
- Carson, V.; Tremblay, M.S.; Chaput, J.-P.; Chastin, S.F. Associations between sleep duration, sedentary time, physical activity, and health indicators among Canadian children and youth using compositional analyses. Appl. Physiol. Nutr. Metab. 2016, 41, S294–S302. [Google Scholar] [CrossRef] [PubMed] [Green Version]
- Schoeppe, S.; Duncan, M.J.; Badland, H.M.; Oliver, M.; Browne, M. Associations between children’s independent mobility and physical activity. BMC Public Health 2014, 14, 91. [Google Scholar] [CrossRef] [PubMed] [Green Version]
- Alotaibi, T.; Almuhanna, R.; Alhassan, J.; Alqadhib, E.; Mortada, E.; Alwhaibi, R. The Relationship between Technology Use and Physical Activity among Typically-Developing Children. Healthcare 2020, 8, 488. [Google Scholar] [CrossRef] [PubMed]
- Stiglic, N.; Viner, R.M. Effects of screentime on the health and well-being of children and adolescents: A systematic review of reviews. BMJ Open 2019, 9, e023191. [Google Scholar] [CrossRef] [PubMed] [Green Version]
- Ministry of Education, Culture, Sports, Science and Technology. The Handbook for Enhancement of the Physical Strength of Children. (In Japanese). Available online: http://www.mext.go.jp/a_menu/sports/kodomo/zencyo/1321132.htm (accessed on 23 April 2019).

| Variables | Median (Min-Max) | NPFT Score Quintile | p for Trend | ||||||||||||||
|---|---|---|---|---|---|---|---|---|---|---|---|---|---|---|---|---|---|
| q1 (n = 88) | q2 (n = 67) | q3 (n = 93) | q4 (n = 106) | q5 (n = 99) | |||||||||||||
| 22.0 | 26.0 | 29.0 | 32.0 | 38.0 | |||||||||||||
| (13.0–24.0) | (25.0–27.0) | (28.0–30.0) | (31.0–34.0) | (35.0–49.0) | |||||||||||||
| Height | (cm) | 116.3 | ± | 5.7 | 117.8 | ± | 5.5 | 117.6 | ± | 5.1 | 118.8 | ± | 4.7 | 119.3 | ± | 4.8 | <0.001 |
| Weight | (m) | 20.3 | ± | 2.7 | 20.7 | ± | 2.5 | 21.1 | ± | 3.1 | 21.6 | ± | 3.2 | 21.5 | ± | 2.6 | <0.001 |
| Rohrer’s index | (kg/m3) | 129.3 | ± | 15.0 | 127.1 | ± | 13.4 | 129.6 | ± | 13.0 | 128.5 | ± | 11.5 | 126.8 | ± | 12.9 | 0.335 |
| Grip strength | (kg) | 6.7 | ± | 1.9 | 7.8 | ± | 1.8 | 8.2 | ± | 1.7 | 8.7 | ± | 1.9 | 9.8 | ± | 2.1 | <0.001 |
| Sit-ups | (times) | 7.0 | ± | 4.8 | 9.8 | ± | 4.6 | 11.5 | ± | 4.5 | 12.7 | ± | 3.1 | 15.6 | ± | 4.6 | <0.001 |
| Sit and reach | (cm) | 22.1 | ± | 5.1 | 23.9 | ± | 6.4 | 24.6 | ± | 6.0 | 26.2 | ± | 5.6 | 29.0 | ± | 5.5 | <0.001 |
| Side-step | (points) | 23.2 | ± | 4.6 | 24.1 | ± | 5.4 | 26.1 | ± | 4.7 | 28.2 | ± | 4.1 | 31.6 | ± | 3.9 | <0.001 |
| 20-metre shuttle run | (times) | 11.9 | ± | 4.2 | 17.2 | ± | 7.7 | 17.7 | ± | 7.1 | 22.6 | ± | 11.1 | 28.6 | ± | 13.8 | <0.001 |
| 50-metre run | (s) | 12.3 | ± | 0.9 | 11.8 | ± | 0.7 | 11.5 | ± | 0.6 | 10.9 | ± | 0.6 | 10.6 | ± | 0.5 | <0.001 |
| Standing long jump | (cm) | 97.5 | ± | 13.5 | 104.4 | ± | 12.8 | 110.0 | ± | 13.7 | 115.3 | ± | 11.3 | 127.3 | ± | 11.7 | <0.001 |
| Softball throw | (m) | 5.8 | ± | 2.2 | 6.1 | ± | 2.1 | 7.7 | ± | 2.5 | 7.9 | ± | 2.7 | 10.5 | ± | 3.5 | <0.001 |
| Sleep duration | (hours/day) | 9.5 | ± | 0.6 | 9.6 | ± | 0.7 | 9.5 | ± | 0.6 | 9.8 | ± | 0.7 | 9.6 | ± | 0.7 | 0.278 |
| Studying | (min/day) | 49.1 | ± | 23.7 | 44.3 | ± | 19.1 | 42.7 | ± | 21.3 | 47.4 | ± | 44.7 | 44.6 | ± | 21.8 | 0.529 |
| Watching television | (min/day) | 78.5 | ± | 61.3 | 74.5 | ± | 46.4 | 83.8 | ± | 46.2 | 70.2 | ± | 41.0 | 75.3 | ± | 42.9 | 0.442 |
| Playing video games/reading comics | (min/day) | 20.2 | ± | 25.3 | 23.2 | ± | 40.9 | 28.1 | ± | 31.0 | 17.2 | ± | 24.1 | 23.3 | ± | 23.2 | 0.973 |
| After school exercise class | (min/week) | 81.8 | ± | 118.2 | 104.2 | ± | 107.7 | 114.1 | ± | 126.6 | 155.7 | ± | 143.9 | 195.7 | ± | 167.9 | <0.001 |
| After school classroom learning | (min/week) | 62.7 | ± | 72.5 | 61.3 | ± | 79.8 | 45.3 | ± | 80.1 | 47.7 | ± | 65.9 | 47.9 | ± | 59.7 | 0.079 |
| After school music class | (min/week) | 9.0 | ± | 24.2 | 9.6 | ± | 21.8 | 8.6 | ± | 20.8 | 5.9 | ± | 21.0 | 6.8 | ± | 17.4 | 0.258 |
| Playing outside | Always | 74 | (84.1) | 61 | (91.0) | 87 | (93.5) | 102 | (96.2) | 95 | (96.0) | <0.001 | |||||
| Frequency of eating breakfast | 0–2 times/week | 0 | (0.0) | 0 | (0.0) | 0 | (0.0) | 0 | (0.0) | 0 | (0.0) | 0.866 | |||||
| 3–4 times/week | 0 | (0.0) | 0 | (0.0) | 0 | (0.0) | 0 | (0.0) | 1 | (1.0) | |||||||
| 5–6 times/week | 2 | (2.3) | 1 | (1.5) | 2 | (2.2) | 1 | (0.9) | 1 | (1.0) | |||||||
| 7 times/week | 86 | (97.7) | 66 | (98.5) | 91 | (97.8) | 105 | (99.1) | 97 | (98.0) | |||||||
| Variables | NPFT Score Quintile | p for Trend | |||||||||||||||
|---|---|---|---|---|---|---|---|---|---|---|---|---|---|---|---|---|---|
| q1 (n = 70) | q2 (n = 96) | q3 (n = 82) | q4 (n = 91) | q5 (n = 92) | |||||||||||||
| Median (Min-Max) | 21.0 | 26.0 | 29.0 | 33.0 | 38.0 | ||||||||||||
| (9.0–23.0) | (24.0–27.0) | (28.0–30.0) | (31.0–34.0) | (35.0–46.0) | |||||||||||||
| Height | (cm) | 114.2 | ± | 5.5 | 115.1 | ± | 5.4 | 117.5 | ± | 4.6 | 117.7 | ± | 4.4 | 118.5 | ± | 4.7 | <0.001 |
| Weight | (m) | 19.5 | ± | 2.9 | 20.0 | ± | 3.0 | 20.9 | ± | 3.1 | 20.9 | ± | 2.9 | 21.3 | ± | 2.9 | <0.001 |
| Rohrer’s index | (kg/m3) | 131.0 | ± | 13.8 | 131.2 | ± | 14.5 | 128.2 | ± | 13.4 | 127.8 | ± | 12.1 | 128.0 | ± | 13.0 | 0.039 |
| Grip strength | (kg) | 6.3 | ± | 2.1 | 7.4 | ± | 1.6 | 7.7 | ± | 1.5 | 8.4 | ± | 2.0 | 9.6 | ± | 2.1 | <0.001 |
| Sit-ups | (times) | 6.5 | ± | 5.1 | 10.0 | ± | 5.1 | 11.1 | ± | 4.2 | 12.4 | ± | 4.2 | 14.9 | ± | 3.6 | <0.001 |
| Sit and reach | (cm) | 22.9 | ± | 6.4 | 27.0 | ± | 6.2 | 28.5 | ± | 5.3 | 30.0 | ± | 6.5 | 32.8 | ± | 6.5 | <0.001 |
| Side-step | (points) | 22.2 | ± | 6.5 | 24.0 | ± | 4.8 | 25.7 | ± | 3.9 | 27.1 | ± | 3.3 | 28.3 | ± | 3.9 | <0.001 |
| 20-metre shuttle run | (times) | 11.0 | ± | 5.2 | 14.4 | ± | 6.6 | 15.6 | ± | 6.7 | 18.7 | ± | 8.1 | 23.4 | ± | 9.4 | <0.001 |
| 50-metre run | (s) | 12.7 | ± | 1.9 | 12.1 | ± | 0.7 | 11.6 | ± | 0.6 | 11.3 | ± | 0.7 | 10.8 | ± | 0.5 | <0.001 |
| Standing long jump | (cm) | 90.7 | ± | 20.9 | 99.5 | ± | 13.3 | 103.8 | ± | 11.5 | 108.2 | ± | 12.6 | 118.4 | ± | 11.5 | <0.001 |
| Softball throw | (m) | 3.9 | ± | 1.5 | 4.4 | ± | 1.5 | 5.2 | ± | 1.6 | 5.8 | ± | 1.6 | 6.4 | ± | 1.9 | <0.001 |
| Sleep duration | (hours/day) | 9.5 | ± | 0.7 | 9.7 | ± | 0.6 | 9.5 | ± | 0.6 | 9.6 | ± | 0.5 | 9.6 | ± | 0.7 | 0.666 |
| Studying | (min/day) | 41.9 | ± | 19.9 | 48.9 | ± | 25.0 | 46.9 | ± | 34.3 | 41.2 | ± | 17.4 | 44.8 | ± | 32.7 | 0.679 |
| Watching television | (min/day) | 64.3 | ± | 41.6 | 74.2 | ± | 45.0 | 72.5 | ± | 48.2 | 66.8 | ± | 42.9 | 66.0 | ± | 49.2 | 0.654 |
| Playing video games/reading comics | (min/day) | 15.0 | ± | 25.4 | 14.8 | ± | 27.5 | 15.3 | ± | 28.7 | 12.9 | ± | 20.8 | 12.4 | ± | 23.2 | 0.397 |
| After school exercise class | (min/week) | 54.3 | ± | 61.1 | 73.4 | ± | 84.6 | 93.9 | ± | 106.3 | 82.3 | ± | 90.1 | 96.1 | ± | 131.4 | 0.010 |
| After school classroom learning | (min/week) | 47.0 | ± | 78.8 | 59.3 | ± | 77.6 | 61.2 | ± | 66.4 | 56.7 | ± | 91.1 | 39.5 | ± | 60.1 | 0.379 |
| After school music class | (min/week) | 16.1 | ± | 30.2 | 22.5 | ± | 38.6 | 24.8 | ± | 32.7 | 27.9 | ± | 36.5 | 23.2 | ± | 35.9 | 0.145 |
| Playing outside | Always | 60 | (85.7) | 83 | (86.5) | 73 | (89.0) | 86 | (94.5) | 84 | (91.3) | 0.069 | |||||
| Frequency of eating breakfast | 0–2 times/week | 0 | (0.0) | 0 | (0.0) | 0 | (0.0) | 0 | (0.0) | 0 | (0.0) | 0.397 | |||||
| 3–4 times/week | 1 | (1.4) | 1 | (1.0) | 1 | (1.2) | 0 | (0) | 0 | (0.0) | |||||||
| 5–6 times/week | 0 | (0.0) | 3 | (3.1) | 3 | (3.7) | 3 | (3.3) | 1 | (1.1) | |||||||
| 7 times/week | 69 | (98.6) | 92 | (95.8) | 78 | (95.1) | 88 | (96.7) | 91 | (98.9) | |||||||
| Variables | NPFT Score Quintile | p for Trend | |||||||||||||||
|---|---|---|---|---|---|---|---|---|---|---|---|---|---|---|---|---|---|
| q1 (n = 88) | q2 (n = 67) | q3 (n = 93) | q4 (n = 106) | q5 (n = 99) | |||||||||||||
| Breakfast | |||||||||||||||||
| Total energy | (kcal) | 355 | ± | 114 | 383 | ± | 123 | 362 | ± | 129 | 377 | ± | 146 | 374 | ± | 122 | 0.387 |
| Energy from healthy foods * | (kcal) | 321 | ± | 125 | 352 | ± | 133 | 323 | ± | 122 | 334 | ± | 138 | 332 | ± | 134 | 0.819 |
| Energy from unhealthy foods | (kcal) | 35 | ± | 81 | 31 | ± | 61 | 39 | ± | 81 | 43 | ± | 97 | 42 | ± | 107 | 0.362 |
| Lunch | |||||||||||||||||
| Total energy | (kcal) | 478 | ± | 137 | 476 | ± | 117 | 490 | ± | 135 | 516 | ± | 137 | 531 | ± | 134 | 0.003 |
| Dinner | |||||||||||||||||
| Total energy | (kcal) | 538 | ± | 169 | 627 | ± | 214 | 562 | ± | 195 | 560 | ± | 178 | 609 | ± | 178 | 0.152 |
| Energy from healthy foods * | (kcal) | 530 | ± | 168 | 611 | ± | 205 | 551 | ± | 194 | 552 | ± | 176 | 597 | ± | 177 | 0.153 |
| Energy from unhealthy foods | (kcal) | 7 | ± | 11 | 17 | ± | 34 | 11 | ± | 18 | 8 | ± | 14 | 12 | ± | 19 | 0.815 |
| Between meal eating | |||||||||||||||||
| Total energy | (kcal) | 208 | ± | 159 | 178 | ± | 129 | 213 | ± | 165 | 210 | ± | 143 | 194 | ± | 152 | 0.951 |
| Energy from healthy foods * | (kcal) | 52 | ± | 96 | 40 | ± | 70 | 41 | ± | 80 | 70 | ± | 93 | 66 | ± | 125 | 0.071 |
| Energy from unhealthy foods | (kcal) | 156 | ± | 138 | 138 | ± | 121 | 172 | ± | 132 | 140 | ± | 128 | 128 | ± | 117 | 0.151 |
| Daily | |||||||||||||||||
| Total energy | (kcal) | 1579 | ± | 321 | 1665 | ± | 306 | 1628 | ± | 369 | 1663 | ± | 307 | 1708 | ± | 315 | 0.013 |
| Energy from healthy foods * | (kcal) | 1381 | ± | 274 | 1479 | ± | 282 | 1406 | ± | 319 | 1472 | ± | 294 | 1526 | ± | 319 | 0.003 |
| Energy from unhealthy foods | (kcal) | 198 | ± | 177 | 185 | ± | 140 | 222 | ± | 161 | 191 | ± | 156 | 182 | ± | 170 | 0.548 |
| Grain dishes | (SV) | 2.90 | ± | 0.85 | 2.87 | ± | 0.76 | 2.83 | ± | 0.76 | 2.99 | ± | 0.85 | 3.11 | ± | 1.06 | 0.055 |
| Vegetable dishes | (SV) | 3.39 | ± | 1.38 | 3.89 | ± | 1.62 | 3.62 | ± | 1.70 | 4.12 | ± | 2.08 | 4.25 | ± | 1.91 | 0.001 |
| Fish and meat dishes | (SV) | 4.42 | ± | 1.79 | 5.16 | ± | 2.03 | 4.66 | ± | 1.86 | 4.89 | ± | 2.01 | 5.22 | ± | 2.11 | 0.028 |
| Milk and dairy products | (SV) | 3.67 | ± | 1.41 | 4.06 | ± | 2.23 | 3.72 | ± | 1.92 | 3.96 | ± | 1.81 | 3.84 | ± | 2.06 | 0.643 |
| Fruits | (SV) | 0.70 | ± | 0.78 | 0.86 | ± | 0.92 | 0.78 | ± | 0.85 | 0.87 | ± | 0.98 | 0.78 | ± | 0.71 | 0.485 |
| Confectionaries and sweetened beverages | (SV) | 2.58 | ± | 2.24 | 2.44 | ± | 1.75 | 2.87 | ± | 2.01 | 2.50 | ± | 1.94 | 2.39 | ± | 2.12 | 0.554 |
| Variables | NPFT Score Quintile | p for Trend | |||||||||||||||
|---|---|---|---|---|---|---|---|---|---|---|---|---|---|---|---|---|---|
| q1 (n = 70) | q2 (n = 96) | q3 (n = 82) | q4 (n = 91) | q5 (n = 92) | |||||||||||||
| Breakfast | |||||||||||||||||
| Total energy | (kcal) | 317 | ± | 119 | 323 | ± | 125 | 328 | ± | 107 | 353 | ± | 124 | 355 | ± | 105 | 0.008 |
| Energy from healthy foods * | (kcal) | 289 | ± | 133 | 286 | ± | 123 | 294 | ± | 125 | 333 | ± | 129 | 311 | ± | 118 | 0.030 |
| Energy from unhealthy foods | (kcal) | 28 | ± | 63 | 37 | ± | 75 | 34 | ± | 67 | 20 | ± | 41 | 44 | ± | 91 | 0.606 |
| Lunch | |||||||||||||||||
| Total energy | (kcal) | 417 | ± | 126 | 480 | ± | 127 | 448 | ± | 110 | 470 | ± | 115 | 520 | ± | 138 | <0.001 |
| Dinner | |||||||||||||||||
| Total energy | (kcal) | 538 | ± | 148 | 524 | ± | 158 | 502 | ± | 163 | 536 | ± | 221 | 535 | ± | 172 | 0.848 |
| Energy from healthy foods * | (kcal) | 527 | ± | 144 | 515 | ± | 155 | 492 | ± | 156 | 524 | ± | 219 | 524 | ± | 170 | 0.875 |
| Energy from unhealthy foods | (kcal) | 10 | ± | 18 | 10 | ± | 13 | 10 | ± | 18 | 13 | ± | 25 | 10 | ± | 13 | 0.515 |
| Between meal eating | |||||||||||||||||
| Total energy | (kcal) | 166 | ± | 126 | 190 | ± | 148 | 178 | ± | 157 | 194 | ± | 137 | 173 | ± | 114 | 0.780 |
| Energy from healthy foods * | (kcal) | 37 | ± | 65 | 52 | ± | 98 | 52 | ± | 109 | 44 | ± | 74 | 31 | ± | 62 | 0.375 |
| Energy from unhealthy foods | (kcal) | 129 | ± | 110 | 138 | ± | 124 | 126 | ± | 125 | 150 | ± | 123 | 142 | ± | 104 | 0.338 |
| Daily | |||||||||||||||||
| Total energy | (kcal) | 1438 | ± | 270 | 1517 | ± | 278 | 1457 | ± | 278 | 1554 | ± | 329 | 1583 | ± | 262 | 0.001 |
| Energy from healthy foods * | (kcal) | 1271 | ± | 265 | 1333 | ± | 275 | 1287 | ± | 264 | 1372 | ± | 310 | 1387 | ± | 251 | 0.005 |
| Energy from unhealthy foods | (kcal) | 167 | ± | 127 | 184 | ± | 140 | 170 | ± | 142 | 184 | ± | 142 | 196 | ± | 149 | 0.254 |
| Grain dishes | (SV) | 2.65 | ± | 0.78 | 2.72 | ± | 0.77 | 2.69 | ± | 0.75 | 2.72 | ± | 0.75 | 2.86 | ± | 0.79 | 0.111 |
| Vegetable dishes | (SV) | 3.63 | ± | 1.48 | 3.92 | ± | 1.59 | 3.61 | ± | 1.63 | 3.85 | ± | 1.60 | 4.13 | ± | 1.65 | 0.101 |
| Fish and meat dishes | (SV) | 4.06 | ± | 1.52 | 4.28 | ± | 1.65 | 4.37 | ± | 2.11 | 4.66 | ± | 1.99 | 4.54 | ± | 1.69 | 0.037 |
| Milk and dairy products | (SV) | 3.34 | ± | 1.52 | 3.53 | ± | 1.67 | 2.89 | ± | 1.51 | 3.61 | ± | 1.64 | 3.37 | ± | 1.60 | 0.805 |
| Fruits | (SV) | 0.74 | ± | 0.79 | 0.61 | ± | 0.79 | 0.77 | ± | 0.80 | 0.87 | ± | 0.93 | 0.70 | ± | 0.89 | 0.516 |
| Confectionaries and sweetened beverages | (SV) | 2.17 | ± | 1.59 | 2.40 | ± | 1.74 | 2.21 | ± | 1.76 | 2.39 | ± | 1.77 | 2.56 | ± | 1.85 | 0.207 |
| Variables | Boys | Girls | ||
|---|---|---|---|---|
| β * | p | β * | p | |
| Sleep duration | 0.019 | 0.684 | 0.002 | 0.967 |
| Playing outside | 0.132 | 0.005 | 0.082 | 0.088 |
| Studying at home | −0.059 | 0.210 | −0.021 | 0.667 |
| Sedentary activity at home | −0.007 | 0.877 | −0.006 | 0.895 |
| After school exercise class | 0.139 | 0.003 | 0.138 | 0.004 |
| After school classroom learning | 0.008 | 0.860 | 0.011 | 0.823 |
| After school music class | −0.013 | 0.775 | 0.079 | 0.104 |
| Eating breakfast every day | −0.013 | 0.774 | 0.003 | 0.944 |
| Daily total energy intake | 0.151 | 0.001 | 0.176 | <0.001 |
| Energy intake from healthy foods † | 0.170 | <0.001 | 0.148 | 0.002 |
| Energy intake from unhealthy foods | −0.015 | 0.751 | 0.071 | 0.138 |
| Variables | Model 1 | Model 2 | Model 3 | |||
|---|---|---|---|---|---|---|
| β † | p | β † | p | β † | p | |
| Boys | ||||||
| Playing outside | 0.104 | 0.026 | 0.122 | 0.010 | 0.131 | 0.005 |
| After school exercise class | 0.126 | 0.008 | 0.137 | 0.004 | 0.133 | 0.005 |
| Energy from healthy foods * | 0.151 | 0.001 | - | - | 0.120 | 0.011 |
| Energy from unhealthy foods | - | - | −0.022 | 0.638 | −0.019 | 0.683 |
| Girls | ||||||
| Playing outside | 0.082 | 0.088 | 0.088 | 0.070 | 0.088 | 0.066 |
| After school exercise class | 0.132 | 0.006 | 0.139 | 0.004 | 0.120 | 0.013 |
| Energy from healthy foods * | 0.141 | 0.004 | - | - | 0.140 | 0.004 |
| Energy from unhealthy foods | - | - | 0.063 | 0.195 | 0.076 | 0.116 |
Publisher’s Note: MDPI stays neutral with regard to jurisdictional claims in published maps and institutional affiliations. |
© 2022 by the authors. Licensee MDPI, Basel, Switzerland. This article is an open access article distributed under the terms and conditions of the Creative Commons Attribution (CC BY) license (https://creativecommons.org/licenses/by/4.0/).
Share and Cite
Hatta, N.; Tada, Y.; Ishikawa-Takata, K.; Furusho, T.; Kanehara, R.; Hata, T.; Hida, A.; Kawano, Y. Energy Intake from Healthy Foods Is Associated with Motor Fitness in Addition to Physical Activity: A Cross-Sectional Study of First-Grade Schoolchildren in Japan. Int. J. Environ. Res. Public Health 2022, 19, 1819. https://doi.org/10.3390/ijerph19031819
Hatta N, Tada Y, Ishikawa-Takata K, Furusho T, Kanehara R, Hata T, Hida A, Kawano Y. Energy Intake from Healthy Foods Is Associated with Motor Fitness in Addition to Physical Activity: A Cross-Sectional Study of First-Grade Schoolchildren in Japan. International Journal of Environmental Research and Public Health. 2022; 19(3):1819. https://doi.org/10.3390/ijerph19031819
Chicago/Turabian StyleHatta, Naoko, Yuki Tada, Kazuko Ishikawa-Takata, Tadasu Furusho, Rieko Kanehara, Toshiki Hata, Azumi Hida, and Yukari Kawano. 2022. "Energy Intake from Healthy Foods Is Associated with Motor Fitness in Addition to Physical Activity: A Cross-Sectional Study of First-Grade Schoolchildren in Japan" International Journal of Environmental Research and Public Health 19, no. 3: 1819. https://doi.org/10.3390/ijerph19031819
APA StyleHatta, N., Tada, Y., Ishikawa-Takata, K., Furusho, T., Kanehara, R., Hata, T., Hida, A., & Kawano, Y. (2022). Energy Intake from Healthy Foods Is Associated with Motor Fitness in Addition to Physical Activity: A Cross-Sectional Study of First-Grade Schoolchildren in Japan. International Journal of Environmental Research and Public Health, 19(3), 1819. https://doi.org/10.3390/ijerph19031819