
Exploring the Effects of Land Use Changes on the Landscape Pattern and Soil Erosion of Western Hubei Province from 2000 to 2020


Abstract
:1. Introduction
2. Study Area and Data Sources
2.1. Study Area
2.2. Data Sources
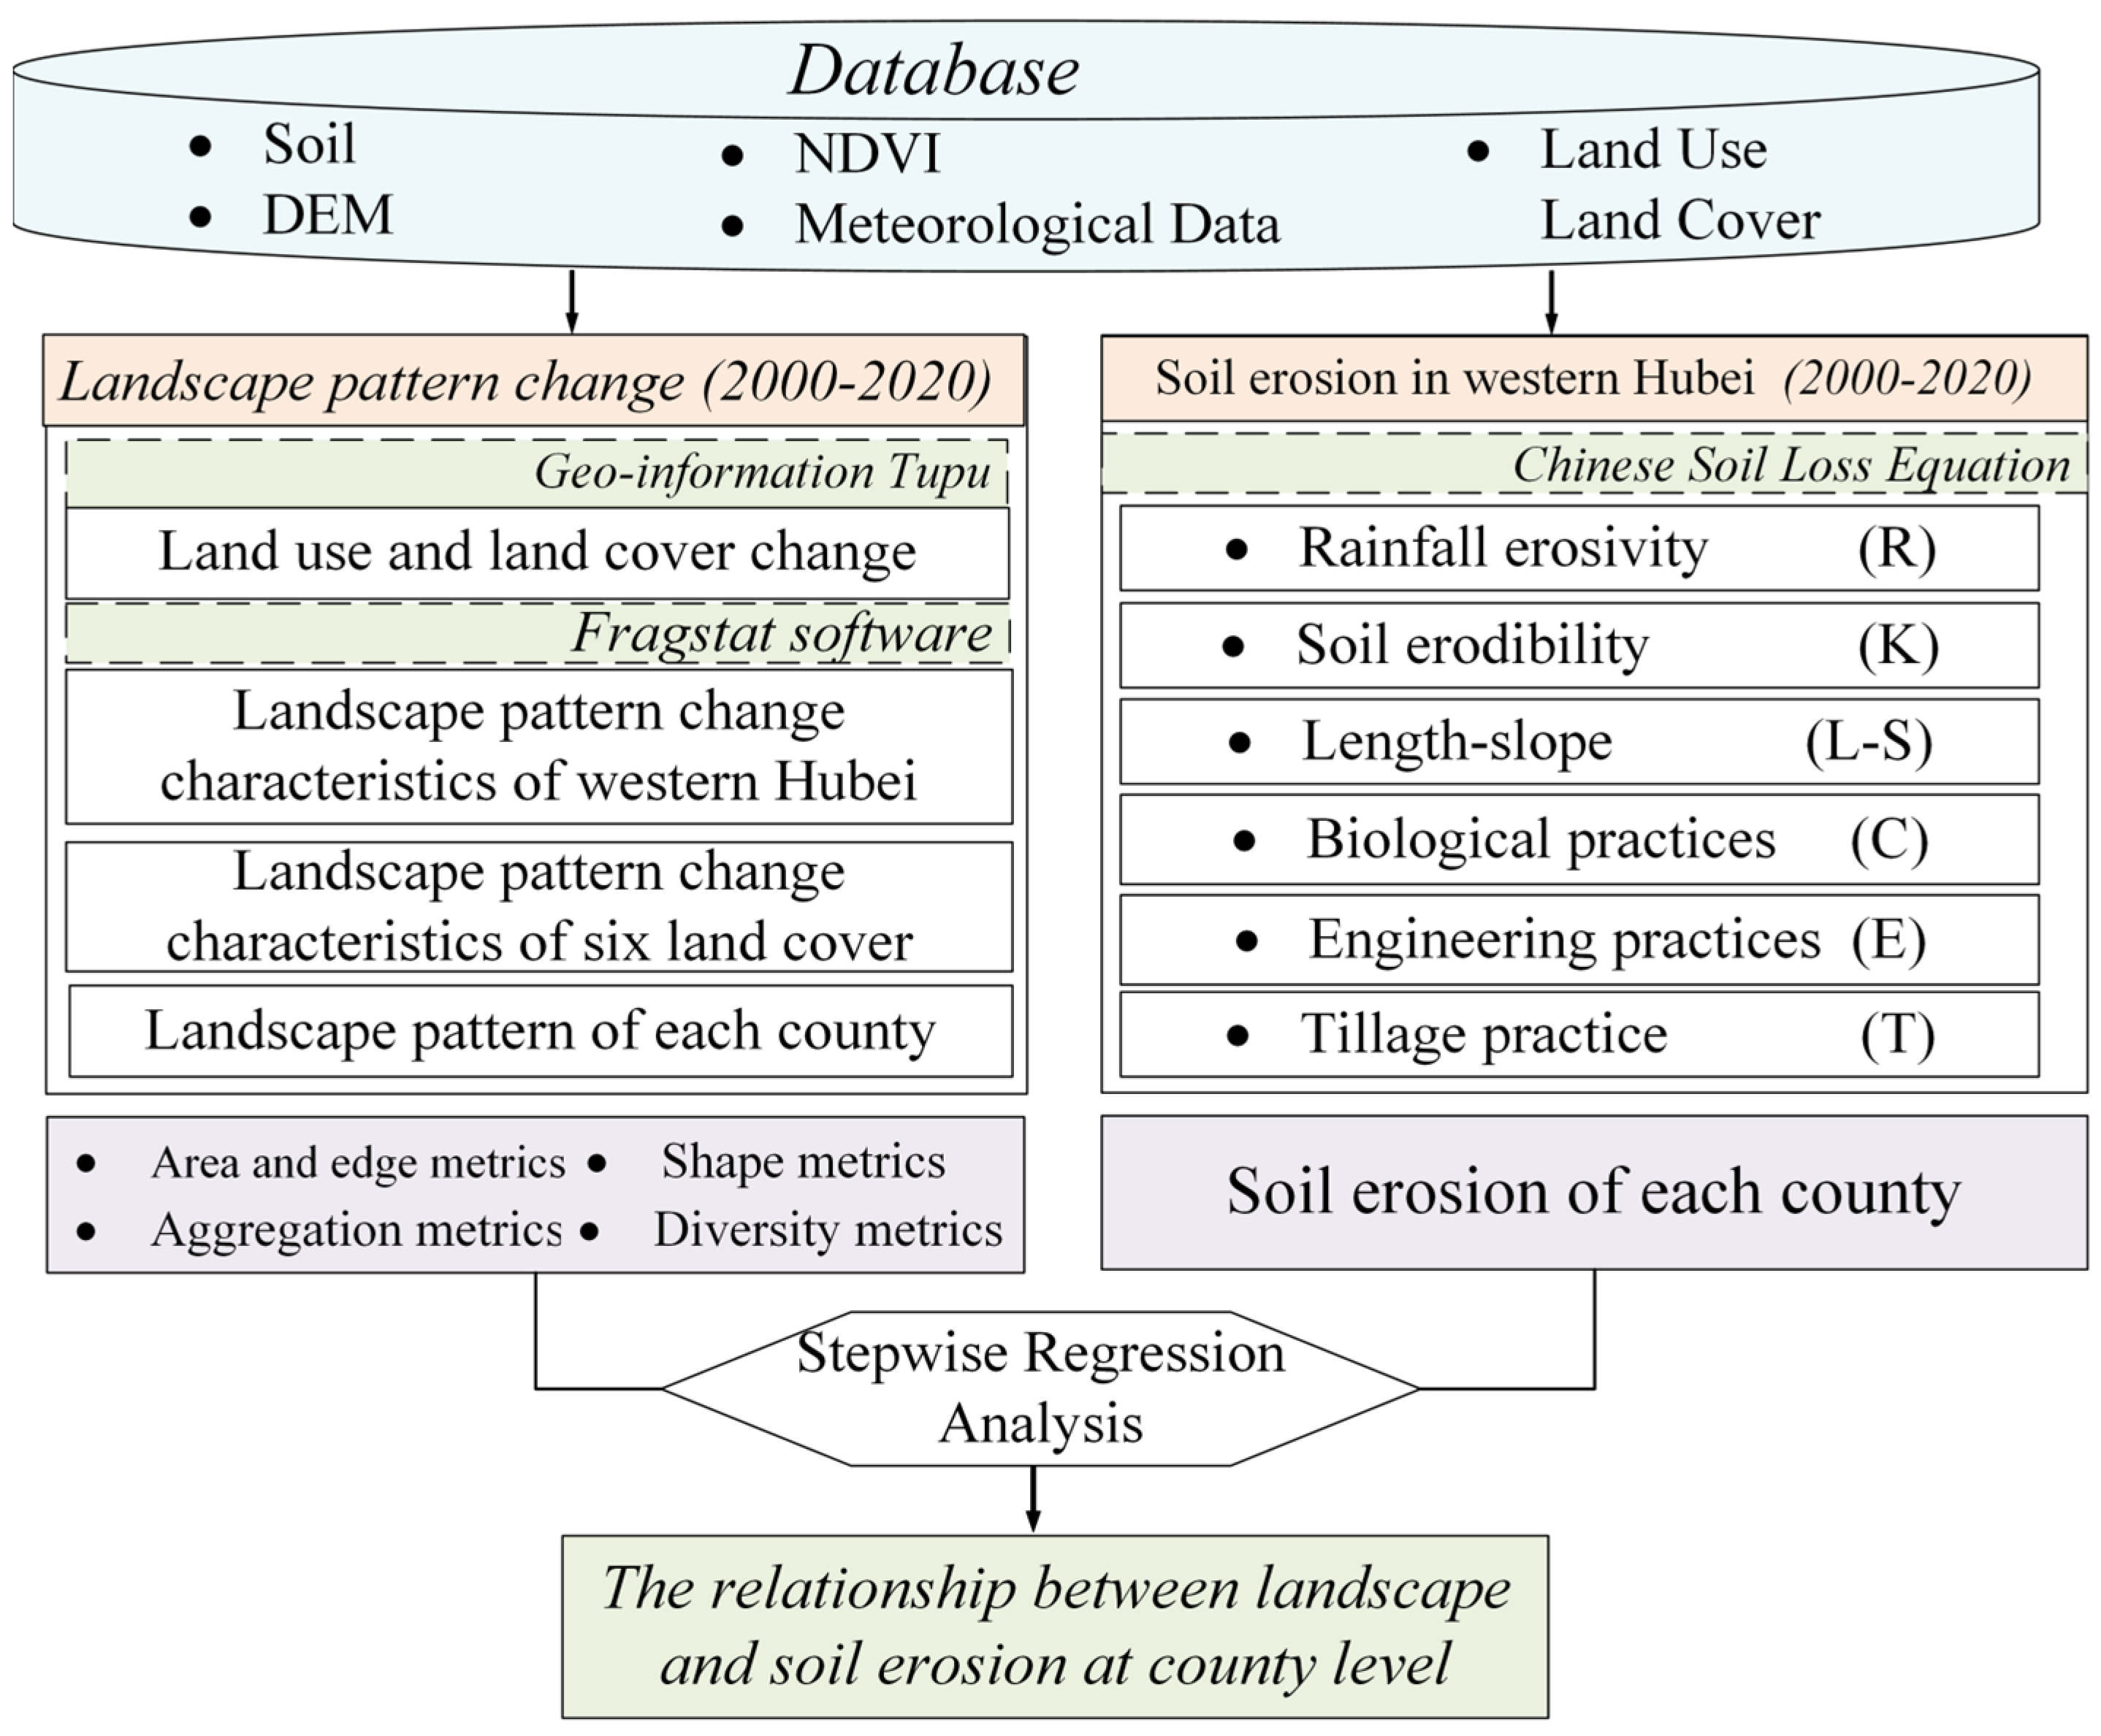
3. Methods
3.1. Geo-Information Tupu
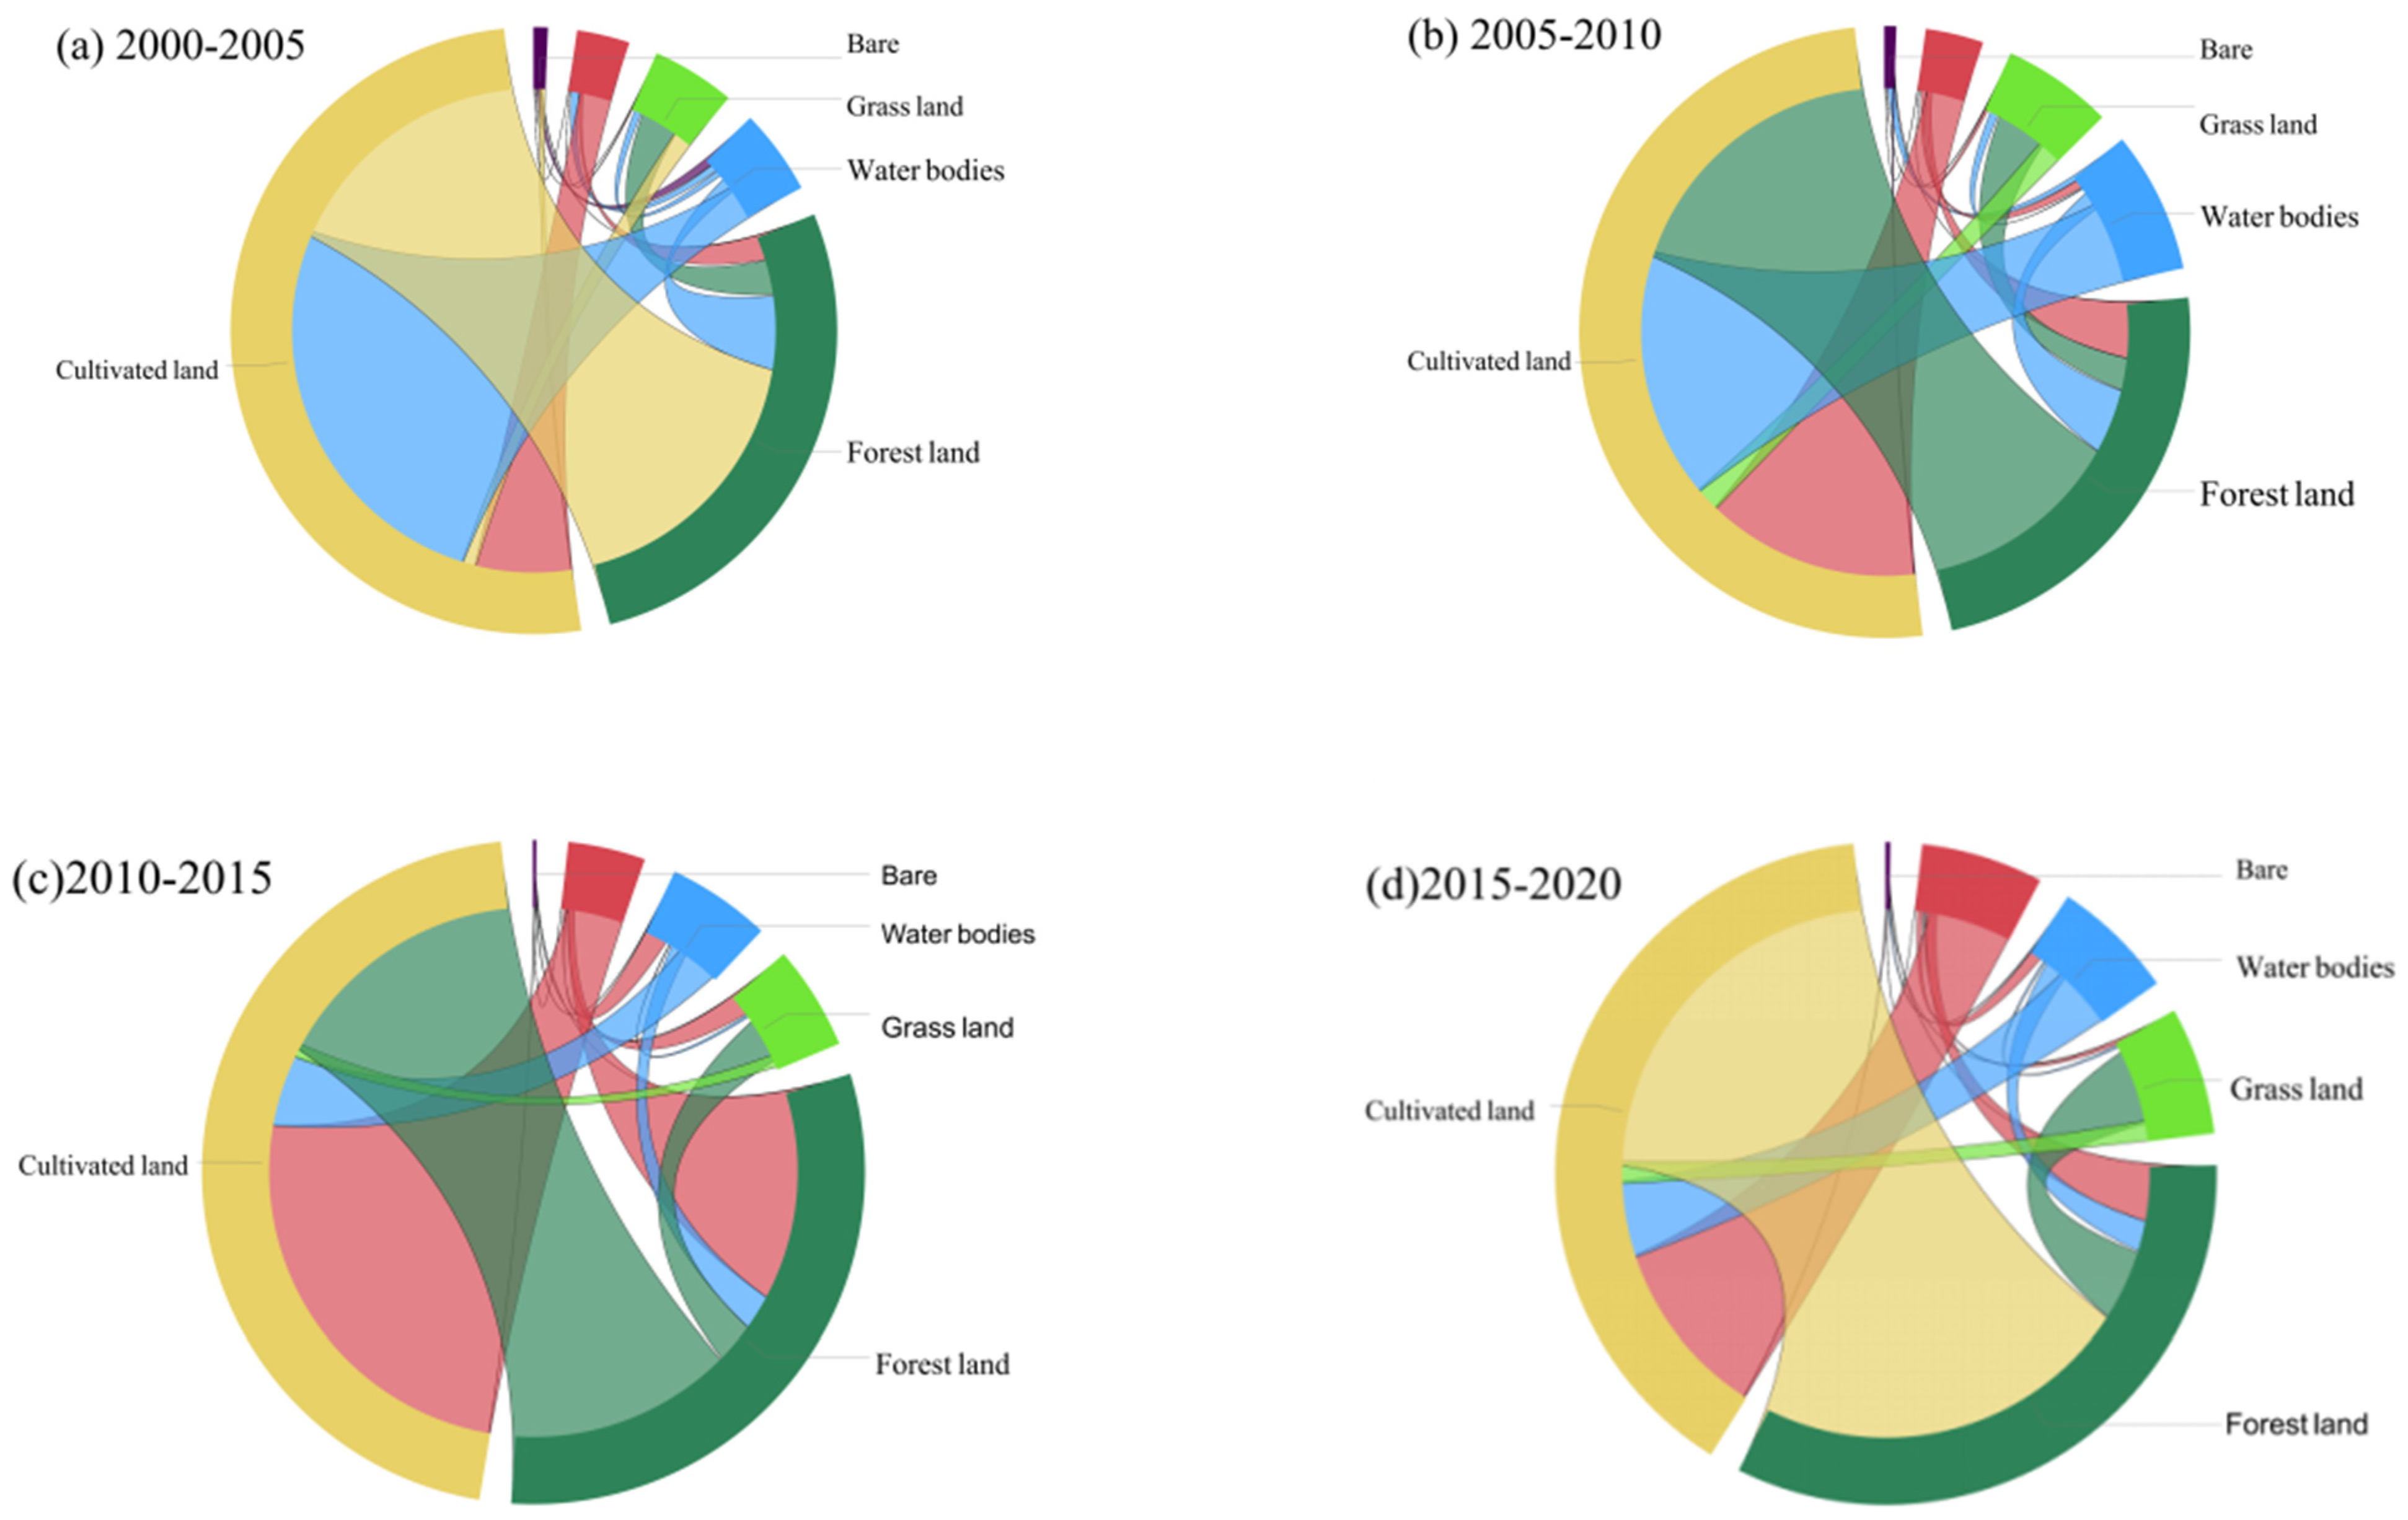
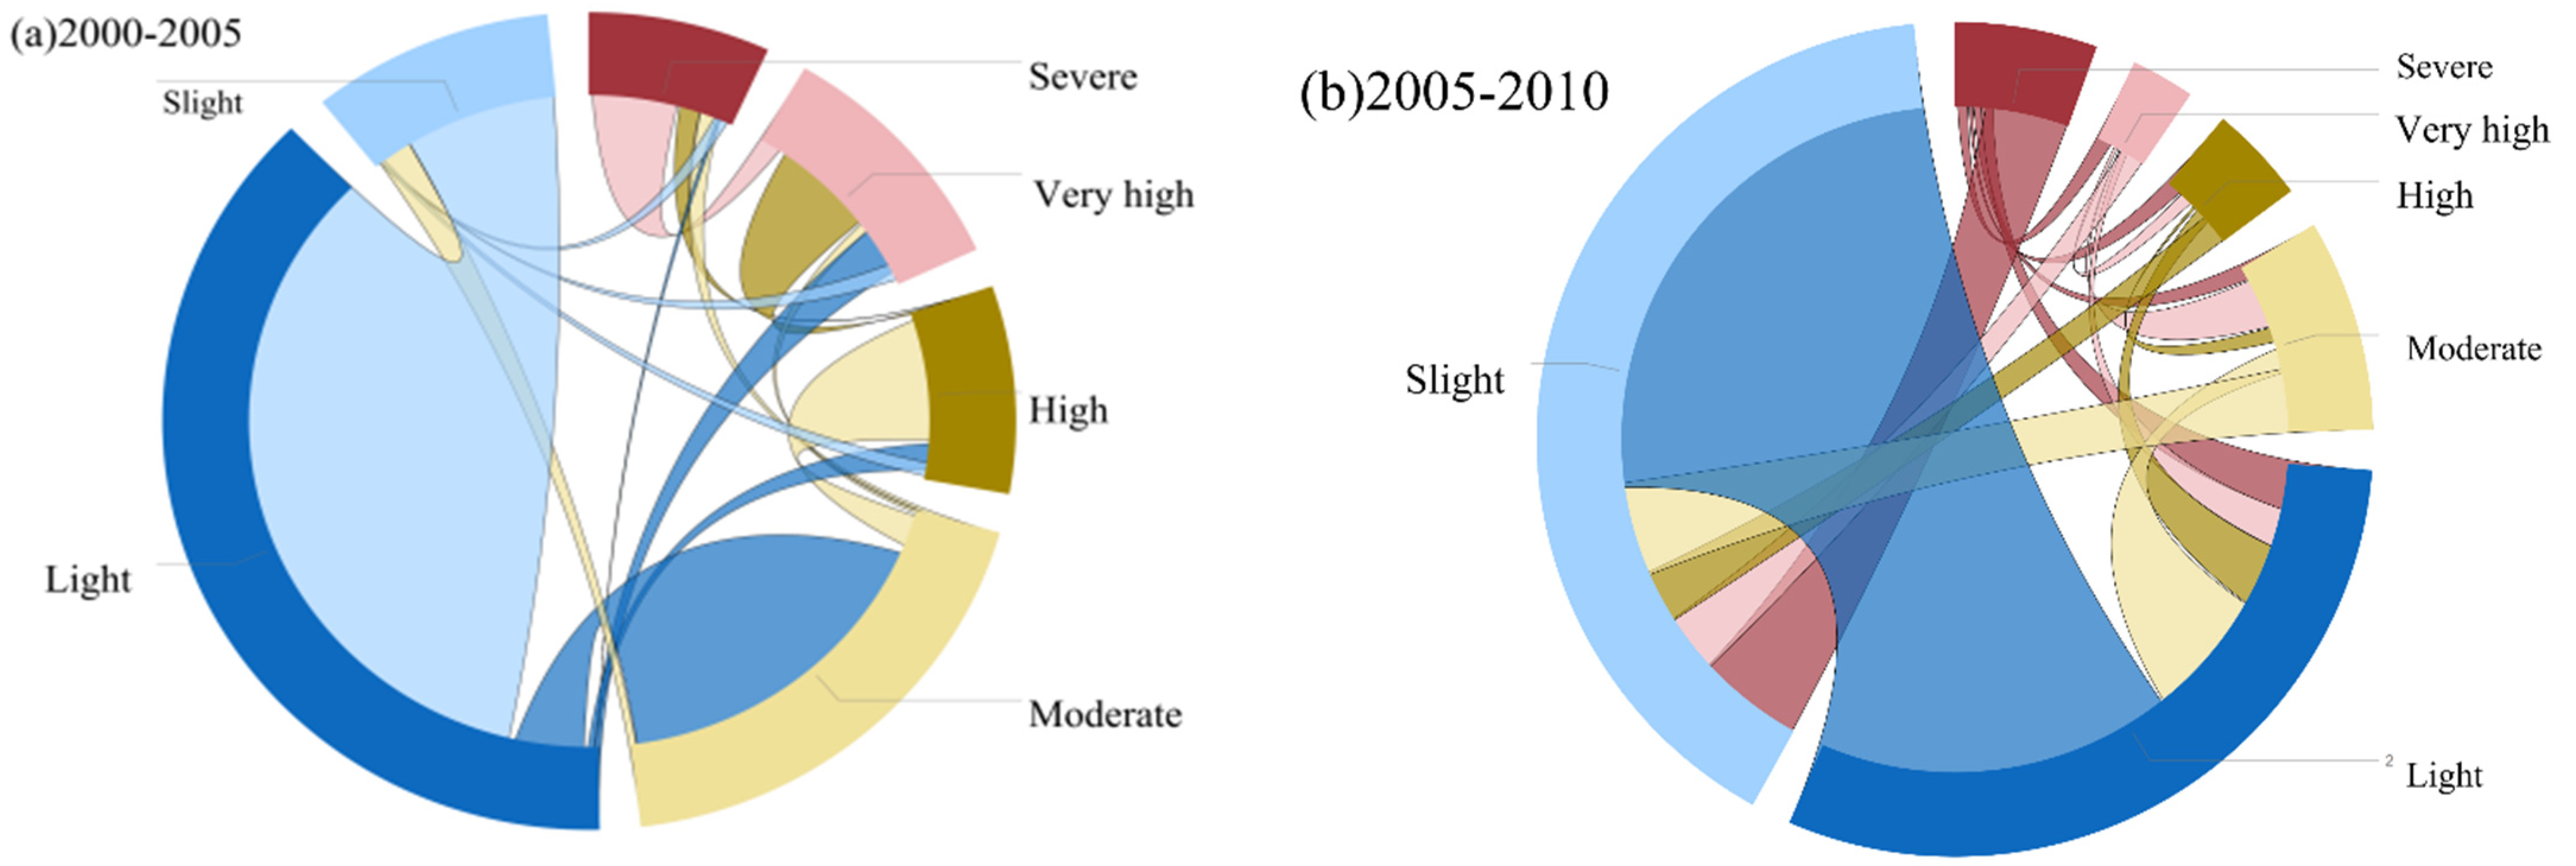
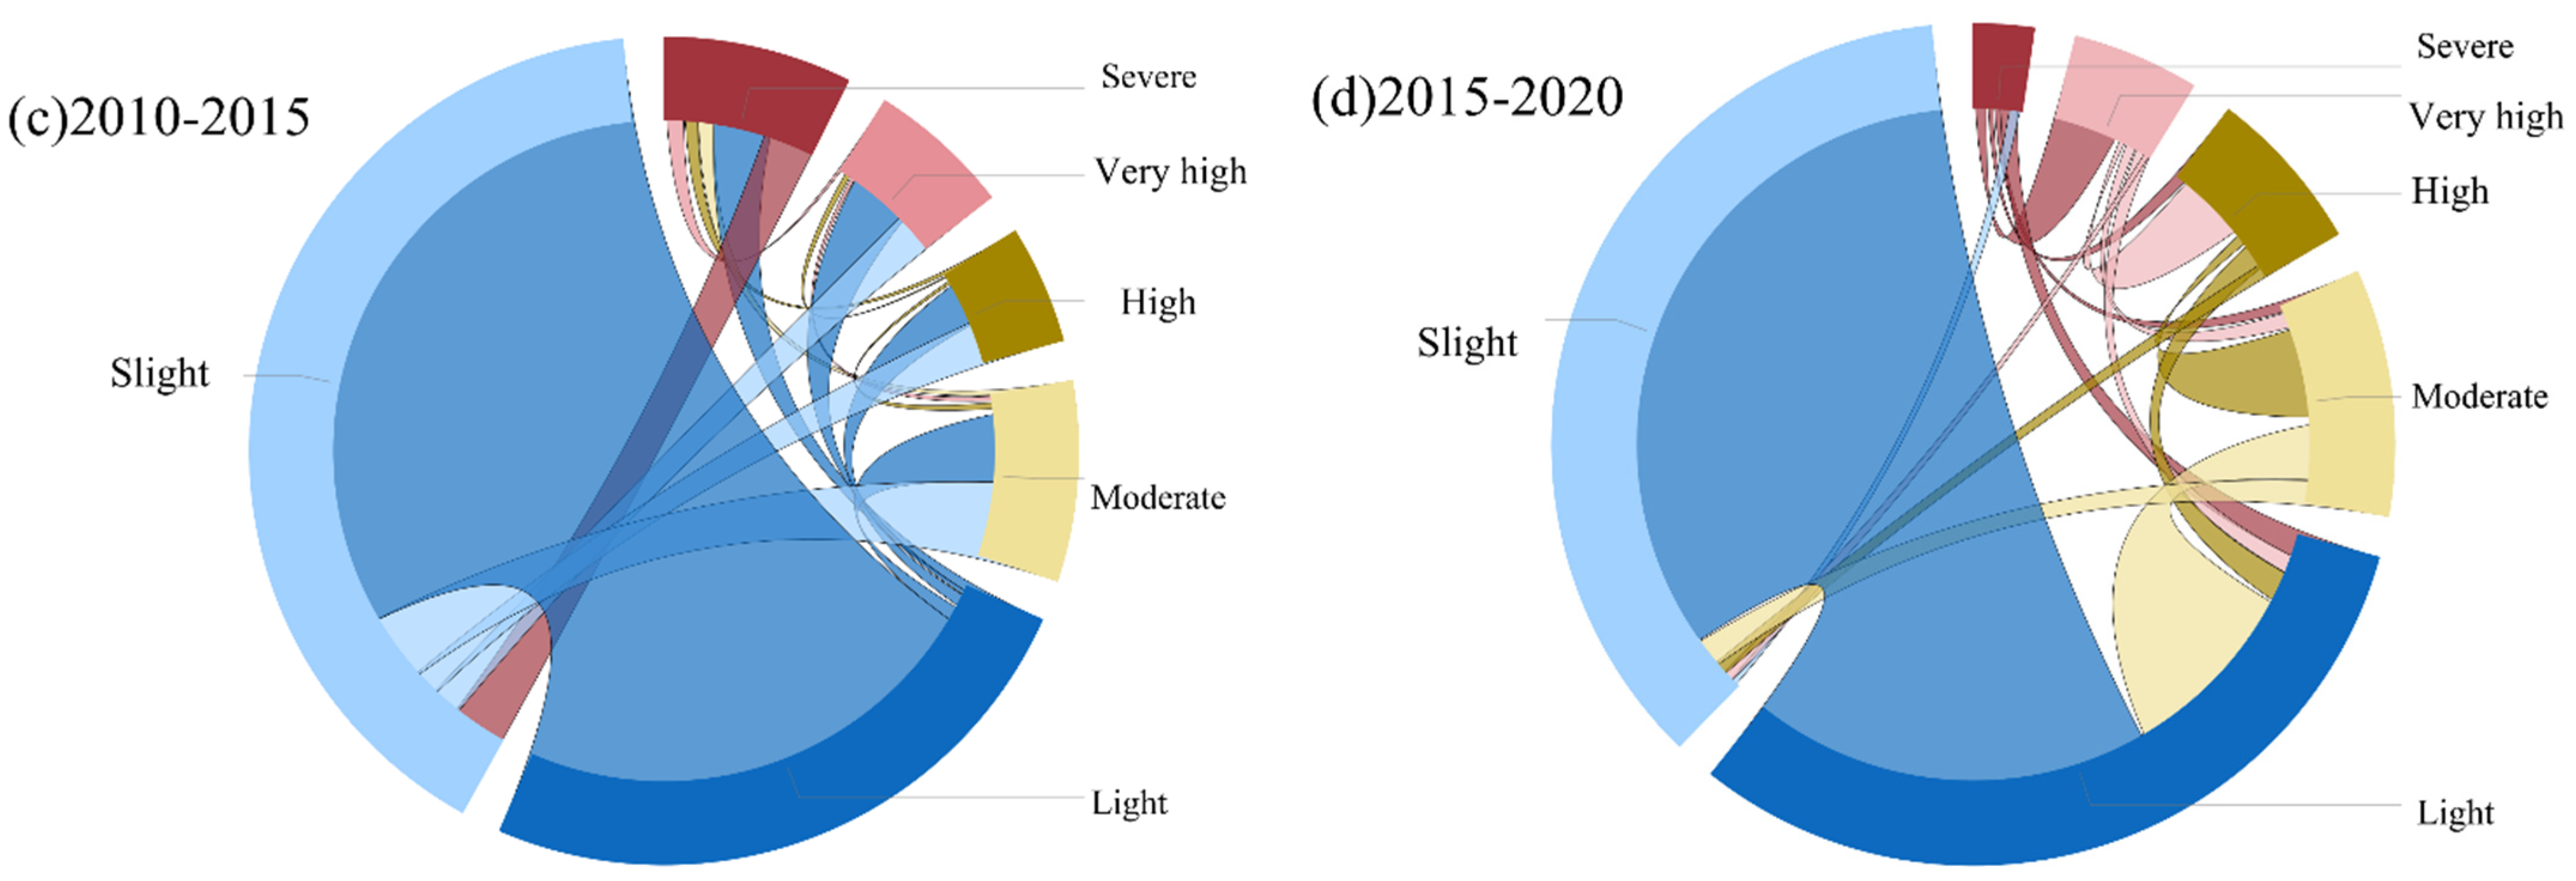
3.2. Chord Diagram Analysis of Land Cover Change
3.3. Chinese Soil Loss Equation (CSLE)
3.4. Landscape Pattern Analysis
3.5. Regression Analysis
4. Results
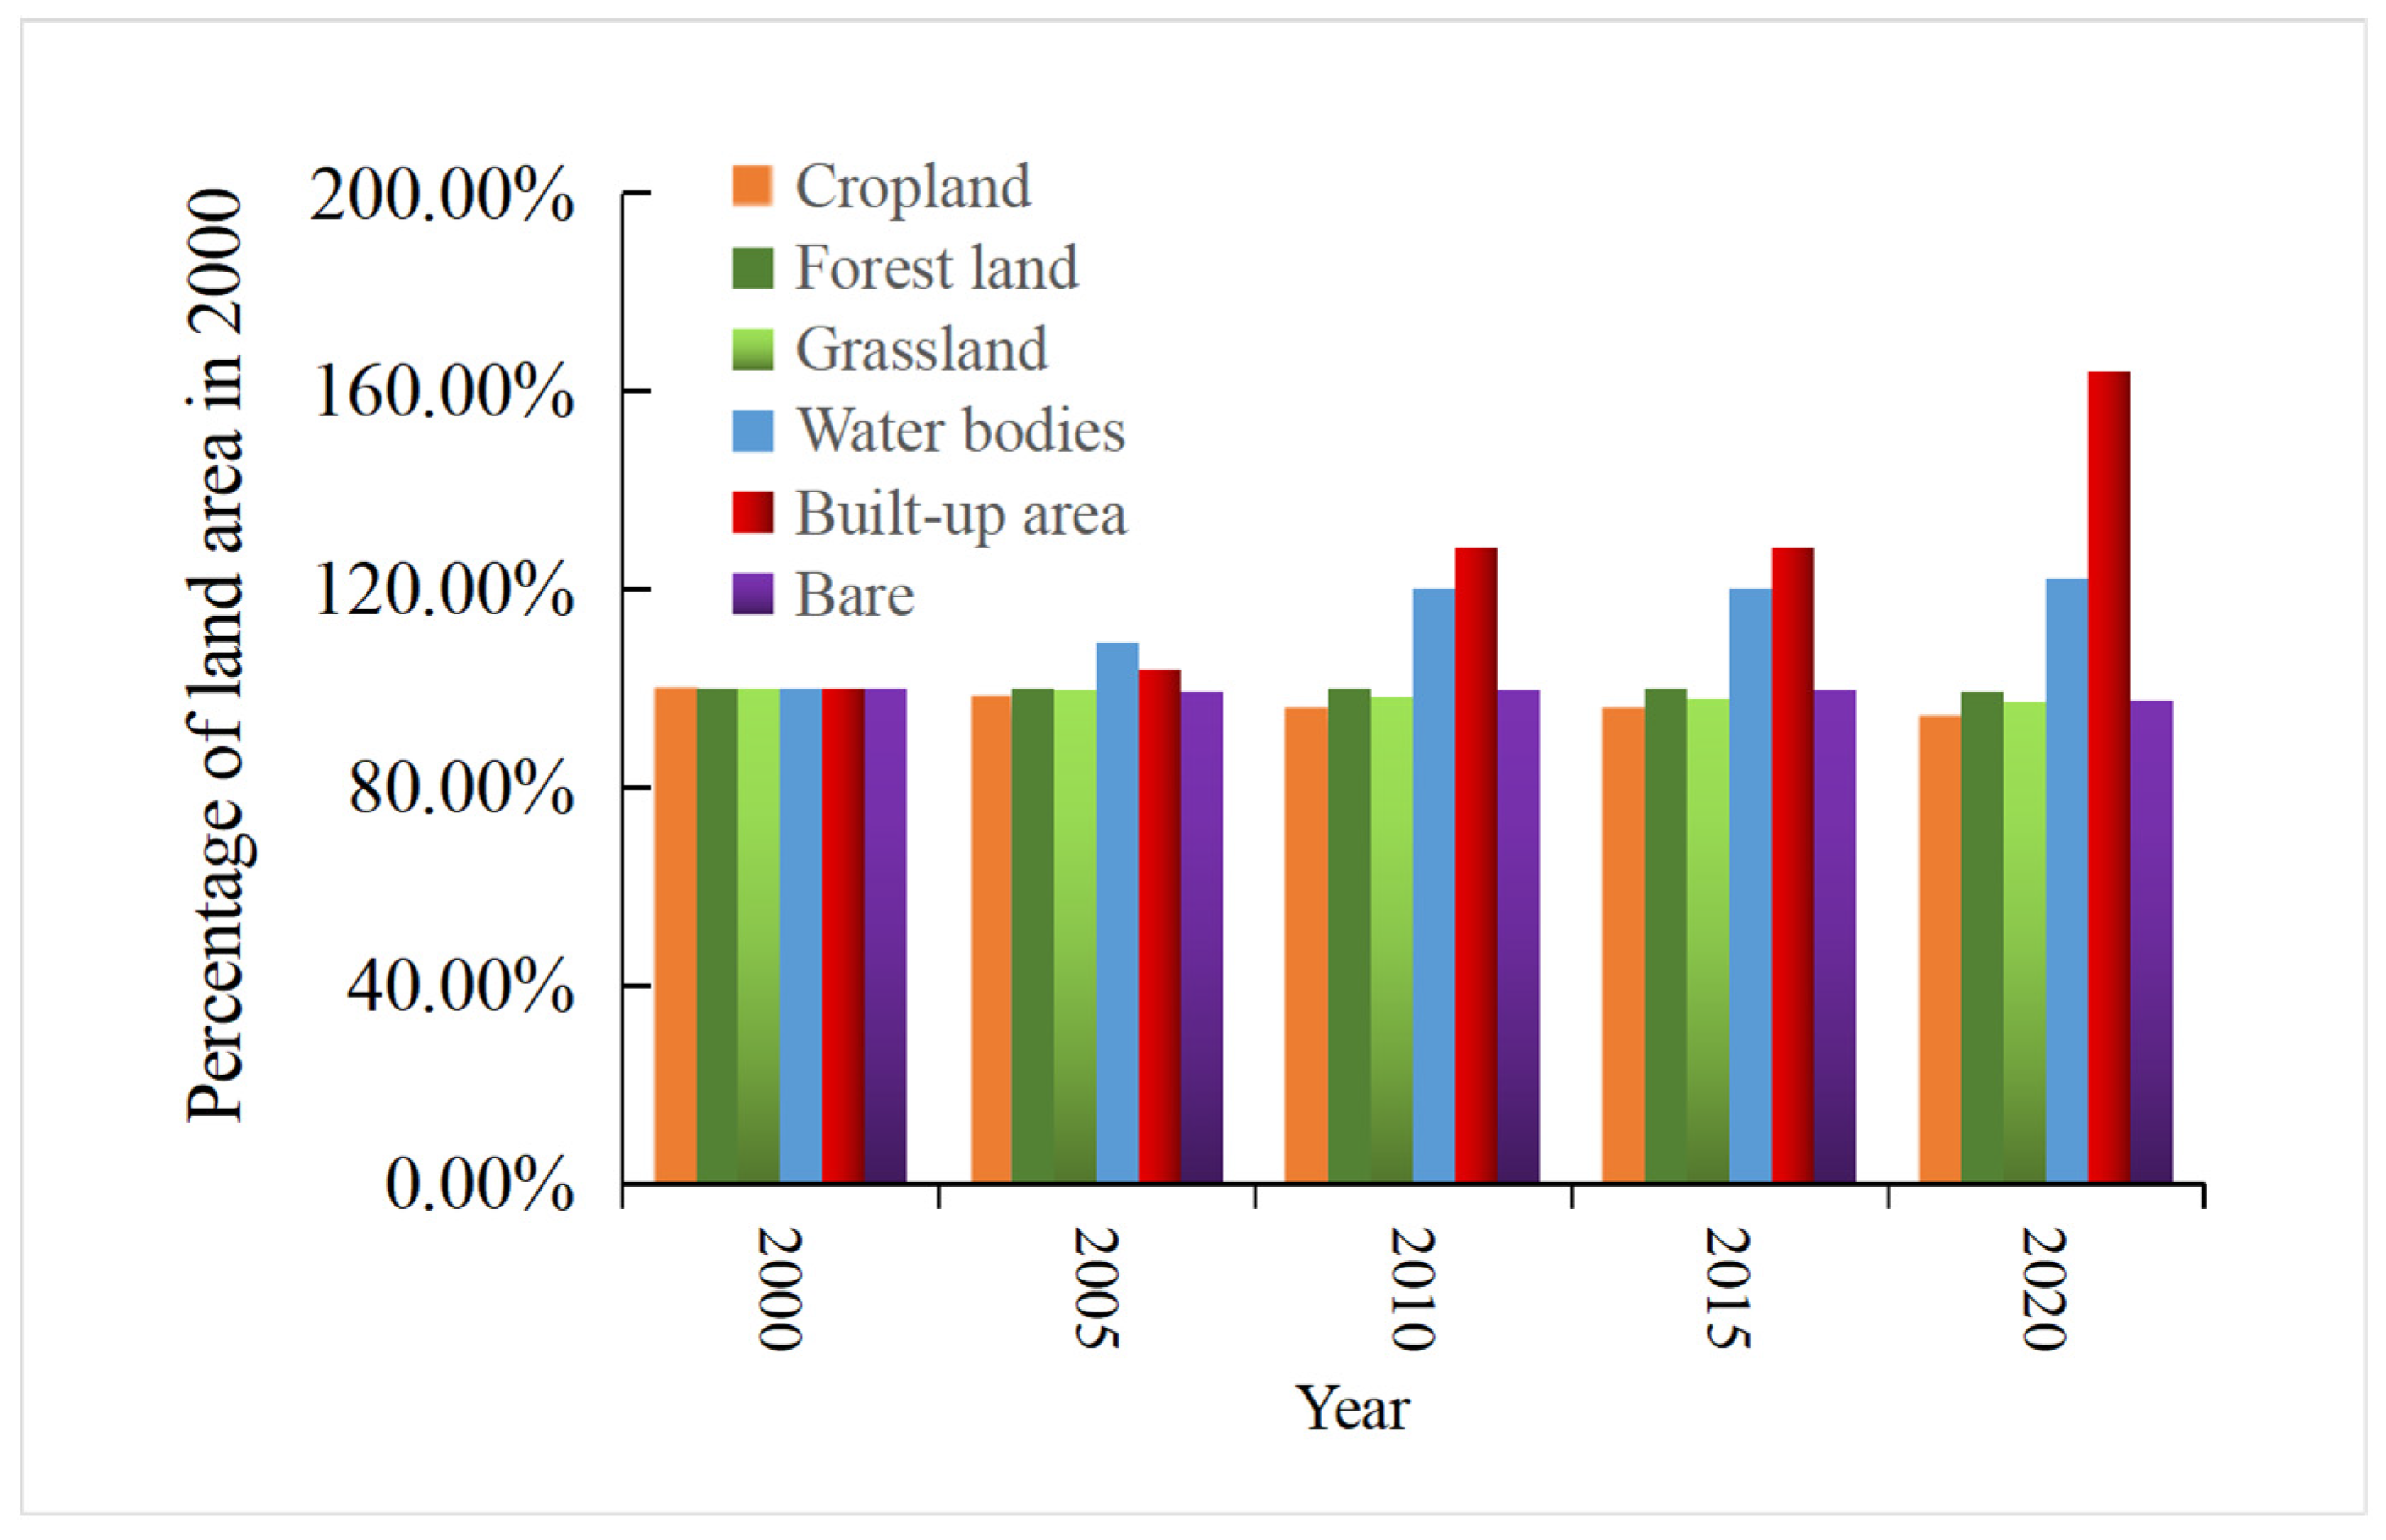
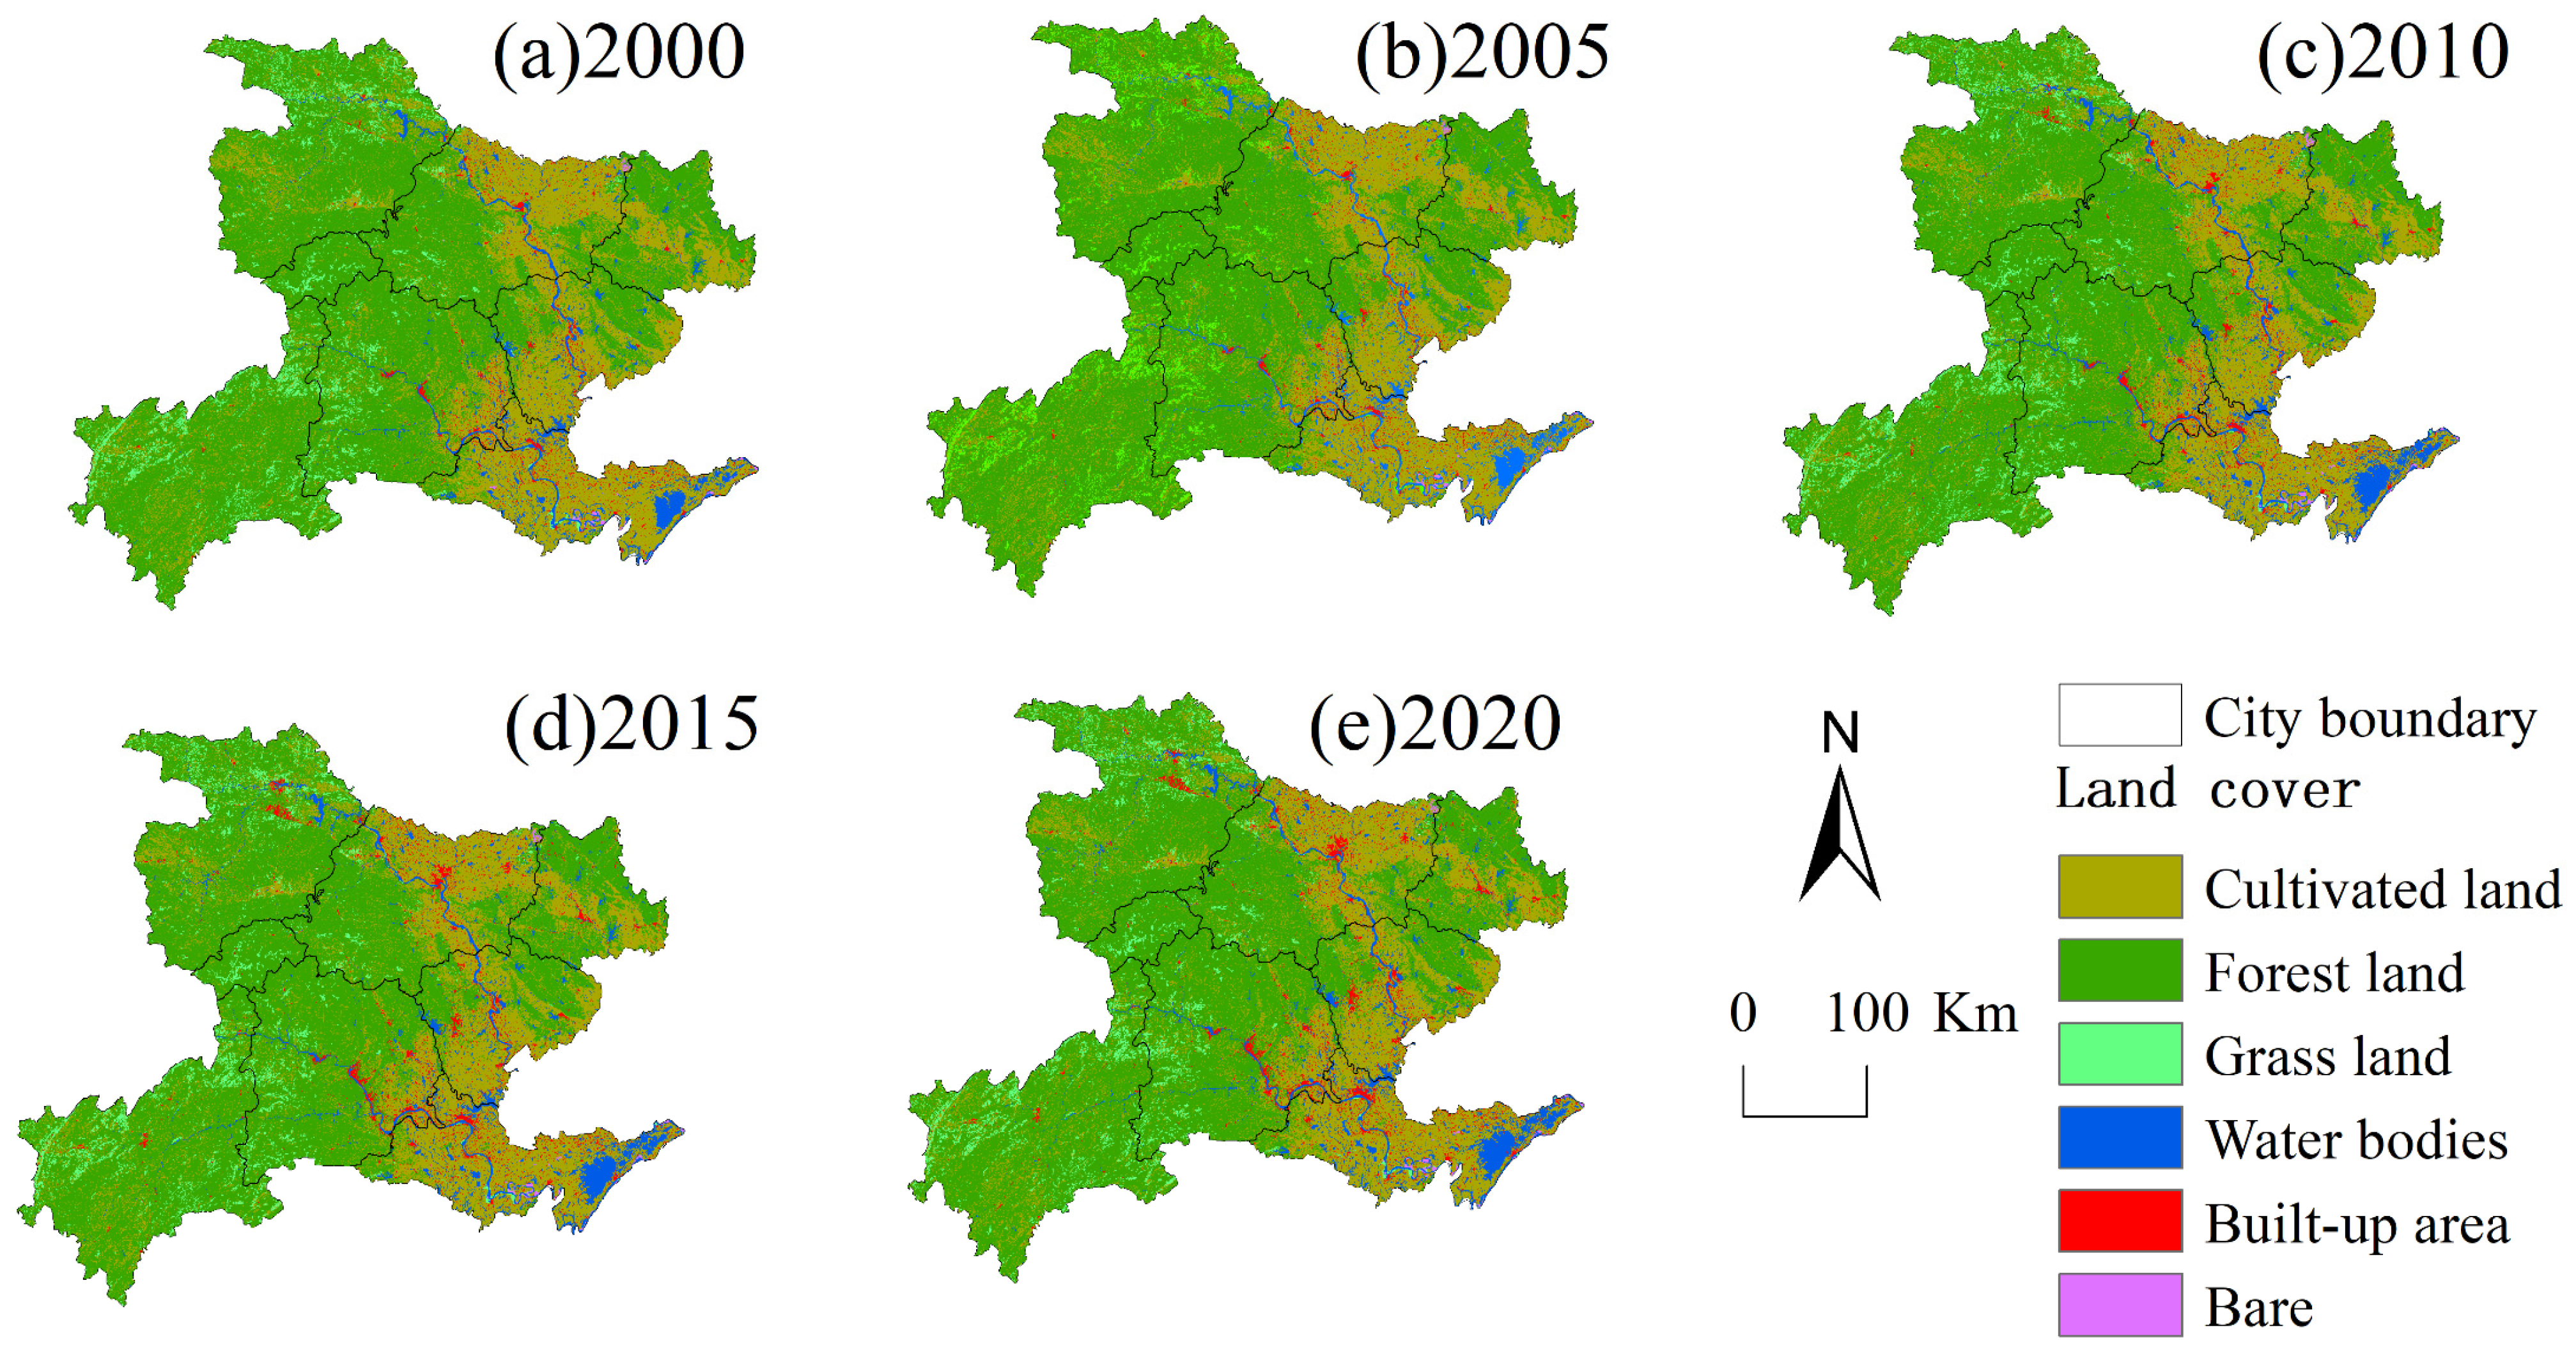
4.1. Land Cover Change from 2000 to 2020 in Western Hubei Province
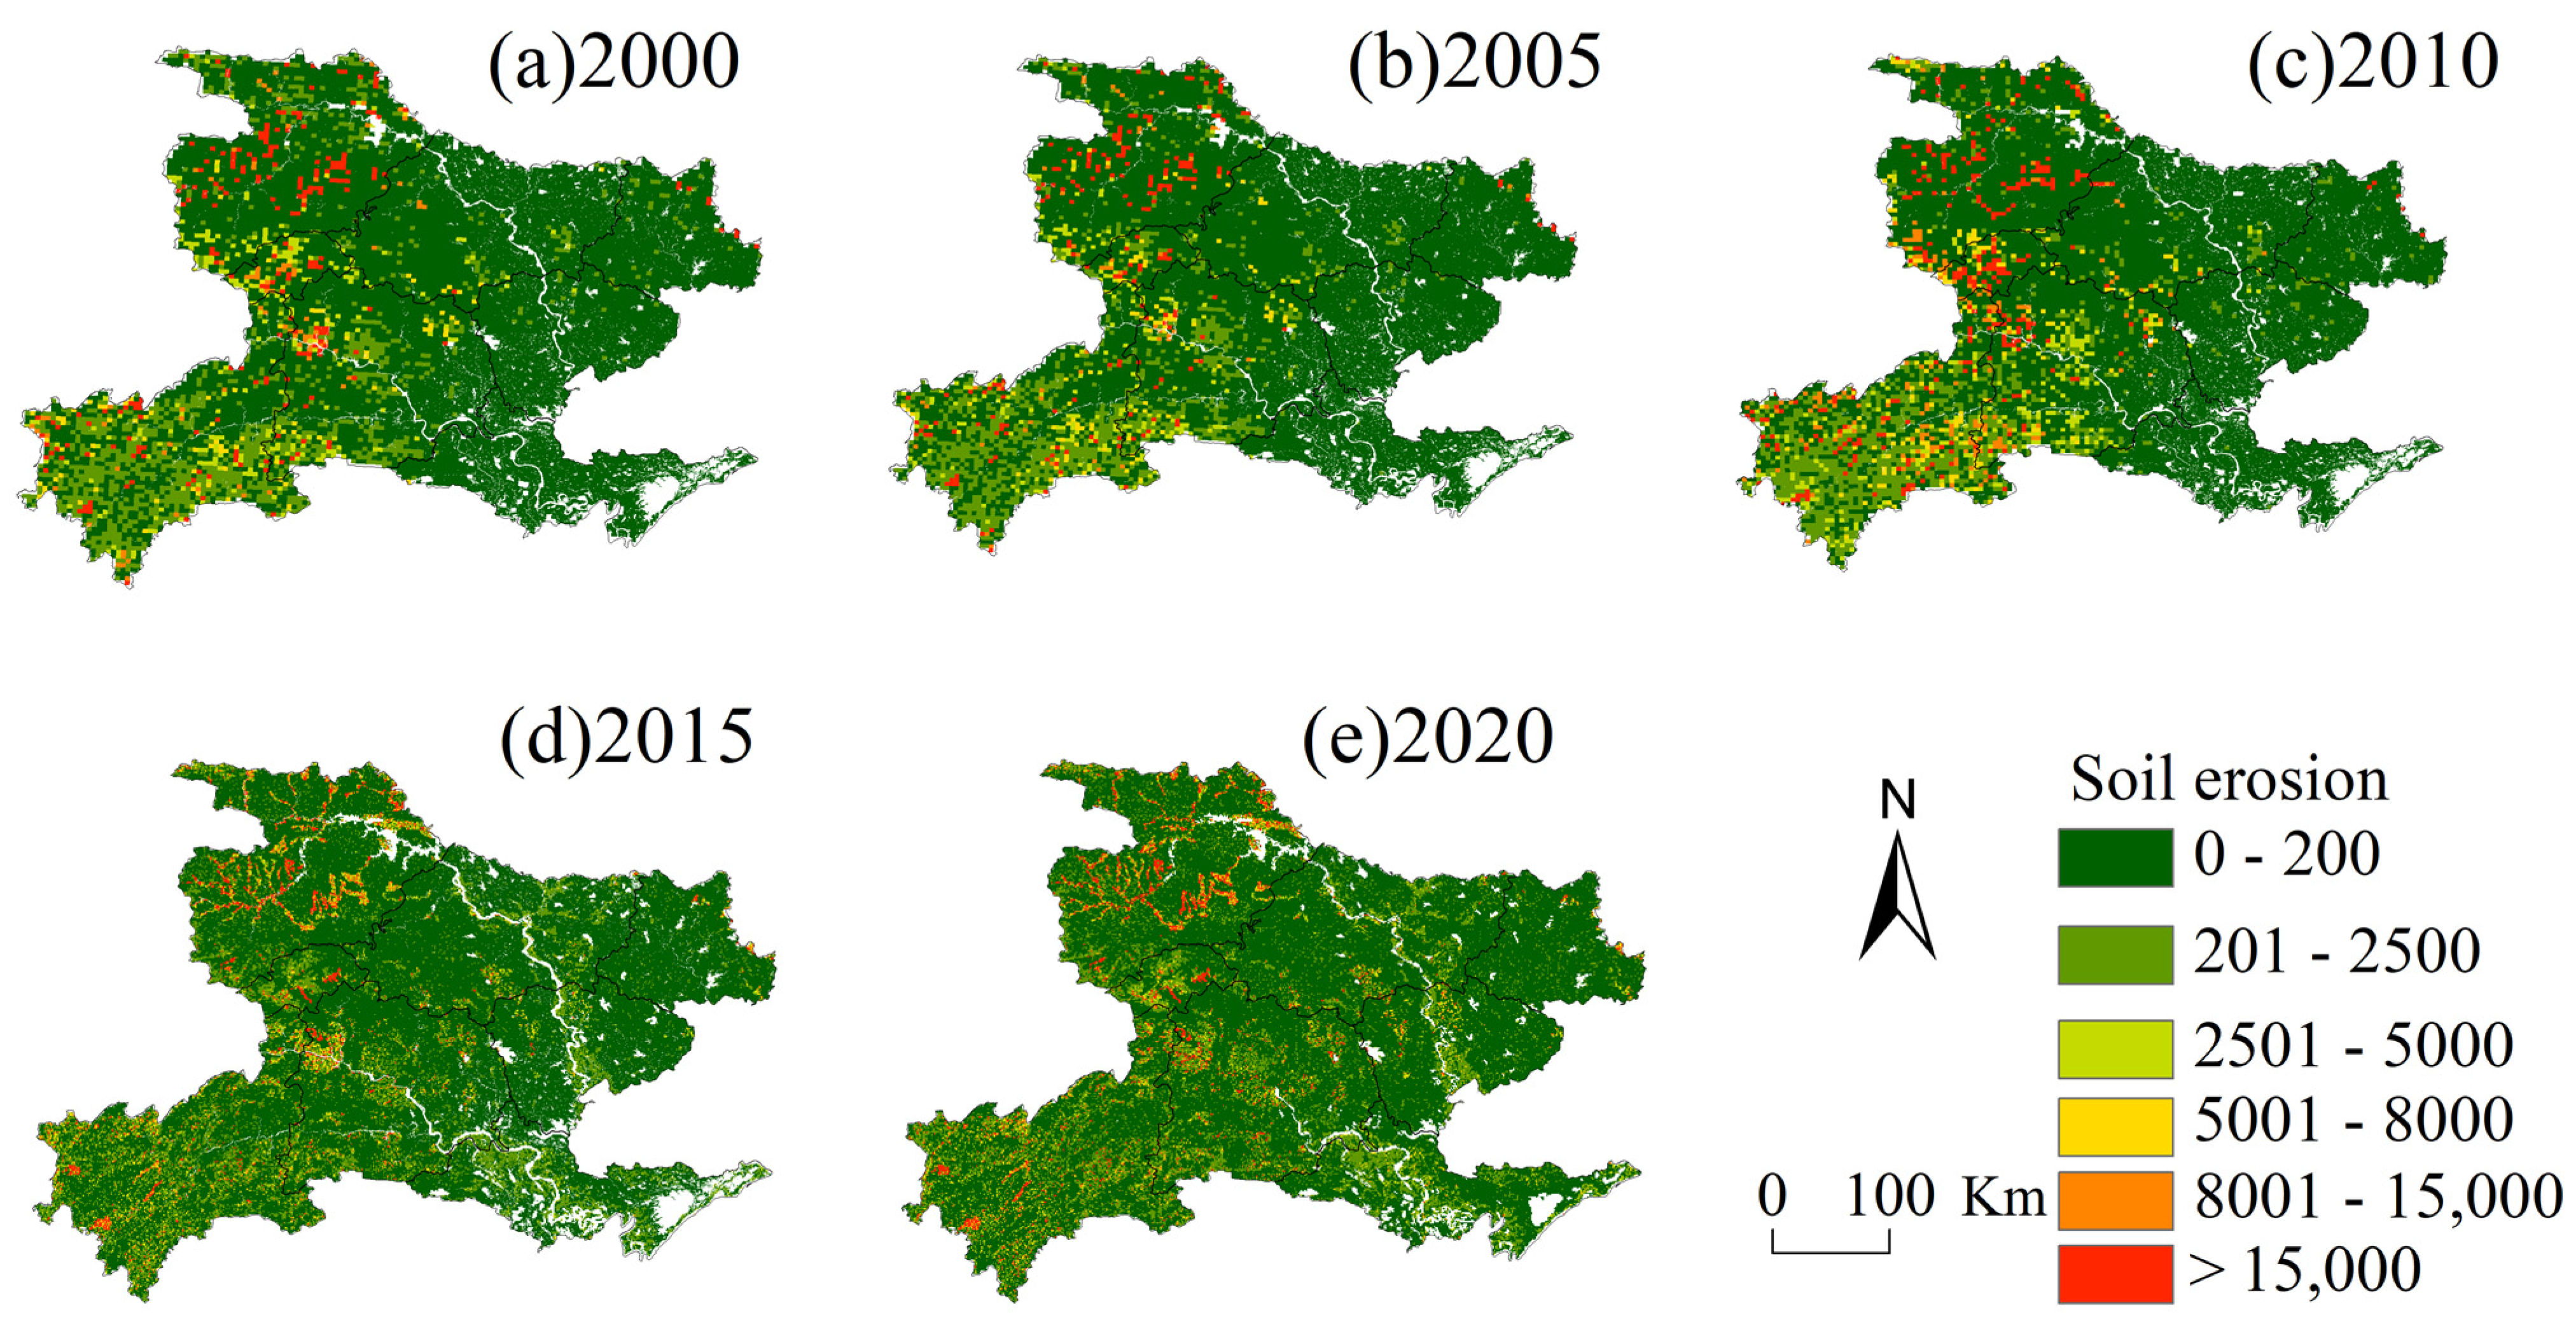
4.2. Soil Erosion Analysis
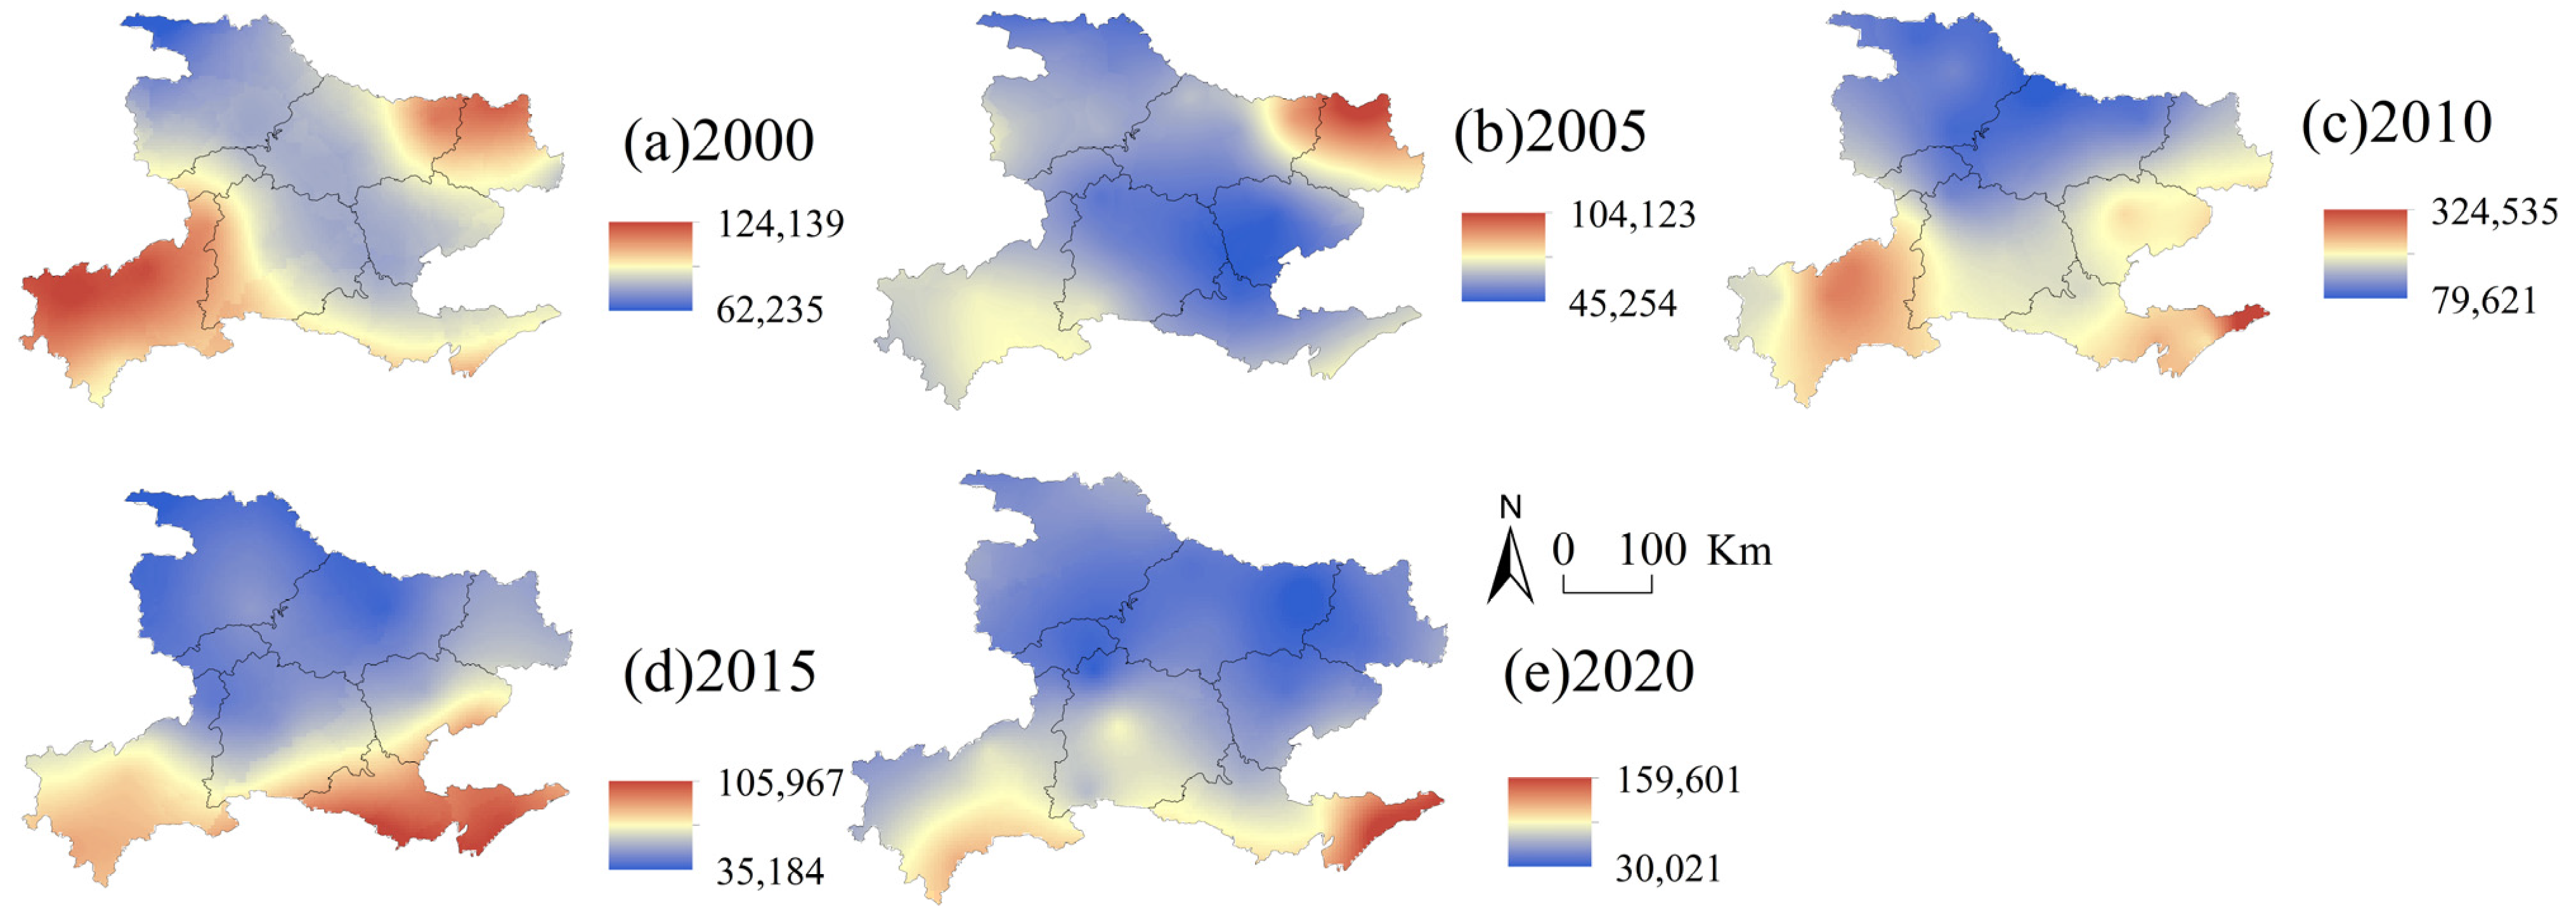
4.2.1. Spatial and Temporal Variation in Soil Erosion in Western Hubei Province
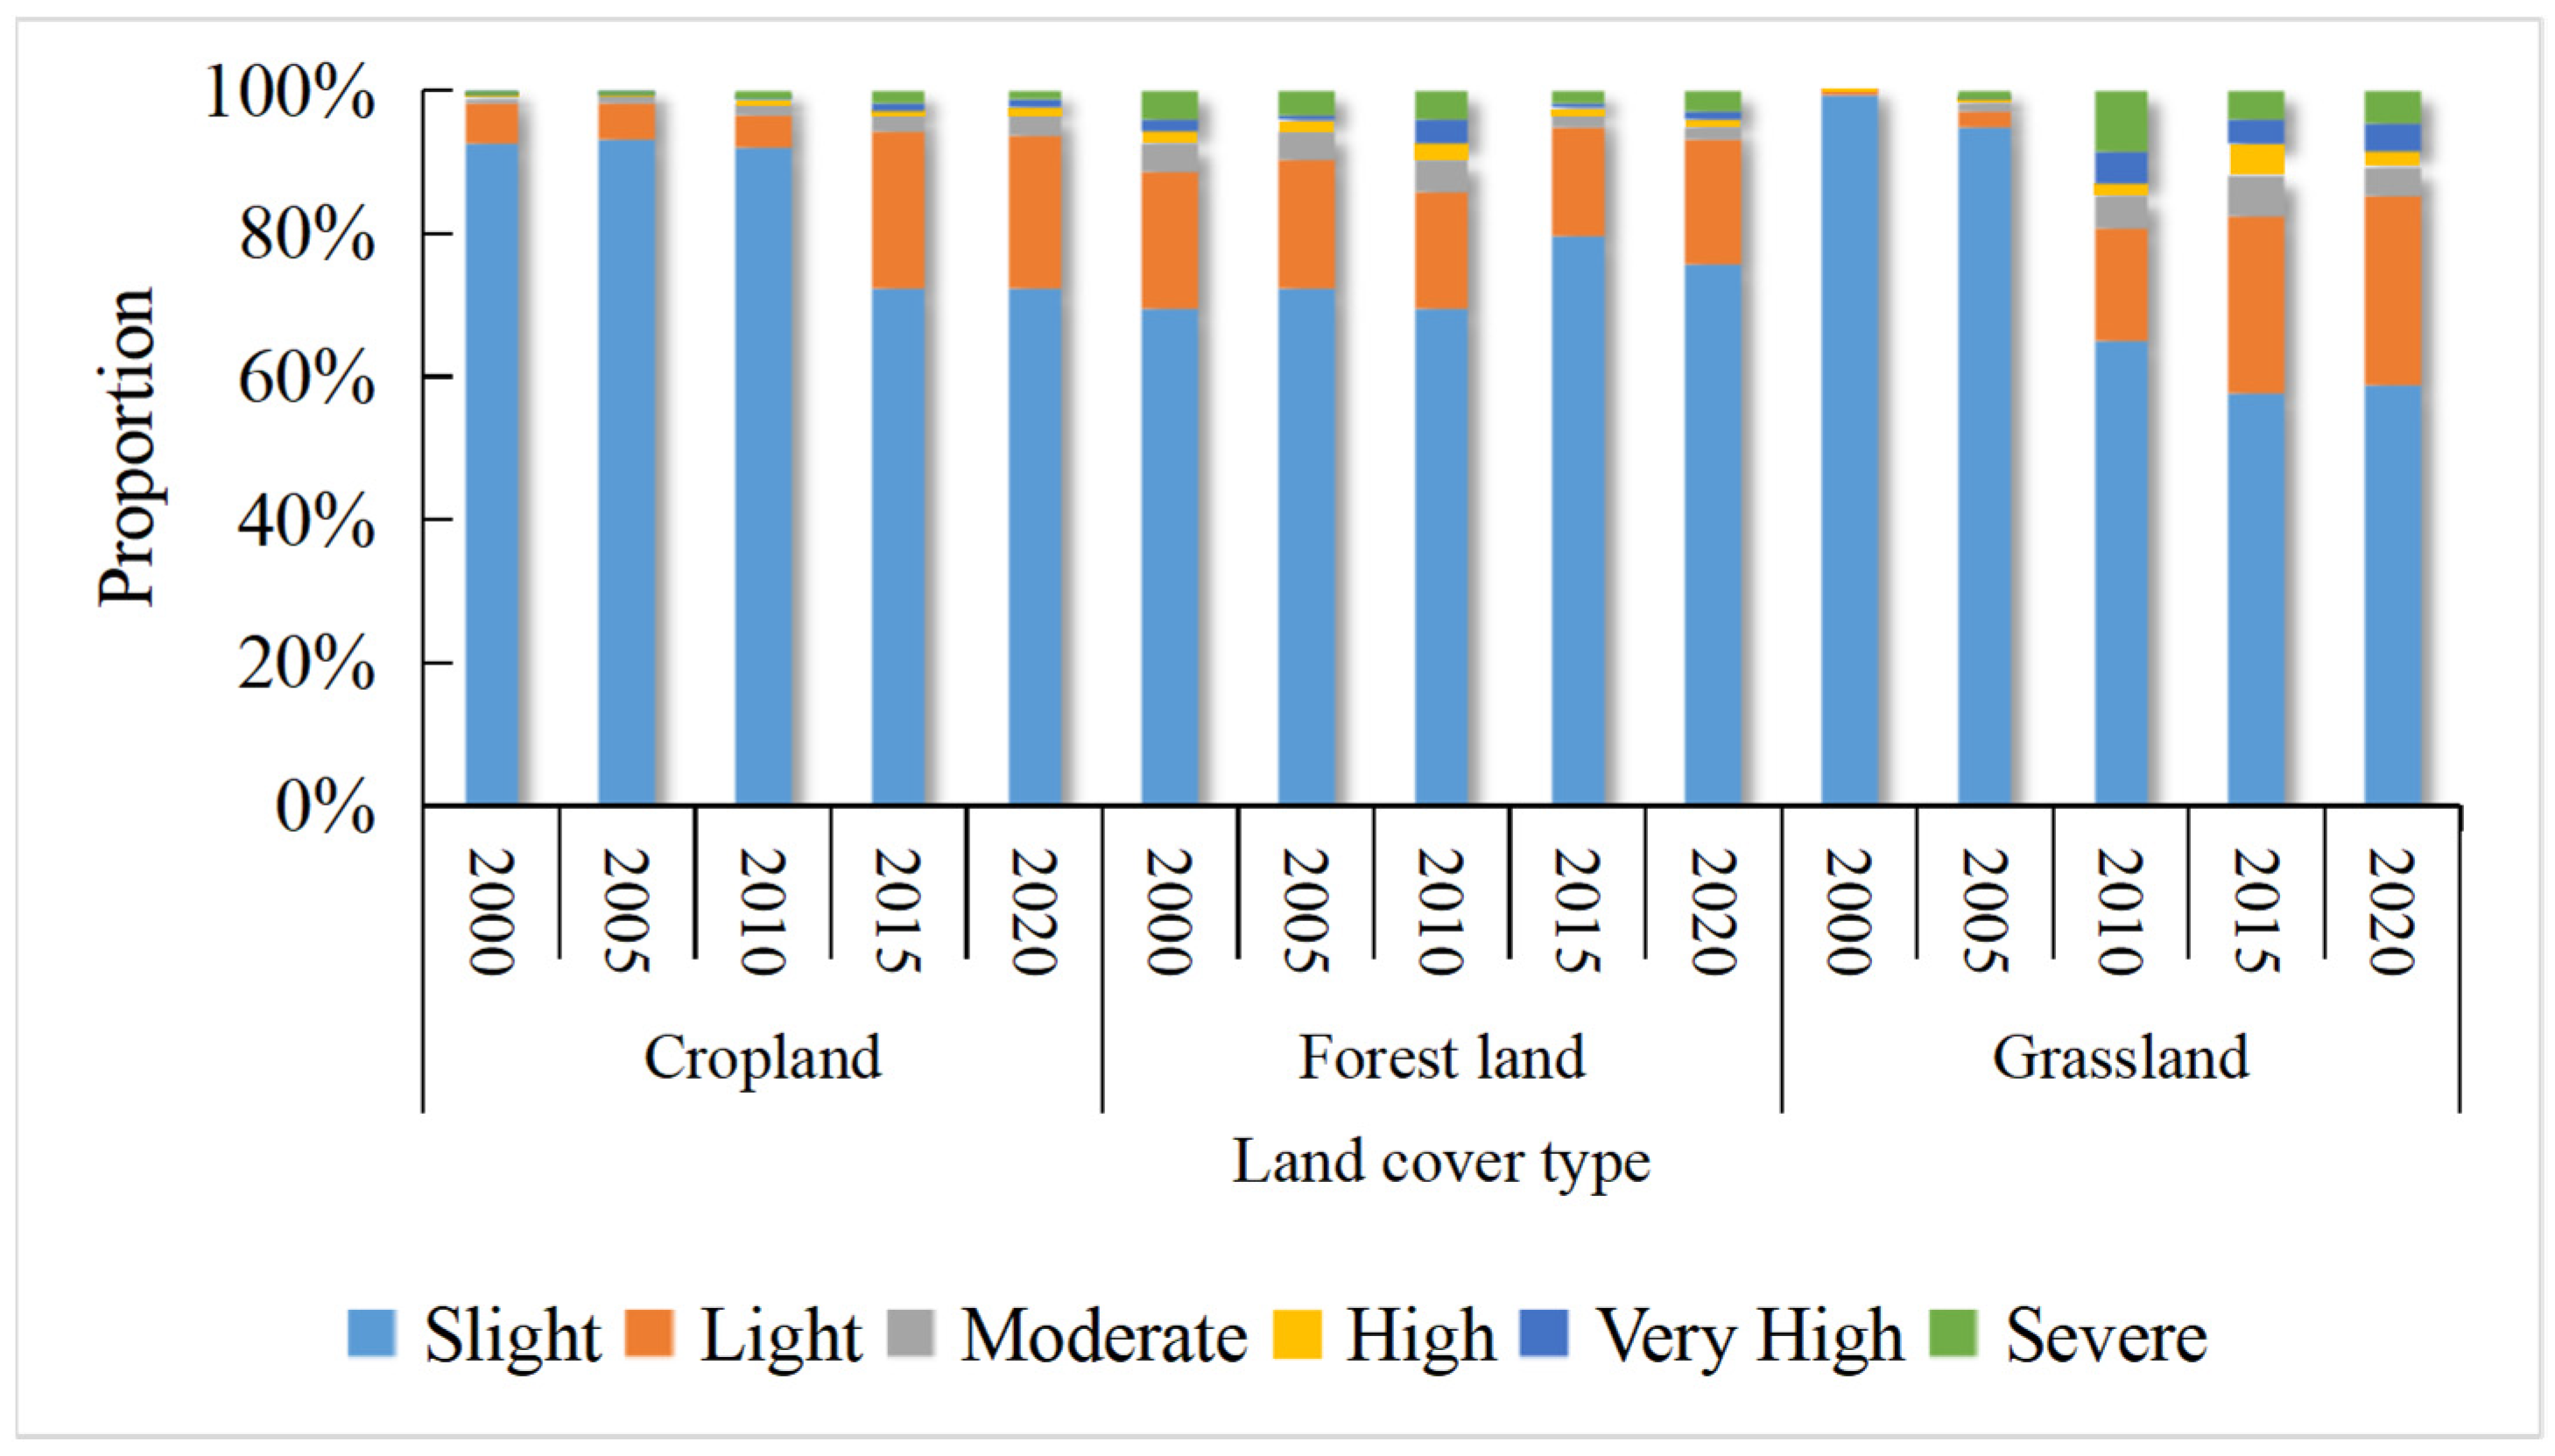
4.2.2. Land Cover and Soil Erosion
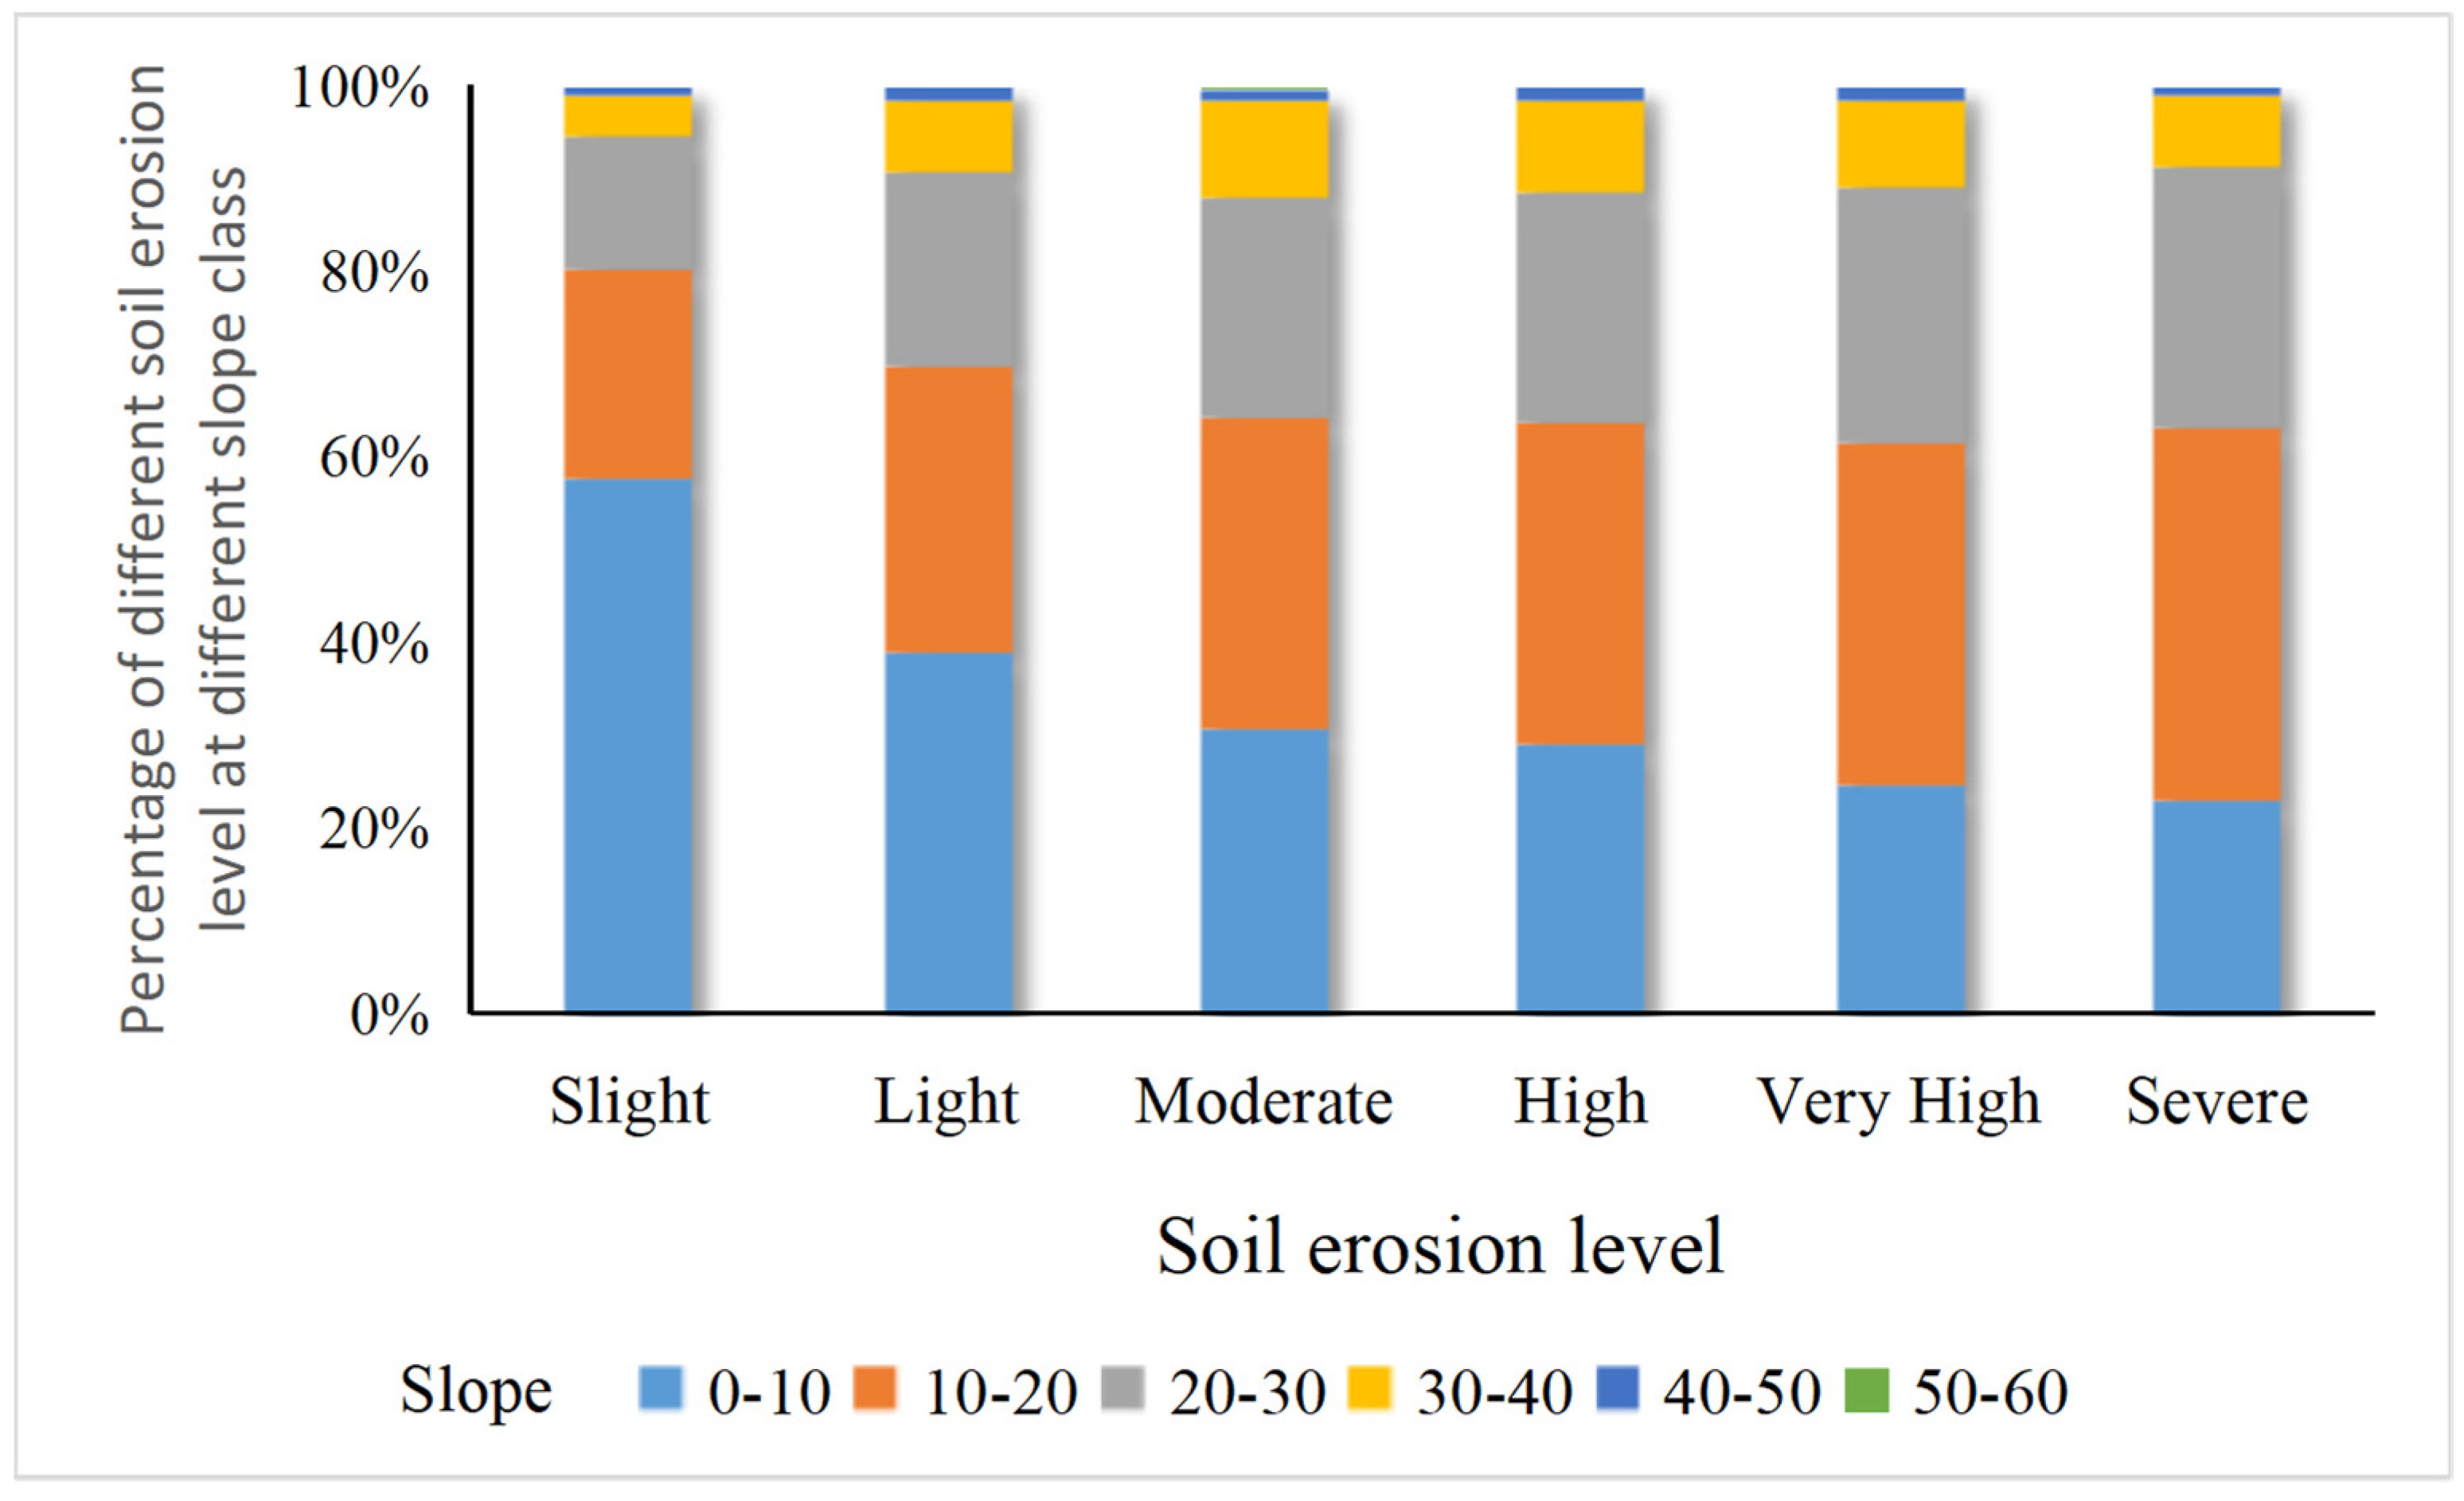
4.2.3. Soil Erosion Analysis at Different Slope Levels
4.3. Analysis of Landscape Patterns in Western Hubei Province
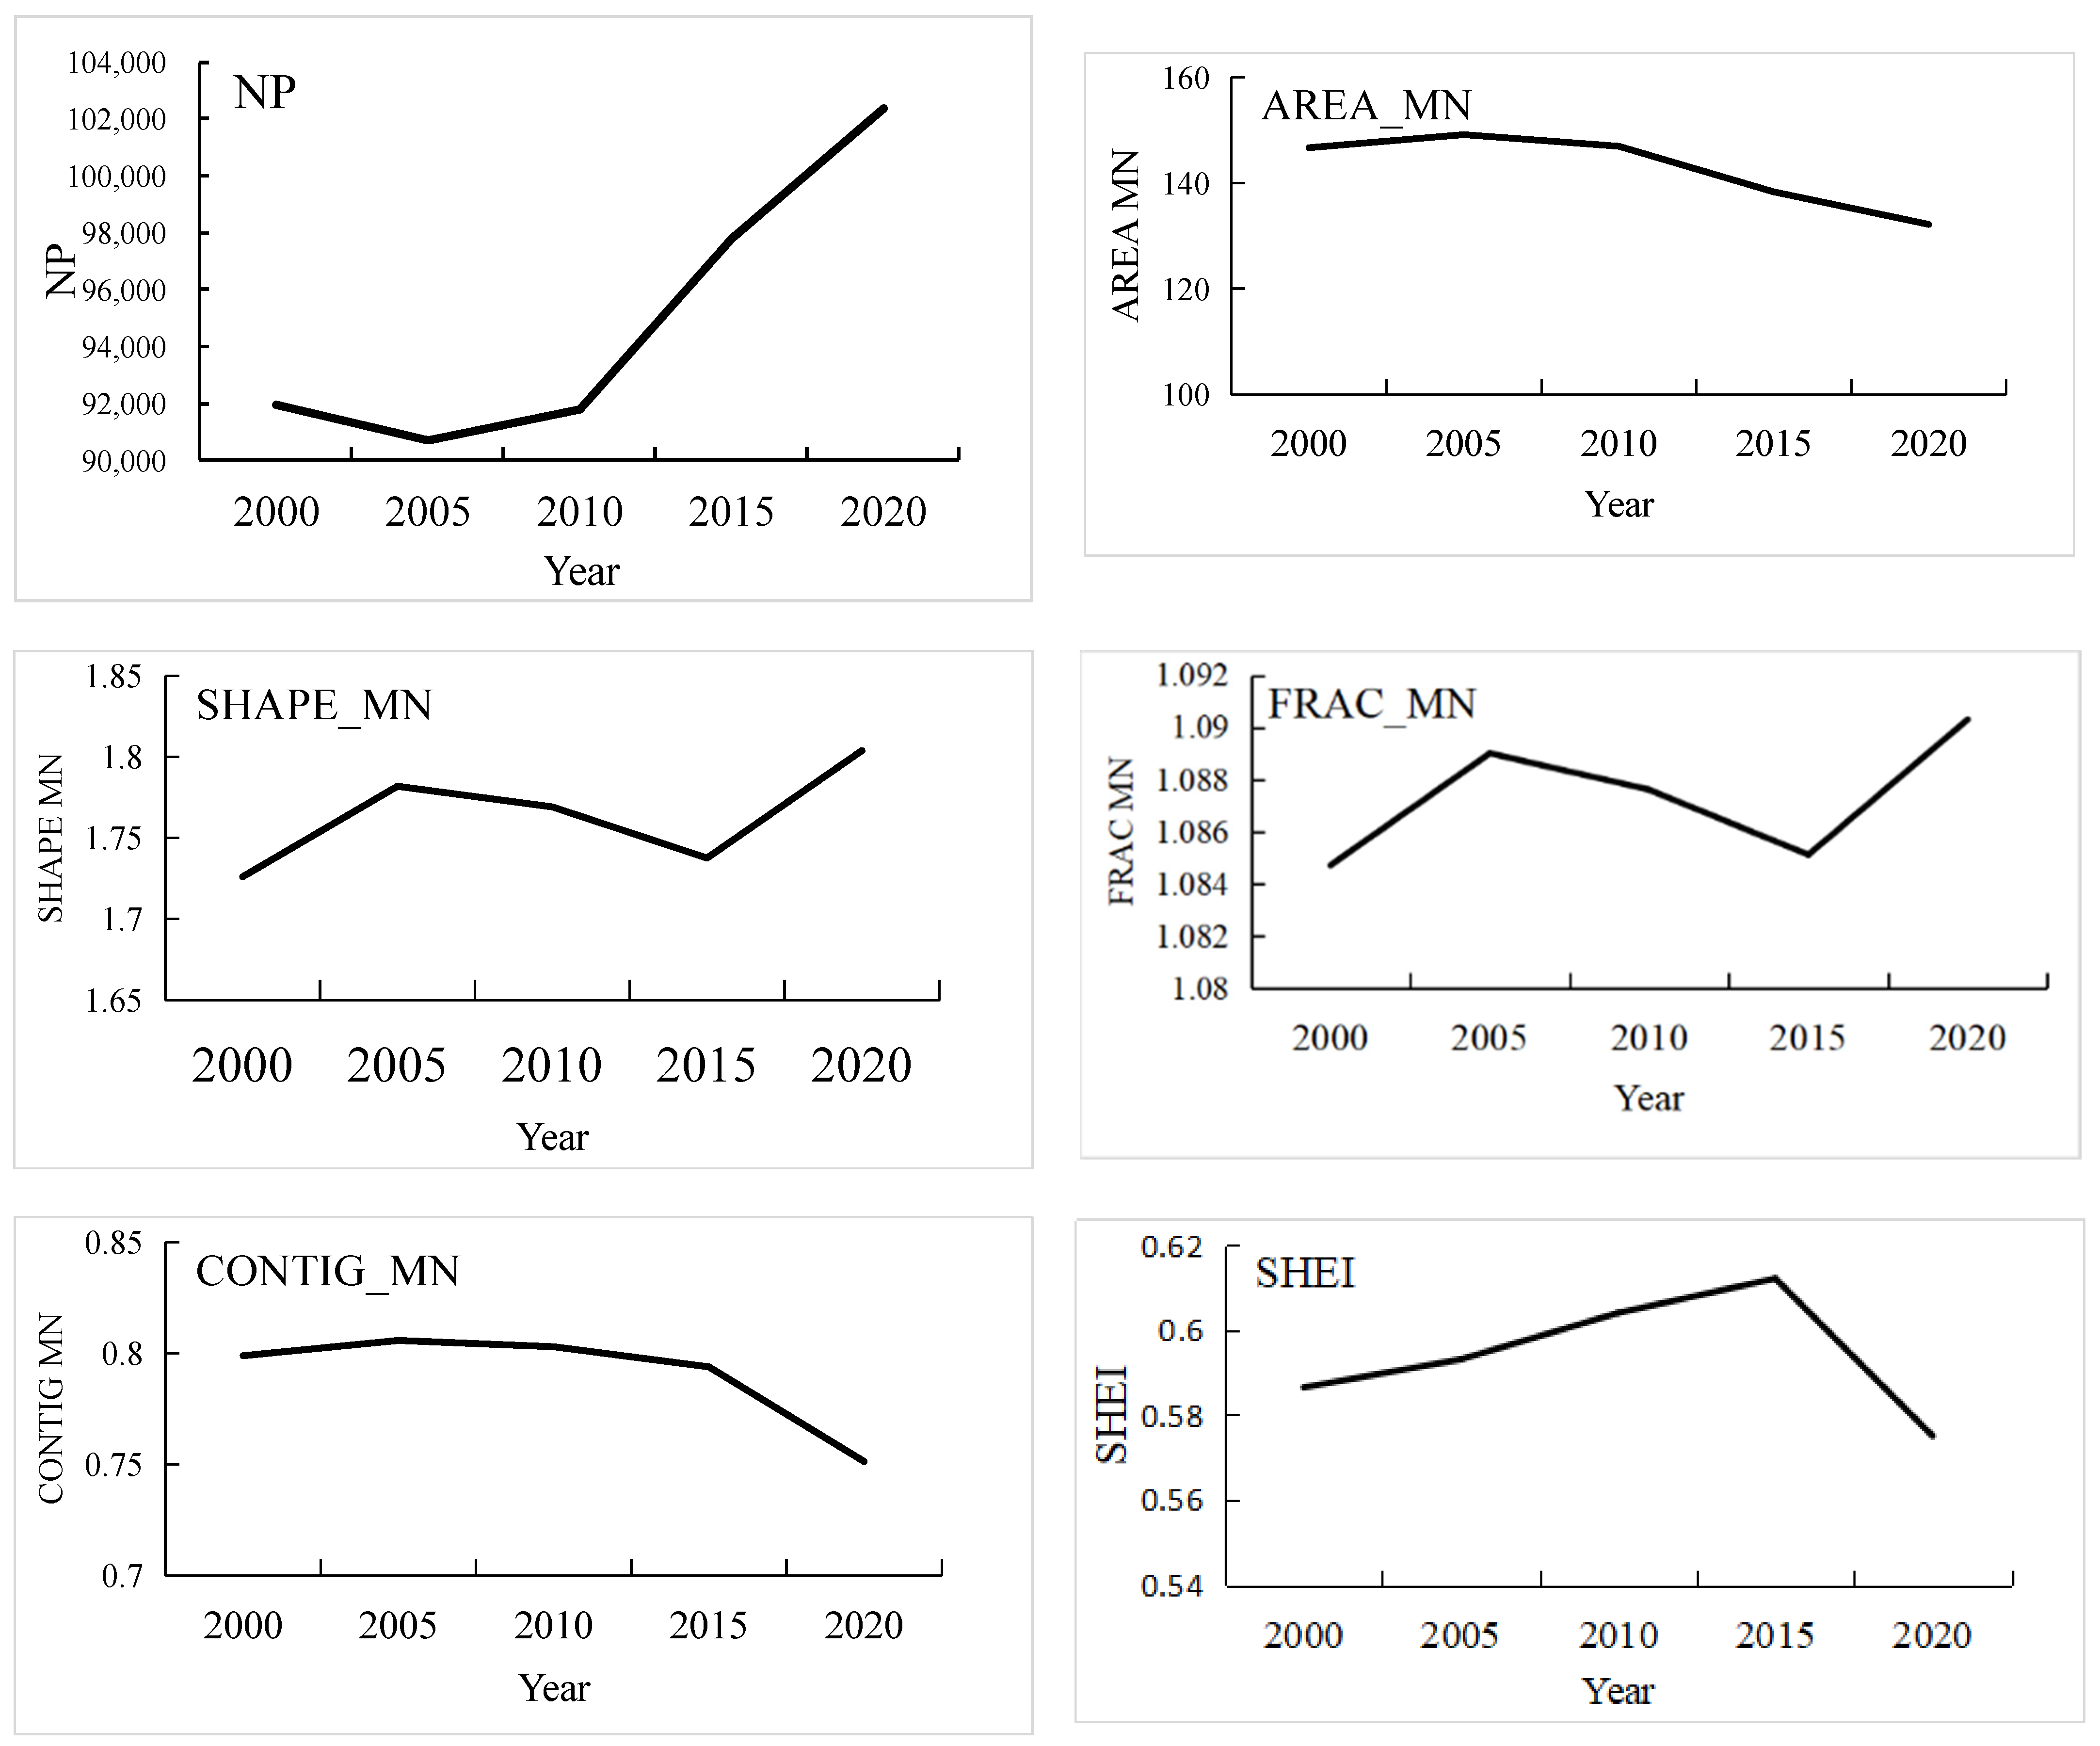
4.3.1. Landscape Pattern Index Analysis
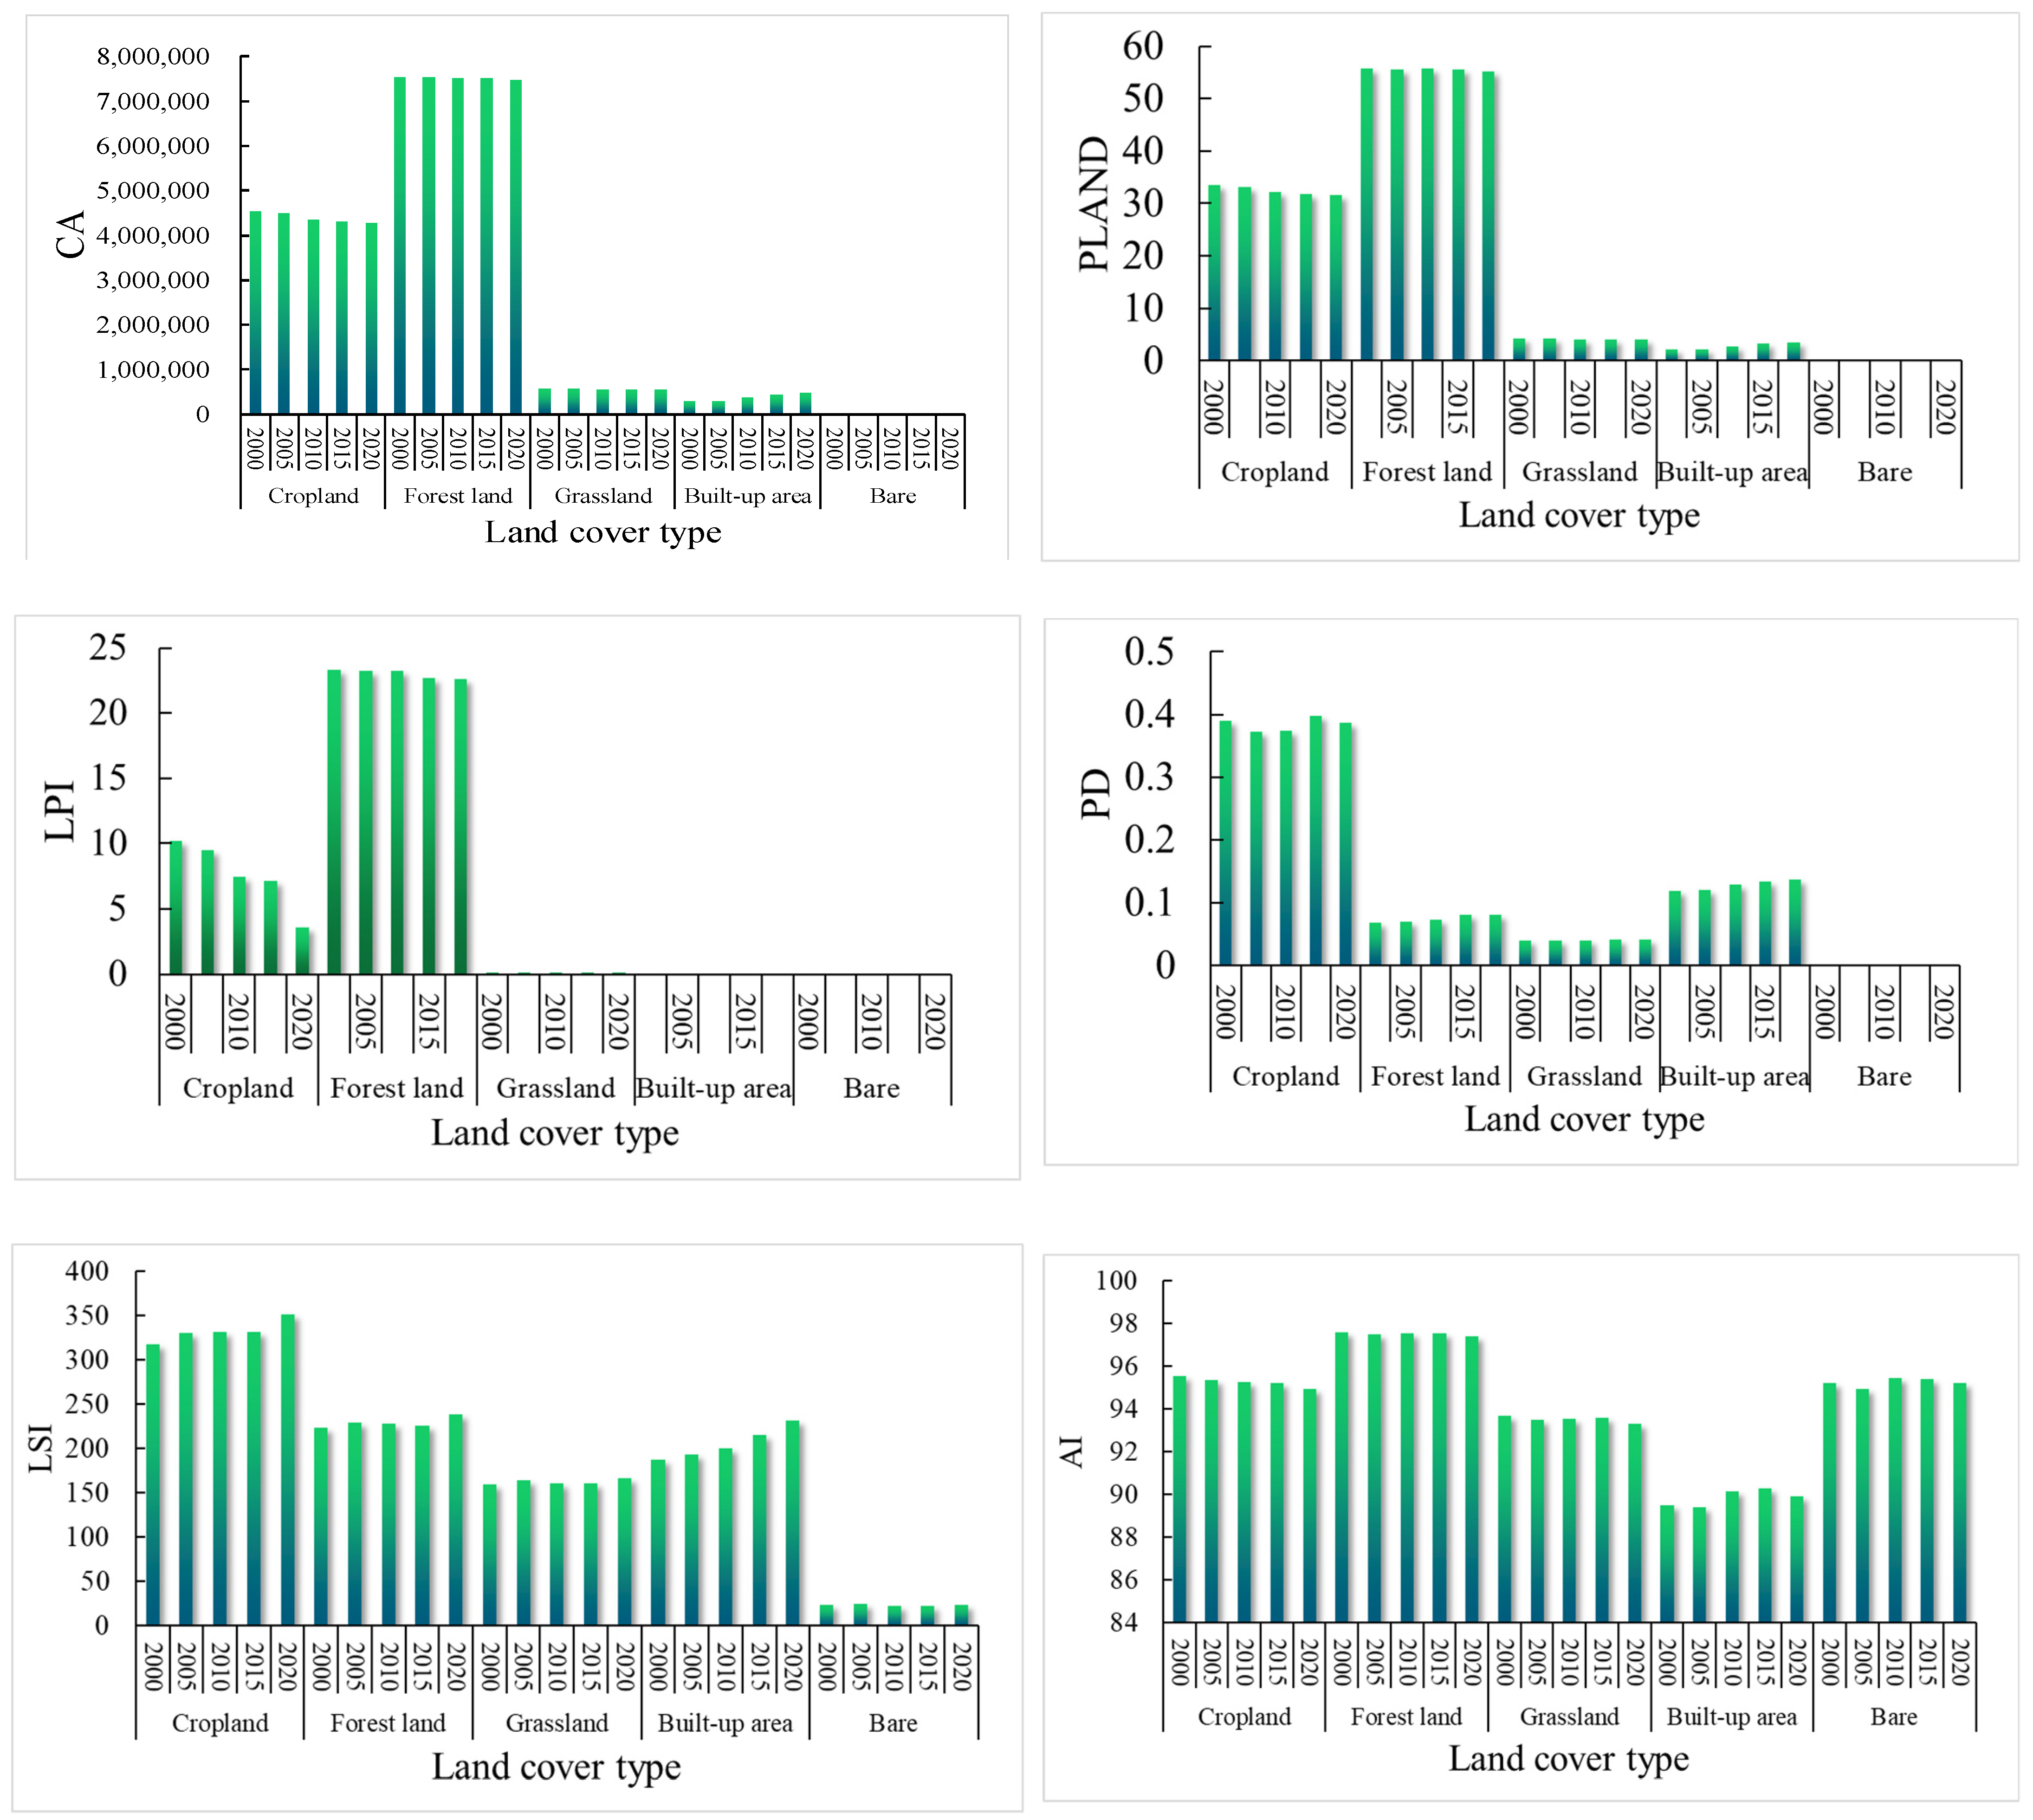
4.3.2. Landscape Pattern Index Analysis for Each Land Use Cover Type
5. Discussion
5.1. Possible Reasons for Soil Erosion Changes in Western Hubei
5.2. Comparison with Existing Research
5.3. Strengths and Limitations
6. Conclusions
Author Contributions
Funding
Institutional Review Board Statement
Informed Consent Statement
Data Availability Statement
Acknowledgments
Conflicts of Interest
Appendix A

| Metrics Groups | Index | Formula | Range | Comments | |
|---|---|---|---|---|---|
| Area and edge metrics | Class Area (CA) | aij = area (m2) of patch ij. | CA > 0, without limit. CA approaches 0 as the patch type becomes increasing rare in the landscape. CA = TA when the entire landscape consists of a single patch type; that is, when the entire image is comprised of a single patch. | Class area is a measure of landscape composition; specifically, how much of the landscape is comprised of a particular patch type. | |
| Percentage of Landscape (PLAND) | Pi = proportion of the landscape occupied by patch type (class) i. aij = area (m2) of patch ij. A = total landscape area (m2). | 0 < PLAND < 100 PLAND approaches 0 when the corresponding patch type (class) becomes increasingly rare in the landscape. PLAND = 100 when the entire landscape consists of a single patch type; that is, when the entire image is comprised of a single patch. | Percentage of landscape quantifies the proportional abundance of each patch type in the landscape. | ||
| Edge Density (ED) | eik = total length (m) of edge in landscape involving patch type (class) i; includes landscape boundary and background segments involving patch type i. A = total landscape area (m2). | ED ≥ 0, without limit. ED = 0 when there is no class edge in the landscape; that is, when the entire landscape and landscape border, if present, consists of the corresponding patch type and the user specifies that none of the landscape boundary and background edge be treated as edge. | Edge density is a measure of edge length of a particular patch type. ED perform better than Total Edge metric. | ||
| Largest Patch Index (LPI) | aij = area (m2) of patch ij. A = total landscape area (m2). | 0 < LPI < 100 LPI approaches 0 when the largest patch of the corresponding patch type is increasingly small. LPI = 100 when the largest patch comprises 100% of the landscape. | Largest patch index at the class level quantifies the percentage of total landscape area comprised by the largest patch. | ||
| AREA | aij = area (m2) of patch ij. | AREA ≥ 0 | Metrics based on the mean patch characteristic, such as Mean patch size (AREA_MN) or Mean patch shape index (SHAPE_MN), provide a measure of central tendency in the corresponding patch characteristic across the entire landscape. | ||
| Shape metrics | SHAPE | pij = perimeter (m) of patch ij. aij = area (m2) of patch ij. | SHAPE ≥ 1, without limit. SHAPE = 1 when the patch is square and increases without limit as patch shape becomes more irregular. SHAPE measures the complexity of patch shape compared to a standard shape (square) of the same size. | ||
| Contiguity Index (CONTIG) | Cijr = contiguity value for pixel r in patch ij. v = sum of the values in a 3-by-3 cell template (13 in this case). aij = area of patch ij in terms of number of cells. | 0 < CONTIG < 1 | Contiguity index assesses the spatial connectedness, or contiguity, of cells within a grid-cell patch to provide an index on patch boundary configuration and thus patch shape. | ||
| Fractal Dimension Index (FRAC) | pij = perimeter (m) of patch ij. aij = area (m) of patch ij. | 1 < FRAC < 2 FRAC approaches 1 for shapes with very simple perimeters such as squares, and approaches 2 for shapes with highly convoluted, plane-filling perimeters. | Fractal dimension index is appealing because it reflects shape complexity across a range of spatial scales (patch sizes). | ||
| Aggregation metrics | Aggregation Index (AI) | gii = number of like adjacencies (joins) between pixels of patch type (class) i based on the singlecount method. max-gii = maximum number of like adjacencies (joins) between pixels of patch type (class) i based on the single-count method. | 0 < AI < 100 Given any Pi, AI equals 0 when the focal patch type is maximally disaggregated; AI increases as the focal patch type is increasingly aggregated and equals 100 when the patch type is maximally aggregated into a single, compact patch. | ||
| Landscape Shape Index (LSI) | = total length (m) of edge in landscape between patch types(classes) i and k; includes the entire landscape boundary and some or all background edge segments involving class i. A = total landscape area (m). | LSI > 1, without limit. LSI = 1 when the landscape consists of a single square patch of the corresponding type; LSI increases without limit as landscape shape becomes more irregular. | The Landscape shape index (LSI) index measures the perimeter-to area ratio for the landscape as a whole. The greater the value of LSI, the more dispersed are the patch types. | ||
| Contagion (CONTAG) | Pi = proportion of the landscape occupied by patch type (class) i. gik = number of adjacencies (joins) between pixels of patch types (classes) i and k based on the double-count method. m = number of patch types (classes) present in the landscape, including the landscape border if present. | CONTAG approaches 0 when the patch types are maximally disaggregated and interspersed. CONTAG = 100 when all patch types are maximally aggregated. | |||
| Number of Patches (NP) | N = total number of patches in the landscape. | NP > 1, without limit. NP = 1 when the landscape contains only 1 patch. | Number of patches often has limited interpretive value by itself because it conveys no information about area, distribution, or density of patches. | ||
| Patch Density (PD) | N = total number of patches in the landscape. A = total landscape area (m2). | PD > 0, constrained by cell size. | Patch density has the same basic utility as number of patches as an index, except that it expresses number of patches on a per unit area basis that facilitates comparisons among landscapes of varying size. | ||
| Diversity metrics | Shannon’s Diversity Index (SHDI) | Pi = proportion of the landscape occupied by patch type (class) i. | SHDI > 0, without limit SHDI = 0 when the landscape contains only 1 patch (i.e., no diversity). | Shannon’s diversity index is a popular measure of diversity in community ecology, applied here to landscapes. Shannon’s index is more sensitive to rare patch types than Simpson’s diversity index. | |
| Shannon’s Evenness Index (SHEI) | Pi= proportion of the landscape occupied by patch type (class) i. m = number of patch types (classes) present in the landscape, excluding the landscape border if present. | 0 ≤ PLAND ≤ 100 | Shannon’s evenness index is expressed such that an even distribution of area among patch types results in maximum evenness. | ||
| CA | PLAND | LPI | PD | ED | LSI | AI | ||
|---|---|---|---|---|---|---|---|---|
| Cropland | 2000 | 4,521,294 | 33.5139 | 10.185 | 0.3903 | 19.9131 | 317.138 | 95.5389 |
| 2005 | 4,479,107 | 33.1142 | 9.4578 | 0.373 | 20.5887 | 330.249 | 95.332 | |
| 2010 | 4,345,691 | 32.2123 | 7.4388 | 0.3737 | 20.4054 | 331.397 | 95.2444 | |
| 2015 | 4,305,303 | 31.8294 | 7.1532 | 0.3974 | 20.2421 | 331.096 | 95.2266 | |
| 2020 | 4,273,271 | 31.5771 | 3.5793 | 0.3859 | 21.4548 | 351.825 | 94.9076 | |
| Forest land | 2000 | 7,522,174 | 55.7578 | 23.3248 | 0.0688 | 18.0137 | 223.423 | 97.5667 |
| 2005 | 7,525,235 | 55.6343 | 23.2101 | 0.0695 | 18.4972 | 229.705 | 97.4985 | |
| 2010 | 7,510,385 | 55.6704 | 23.2349 | 0.0722 | 18.3296 | 227.517 | 97.5199 | |
| 2015 | 7,504,276 | 55.4797 | 22.6986 | 0.0809 | 18.1418 | 225.682 | 97.5391 | |
| 2020 | 7,476,049 | 55.2438 | 22.618 | 0.0809 | 19.2024 | 238.594 | 97.3927 | |
| Grassland | 2000 | 563,287 | 4.1753 | 0.1258 | 0.0402 | 3.5096 | 159.475 | 93.6622 |
| 2005 | 567,447 | 4.1952 | 0.1245 | 0.04 | 3.6098 | 163.97 | 93.507 | |
| 2010 | 552,914 | 4.0985 | 0.1091 | 0.0393 | 3.5068 | 160.654 | 93.5551 | |
| 2015 | 555,256 | 4.105 | 0.103 | 0.0416 | 3.4987 | 160.553 | 93.5734 | |
| 2020 | 548,622 | 4.054 | 0.1047 | 0.0406 | 3.6392 | 166.92 | 93.277 | |
| Built-up area | 2000 | 285,397 | 2.1155 | 0.024 | 0.1193 | 2.9705 | 187.701 | 89.5083 |
| 2005 | 296,981 | 2.1956 | 0.0253 | 0.1207 | 3.1102 | 193.191 | 89.4113 | |
| 2010 | 366,518 | 2.7168 | 0.0463 | 0.1276 | 3.5906 | 200.237 | 90.1199 | |
| 2015 | 437,021 | 3.2309 | 0.0737 | 0.1331 | 4.2058 | 215.339 | 90.267 | |
| 2020 | 468,242 | 3.46 | 0.0794 | 0.1356 | 4.6674 | 230.916 | 89.9154 | |
| Bare | 2000 | 19,756.2 | 0.1464 | 0.0208 | 0.0013 | 0.0946 | 23.4168 | 95.2003 |
| 2005 | 19,816.8 | 0.1465 | 0.0207 | 0.0014 | 0.0996 | 24.7945 | 94.9155 | |
| 2010 | 19,717.5 | 0.1462 | 0.0207 | 0.0011 | 0.0903 | 22.3863 | 95.4168 | |
| 2015 | 19,894.1 | 0.1471 | 0.0208 | 0.0012 | 0.0899 | 22.5558 | 95.402 | |
| 2020 | 19,284.5 | 0.1425 | 0.016 | 0.0012 | 0.0923 | 23.0756 | 95.2196 |
References
- Poesen, J. Soil Erosion in the Anthropocene: Research Needs. Earth Surf. Process. Landf. 2018, 43, 64–84. [Google Scholar] [CrossRef]
- Amundson, R.; Berhe, A.A.; Hopmans, J.W.; Olson, C.; Sztein, A.E.; Sparks, D.L. Soil and Human Security in the 21st Century. Science 2015, 348, 1261071. [Google Scholar] [CrossRef] [PubMed] [Green Version]
- Wuepper, D.; Borrelli, P.; Finger, R. Countries and the Global Rate of Soil Erosion. Nat. Sustain. 2020, 3, 51–55. [Google Scholar] [CrossRef]
- Borrelli, P.; Robinson, D.A.; Panagos, P.; Lugato, E.; Yang, J.E.; Alewell, C.; Wuepper, D.; Montanarella, L.; Ballabio, C. Land Use and Climate Change Impacts on Global Soil Erosion by Water (2015–2070). Proc. Natl. Acad. Sci. USA 2020, 117, 21994–22001. [Google Scholar] [CrossRef]
- Boardman, J. Soil Erosion Science: Reflections on the Limitations of Current Approaches. Catena 2006, 68, 73–86. [Google Scholar] [CrossRef]
- Panagos, P.; Katsoyiannis, A. Soil Erosion Modelling: The New Challenges as the Result of Policy Developments in Europe. Environ. Res. 2019, 172, 470–474. [Google Scholar] [CrossRef]
- Prosdocimi, M.; Tarolli, P.; Cerda, A. Mulching Practices for Reducing Soil Water Erosion: A Review. EARTH-Sci. Rev. 2016, 161, 191–203. [Google Scholar] [CrossRef]
- Ding, Y.; Liu, Y.; Liu, S.; Li, Z.; Tan, X.; Huang, X.; Zeng, G.; Zhou, L.; Zheng, B. Biochar to Improve Soil Fertility. A Review. Agron. Sustain. Dev. 2016, 36, 36. [Google Scholar] [CrossRef] [Green Version]
- Meyer, L.D.; Wischmeier, W.H. Mathematical Simulation of the Process of Soil Erosion by Water. Trans. ASAE 1969, 12, 754–0758. [Google Scholar]
- Gholami, V.; Sahour, H.; Hadian Amri, M.A. Soil Erosion Modeling Using Erosion Pins and Artificial Neural Networks. CATENA 2021, 196, 104902. [Google Scholar] [CrossRef]
- De Vente, J.; Poesen, J. Predicting Soil Erosion and Sediment Yield at the Basin Scale: Scale Issues and Semi-Quantitative Models. Earth-Sci. Rev. 2005, 71, 95–125. [Google Scholar] [CrossRef]
- Batista, P.V.G.; Davies, J.; Silva, M.L.N.; Quinton, J.N. On the Evaluation of Soil Erosion Models: Are We Doing Enough? Earth-Sci. Rev. 2019, 197, 102898. [Google Scholar] [CrossRef]
- Alewell, C.; Borrelli, P.; Meusburger, K.; Panagos, P. Using the USLE: Chances, Challenges and Limitations of Soil Erosion Modelling. Int. Soil Water Conserv. Res. 2019, 7, 203–225. [Google Scholar] [CrossRef]
- Benavidez, R.; Jackson, B.; Maxwell, D.; Norton, K. A Review of the (Revised) Universal Soil Loss Equation ((R)USLE): With a View to Increasing Its Global Applicability and Improving Soil Loss Estimates. Hydrol. Earth Syst. Sci. 2018, 22, 6059–6086. [Google Scholar] [CrossRef] [Green Version]
- Borrelli, P.; Alewell, C.; Alvarez, P.; Anache, J.A.A.; Baartman, J.; Ballabio, C.; Bezak, N.; Biddoccu, M.; Cerdà, A.; Chalise, D.; et al. Soil Erosion Modelling: A Global Review and Statistical Analysis. Sci. Total Environ. 2021, 780, 146494. [Google Scholar] [CrossRef]
- Ghosal, K.; Bhattacharya, S.D. A Review of RUSLE Model. J. Indian Soc. Remote Sens. 2020, 48, 689–707. [Google Scholar] [CrossRef]
- Fang, J.; Yu, G.; Liu, L.; Hu, S.; Chapin, F.S. Climate Change, Human Impacts, and Carbon Sequestration in China. Proc. Natl. Acad. Sci. USA 2018, 115, 4015–4020. [Google Scholar] [CrossRef] [Green Version]
- Borrelli, P.; Robinson, D.A.; Fleischer, L.R.; Lugato, E.; Ballabio, C.; Alewell, C.; Meusburger, K.; Modugno, S.; Schuett, B.; Ferro, V.; et al. An Assessment of the Global Impact of 21st Century Land Use Change on Soil Erosion. Nat. Commun. 2017, 8, 2013. [Google Scholar] [CrossRef] [Green Version]
- Liu, B.; Zhang, K.; Yun, X. An Empirical Soil Loss Equation. In Proceedings of the 12th ISCO Conference, Beijing, China, 26–31 May 2002. [Google Scholar]
- Li, A.; Zhang, X.C.; Liu, B. Effects of DEM Resolutions on Soil Erosion Prediction Using Chinese Soil Loss Equation. Geomorphology 2021, 384, 107706. [Google Scholar] [CrossRef]
- Liu, J.; Liu, H. Soil Erosion Changes during the Last 30 Years and Contributions of Gully Erosion to Sediment Yield in a Small Catchment, Southern China. Geomorphology 2020, 368, 107357. [Google Scholar] [CrossRef]
- Chu, L.; Sun, T.; Wang, T.; Li, Z.; Cai, C. Temporal and Spatial Heterogeneity of Soil Erosion and a Quantitative Analysis of Its Determinants in the Three Gorges Reservoir Area, China. Int. J. Environ. Res. Public Health 2020, 17, 8486. [Google Scholar] [CrossRef] [PubMed]
- Huang, C.; Yang, Q.; Cao, X.; Li, Y. Assessment of the Soil Erosion Response to Land Use and Slope in the Loess Plateau—A Case Study of Jiuyuangou. Water 2020, 12, 529. [Google Scholar] [CrossRef] [Green Version]
- Foster, D.R.; Knight, D.H.; Franklin, J.F. Landscape Patterns and Legacies Resulting from Large, Infrequent Forest Disturbances. Ecosystems 1998, 1, 497–510. [Google Scholar] [CrossRef]
- Yohannes, H.; Soromessa, T.; Argaw, M.; Dewan, A. Impact of Landscape Pattern Changes on Hydrological Ecosystem Services in the Beressa Watershed of the Blue Nile Basin in Ethiopia. Sci. Total Environ. 2021, 793, 148559. [Google Scholar] [CrossRef] [PubMed]
- Ouyang, W.; Skidmore, A.K.; Hao, F.; Wang, T. Soil Erosion Dynamics Response to Landscape Pattern. Sci. Total Environ. 2010, 408, 1358–1366. [Google Scholar] [CrossRef] [PubMed]
- Bakker, M.M.; Govers, G.; van Doorn, A.; Quetier, F.; Chouvardas, D.; Rounsevell, M. The Response of Soil Erosion and Sediment Export to Land-Use Change in Four Areas of Europe: The Importance of Landscape Pattern. Hum. Clim. Impacts Fluv. Hillslope Morphol. 2008, 98, 213–226. [Google Scholar] [CrossRef]
- García-Ruiz, J.M. The Effects of Land Uses on Soil Erosion in Spain: A Review. CATENA 2010, 81, 1–11. [Google Scholar] [CrossRef]
- Devátý, J.; Dostál, T.; Hösl, R.; Krása, J.; Strauss, P. Effects of Historical Land Use and Land Pattern Changes on Soil Erosion—Case Studies from Lower Austria and Central Bohemia. Land Use Policy 2019, 82, 674–685. [Google Scholar] [CrossRef]
- OECD; European Commission. Policy Brief on Making the Most of the Social Economy’s Contribution to the Circular Economy; OECD Publishing: Paris, France, 2022; ISBN 20794797. [Google Scholar]
- Berihun, M.L.; Tsunekawa, A.; Haregeweyn, N.; Dile, Y.T.; Tsubo, M.; Fenta, A.A.; Meshesha, D.T.; Ebabu, K.; Sultan, D.; Srinivasan, R. Evaluating Runoff and Sediment Responses to Soil and Water Conservation Practices by Employing Alternative Modeling Approaches. Sci. Total Environ. 2020, 747, 141118. [Google Scholar] [CrossRef] [PubMed]
- Belachew, A.; Mekuria, W.; Nachimuthu, K. Factors Influencing Adoption of Soil and Water Conservation Practices in the Northwest Ethiopian Highlands. Int. Soil Water Conserv. Res. 2020, 8, 80–89. [Google Scholar] [CrossRef]
- Jiang, C.; Zhang, H.; Wang, X.; Feng, Y.; Labzovskii, L. Challenging the Land Degradation in China’s Loess Plateau: Benefits, Limitations, Sustainability, and Adaptive Strategies of Soil and Water Conservation. Ecol. Eng. 2019, 127, 135–150. [Google Scholar] [CrossRef]
- Aneseyee, A.B.; Elias, E.; Soromessa, T.; Feyisa, G.L. Land Use/Land Cover Change Effect on Soil Erosion and Sediment Delivery in the Winike Watershed, Omo Gibe Basin, Ethiopia. Sci. Total Environ. 2020, 728, 138776. [Google Scholar] [CrossRef] [PubMed]
- Chen, Z.; Wang, L.; Wei, A.; Gao, J.; Lu, Y.; Zhou, J. Land-Use Change from Arable Lands to Orchards Reduced Soil Erosion and Increased Nutrient Loss in a Small Catchment. Sci. Total Environ. 2019, 648, 1097–1104. [Google Scholar] [CrossRef] [PubMed]
- Jiu, J.; Wu, H.; Li, S. The Implication of Land-Use/Land-Cover Change for the Declining Soil Erosion Risk in the Three Gorges Reservoir Region, China. Int. J. Environ. Res. Public. Health 2019, 16, 1856. [Google Scholar] [CrossRef] [Green Version]
- Saravanan, S.; Jennifer, J.J.; Singh, L.; Thiyagarajan, S.; Sankaralingam, S. Impact of Land-Use Change on Soil Erosion in the Coonoor Watershed, Nilgiris Mountain Range, Tamil Nadu, India. Arab. J. Geosci. 2021, 14, 407. [Google Scholar] [CrossRef]
- Van Oost, K.; Govers, G.; Desmet, P. Evaluating the Effects of Changes in Landscape Structure on Soil Erosion by Water and Tillage. Landsc. Ecol. 2000, 15, 577–589. [Google Scholar] [CrossRef]
- Department of Water Resources in Hubei Province. Hubei Soil and Water Conservation Bulletin; Department of Water Resources in Hubei Province: Wuhan, China, 2019. [Google Scholar]
- Deng, L.; Kim, D.-G.; Li, M.; Huang, C.; Liu, Q.; Cheng, M.; Shangguan, Z.; Peng, C. Land-Use Changes Driven by ‘Grain for Green’ Program Reduced Carbon Loss Induced by Soil Erosion on the Loess Plateau of China. Glob. Planet. Chang. 2019, 177, 101–115. [Google Scholar] [CrossRef]
- DENG, L.; SHANGGUAN, Z.; LI, R. Effects of the Grain-for-Green Program on Soil Erosion in China. Int. J. Sediment Res. 2012, 27, 120–127. [Google Scholar] [CrossRef]
- Sun, D.; Yang, H.; Guan, D.; Yang, M.; Wu, J.; Yuan, F.; Jin, C.; Wang, A.; Zhang, Y. The Effects of Land Use Change on Soil Infiltration Capacity in China: A Meta-Analysis. Sci. Total Environ. 2018, 626, 1394–1401. [Google Scholar] [CrossRef]
- Zhao, J.; Yang, Z.; Govers, G. Soil and Water Conservation Measures Reduce Soil and Water Losses in China but Not down to Background Levels: Evidence from Erosion Plot Data. Geoderma 2019, 337, 729–741. [Google Scholar] [CrossRef]
- Panagos, P.; Borrelli, P.; Robinson, D. FAO Calls for Actions to Reduce Global Soil Erosion. Mitig. Adapt. Strateg. Glob. Chang. 2020, 25, 789–790. [Google Scholar] [CrossRef] [Green Version]
- Chinnasamy, P.; Honap, V.U.; Maske, A.B. Impact of 2018 Kerala Floods on Soil Erosion: Need for Post-Disaster Soil Management. J. Indian Soc. Remote Sens. 2020, 48, 1373–1388. [Google Scholar] [CrossRef]
- Tian, P.; Zhu, Z.; Yue, Q.; He, Y.; Zhang, Z.; Hao, F.; Guo, W.; Chen, L.; Liu, M. Soil Erosion Assessment by RUSLE with Improved P Factor and Its Validation: Case Study on Mountainous and Hilly Areas of Hubei Province, China. Int. Soil Water Conserv. Res. 2021, 9, 433–444. [Google Scholar] [CrossRef]
- Ning, J.; Liu, J.; Kuang, W.; Xu, X.; Zhang, S.; Yan, C.; Li, R.; Wu, S.; Hu, Y.; Du, G.; et al. Spatiotemporal Patterns and Characteristics of Land-Use Change in China during 2010–2015. J. Geogr. Sci. 2018, 28, 547–562. [Google Scholar] [CrossRef] [Green Version]
- Resources and Environmental Science Data Center. Available online: https://www.resdc.cn (accessed on 10 January 2022).
- Meteorological Data Center of China Meteorological Administration. 2021. Available online: http://data.cma.cn/ (accessed on 10 October 2021).
- Harmonized World Soil Database v1.2|FAO SOILS PORTAL|Food and Agriculture Organization of the United Nations. Available online: http://www.fao.org/soils-portal/data-hub/soil-maps-and-databases/harmonized-world-soil-database-v12/en/ (accessed on 6 August 2021).
- Geospatial Data Cloud. Available online: www.gscloud.cn (accessed on 10 October 2021).
- Scientific Data. Available online: https://www.nature.com/sdata/ (accessed on 10 October 2021).
- Chen, W.; Zhao, H.; Li, J.; Zhu, L.; Wang, Z.; Zeng, J. Land Use Transitions and the Associated Impacts on Ecosystem Services in the Middle Reaches of the Yangtze River Economic Belt in China Based on the Geo-Informatic Tupu Method. Sci. Total Environ. 2020, 701, 134690. [Google Scholar] [CrossRef]
- Vinatier, F.; Arnaiz, A.G. Using High-Resolution Multitemporal Imagery to Highlight Severe Land Management Changes in Mediterranean Vineyards. Appl. Geogr. 2018, 90, 115–122. [Google Scholar] [CrossRef]
- Koochaksaraei, R.H.; Meneghini, I.R.; Coelho, V.N.; Guimarães, F.G. A New Visualization Method in Many-Objective Optimization with Chord Diagram and Angular Mapping. Knowl.-Based Syst. 2017, 138, 134–154. [Google Scholar] [CrossRef]
- Li, Q.; Zhou, Y.; Wang, L.; Zuo, Q.; Yi, S.; Liu, J.; Su, X.; Xu, T.; Jiang, Y. The Link between Landscape Characteristics and Soil Losses Rates over a Range of Spatiotemporal Scales: Hubei Province, China. Int. J. Environ. Res. Public Health 2021, 18, 11044. [Google Scholar] [CrossRef]
- Kevin, M. Fragstats Help; University of Massachusetts: Amherst, MA, USA, 2015. [Google Scholar]
- Mirghaed, F.A.; Souri, B.; Mohammadzadeh, M.; Salmanmahiny, A.; Mirkarimi, S.H. Evaluation of the Relationship between Soil Erosion and Landscape Metrics across Gorgan Watershed in Northern Iran. Environ. Monit. Assess. 2018, 190, 643. [Google Scholar] [CrossRef]
- Brini, I.; Alexakis, D.D.; Kalaitzidis, C. Linking Soil Erosion Modeling to Landscape Patterns and Geomorphometry: An Application in Crete, Greece. Appl. Sci. 2021, 11, 5684. [Google Scholar] [CrossRef]
- Whittingham, M.; Stephens, P.; Bradbury, R.; Freckleton, R. Why Do We Still Use Stepwise Modeling in Ecology and Behaviour? J. Anim. Ecol. 2006, 75, 1182–1189. [Google Scholar] [CrossRef] [PubMed]
- Liu, J.; Kuang, W.; Zhang, Z.; Xu, X.; Qin, Y.; Ning, J.; Zhou, W.; Zhang, S.; Rendong, L.; Yan, C.Z.; et al. Spatiotemporal Characteristics, Patterns, and Causes of Land-Use Changes in China since the Late 1980s. J. Geogr. Sci. 2014, 24, 195–210. [Google Scholar] [CrossRef]
- Qiu, B.; Li, H.; Tang, Z.; Chen, C.; Berry, J. How Cropland Losses Shaped by Unbalanced Urbanization Process? Land Use Policy 2020, 96, 104715. [Google Scholar] [CrossRef]
- Office of the South-to-North Water Diversion Project Construction Committee, State Council, PRC The South-to-North Water Diversion Project. Engineering 2016, 2, 265–267. [CrossRef] [Green Version]
- National Development and Reform Commission of China. Han River Ecological and Economic Belt Development Plan; National Development and Reform Commission of China: Beijing, China, 2018.
- Qiu, B.; Zou, F.; Chen, C.; Tang, Z.; Zhong, J.; Yan, X. Automatic Mapping Afforestation, Cropland Reclamation and Variations in Cropping Intensity in Central East China during 2001–2016. Ecol. Indic. 2018, 91, 490–502. [Google Scholar] [CrossRef]
- Zeng, S. Soil erosion characteristics and its prevention in Hubei Province. Soil Water Conserv. 1981, 1, 4–8. [Google Scholar] [CrossRef]
- Wang, X.; Zhao, X.; Zhang, Z.; Yi, L.; Zuo, L.; Wen, Q.; Liu, F.; Xu, J.; Hu, S.; Liu, B. Assessment of Soil Erosion Change and Its Relationships with Land Use/Cover Change in China from the End of the 1980s to 2010. Catena 2016, 137, 256–268. [Google Scholar] [CrossRef]
- Jiang, Y.; Lin, L.; Chen, L.; Ni, H.; Ge, W.; Cheng, H.; Zhai, G.; Wang, G.; Ban, Y.; Li, Y.; et al. An Overview of the Resources and Environment Conditions and Major Geological Problems in the Yangtze River Economic Zone, China. China Geol. 2018, 1, 435–449. [Google Scholar] [CrossRef]
- Xiao, P.; Zhao, C.; Zhou, Y.; Feng, H.; Li, X.; Jiang, J. Study on Land Consolidation Zoning in Hubei Province Based on the Coupling of Neural Network and Cluster Analysis. Land 2021, 10, 756. [Google Scholar] [CrossRef]
- Ruiz-Colmenero, M.; Bienes, R.; Eldridge, D.J.; Marques, M.J. Vegetation Cover Reduces Erosion and Enhances Soil Organic Carbon in a Vineyard in the Central Spain. CATENA 2013, 104, 153–160. [Google Scholar] [CrossRef]
- Hancock, G.R.; Ovenden, M.; Sharma, K.; Rowlands, W.; Gibson, A.; Wells, T. Soil Erosion—The Impact of Grazing and Regrowth Trees. Geoderma 2020, 361, 114102. [Google Scholar] [CrossRef]
- Oba, G.; Post, E.; Syvertsen, P.O.; Stenseth, N.C. Bush Cover and Range Condition Assessments in Relation to Landscape and Grazing in Southern Ethiopia. Landsc. Ecol. 2000, 15, 535–546. [Google Scholar] [CrossRef]
- Xu, Y.; Tang, H.; Wang, B.; Chen, J. Effects of Landscape Patterns on Soil Erosion Processes in a Mountain–Basin System in the North China. Nat. Hazards 2017, 87, 1567–1585. [Google Scholar] [CrossRef]
- Zhang, H.; Zhang, R.; Qi, F.; Liu, X.; Niu, Y.; Fan, Z.; Zhang, Q.; Li, J.; Yuan, L.; Song, Y.; et al. The CSLE Model Based Soil Erosion Prediction: Comparisons of Sampling Density and Extrapolation Method at the County Level. CATENA 2018, 165, 465–472. [Google Scholar] [CrossRef]
- Guo, L.; Liu, R.; Men, C.; Wang, Q.; Miao, Y.; Shoaib, M.; Wang, Y.; Jiao, L.; Zhang, Y. Multiscale Spatiotemporal Characteristics of Landscape Patterns, Hotspots, and Influencing Factors for Soil Erosion. Sci. Total Environ. 2021, 779, 146474. [Google Scholar] [CrossRef] [PubMed]


| Data Name | Data Source | Time | Units/Resolution |
|---|---|---|---|
| Depth to bedrock map of China | Scientific data [52] | 2018 | 100 m × 100 m |
| Soil data | Harmonized World Soil Database (HWSD) [50] | 2012 | 1000 m × 1000 m |
| Land-use/land cover data | Resource and Environment Science and Data Center [48] | 2000; 2005; 2010; 2015; 2020 | 30 m × 30 m |
| Normalized difference vegetation index | 1000 m × 1000 m | ||
| Meteorological data | Meteorological Data Center of China Meteorological Administration [49] | 2000–2020 | Daily |
| Digital elevation model | Geospatial Data Cloud [51] | 2008 | 30 m × 30 m |
| Soil Erosion Level | Slight | Light | Moderate | High | Very High | Severe |
|---|---|---|---|---|---|---|
| Soil erosion rate (t·ha−1·yr−1) | <200 | 200–2500 | 2500–5000 | 5000–8000 | 8000–15,000 | >15,000 |
| Landscape Metrics | Landscape-Level Metrics | Class-Level Metrics | Regression Analyze | |
|---|---|---|---|---|
| The Aspect of Landscape Pattern Measured | ||||
| Area and edge | AREA_MN | CA; PLAND; ED; LPI | LPI | |
| Shape | SHAPE_MN; CONTIG_MN; FRAC_MN | FRAC_MN; CONTIG_MN | ||
| Aggregation | NP | AI; PD | AI; PD; CONTAG; LSI; NP | |
| Diversity | SHEI | SHDI; SHEI | ||
| Landscape Pattern Index | Standard Coefficient | Significant Coefficient |
|---|---|---|
| CONTIG_MN | 0.325 | 0.071 |
| AI | 1.021 | 0.001 |
| LPI | 0.245 | 0.072 |
| SHEI | −0.411 | 0.092 |
Publisher’s Note: MDPI stays neutral with regard to jurisdictional claims in published maps and institutional affiliations. |
© 2022 by the authors. Licensee MDPI, Basel, Switzerland. This article is an open access article distributed under the terms and conditions of the Creative Commons Attribution (CC BY) license (https://creativecommons.org/licenses/by/4.0/).
Share and Cite
Li, J.; Zhou, Y.; Li, Q.; Yi, S.; Peng, L. Exploring the Effects of Land Use Changes on the Landscape Pattern and Soil Erosion of Western Hubei Province from 2000 to 2020. Int. J. Environ. Res. Public Health 2022, 19, 1571. https://doi.org/10.3390/ijerph19031571
Li J, Zhou Y, Li Q, Yi S, Peng L. Exploring the Effects of Land Use Changes on the Landscape Pattern and Soil Erosion of Western Hubei Province from 2000 to 2020. International Journal of Environmental Research and Public Health. 2022; 19(3):1571. https://doi.org/10.3390/ijerph19031571
Chicago/Turabian StyleLi, Jiyun, Yong Zhou, Qing Li, Siqi Yi, and Lina Peng. 2022. "Exploring the Effects of Land Use Changes on the Landscape Pattern and Soil Erosion of Western Hubei Province from 2000 to 2020" International Journal of Environmental Research and Public Health 19, no. 3: 1571. https://doi.org/10.3390/ijerph19031571
APA StyleLi, J., Zhou, Y., Li, Q., Yi, S., & Peng, L. (2022). Exploring the Effects of Land Use Changes on the Landscape Pattern and Soil Erosion of Western Hubei Province from 2000 to 2020. International Journal of Environmental Research and Public Health, 19(3), 1571. https://doi.org/10.3390/ijerph19031571