
Distribution Characteristics and Risk Assessment of Agricultural Land Use Non-Point Source Pollution in Typical Biofuel Ethanol Planting Areas

 ,
,
Abstract
:1. Introduction
2. Materials and Methods
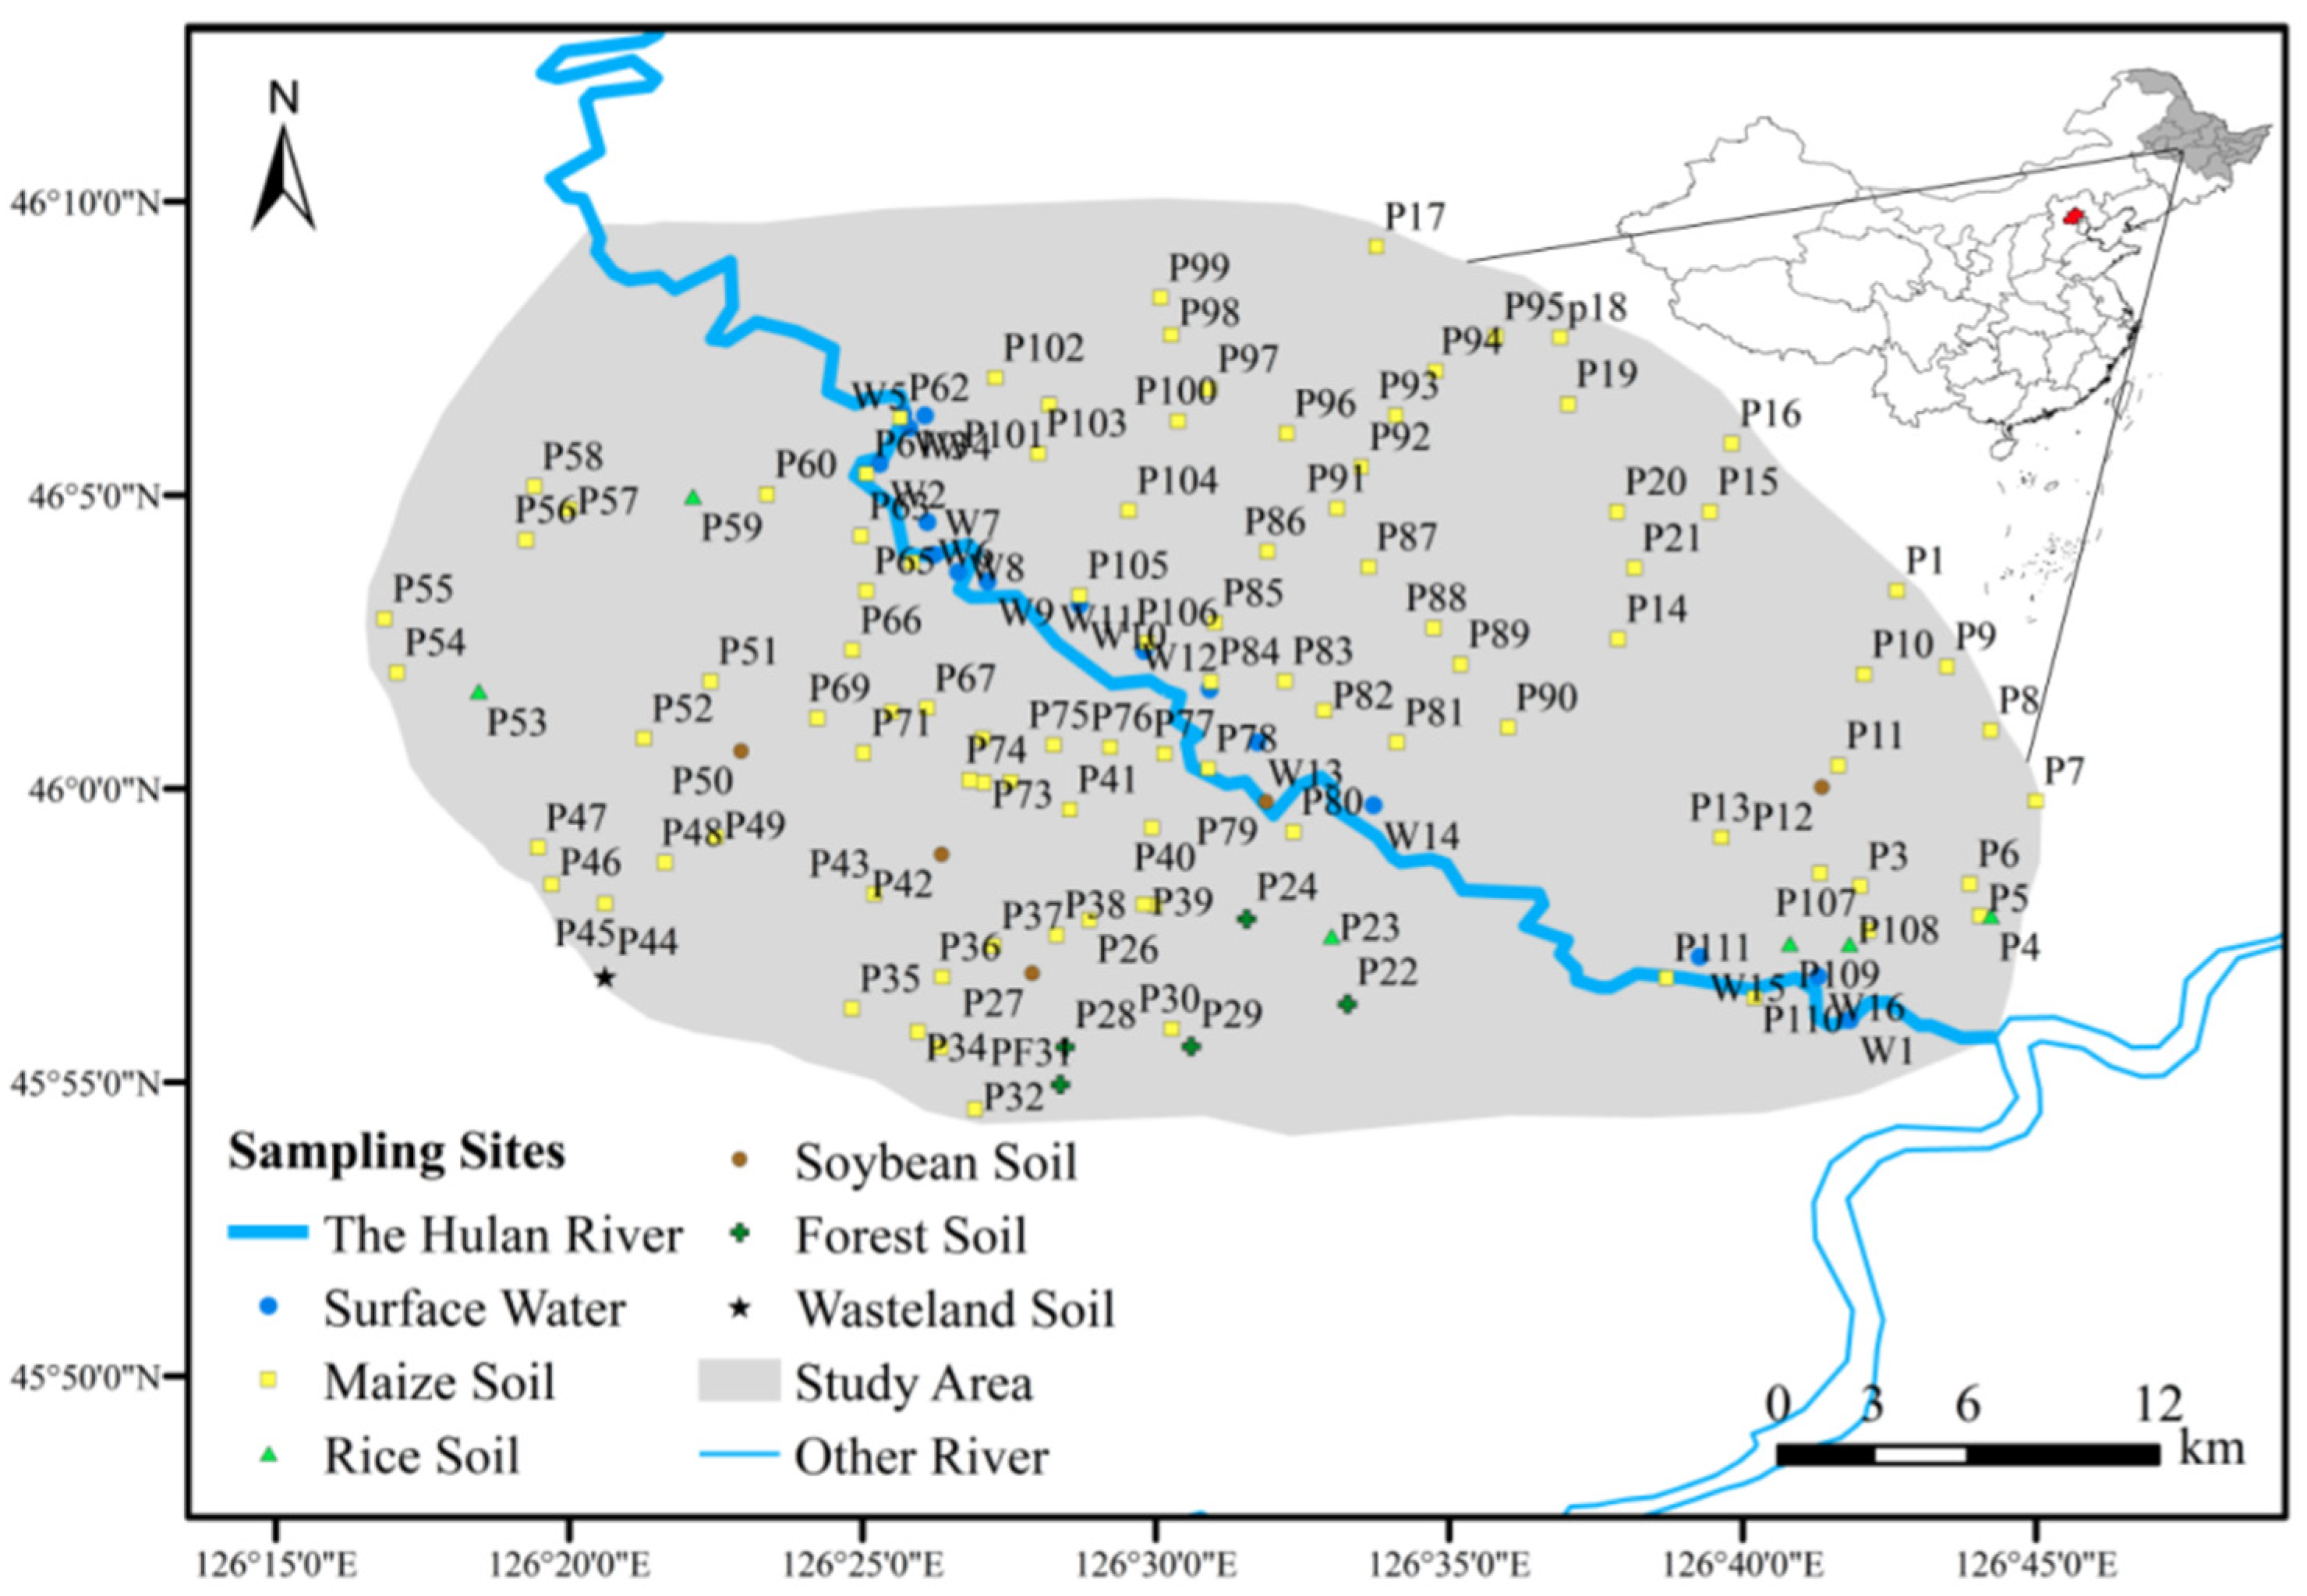
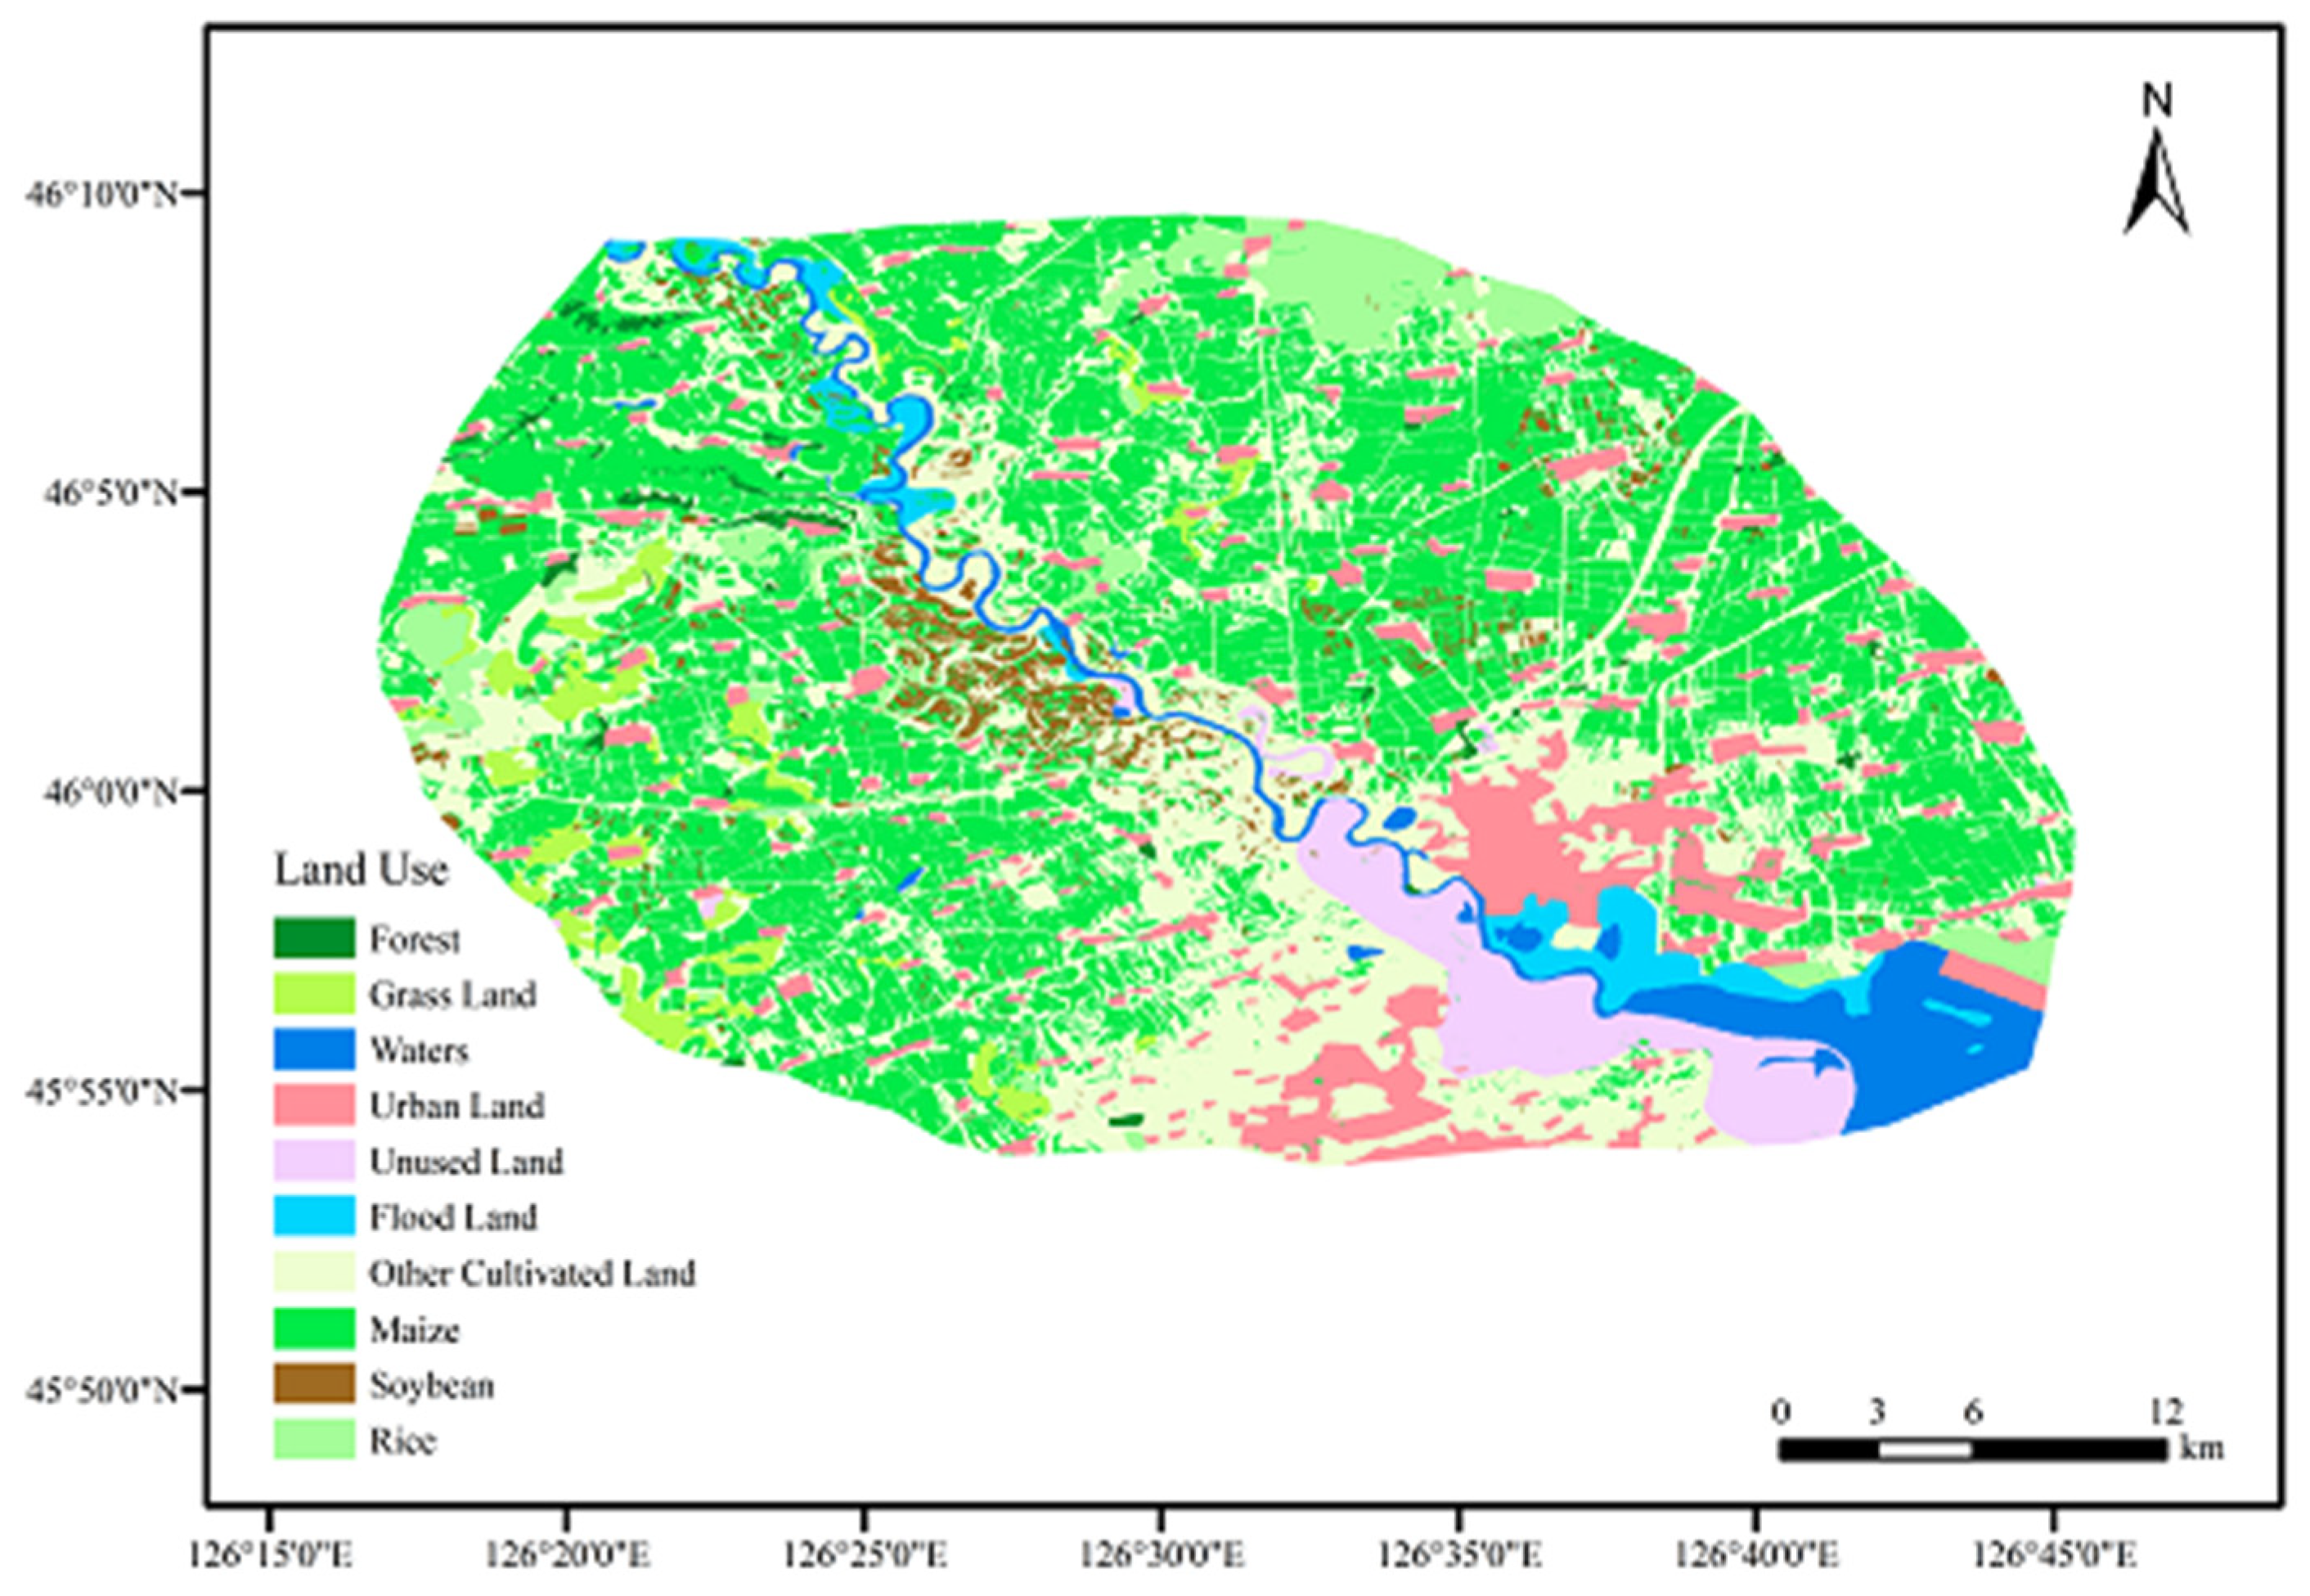
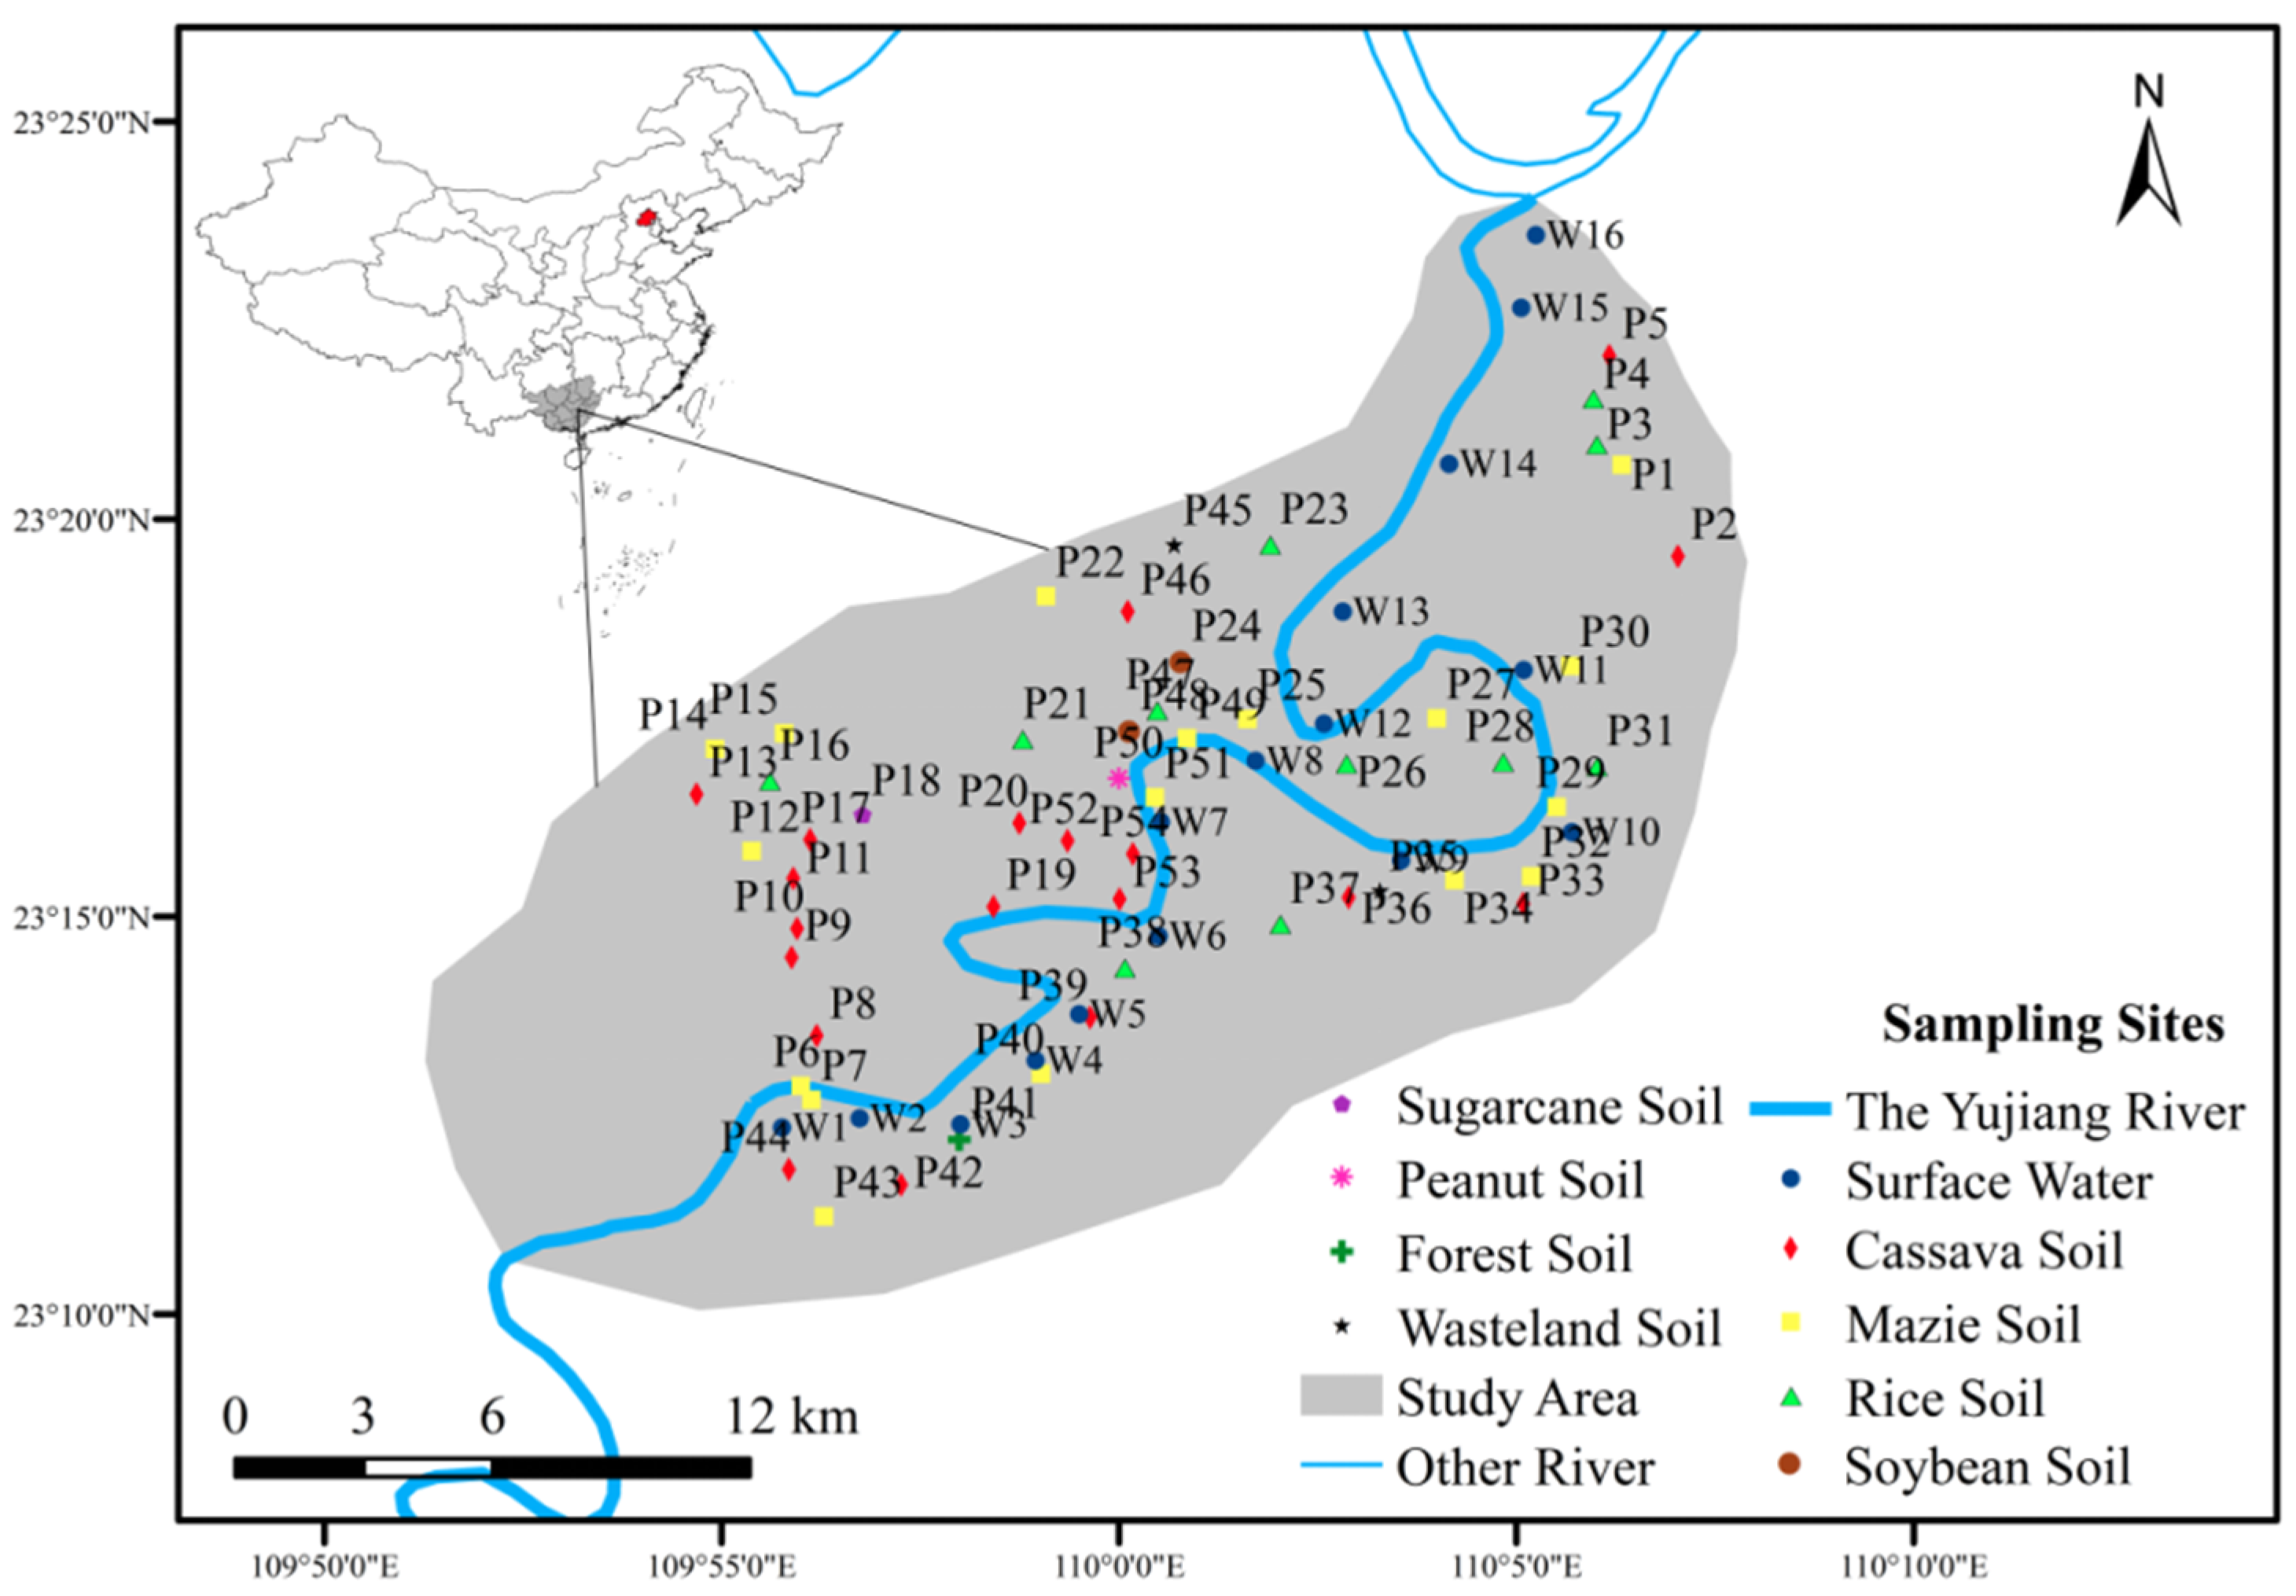
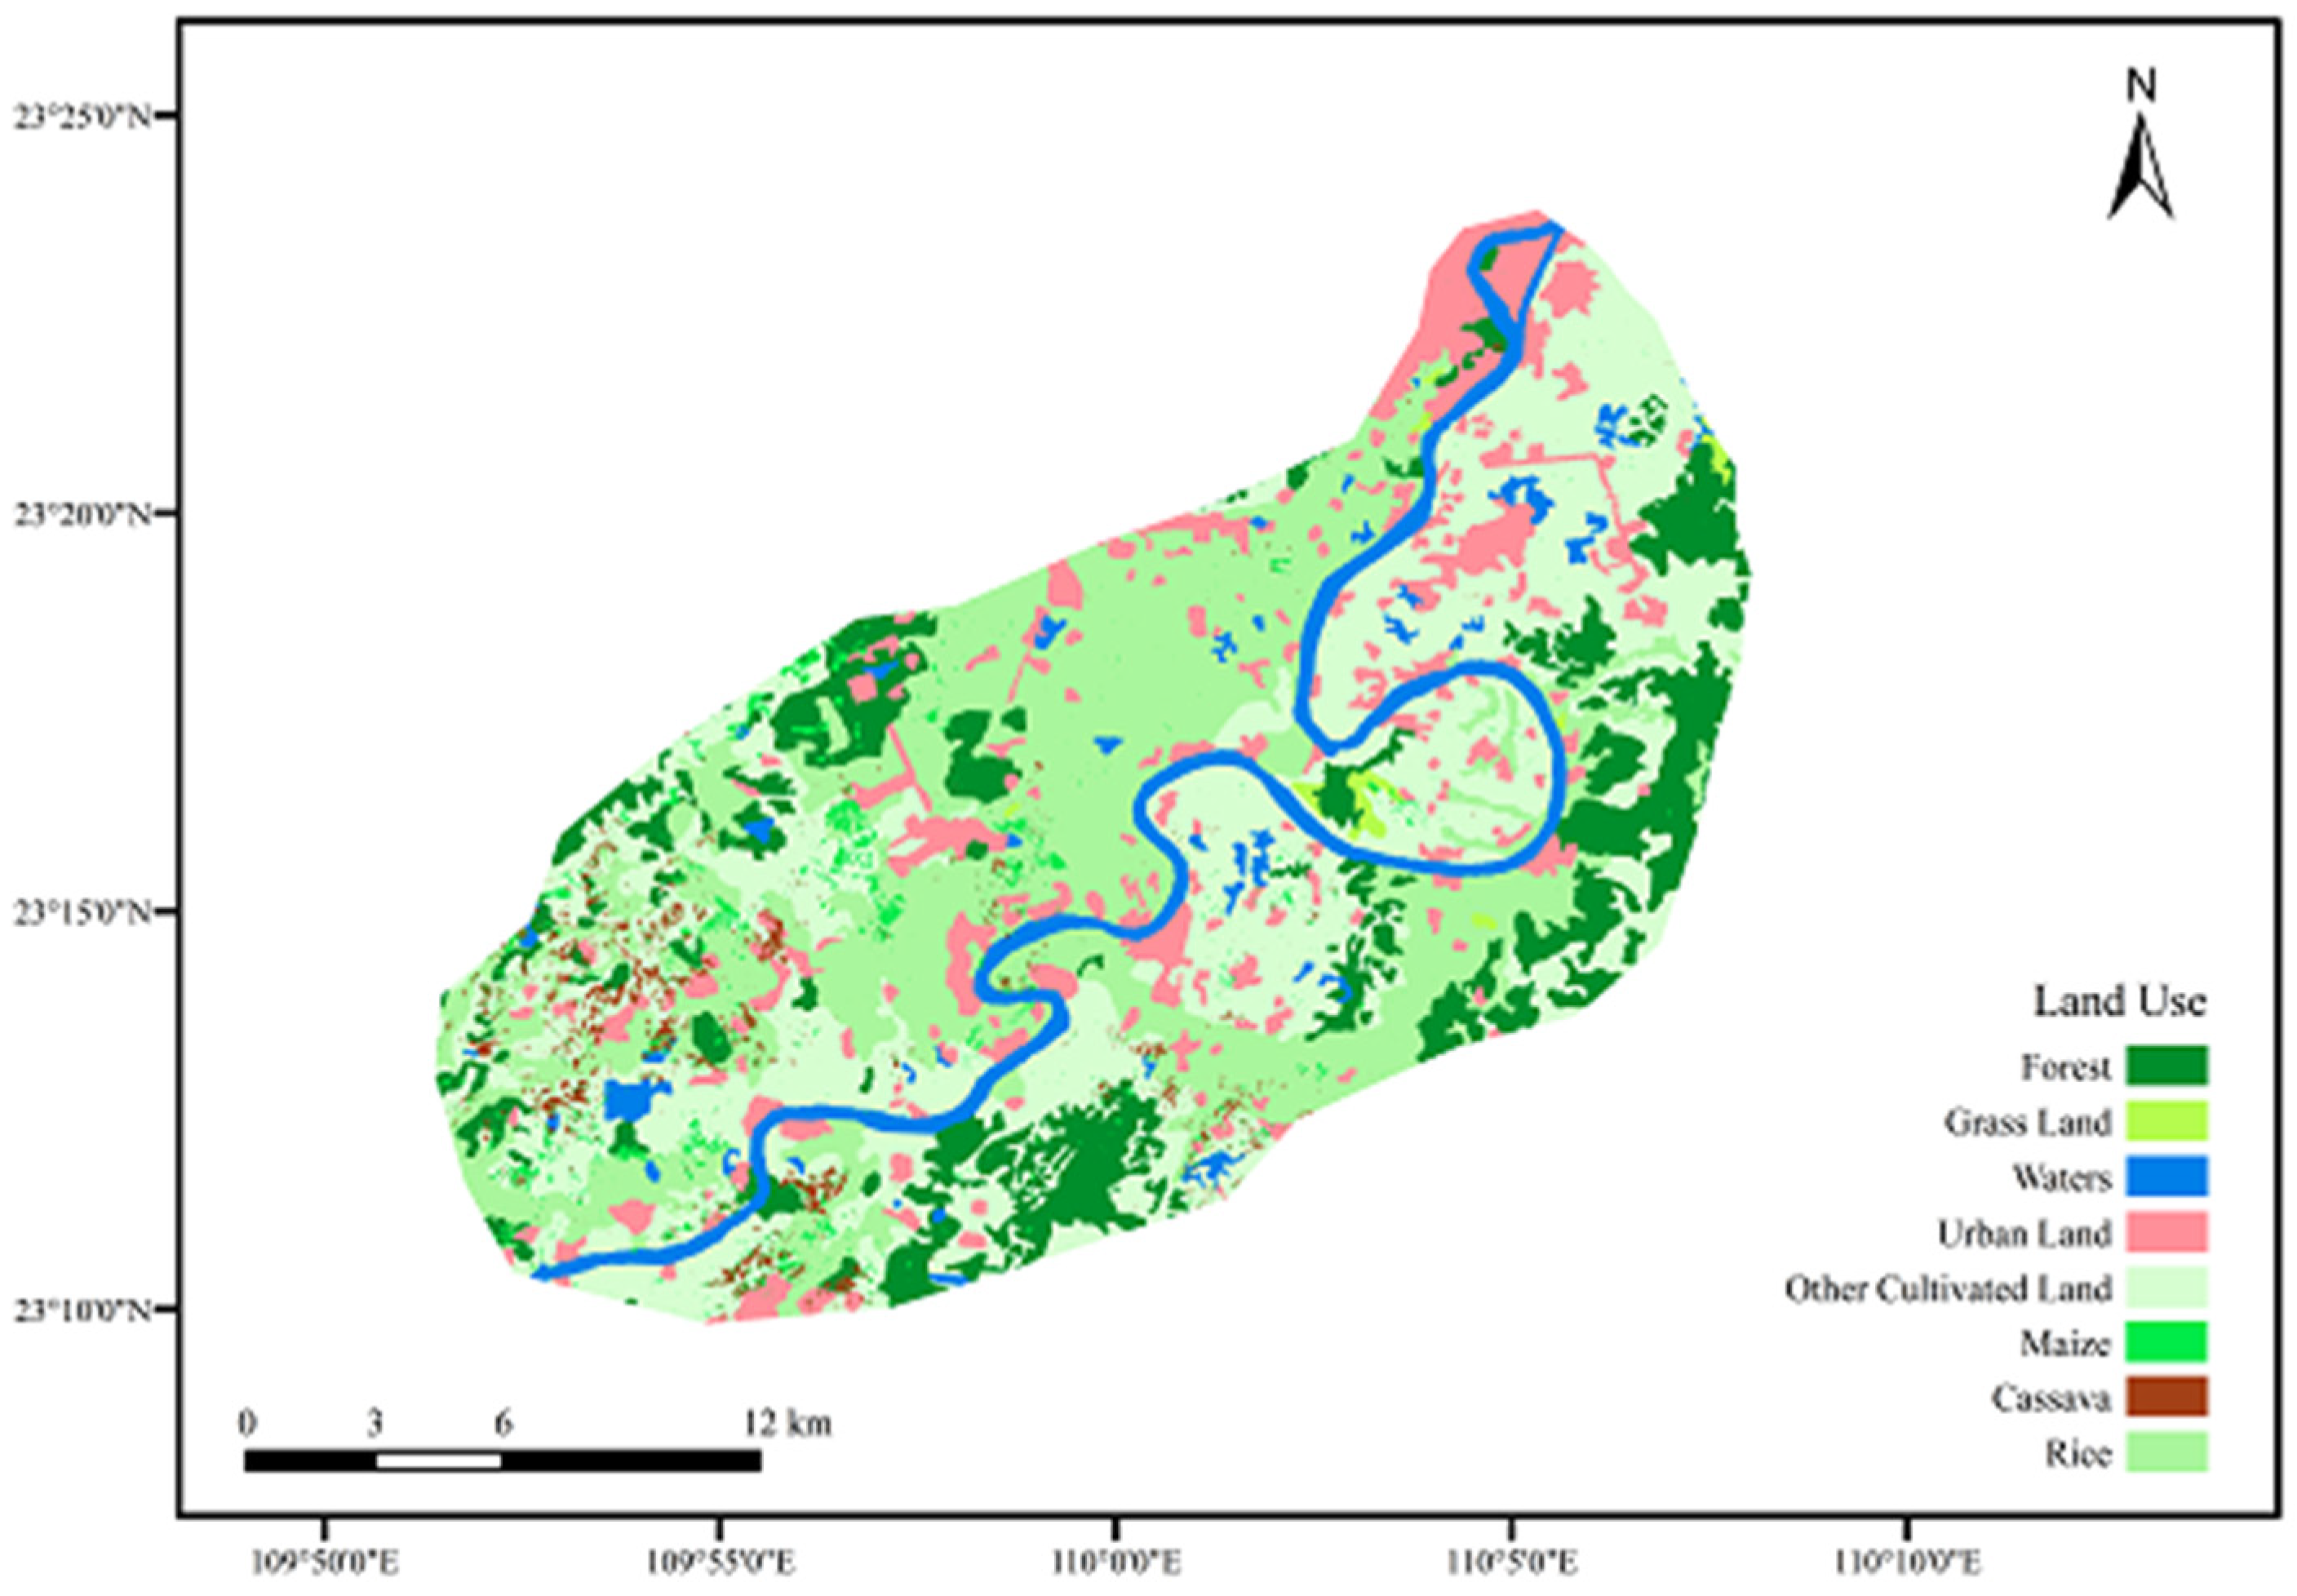
2.1. Overview of the Study Area
2.1.1. Maize Planting Area (Harbin Section of Hulan River Basin)
2.1.2. Cassava Planting Area (Guiping Section of the Yujiang River Basin)
2.2. Experimental Method
2.2.1. Determination of Soil Nitrogen and Phosphorus Forms
2.2.2. Loss Risk Assessment by Nitrogen and Phosphorus Index Method
- (1)
- Source factor calculation method
- (2)
- Migration factor calculation method
- (i)
- Soil erosion
- (ii)
- Rainfall erosion
- (iii)
- Soil erodibility
- (iv)
- Terrain
- (v)
- Vegetation cover and management, soil and water conservation and distance
3. Results and Discussion
3.1. Water Quality Characteristics of Typical Fuel Ethanol Raw Material Planting Area
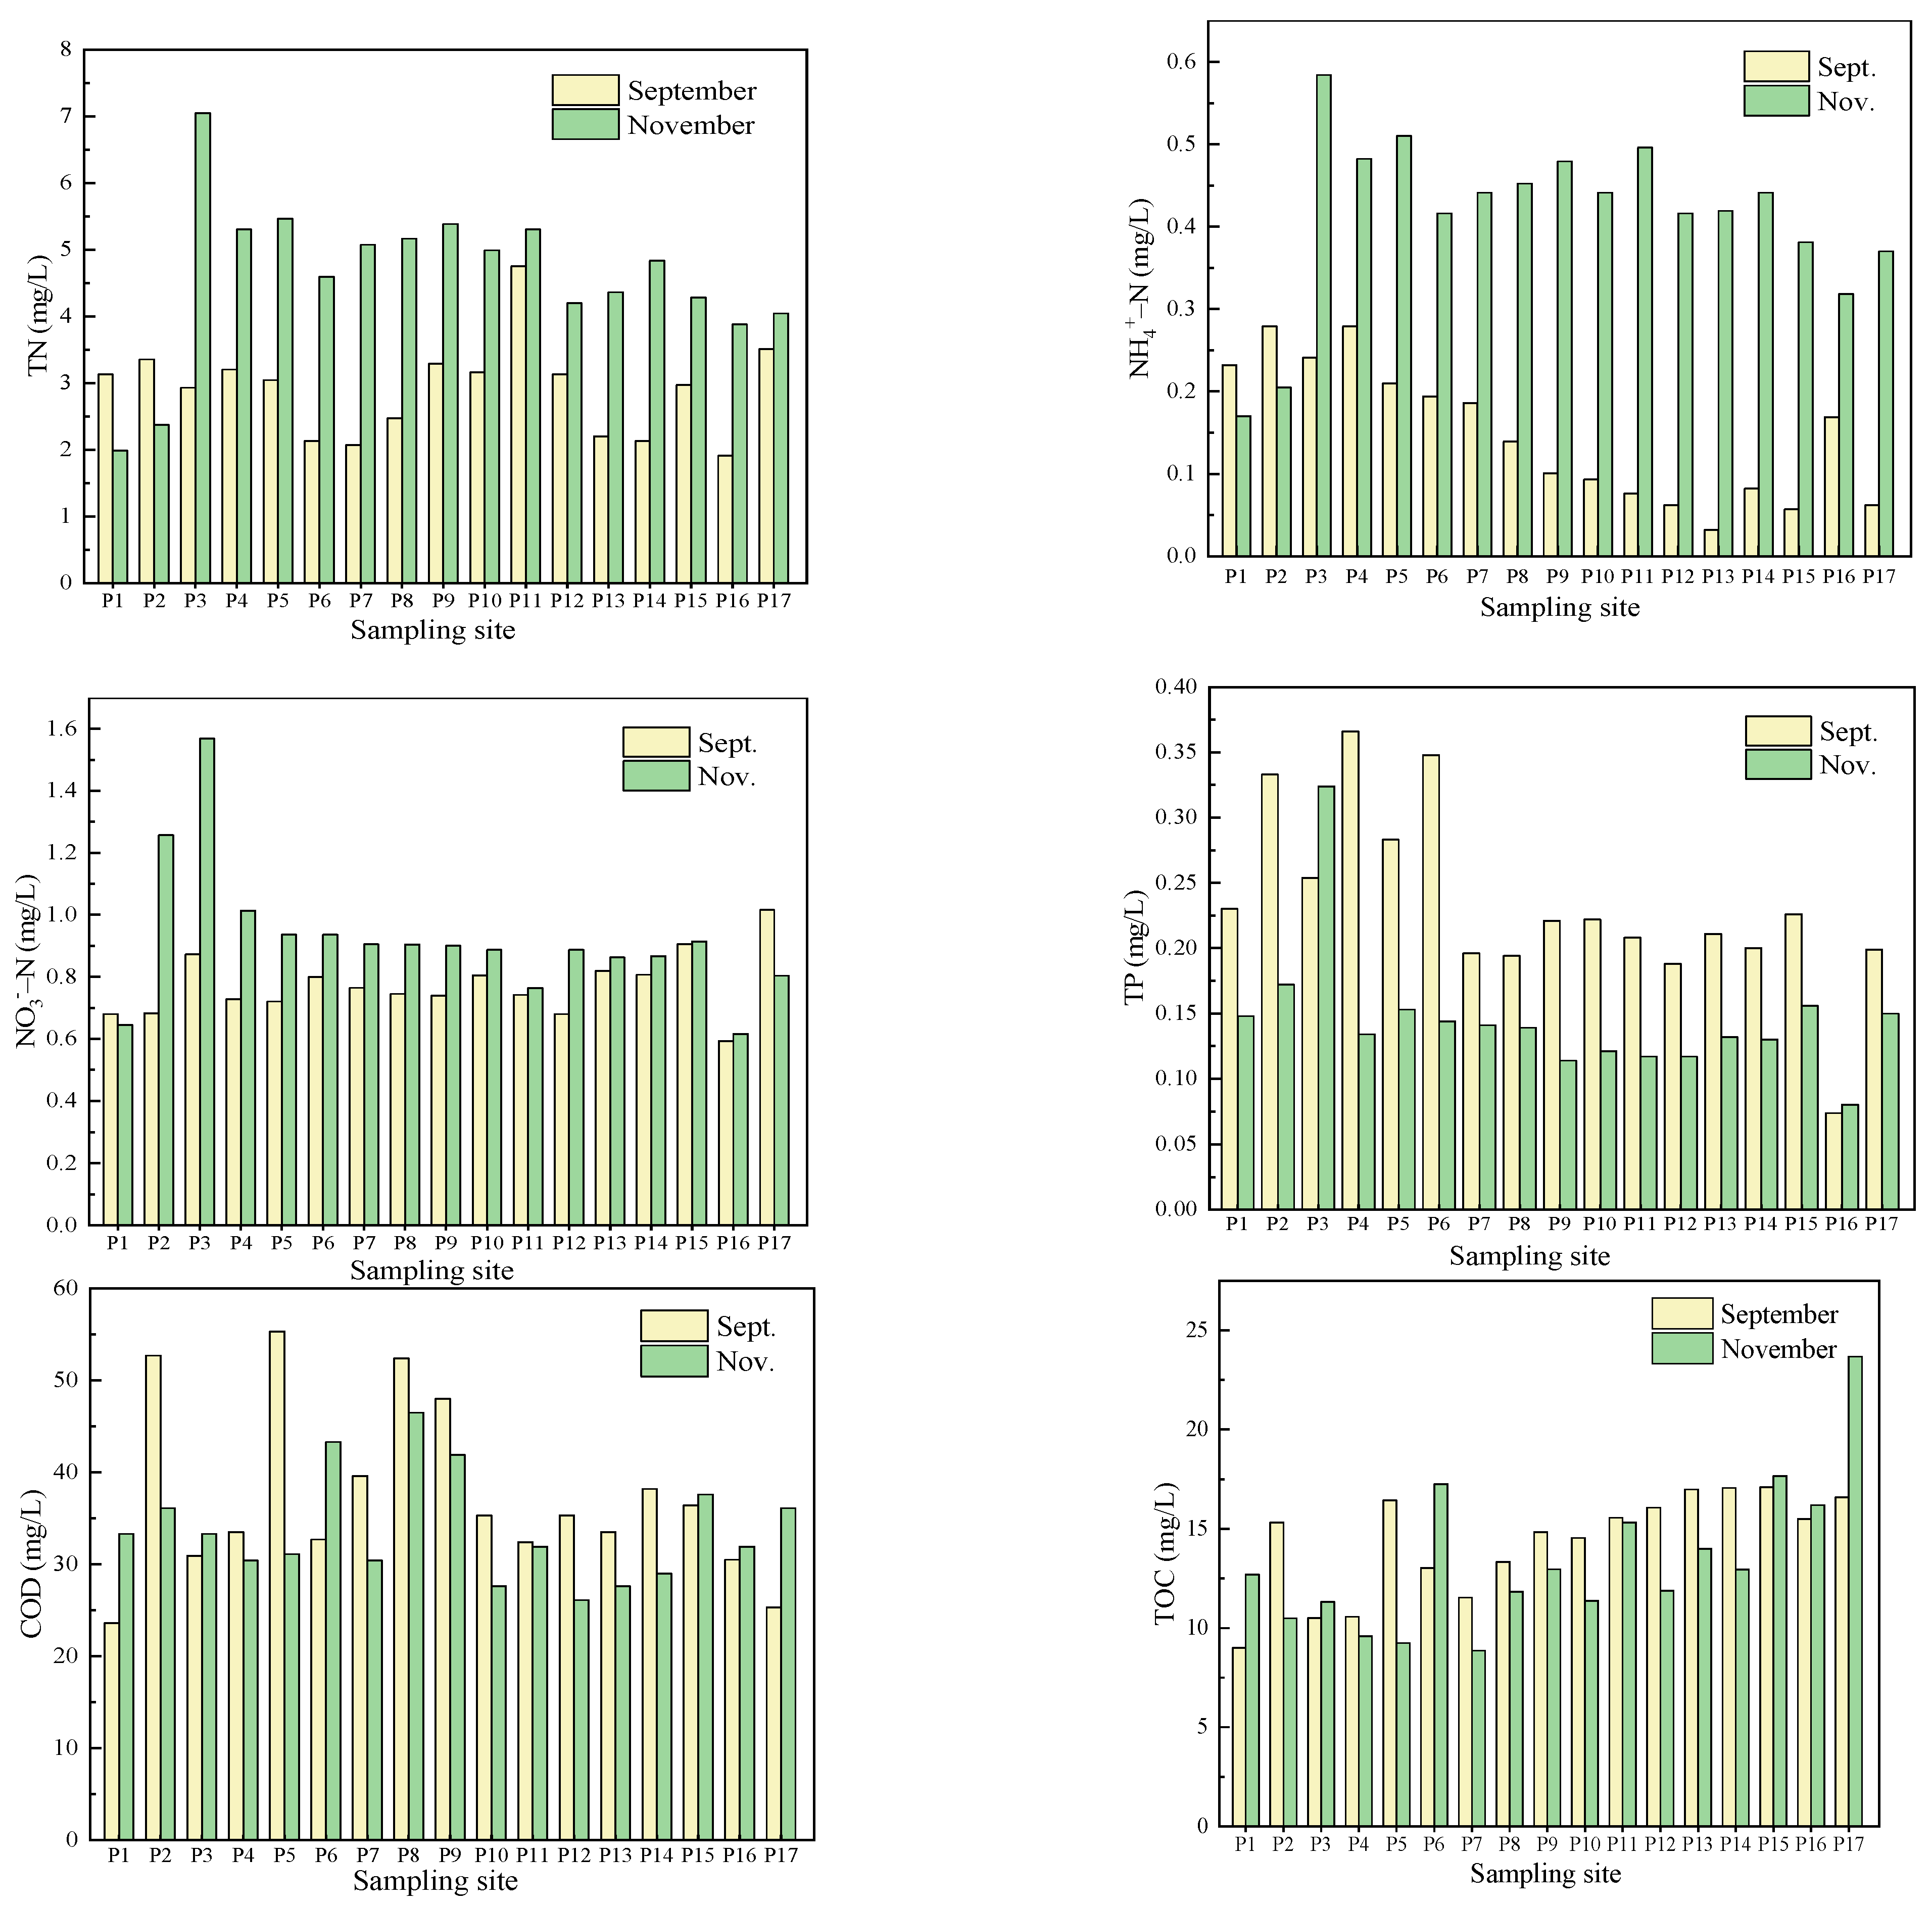
3.1.1. Water Quality Characteristics in Maize Planting Area (Hulan River Harbin Section)
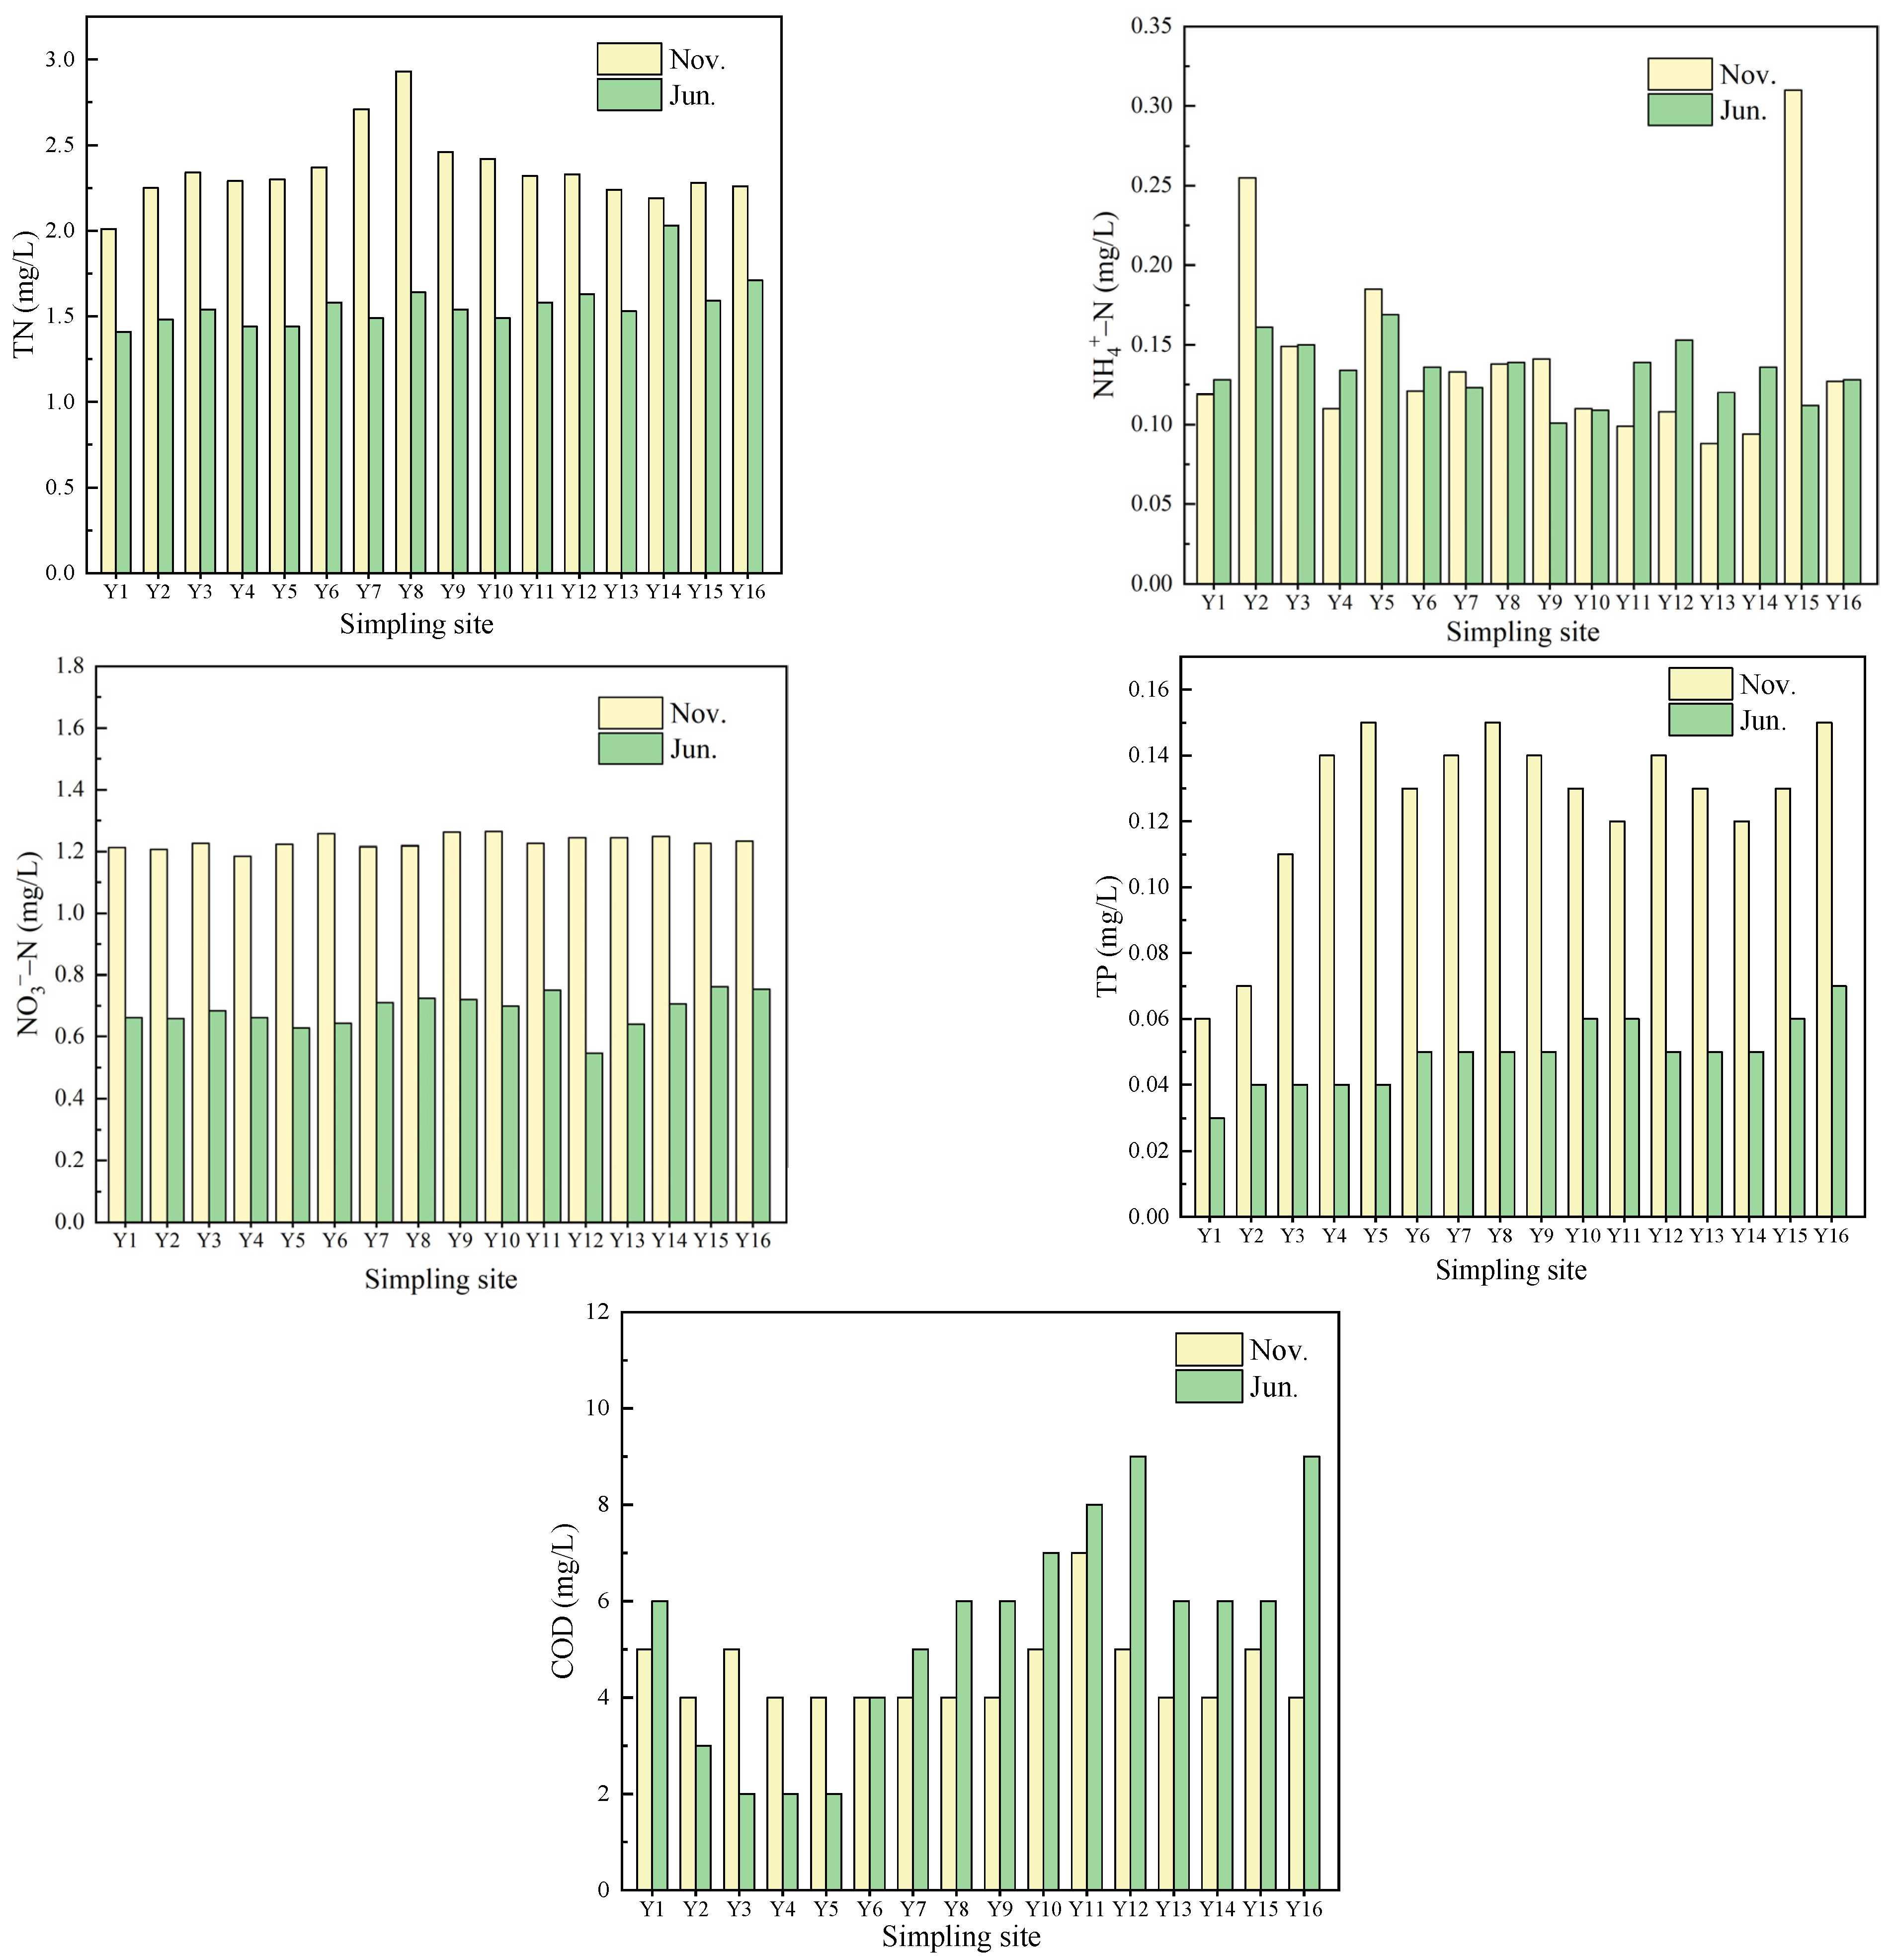
3.1.2. Water Quality Characteristics in Cassava Planting Area (Yujiang River Guiping Section)
3.2. Pollution Source Analysis of Water Quality
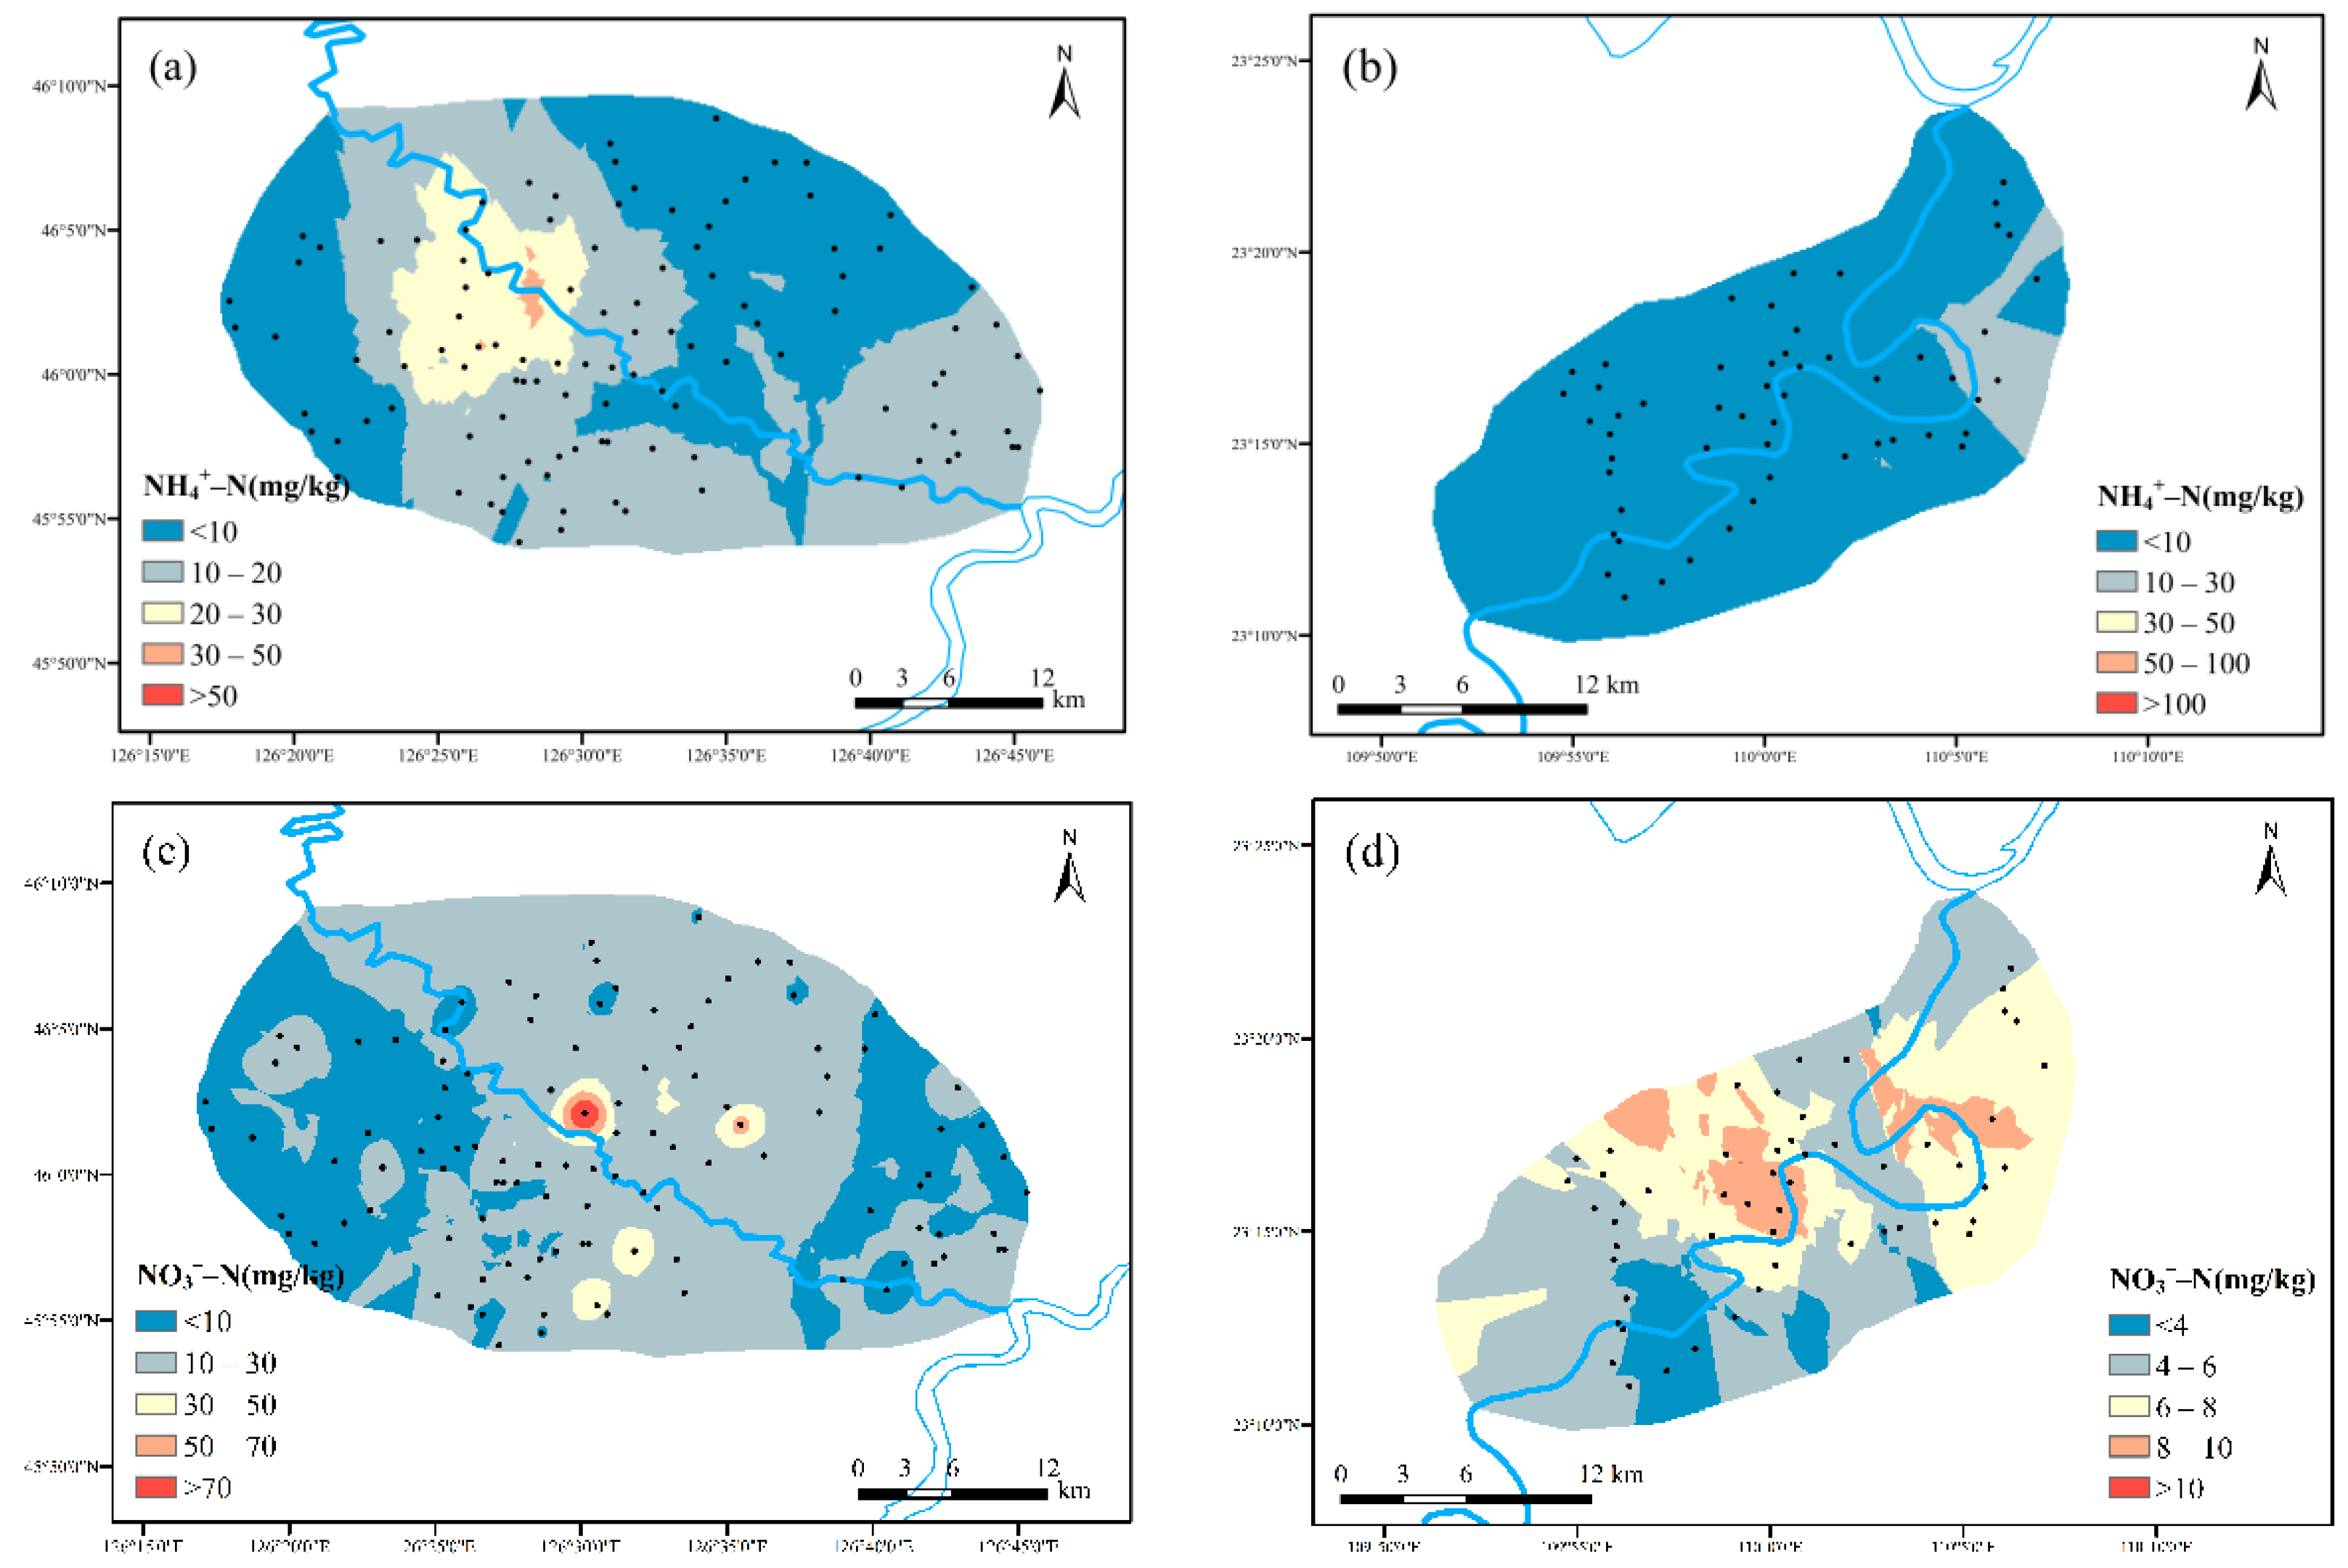
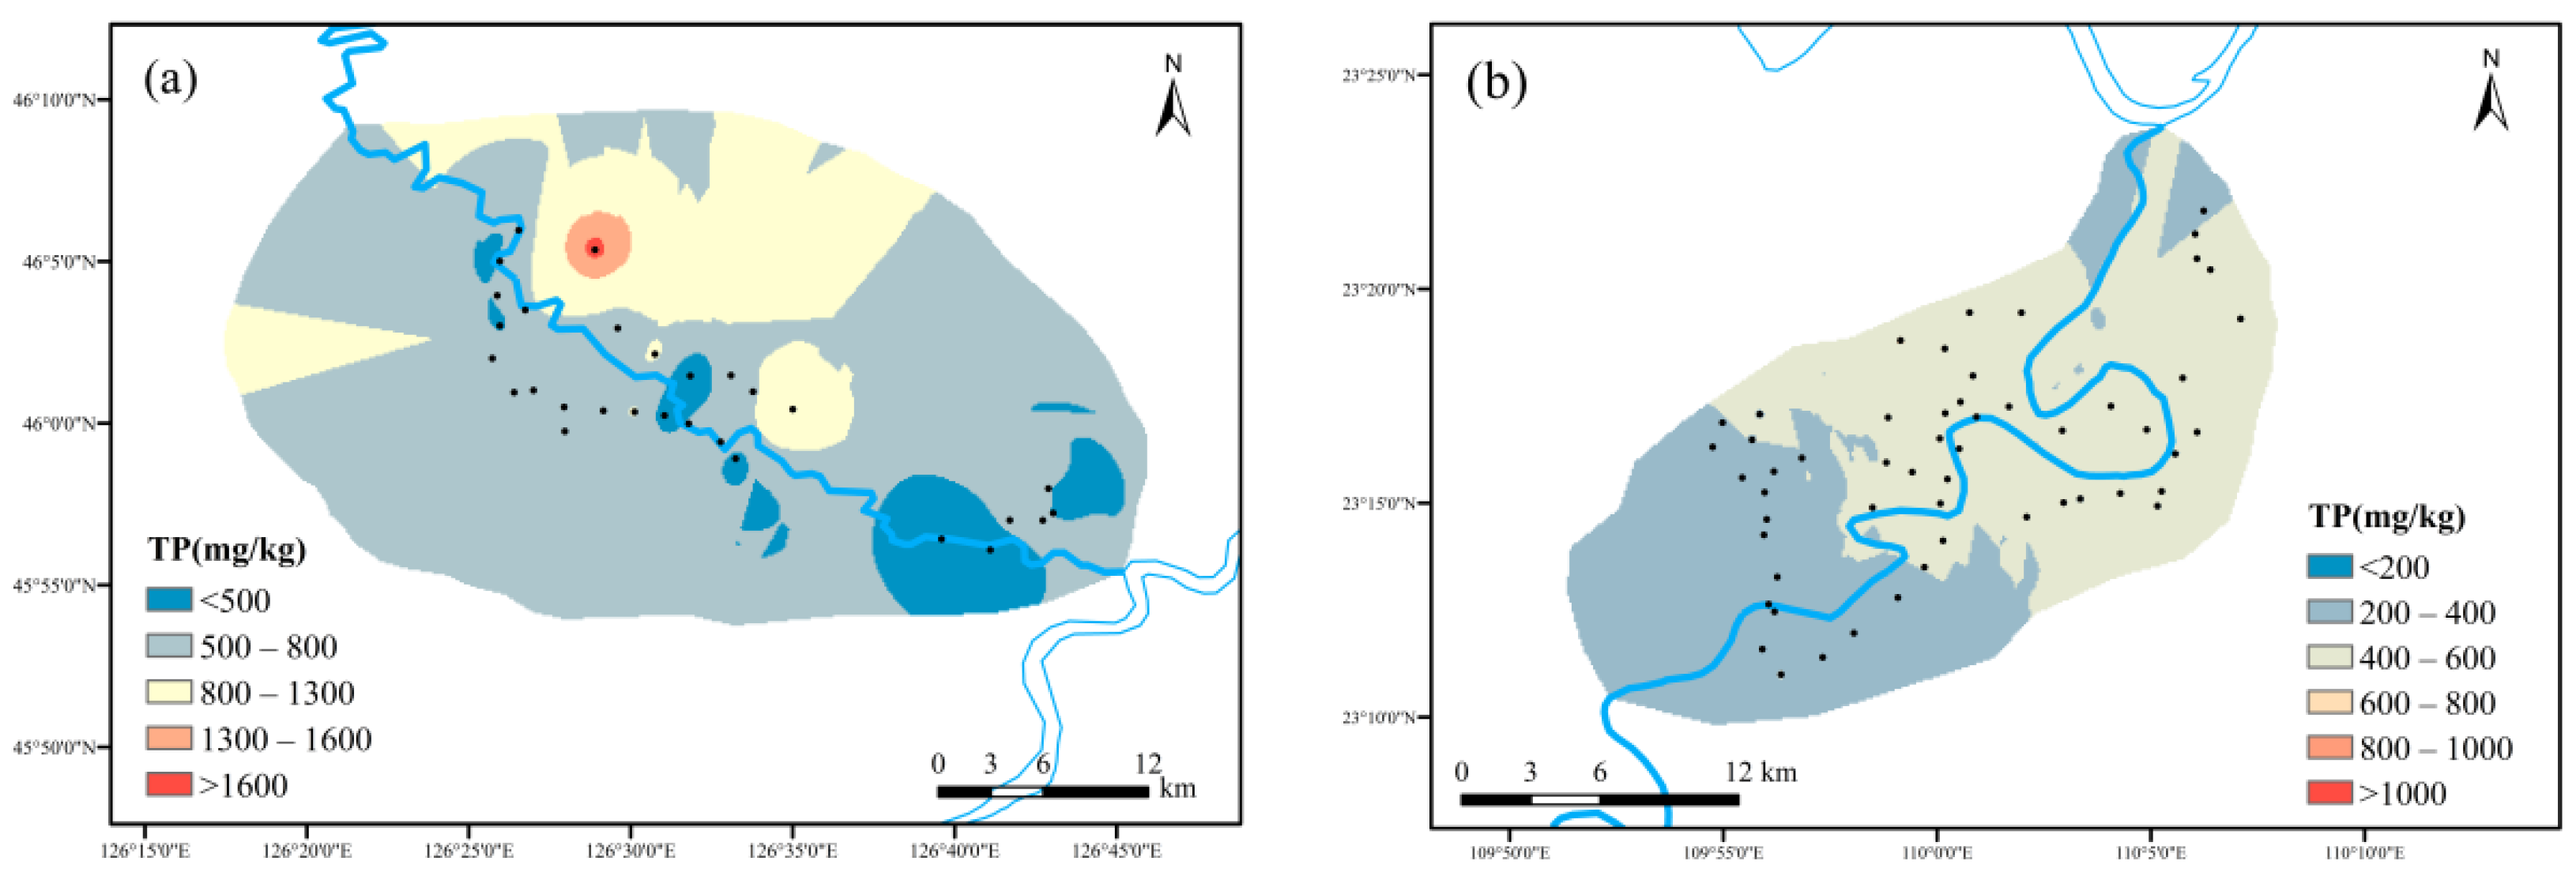
3.3. Spatial Distribution Characteristics of Soil Nitrogen and Phosphorus
3.3.1. Spatial Distribution Characteristics of Soil Nitrogen of Maize Planting Area and Cassava Planting Area
- (1)
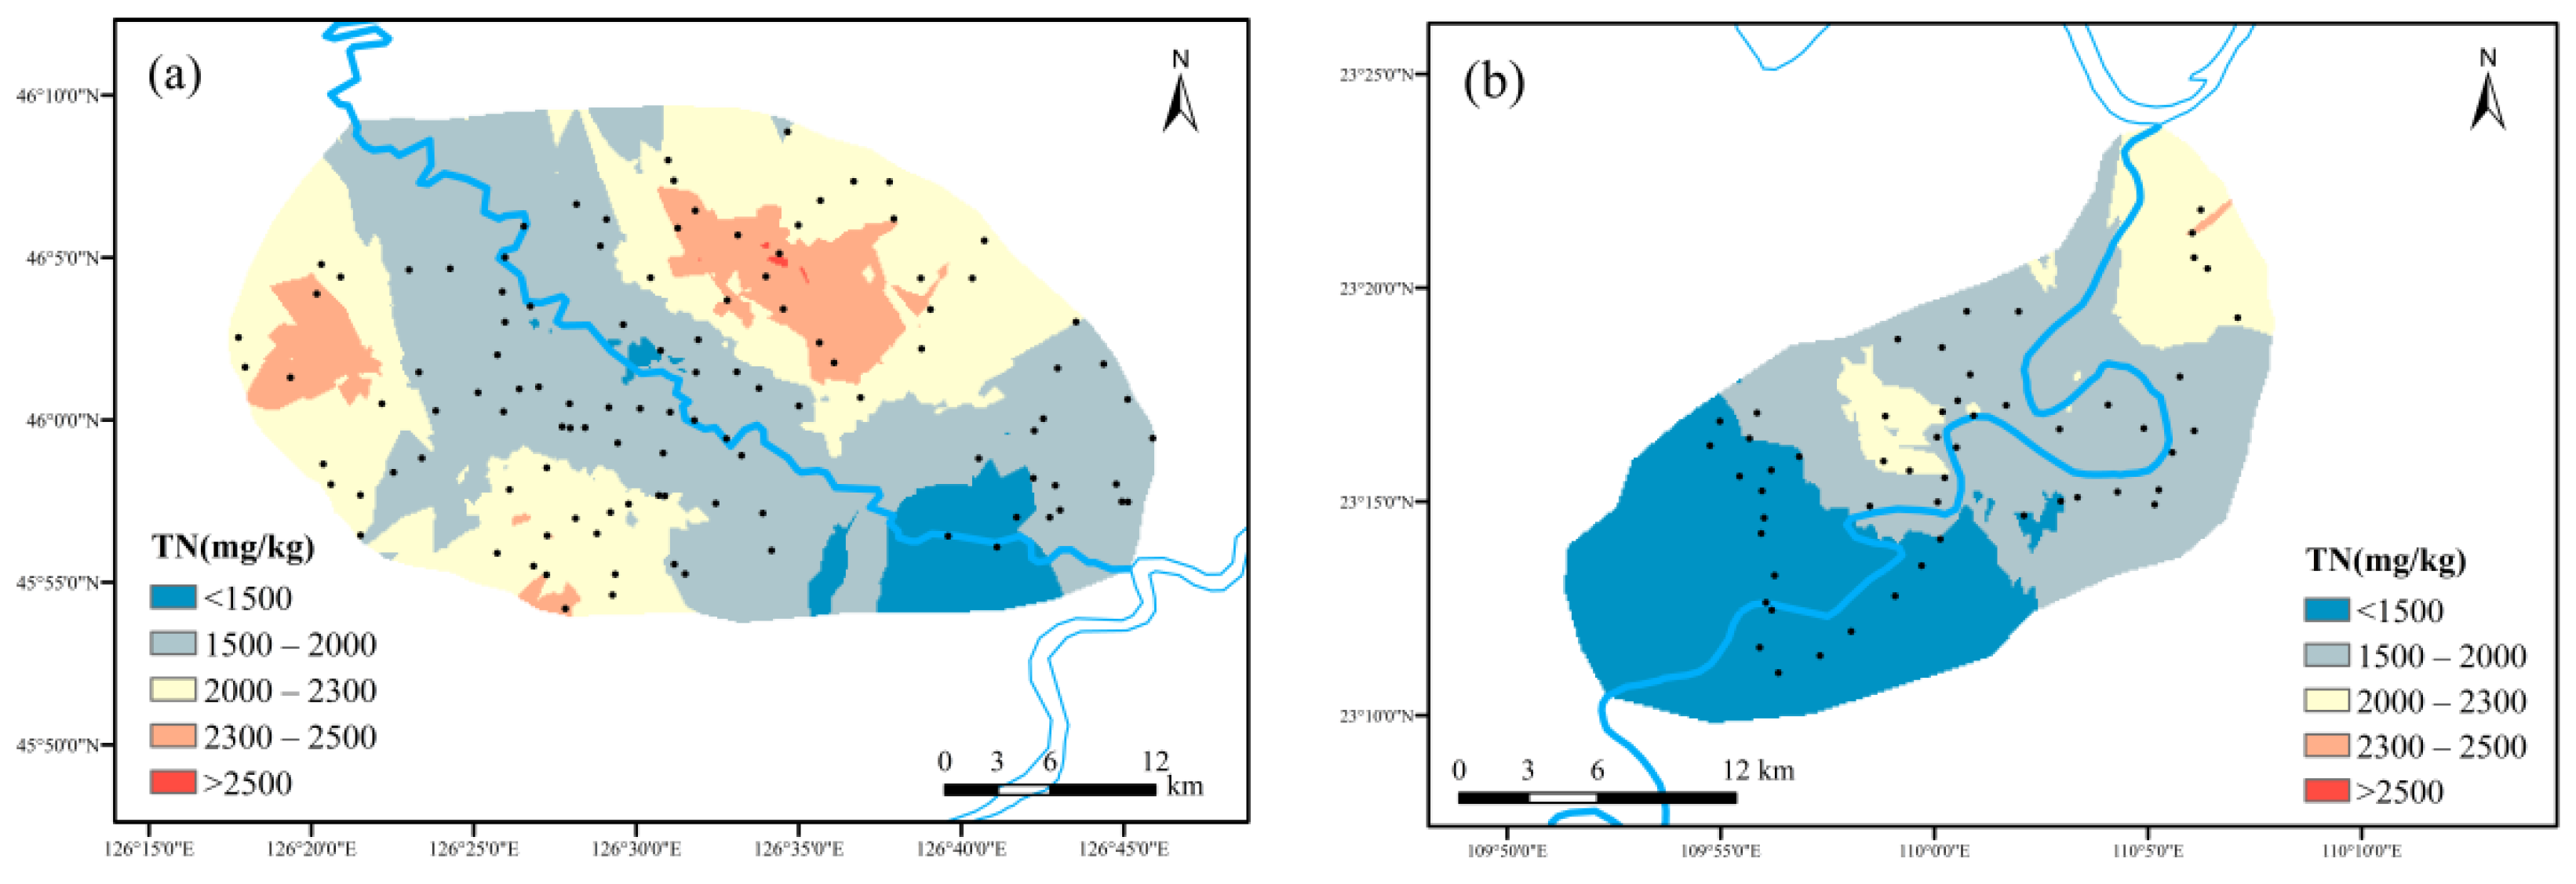
- Spatial distribution characteristics of TN
- (2)
- Spatial distribution characteristics of NH4+-N and NO3−-N
3.3.2. Spatial Distribution Characteristics of Soil Phosphorus of Maize Planting Area and Cassava Planting Area
- (1)
- Spatial distribution characteristics of TP
- (2)
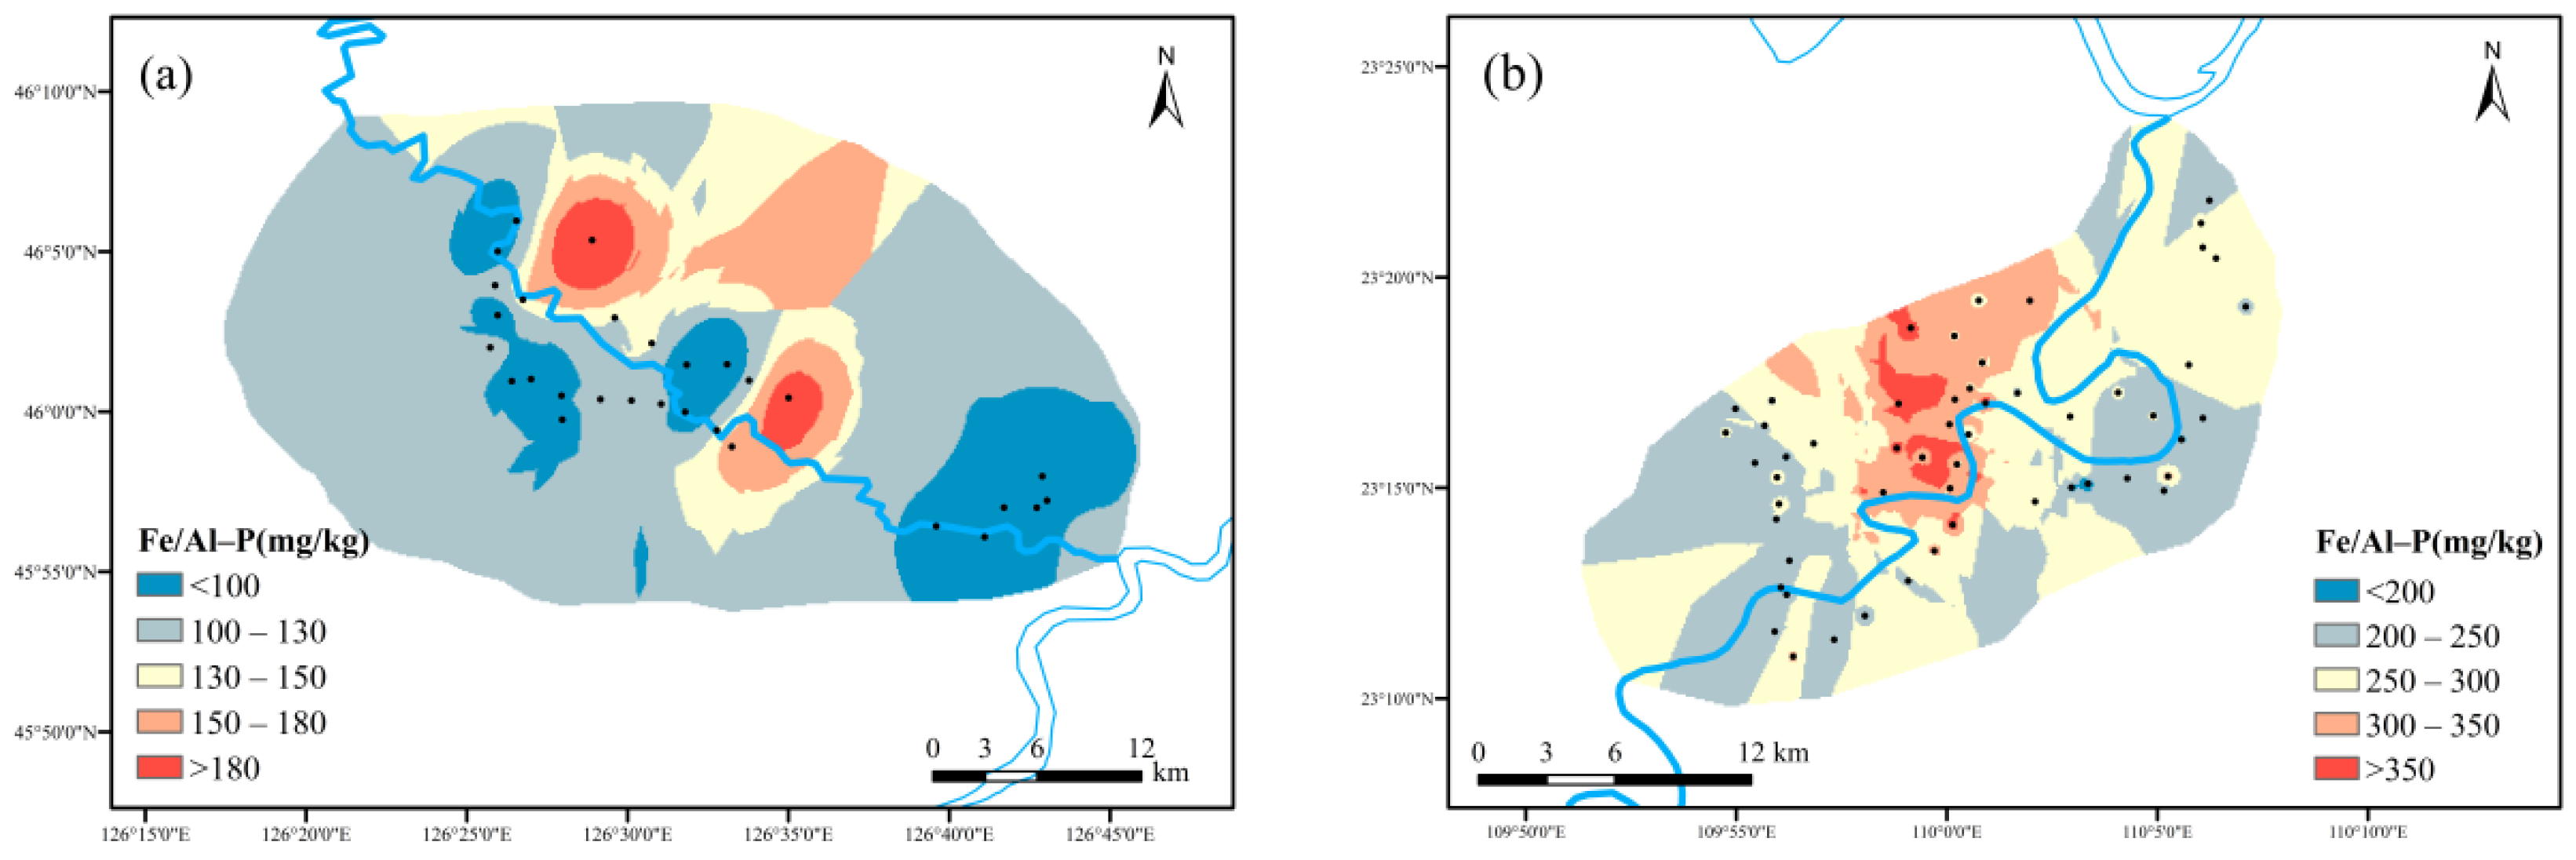
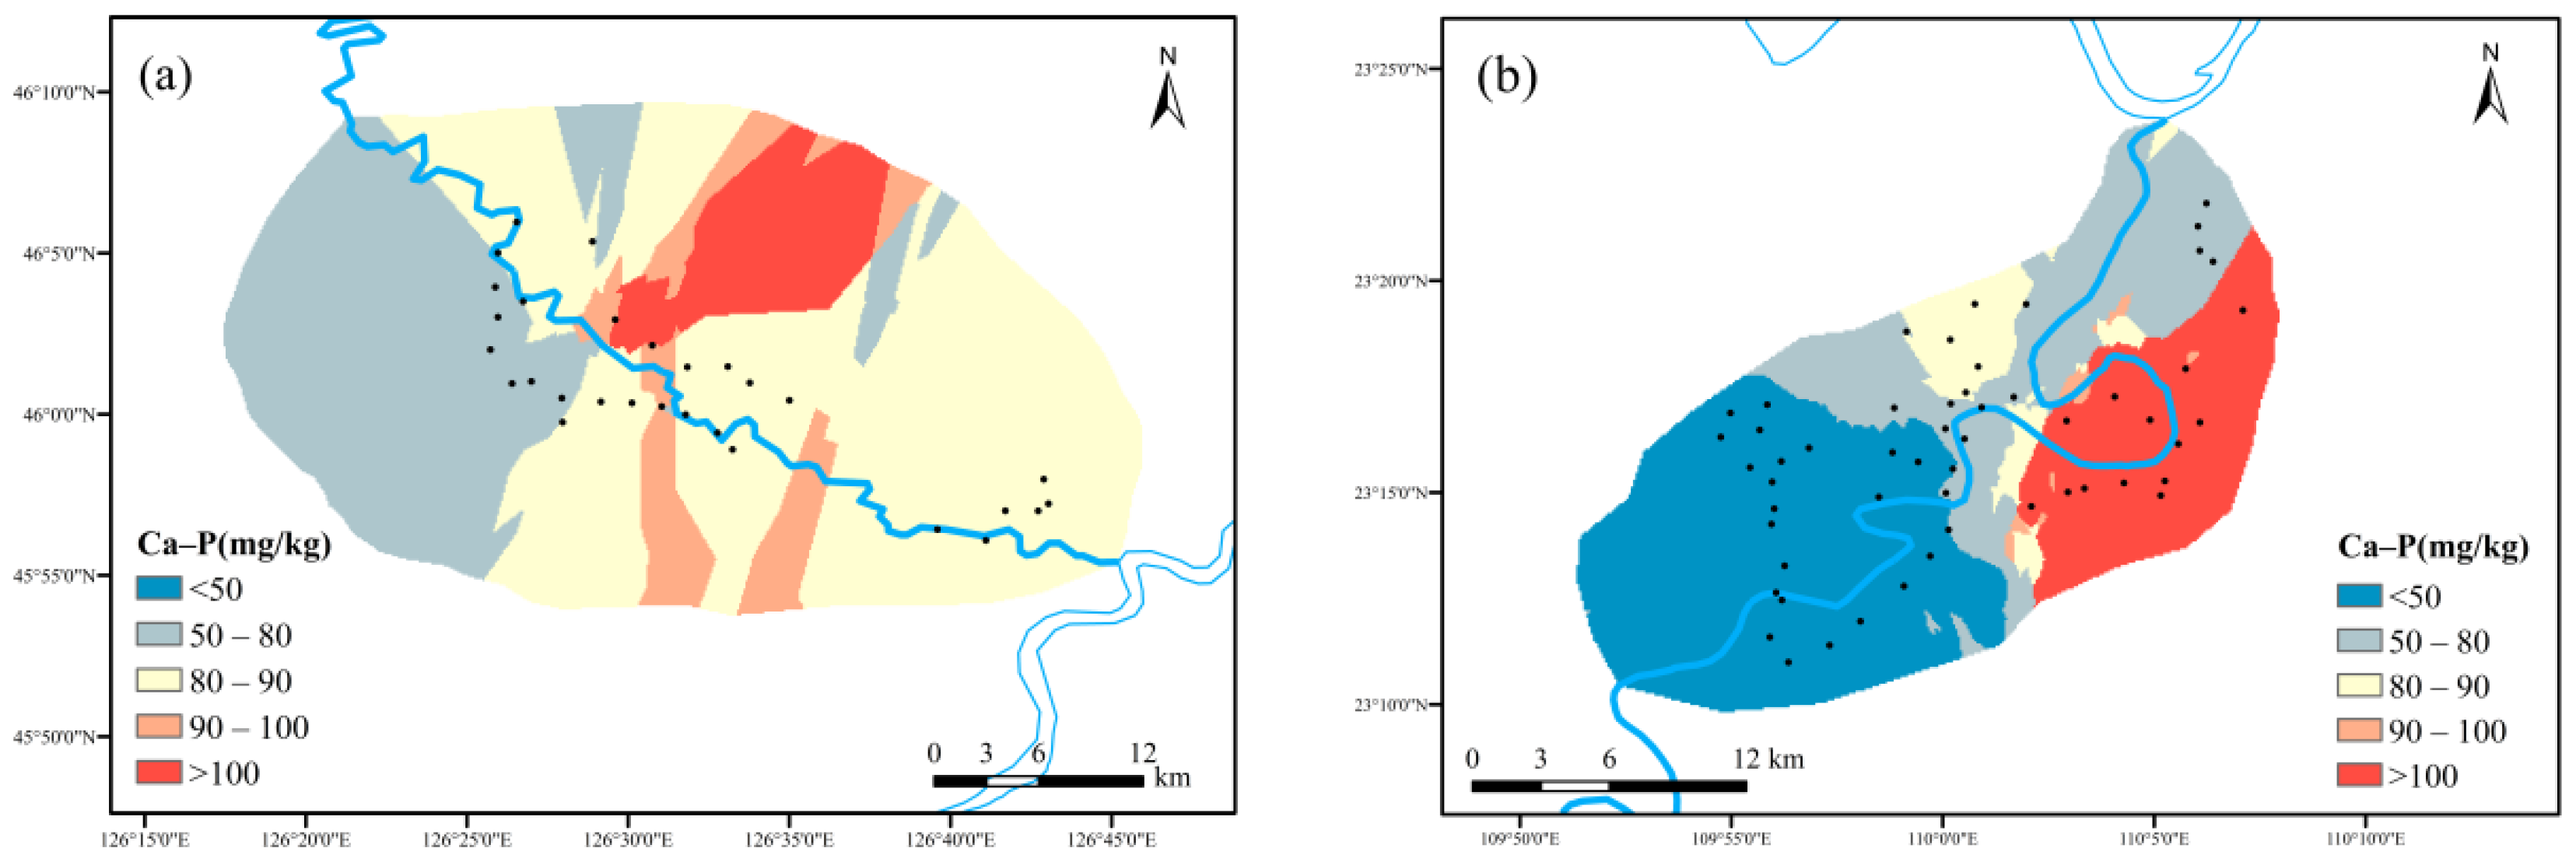
- Spatial distribution characteristics of Ex-P, Fe/Al-P and Ca-P
3.4. Risk Assessment of Soil Nitrogen and Phosphorus Loss in Typical Fuel Ethanol Planting Areas
- Determination of source factors
- Determination of migration factors
3.4.1. Risk Assessment of Soil Nitrogen Loss
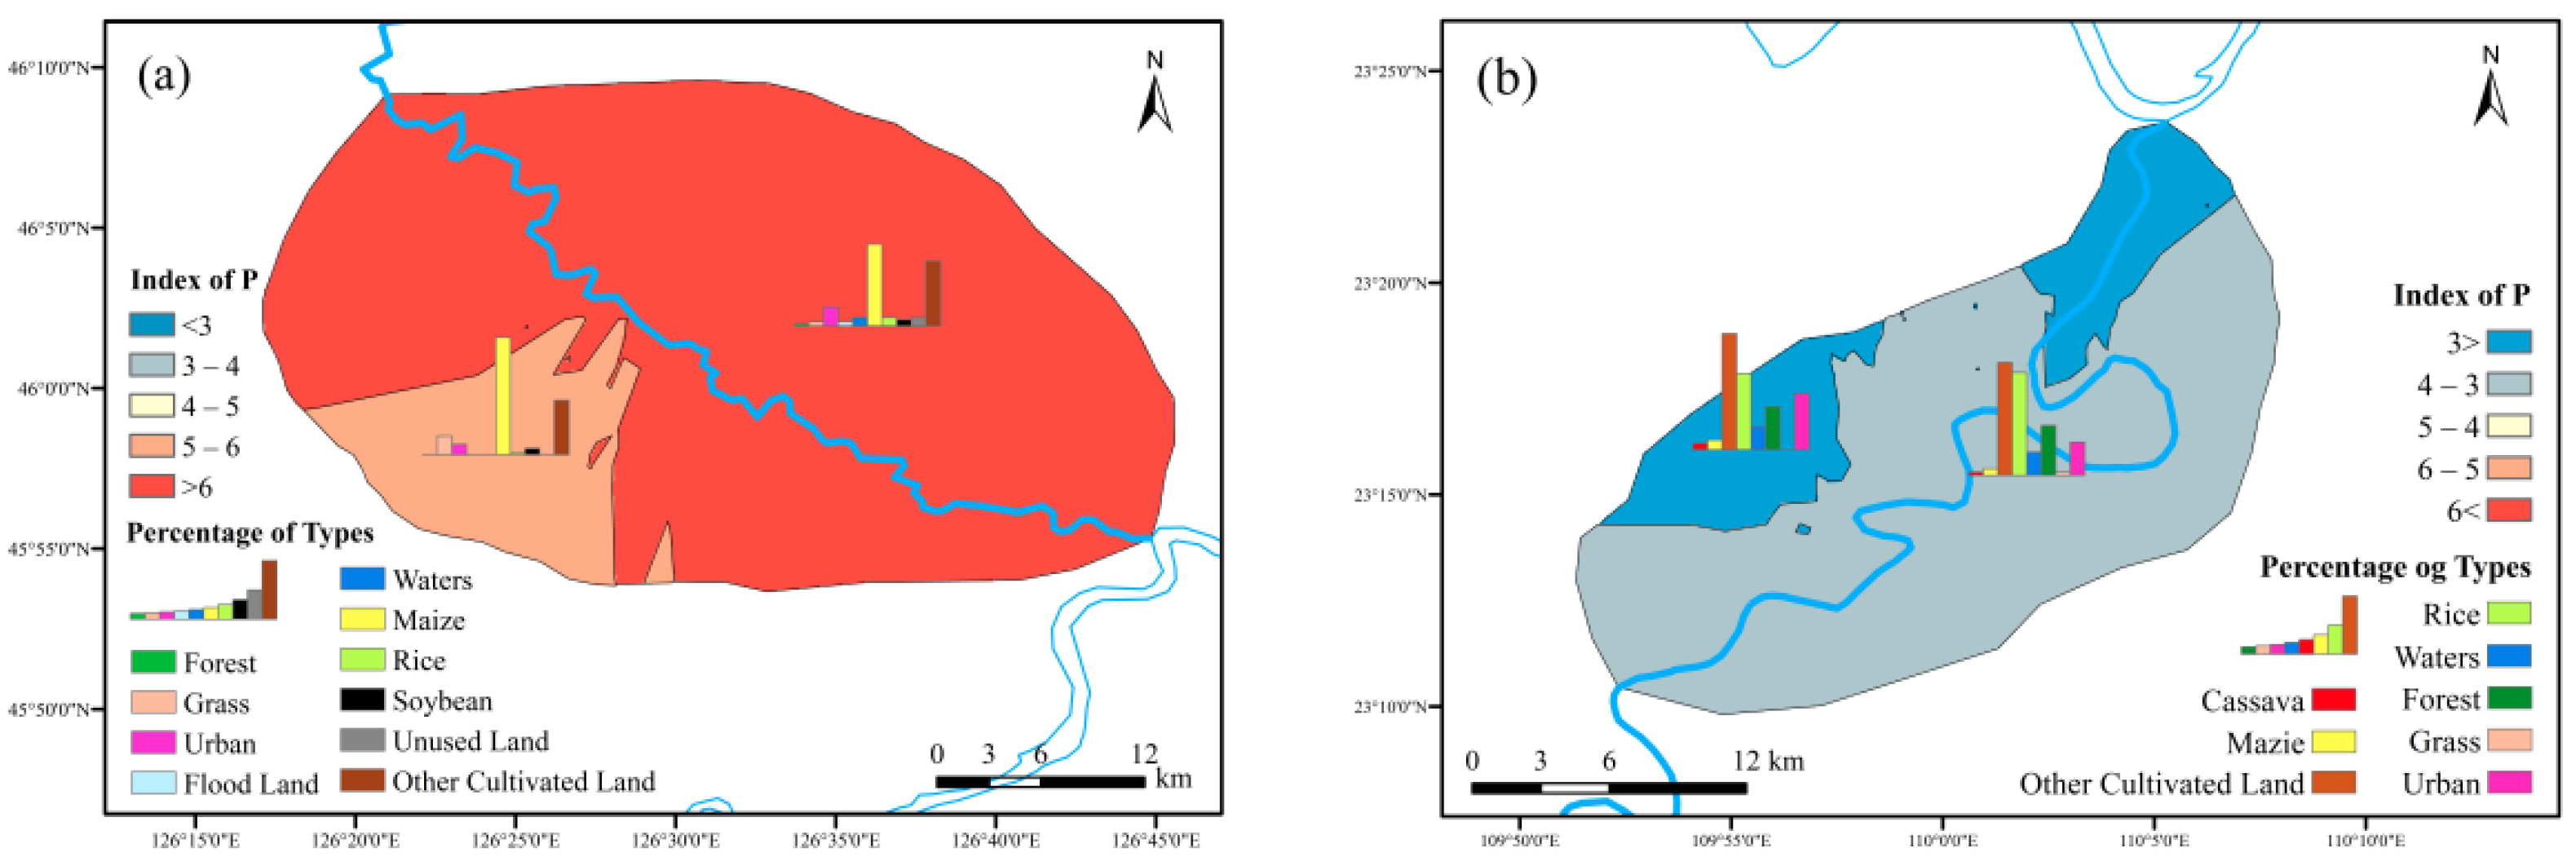
3.4.2. Risk Assessment of Soil Phosphorus Loss
4. Conclusions
- TN pollution was serious in Harbin section of the Hulan River, and the TP concentrations of some sample points could not meet the standard of water functional area. The water quality indexes of the Yujiang River were significantly better. The river pollution in maize planting area was greatly affected by TN, TP, Ex-P and Fe/Al-P in soil, while soil TN and NO3−-N were the main factors influencing the water pollution of the Yujiang river.
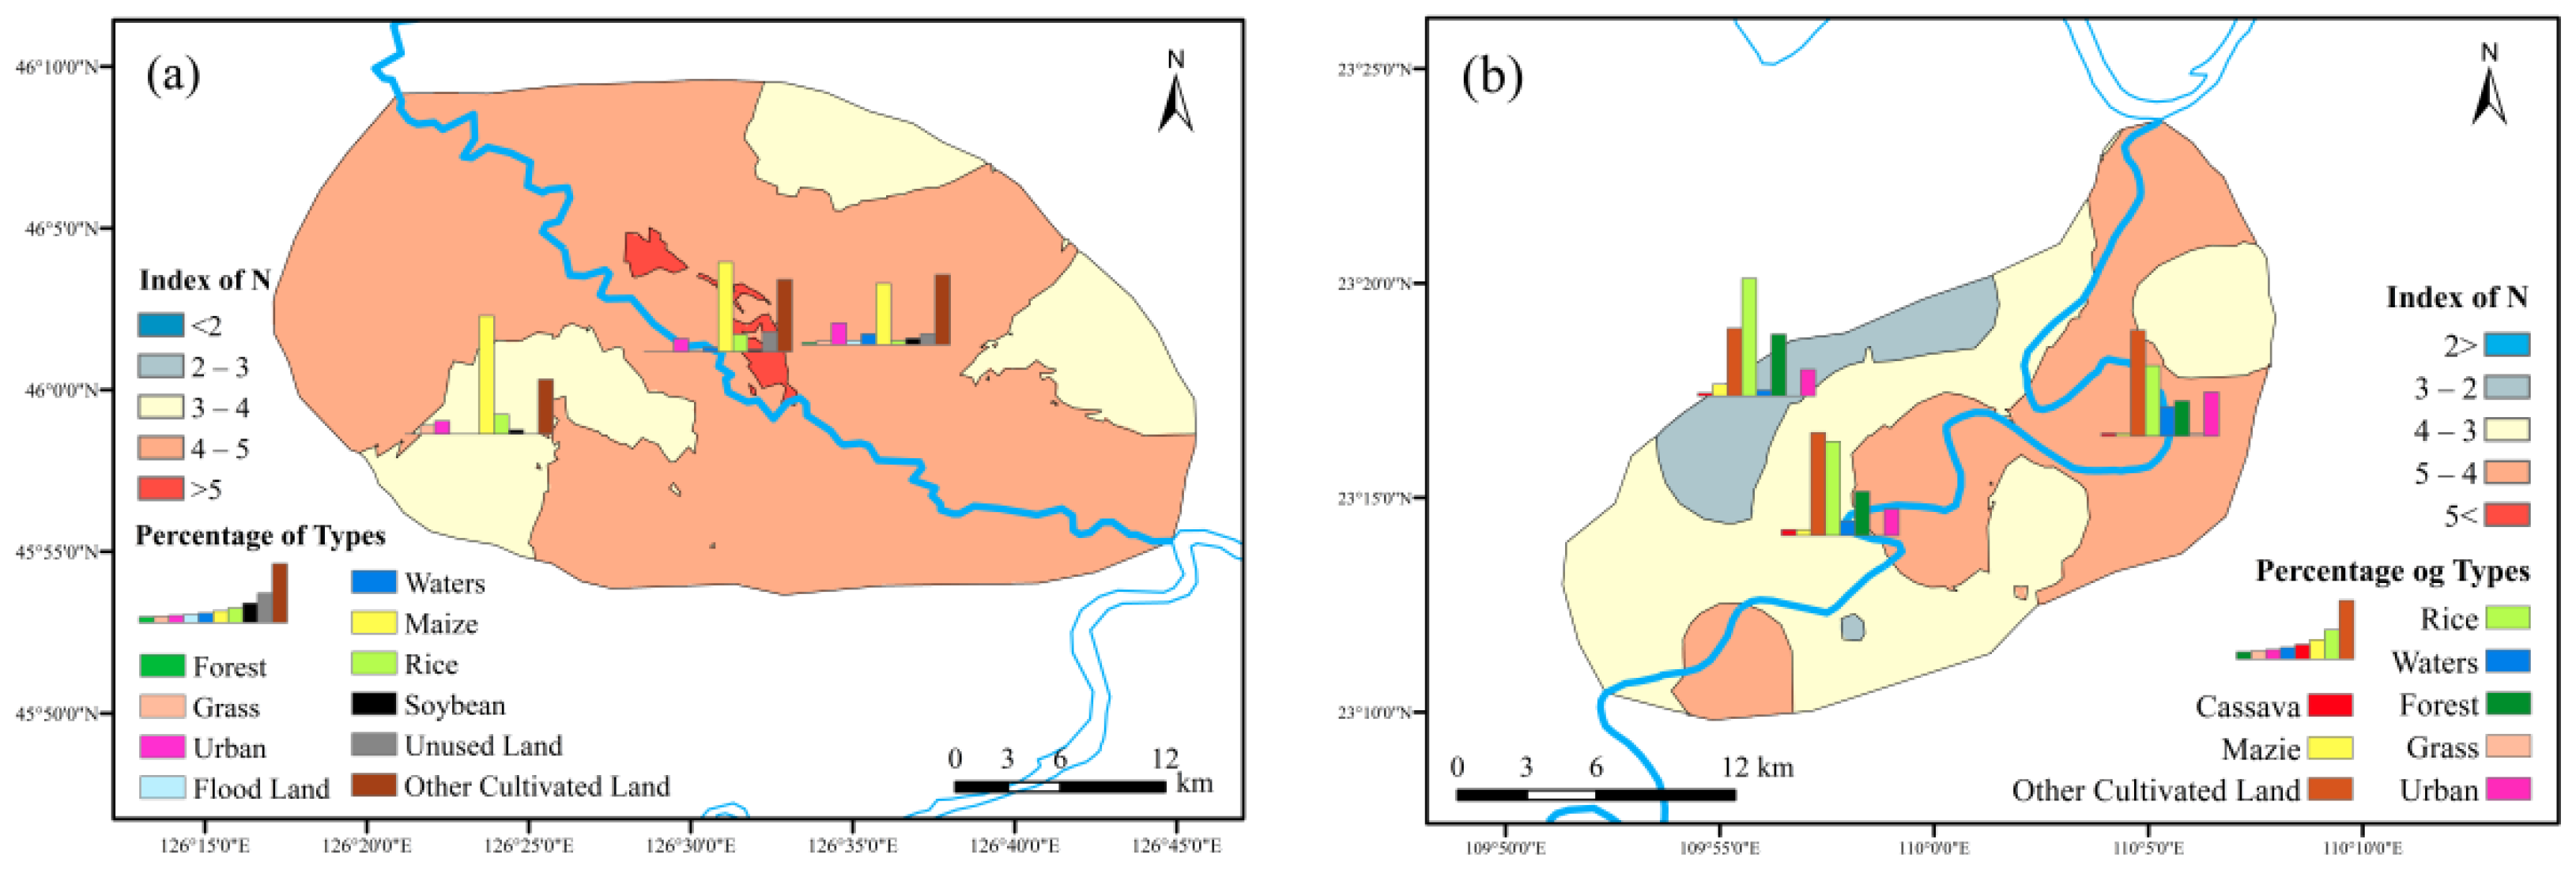
- The spatial distribution of nitrogen and phosphorus loss risk assessment revealed that most of the maize planting areas were at medium or high nitrogen loss risk, and the overall risk was higher than that of cassava planting area in the Guiping section. For planting suggestions of both areas, other cultivated land should be considered the conversion to patterns such as forest, grassland or crops including cassava, maize or soybeans. Rice needed more deep discusses to balance the nitrogen and phosphorus loss.
Supplementary Materials
Author Contributions
Funding
Institutional Review Board Statement
Informed Consent Statement
Data Availability Statement
Acknowledgments
Conflicts of Interest
References
- Sharma, S.; Kundu, A.; Basu, S.; Shetti, N.P.; Aminabhavi, T.M. Sustainable environmental management and related biofuel technologies. J. Environ. Manag. 2020, 273, 111096. [Google Scholar] [CrossRef] [PubMed]
- Cao, Y.; Liu, Y.; Hu, N.; Hu, X.; Zhang, Y.; Zhao, Y.; Wu, A. Development status analysis and Prospect of fuel ethanol. Biotech. Bull. 2019, 35, 163–169. [Google Scholar] [CrossRef]
- Wang, M.; Tian, X.; Chen, B.; Lin, H.; Yue, G. A new model for the future development of biofuel ethanol industry. J. SSCAE 2020, 22, 47–54. [Google Scholar]
- Tian, Y.; Shan, M.; Kong, G.; Ma, L.; Shao, S. Research on the development strategy of biomass economy in China. J. SSCAE 2021, 23, 133–140. [Google Scholar]
- Qin, H.; Xu, J.; Kai, J.; Shu, Z. Application status and promotion suggestions of fuel ethanol in China. Chem. Manag. 2021, 4, 3–4. [Google Scholar] [CrossRef]
- Cui, G.; Wang, X.; Li, C.; Li, Y.; Yan, S.; Yang, Z. Water use efficiency and TN/TP concentrations as indicators for watershed land-use management: A case study in Miyun District, north China. Ecol. Indic. 2018, 92, 239–253. [Google Scholar] [CrossRef]
- Yan, S.; Wang, X.; Cai, Y.; Li, C.; Yan, R.; Cui, G.; Yang, Z. An Integrated Investigation of Spatiotemporal Habitat Quality Dynamics and Driving Forces in the Upper Basin of Miyun Reservoir, North China. Sustainability 2018, 10, 4625. [Google Scholar] [CrossRef] [Green Version]
- Xu, Y.; Wang, X.; Bai, J.; Wang, D.; Wang, W.; Guan, Y. Estimating the Spatial Distribution of Soil Total Nitrogen and Available Potassium in Coastal Wetland Soils in the Yellow River Delta by Incorporating Multi-Source Data. Ecol. Indic. 2020, 111, 106002. [Google Scholar] [CrossRef]
- Song, X.; Zhang, J.; Peng, C.; Li, D. Replacing nitrogen fertilizer with nitrogen-fixing cyanobacteria reduced nitrogen leaching in red soil paddy fields. Agric. Ecosyst. Environ. 2021, 312, 107320. [Google Scholar] [CrossRef]
- Mahdi, G.; Abbas, R.; Mohammad, E.B. Comprehensive risk assessment of river basins using Fault Tree Analysis. J. Hydrol. 2019, 577, 123974. [Google Scholar] [CrossRef]
- Sun, S.; Zhang, J.; Cai, C.; Cai, Z.; Li, X.; Wang, R. Coupling of non-point source pollution and soil characteristics covered by Phyllostachys edulis stands in hilly water source area. J. Environ. Manag. 2020, 268, 110657. [Google Scholar] [CrossRef] [PubMed]
- Li, S.; Li, J.; Xia, J.; Hao, G. Optimal control of nonpoint source pollution in the Bahe River Basin, Northwest China, based on the SWAT model. Environ. Sci. Pollut. Res. 2021, 28, 55330–55343. [Google Scholar] [CrossRef]
- Li, Z.; Zhang, R.; Liu, C.; Zhang, R.; Chen, F.; Liu, Y. Phosphorus spatial distribution and pollution risk assessment in agricultural soil around the Danjiangkou reservoir, China. Sci. Total Environ. 2020, 699, 134417. [Google Scholar] [CrossRef] [PubMed]
- Kinnell, P.I.A. Event soil loss, runoff and the Universal Soil Loss Equation family of models: A review. J. Hydrol. 2010, 385, 384–397. [Google Scholar] [CrossRef]
- Zou, L.; Wang, Y.; Liu, Y.S. Spatial-temporal evolution of agricultural ecological risks in China in recent 40 years. Environ. Sci. Pollut. Res. 2021, 29, 3686–3701. [Google Scholar] [CrossRef] [PubMed]
- Li, Y.; Lv, L.; Xu, Y.; Zhou, R.; Han, X. Risk assessment of nitrogen and phosphorus loss in Small Watershed—A case study of Yishu River Basin. J. Water Resour. Hydropower Eng. 2020, 51, 171–176. [Google Scholar] [CrossRef]
- Benavidez, R.; Jackson, B.; Maxwell, D.; Norton, K. review of the (Revised) Universal Soil Loss Equation ((R) USLE), with a view to increasing its global applicability and improving soil loss estimates. Hydrol. Earth Syst. Sci. 2018, 22, 6059–6086. [Google Scholar] [CrossRef] [Green Version]
- Ouyang, W.; Hao, X.; Wang, L.; Xu, Y.; Mats, T.; Gao, X.; Lin, C. Watershed diffuse pollution dynamics and response to land development assessment with riverine sediments. Sci. Total Environ. 2019, 659, 283–292. [Google Scholar] [CrossRef]
- Prasannakumar, V.; Vijith, H.; Abinod, S.; Geetha, N. Estimation of soil erosion risk within a small mountainous sub-watershed in Kerala, India, using Revised Universal Soil Loss Equation (RUSLE) and geo-information technology. Geosci. Front. 2012, 3, 209–215. [Google Scholar] [CrossRef] [Green Version]
- Li, R.; Zou, Y.; Xu, J.; Ding, G. Distribution and loss risk assessment of farmland soil nitrogen and phosphorus in zhuangmu Town, Wabu Lake Basin. J. Environ. Sci. 2014, 35, 1051–1059. [Google Scholar] [CrossRef]
- Wang, B.; Yang, Q.; Liu, Z.; Meng, Q. Changes of soil erosion intensity before and after returning farmland in Yanhe River Basin. J. Sci. Soil Water Conserv. 2007, 4, 27–33. [Google Scholar] [CrossRef]
- Xie, J.; Li, T.; Liu, Y. Analysis of Seasonal Variation Characteristics of Hulan River Based on Comprehensive Water Quality Identification Index Method; China Water Resources and Hydropower Press: Nanjing, China, 2018; pp. 414–420. Available online: https://kns.cnki.net/kcms/detail/detail.aspx?FileName=CSWE201812001056&DbName=CPFD2021 (accessed on 18 December 2018).
- Ma, S.; Wang, H.; Wang, H.; Zhang, M.; Li, Y.; Bai, S.; Liang, X.; Sondergaard, M.; Jeppesen, E. Effects of nitrate on phosphorus release from lake sediments. Water Res. 2021, 194, 116894. [Google Scholar] [CrossRef] [PubMed]
- Li, J.; Li, C.; Yin, Z. ArcGIS Based Kriging Interpolation method and Its Application. J. Bull. Surv. Mapp. 2013, 9, 87–90. [Google Scholar]
- Gao, L.; Huang, M.; Zhang, W.; Zhang, W.; Qiao, L.; Wang, G.; Zhang, X. Comparative Study on Spatial Digital Mapping Methods of Soil Nutrients Based on Different Geospatial Technologies. Sustainability 2021, 13, 3270. [Google Scholar] [CrossRef]
- Ruttenberg, K. Development of a Sequential Extraction Method for Different Forms of Phosphorus in Marine Sediments. Limnol. Oceanogr. 1992, 37, 1460–1482. [Google Scholar] [CrossRef]
- Zhai, W.; Xu, L. Study on soil erodibility K value in typical black soil area of Northeast China. J. Chin. J. Soil Sci. 2011, 42, 1209–1213. [Google Scholar] [CrossRef]
- Gao, F. Quantitative Evaluation of Regional Soil Erosion Based on GIS and CSLE. Master’s Thesis, Guangxi Normal University, Guilin, China, 2014. Available online: https://kns.cnki.net/kcms/detail/detail.aspx?FileName=1014431056.nh&DbName=CMFD2015 (accessed on 11 November 2021).
- Li, B. A Preliminary Analysis of the Current Situation of Soil Erosion in Lishu County of Jilin Based on USLE Model. Master’s Thesis, Northeast Normal University, Changchun, China, 2015. Available online: https://kns.cnki.net/KCMS/detail/detail.aspx?dbname=CMFD201601&filename=1015418059.nh (accessed on 11 November 2021).


| Type | Content | Method/Instrument |
|---|---|---|
| Determination of water elements | TN | Alkaline potassium persulfate oxidation UV spectrophotometry |
| NH4+-N | Nessler reagent spectrophotometry | |
| NO3−-N | Ultraviolet spectrophotometry | |
| TP | Ammonium molybdate spectrophotometry | |
| Determination of soil nitrogen forms | NH4+-N | Nessler reagent spectrophotometry |
| NO3−-N | Ultraviolet spectrophotometry | |
| TN | Element analyzer | |
| Determination of phosphorus forms | TP | SMT UV Spectrophotometry |
| Ex-P | ||
| Fe/Al-P | ||
| Ca-P | SMT visible spectrophotometry |
| Factor | Weight | Lower 1 | Low 2 | Medium 4 | High 8 | Higher 10 |
|---|---|---|---|---|---|---|
| TN | 0.4 | <1200 | 1200~1500 | 1500~1800 | 1800~2500 | >2500 |
| Application rate | 0.9 | 0~100 | 100~200 | 200~400 | 400~600 | >600 |
| Method | 0.8 | Buried | Scatter | Surface | Surface | Surface |
| Period | 0.7 | Early spring | Summer | Late summer | Summer and Fall | Summer |
| Factor | Weight | Lower 0.6 | Low 0.7 | Medium 0.8 | High 0.9 | Higher 1.0 |
| Soil erosion | 1 | <2 | 2~10 | 10~25 | 25~50 | >50 |
| Distance from river | 1 | <3 | 2~3 | 1~2 | 0.5~1 | <0.5 |
| Factor | Weight | Lower 1 | Low 2 | Medium 4 | High 8 | Higher 10 |
|---|---|---|---|---|---|---|
| TP | 0.4 | <500 | 500~700 | 700~900 | 900~1000 | >1000 |
| Application rate | 0.9 | 0~30 | 30~100 | 100~150 | 150~200 | >200 |
| Method | 0.8 | Buried | Scatter | Surface (after planting) | Surface (within a month) | Surface (after a month) |
| Period | 0.7 | Early spring | Summer | Late summer | Summer and Fall | Summer |
| Factor | Weight | Lower 0.6 | Low 0.7 | Medium 0.8 | High 0.9 | Higher 1.0 |
| Soil erosion | 1 | <2 | 2~10 | 10~25 | 25~50 | >50 |
| Distance from river | 1 | <3 | 2~3 | 1~2 | 0.5~1 | <0.5 |
| Principal Component 1 | Principal Component 2 | Principal Component 3 | |
|---|---|---|---|
| TN | 0.950 | 0.264 | −0.046 |
| NH4+-N | 0.957 | 0.174 | −0.066 |
| NO3−-N | 0.192 | 0.956 | −0.053 |
| TP | 0.161 | 0.922 | 0.041 |
| TOC | −0.095 | −0.304 | 0.821 |
| COD | 0.080 | 0.116 | 0.694 |
| Turbidity | 0.576 | −0.134 | −0.045 |
| Characteristic value | 2.910 | 1.608 | 1.183 |
| Variance (%) | 41.579 | 22.978 | 16.893 |
| Principal Component 1 | Principal Component 2 | Principal Component 3 | |
|---|---|---|---|
| TN | 0.026 | 0.832 | −0.125 |
| NH4+-N | −0.433 | 0.003 | 0.848 |
| NO3−-N | 0.832 | −0.112 | −0.018 |
| TP | 0.503 | 0.718 | 0.036 |
| PH | 0.903 | 0.237 | −0.049 |
| COD | 0.069 | −0.610 | −0.121 |
| Turbidity | 0.524 | −0.055 | 0.798 |
| Characteristic value | 2.508 | 1.412 | 1.350 |
| Variance (%) | 35.832 | 20.171 | 19.286 |
| Type | Nitrogenous Fertilizer (kg (mu·year)−1) | Phosphate Fertilizer (kg (mu·year)−1) | |
|---|---|---|---|
| Maize planting area | Maize | 7.32 | 0.53 |
| Soybean | 1.48 | 0.02 | |
| Rice | 23.54 | 2.86 | |
| Cassava planting area | Maize | 12.37 | 1.14 |
| Cassava | 0.8 | 0.1 | |
| Rice | 8.21 | 0.39 |
| Soil Type | Soil Erodible Factors K (t (hm2·a)−1) |
|---|---|
| Meadow black soil | 0.2489 |
| Meadow chernozem | 0.2501 |
| Acid purple soil | 0.0196 |
| Yellow latosolic red soil | 0.0065 |
| Paddy soil | 0.0185 |
| Risk Level | Lower | Low | Medium | High |
|---|---|---|---|---|
| Nitrogen index | <1 | 1~2 | 2~5 | >5 |
| Phosphorus index | <1 | 1~3 | 3~6 | >6 |
Publisher’s Note: MDPI stays neutral with regard to jurisdictional claims in published maps and institutional affiliations. |
© 2022 by the authors. Licensee MDPI, Basel, Switzerland. This article is an open access article distributed under the terms and conditions of the Creative Commons Attribution (CC BY) license (https://creativecommons.org/licenses/by/4.0/).
Share and Cite
Cui, G.; Liu, Y.; Wang, P.; Bai, X.; Wang, H.; Xu, Y.; Yang, M.; Dong, L. Distribution Characteristics and Risk Assessment of Agricultural Land Use Non-Point Source Pollution in Typical Biofuel Ethanol Planting Areas. Int. J. Environ. Res. Public Health 2022, 19, 1394. https://doi.org/10.3390/ijerph19031394
Cui G, Liu Y, Wang P, Bai X, Wang H, Xu Y, Yang M, Dong L. Distribution Characteristics and Risk Assessment of Agricultural Land Use Non-Point Source Pollution in Typical Biofuel Ethanol Planting Areas. International Journal of Environmental Research and Public Health. 2022; 19(3):1394. https://doi.org/10.3390/ijerph19031394
Chicago/Turabian StyleCui, Guannan, Yanfeng Liu, Pengfei Wang, Xinyu Bai, Haitao Wang, Yiming Xu, Meiqiong Yang, and Liming Dong. 2022. "Distribution Characteristics and Risk Assessment of Agricultural Land Use Non-Point Source Pollution in Typical Biofuel Ethanol Planting Areas" International Journal of Environmental Research and Public Health 19, no. 3: 1394. https://doi.org/10.3390/ijerph19031394
APA StyleCui, G., Liu, Y., Wang, P., Bai, X., Wang, H., Xu, Y., Yang, M., & Dong, L. (2022). Distribution Characteristics and Risk Assessment of Agricultural Land Use Non-Point Source Pollution in Typical Biofuel Ethanol Planting Areas. International Journal of Environmental Research and Public Health, 19(3), 1394. https://doi.org/10.3390/ijerph19031394