
Using Architectural Mapping to Understand Behavior and Space Utilization in a Surgical Waiting Room of a Safety Net Hospital

 , and
, and
Abstract
1. Introduction
2. Materials and Methods
2.1. Setting
2.2. Description of the Waiting Space
2.3. Architectural Mapping
2.4. Data Analysis
3. Results
3.1. Description of Observations
3.2. Patterns in Seat Occupancy: Direction of Seating
3.3. Patterns in Seat Occupancy: Chair Selection
3.4. Patterns in Seat Occupancy: Time of Day
3.5. Personal Items
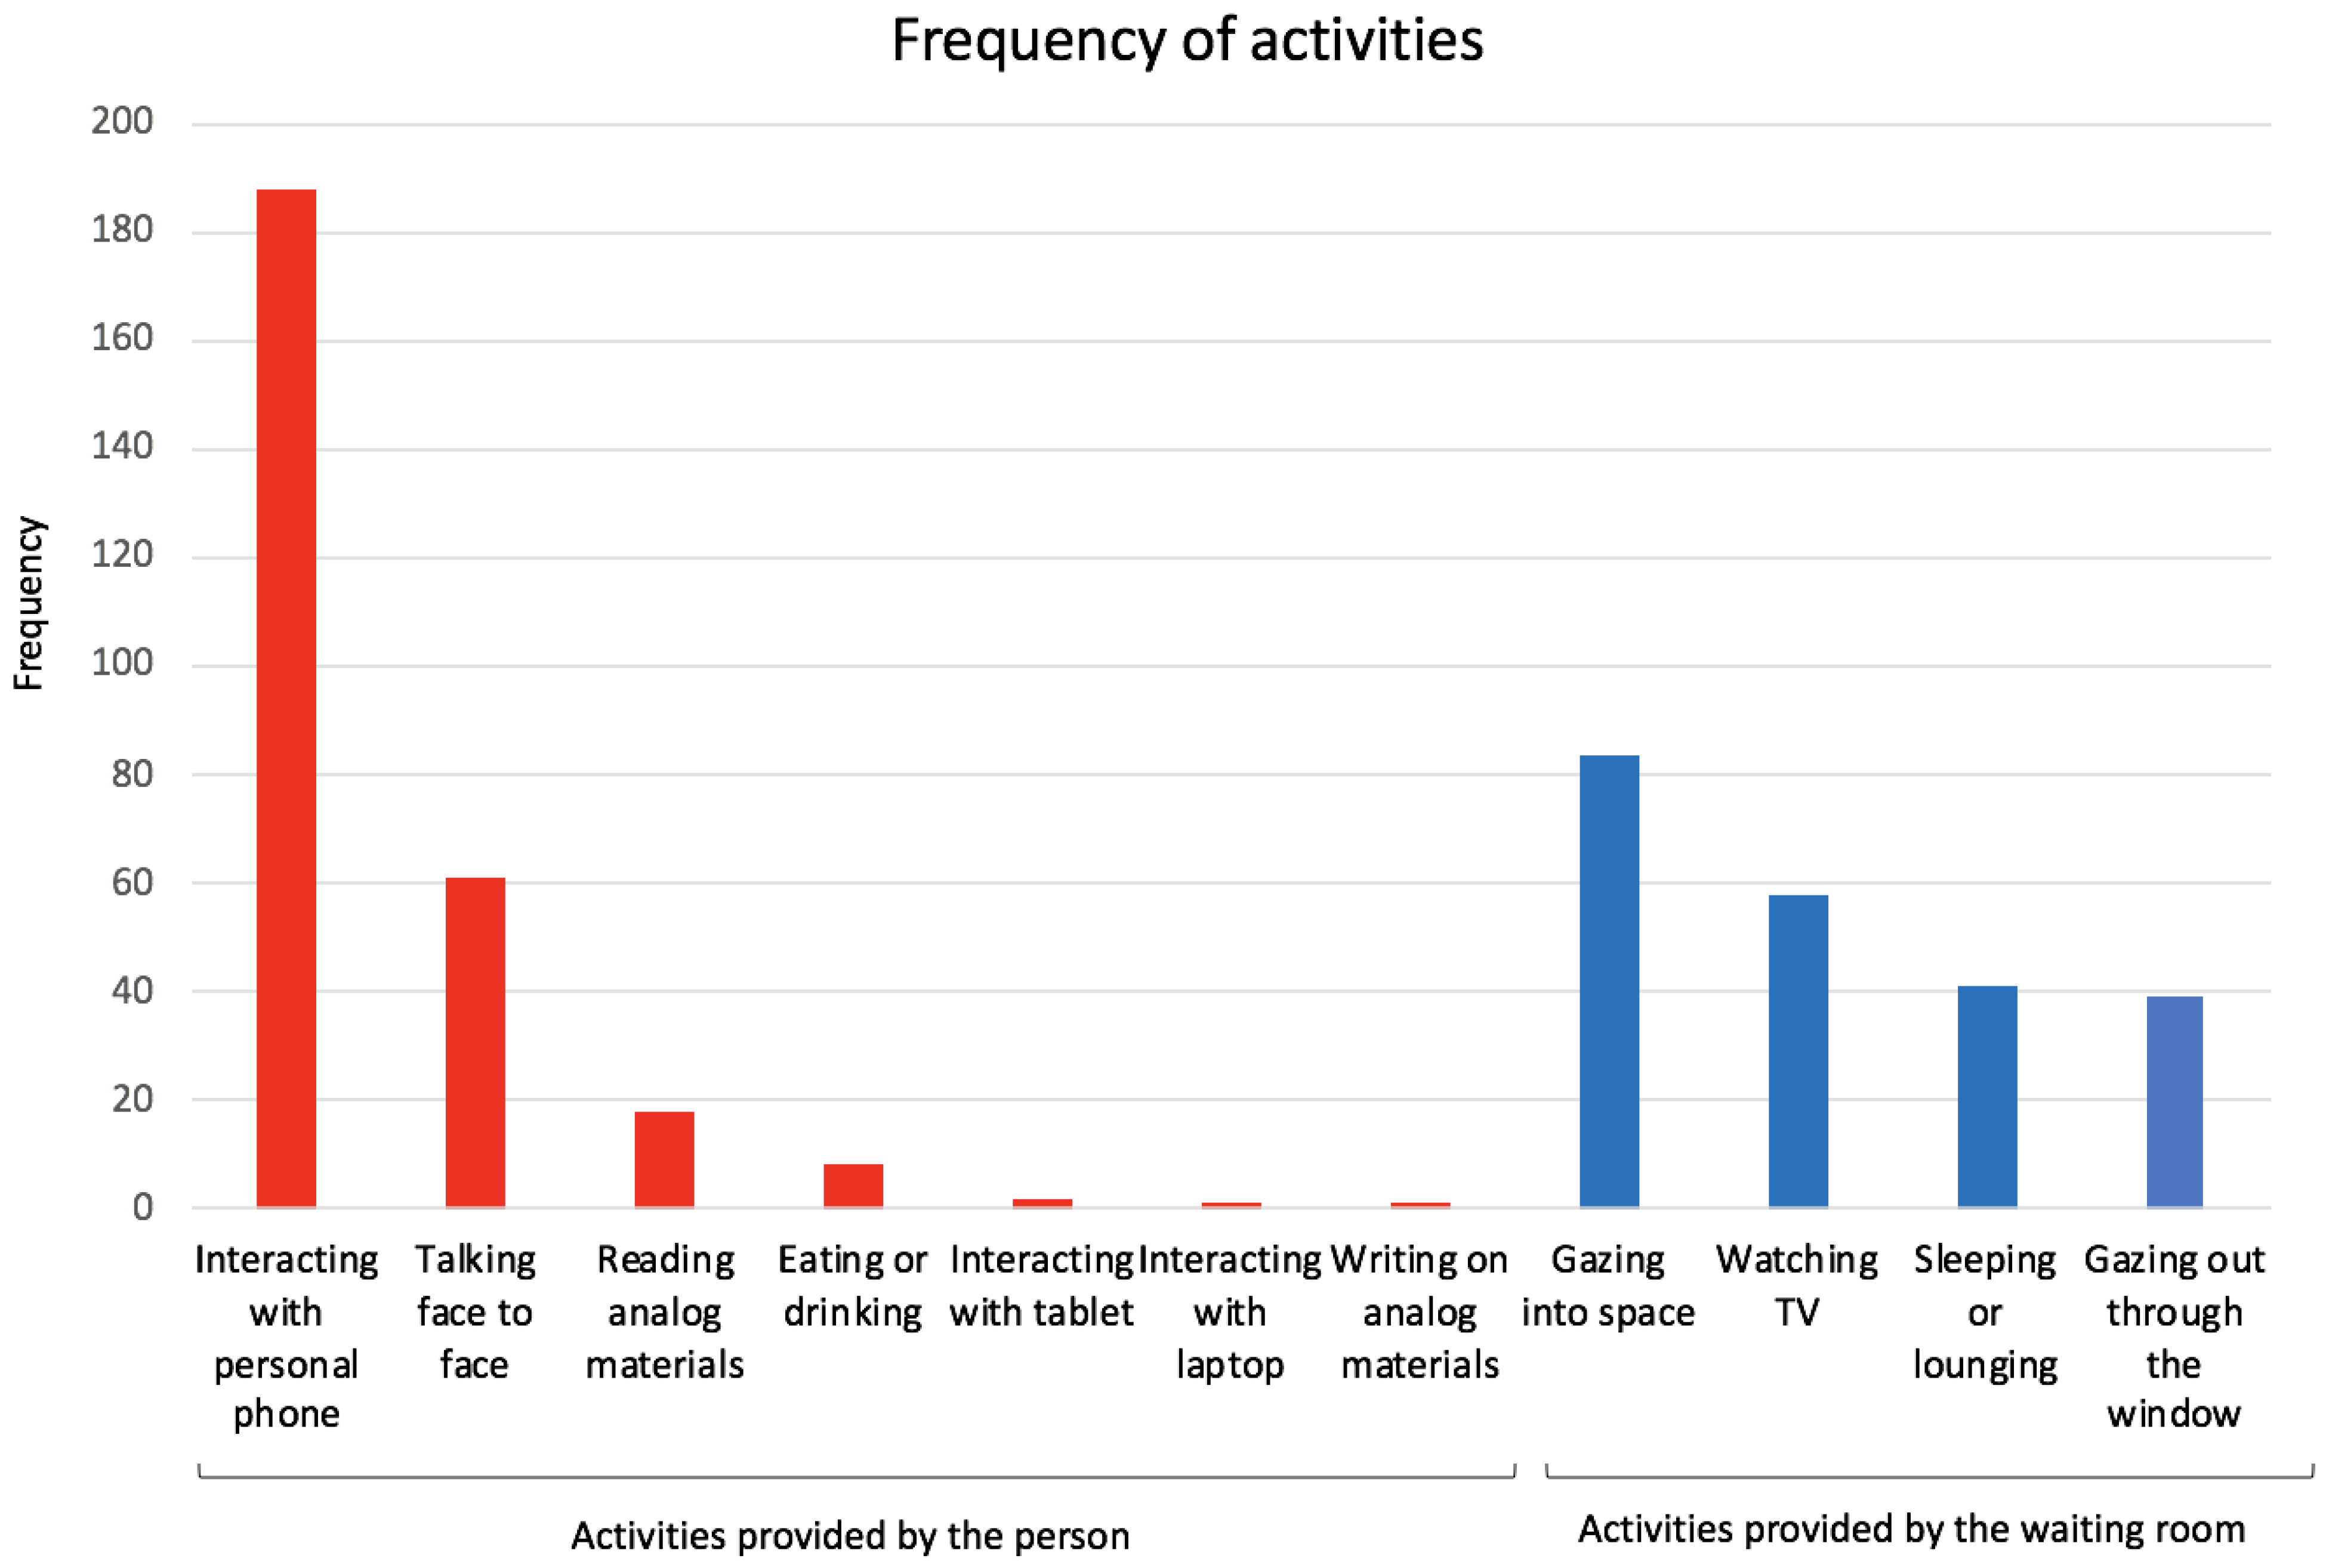
3.6. Activities
4. Discussion
5. Conclusions
Author Contributions
Funding
Institutional Review Board Statement
Informed Consent Statement
Data Availability Statement
Acknowledgments
Conflicts of Interest
References
- Steele, J.R.; Jones, A.K.; Clarke, R.K.; Shoemaker, S. Health Care Delivery Meets Hospitality: A Pilot Study in Radiology. J. Am. Coll. Radiol. 2015, 12, 587–593. [Google Scholar] [CrossRef] [PubMed]
- Morgan, J.R.I. Growing Negative Services. MIT Sloan Manag. Rev. 2006, 47, 69. [Google Scholar]
- Collins, P.B.; Coren, J.S.; Dinzeo, T.J.; Lehrman, S. Improving the Waiting Room Experience. Fam. Pract. Manag. 2020, 27, 14–18. [Google Scholar] [PubMed]
- Arneill, A.B.; Devlin, A.S. Perceived quality of care: The influence of the waiting room environment. J. Environ. Psychol. 2002, 22, 345–360. [Google Scholar] [CrossRef]
- Oostrom, T.; Einav, L.; Finkelstein, A. Outpatient Office Wait Times And Quality Of Care For Medicaid Patients. Health Aff. 2017, 36, 826–832. [Google Scholar] [CrossRef] [PubMed]
- Cheung, P.T.; Wiler, J.L.; Lowe, R.A.; Ginde, A.A. National study of barriers to timely primary care and emergency department utilization among Medicaid beneficiaries. Ann. Emerg Med. 2012, 60, 4–10. [Google Scholar] [CrossRef]
- Liao, E.N.; Chehab, L.Z.; Neville, K.; Liao, J.; Patel, D.; Sammann, A. Using a Human-Centered, Mixed Methods Approach to Understand the Patient Waiting Experience and Its Impact on Vulnerable Populations. Res. Sq. 2022. [Google Scholar] [CrossRef]
- Healthcare Pain Index 2019. Available online: https://www.qualtrics.com/m/assets/wp-content/uploads/2019/11/Healthcare_PI_Report.pdf. (accessed on 24 February 2022).
- Wright, S. From ‘holding pen’ to ‘a space to breathe’: Affective landscapes in a newly-integrated sexual health clinic. Sociol. Health Illn. 2019, 41, 806–820. [Google Scholar] [CrossRef]
- Chu, H.; Westbrook, R.A.; Njue-Marendes, S.; Giordano, T.P.; Dang, B.N. The psychology of the wait time experience-what clinics can do to manage the waiting experience for patients: A longitudinal, qualitative study. BMC Health Serv. Res. 2019, 19, 1–10. [Google Scholar] [CrossRef]
- Fernandes, C.M.; Daya, M.R.; Barry, S.; Palmer, N. Emergency department patients who leave without seeing a physician: The Toronto Hospital experience. Ann. Emerg Med. 1994, 24, 1092–1096. [Google Scholar] [CrossRef]
- Oche, M.; Adamu, H. Determinants of patient waiting time in the general outpatient department of a tertiary health institution in north Western Nigeria. Ann. Med. Health Sci. Res. 2013, 3, 588–592. [Google Scholar] [CrossRef] [PubMed]
- Becker, F.; Douglass, S. The Ecology of the Patient Visit: Physical Attractiveness, Waiting Times, and Perceived Quality of Care. J. Ambul. Care Manag. 2008, 31, 128–141. [Google Scholar] [CrossRef] [PubMed]
- Xuan, X.; Li, Z.; Chen, X.; Cao, Y.; Feng, Z. Study of the Physical Environment of Waiting Areas and Its Effects on Patient Satisfaction, Experience, Perceived Waiting Time, and Behavior in China. HERD 2021, 14, 108–123. [Google Scholar] [CrossRef] [PubMed]
- Gilliam, M.L.; Martins, S.L.; Bartlett, E.; Mistretta, S.Q.; Holl, J.L. Development and testing of an iOS waiting room “app” for contraceptive counseling in a Title X family planning clinic. Am. J. Obstet. Gynecol. 2014, 211, 481.e1–481.e8. [Google Scholar] [CrossRef]
- Habermehl, N.; Diekroger, E.; Lazebnik, R.; Kim, G. Injury Prevention Education in the Waiting Room of an Underserved Pediatric Primary Care Clinic. Clin. Pediatr. 2019, 58, 73–78. [Google Scholar] [CrossRef]
- Henize, A.W.; Beck, A.F.; Klein, M.D.; Morehous, J.; Kahn, R.S. Transformation of a Pediatric Primary Care Waiting Room: Creating a Bridge to Community Resources. Matern. Child. Health J. 2018, 22, 779–785. [Google Scholar] [CrossRef]
- Khan, M.A.; Shah, S.; Grudzien, A.; Onyejekwe, N.; Banskota, P.; Karim, S.; Jin, J.; Kim, Y.; Gerber, B.S. A diabetes education multimedia program in the waiting room setting. Diabetes Ther. 2011, 2, 178–188. [Google Scholar] [CrossRef]
- Patel, D.; Sarlati, S.; Martin-Tuite, P.; Feler, J.; Chehab, L.; Texada, M.; Marquez, R.; Orellana, J.F.; Henderson, T.; Nwabuo, A.; et al. Designing an Information and Communications Technology Tool With and for Victims of Violence and Their Case Managers in San Francisco: Human-Centered Design Study. JMIR Mhealth Uhealth 2020, 8, e15866. [Google Scholar] [CrossRef]
- Fenko, A.; Loock, C. The influence of ambient scent and music on patients’ anxiety in a waiting room of a plastic surgeon. HERD 2014, 7, 38–59. [Google Scholar] [CrossRef]
- Joseph, A. The Impact of Light on Outcomes in Healthcare Settings; The Center for Health Design: Concord, CA, USA, 1 March 2022. [Google Scholar]
- López-Tarruella, J.; Llinares Millán, C.; Serra Lluch, J.; Iñarra Abad, S.; Wijk, H. Influence of Color in a Lactation Room on Users’ Affective Impressions and Preferences. HERD 2019, 12, 55–70. [Google Scholar] [CrossRef]
- Minckley, B.B. A study of noise and its relationship to patient discomfort in the recovery room. Nurs Res. 1968, 17, 247–250. [Google Scholar] [CrossRef] [PubMed]
- Frederic, E.; Johan, S.; Rolf, W.; Cyrille, D.; Alain, G.; Christian, L. Improving Patients Experience in Peadiatric Emergency Waiting Room. Stud. Health Technol. Inform. 2016, 1, 535–539. [Google Scholar] [CrossRef]
- Rondeau, K.V. Managing the clinic wait: An important quality of care challenge. J. Nurs. Care Qual. 1998, 13, 11–20. [Google Scholar] [CrossRef] [PubMed]
- Spechbach, H.; Rochat, J.; Gaspoz, J.M.; Lovis, C.; Ehrler, F. Patients’ time perception in the waiting room of an ambulatory emergency unit: A cross-sectional study. BMC Emerg. Med. 2019, 19, 41. [Google Scholar] [CrossRef]
- Taylor, B.W.; Wilcox, A.; Morrison, K.; Hiltz, M.A.; Campbell, M.; MacPhee, E.; Wentzell, M.; Gujar, S. Implementation of a Game-based Information System and e-Therapeutic Platform in a Pediatric Emergency Department Waiting Room: Preliminary Evidence of Benefit. Procedia Comput. Sci. 2015, 63, 332–339. [Google Scholar] [CrossRef][Green Version]
- Biddiss, E.; McPherson, A.; Shea, G.; McKeever, P. The design and testing of interactive hospital spaces to meet the needs of waiting children. HERD 2013, 6, 49–68. [Google Scholar] [CrossRef]
- Devlin, A.S.; Anderson, A.; Hession-Kunz, S.; Kelly, M.; Noble, L.; Zou, A. Magnitude Matters: Art Image Size and Waiting Time Impact Perceived Quality of Care. HERD 2020, 13, 140–153. [Google Scholar] [CrossRef]
- McLaughlan, R.; Sadek, A.; Willis, J. Attractions to Fuel the Imagination: Reframing Understandings of the Role of Distraction Relative to Well-Being in the Pediatric Hospital. HERD Health Environ. Res. Des. J. 2019, 12, 130–146. [Google Scholar] [CrossRef]
- Mihandoust, S.; Joseph, A.; Kennedy, S.; Macnaughton, P.; Woo, M. Exploring the Relationship between Window View Quantity, Quality, and Ratings of Care in the Hospital. Int. J. Environ. Res. Public Health 2021, 18, 10677. [Google Scholar] [CrossRef]
- Nanda, U.; Chanaud, C.; Nelson, M.; Zhu, X.; Bajema, R.; Jansen, B.H. Impact of Visual Art on Patient Behavior in the Emergency Department Waiting Room. J. Emerg. Med. 2012, 43, 172–181. [Google Scholar] [CrossRef]
- Barlas, D.; Sama, A.E.; Ward, M.F.; Lesser, M.L. Comparison of the auditory and visual privacy of emergency department treatment areas with curtains versus those with solid walls. Ann. Emerg. Med. 2001, 38, 135–139. [Google Scholar] [CrossRef]
- Jiang, S.; Powers, M.; Allison, D.; Vincent, E. Informing Healthcare Waiting Area Design Using Transparency Attributes: A Comparative Preference Study. HERD 2017, 10, 49–63. [Google Scholar] [CrossRef] [PubMed]
- Zeisel, J. Observing Environmental Behavior-Chapter 8. In Inquiry by Design: Tools for Environment-Behavior Research; CUP Archive: Cambridge, UK, 2016. [Google Scholar]
- Behavioral Mapping and Tracking-Research Methods for Environmental Psychology-Wiley Online Library. Available online: https://onlinelibrary.wiley.com/doi/10.1002/9781119162124.ch3 (accessed on 17 June 2022).
- Behavioral Mapping of Children’s Physical Activities and Social Behaviors in an Indoor Preschool Facility: Methodological Challenges in Revealing the Influence of Space in Play. International Journal of Health Geographics. Available online: https://ij-healthgeographics.biomedcentral.com/articles/10.1186/s12942-019-0191-y (accessed on 17 June 2022).
- Qi, Y.; Yan, Y.; Lau, S.S.; Tao, Y. Evidence-Based Design for Waiting Space Environment of Pediatric Clinics-Three Hospitals in Shenzhen as Case Studies. Int. J. Environ. Res. Public Health 2021, 18, 11804. [Google Scholar] [CrossRef]
- Jafarifiroozabadi, R.; Joshi, R.; Joseph, A.; Wingler, D. Perceived Usability of Seating in an Outpatient Waiting Area: A Combined Approach Utilizing Virtual Reality and Actual Seating Prototypes. HERD Health Environ. Res. Des. J. 2022, 15, 248–261. [Google Scholar] [CrossRef] [PubMed]
- Abraído-Lanza, A.F.; Céspedes, A.; Daya, S.; Flórez, K.R.; White, K. Satisfaction with health care among Latinas. J. Health Care Poor Underserved 2011, 22, 491–505. [Google Scholar] [CrossRef]
- Gotlieb, E.G.; Rhodes, K.V.; Candon, M.K. Disparities in Primary Care Wait Times in Medicaid versus Commercial Insurance. J. Am. Board Fam. Med. 2021, 34, 571–578. [Google Scholar] [CrossRef]
- Huq, F.; Nakamura, M.; Black, K.; Chubb, H.; Helfrich, Y. Association of dermatology wait times with insurance coverage in Michigan. Am. J. Manag. Care 2020, 26, 432–437. [Google Scholar] [CrossRef]
- Monstad, K.; Engesaeter, L.B.; Espehaug, B. Waiting time and socioeconomic status—An individual-level analysis. Health Econ. 2014, 23, 446–461. [Google Scholar] [CrossRef]
- Siciliani, L.; Verzulli, R. Waiting times and socioeconomic status among elderly Europeans: Evidence from SHARE. Health Econ. 2009, 18, 1295–1306. [Google Scholar] [CrossRef]
- Zakare-Fagbamila, R.T.; Park, C.; Dickson, W.; Cheng, T.Z.; Gottfried, O.N. The true penalty of the waiting room: The role of wait time in patient satisfaction in a busy spine practice. J. Neurosurg. Spine 2020, 33, 95–105. [Google Scholar] [CrossRef] [PubMed]
- DOTT-Home. Available online: https://www.dott-tool.com/ (accessed on 6 April 2022).
- Pati, D.; Nanda, U. Influence of Positive Distractions on Children in Two Clinic Waiting Areas. HERD Health Environ. Res. Des. J. 2011, 4, 124–140. [Google Scholar] [CrossRef] [PubMed]
- McKinnon, K.; Crofts, P.D.; Edwards, R.; Campion, P.D.; Edwards, R.H. The outpatient experience: Results of a patient feedback survey. Int. J. Health Care Qual. Assur. Inc. Leadersh Health Serv. 1998, 11, 156–160. [Google Scholar] [CrossRef] [PubMed]
- Ibrahim, F.; Harun, W.M.W.; Samad, M.H.A. The Waiting Space Environment: Perception by Design. Am. J. Eng. Appl. Sci. 2010, 3, 569–575. [Google Scholar] [CrossRef]
- Kutash, M.; Northrop, L. Family members’ experiences of the intensive care unit waiting room. J. Adv. Nurs. 2007, 60, 384–388. [Google Scholar] [CrossRef] [PubMed]
- Sommer, R. The Ecology of Privacy. Libr. Q. 1966, 36, 234–248. [Google Scholar] [CrossRef]
- Ossmann, M. Sommer Revisited: Seating Patterns in a Hospital Waiting Room. In Proceedings of the 43rd Environmental Design Research Association, Seattl, WA, USA, 30 May–2 June 2012; p. 214. [Google Scholar]


| Demographics | Patients Seen (n = 17,632) No. (%) |
|---|---|
| Age, average (standard deviation), years | 52.5 (15.3) |
| Gender | |
| - Female | 22,614 (34.8) |
| - Male | 11,412 (64.7) |
| - Unknown | 221 (0.3) |
| Race/Ethnicity | |
| - Hispanic | 1153 (6.5) |
| - Non-Hispanic Black | 3053 (17.3) |
| - Non-Hispanic Asian | 3285 (18.6) |
| - Non-Hispanic White | 4535 (25.7) |
| - Non-Hispanic Other | 5280 (30.0) |
| - Unknown or Decline to States | 326 (1.8) |
| Primary language | |
| - English | 11,695 (66.3) |
| - Spanish | 3303 (18.7) |
| - Cantonese | 1320 (7.5) |
| - Other language | 1166 (6.6) |
| - Unknown | 148 (0.84) |
| Family size | |
| - One member | 14,305 (81.1) |
| - Two members | 1807 (10.3) |
| - Three members | 678 (3.9) |
| - Four members | 521 (3.0) |
| - Greater than four members | 321 (1.8) |
| Income source | |
| - Professional/technical * | 343 (2.0) |
| - Labor/production ^ | 1144 (6.5) |
| - Service/sales | 2148 (12.2) |
| - Retirement income | 336 (1.9) |
| - Disability income | 822 (4.7) |
| - General or public assistance | 1023 (5.8) |
| - Other ** | 1049 (6.0) |
| - None | 10,767 (61.1) |
| Description | Frequency n (%) |
|---|---|
| Observations Involving People (n = 536) | |
| Patient | 408 (76) |
| Family Members | 125 (23) |
| Staff Members | 3 (1) |
| Observations Involving Personal Items (n = 179) | |
| Mobility related items (wheelchair, crutches, cast, walker, baby stroller) | 72 (40) |
| Purse or bag | 71 (40) |
| Miscellaneous (e.g., food, clothing) | 36 (2) |
| Seat Orientation | Seat Number | Occupation Frequency, % (n) |
|---|---|---|
| Facing the door | 2 | 10.9% (53) |
| Facing the door | 3 | 10.5% (51) |
| Facing the door | 4 | 9.7% (47) |
| Facing the TV | 6 | 9.7% (47) |
| Facing the TV | 7 | 9.0% (44) |
| Facing the door | 1 | 8.4% (41) |
| Facing the TV | 8 | 7.8% (38) |
| Facing the window | 12 | 7.8% (38) |
| Facing the window | 11 | 6.2% (30) |
| Facing the window | 9 | 5.7% (28) |
| Facing the window | 10 | 5.7% (28) |
| Facing the door | 5 | 3.9% (19) |
| In the hallway | 13 | 2.9% (14) |
| In the hallway | 14 | 1.0% (5) |
| In the hallway | 15 | 0.8% (4) |
| In the hallway | 16 | 0% (0) |
| Seat Number | Seat Orientation | Occupation Frequency by Patients (%, n) | Occupation Frequency by Family Members, % (n) |
|---|---|---|---|
| 1 | Facing the door | 7.8% (29) | 10.5% (12) |
| 2 | Facing the door | 10.8% (40) | 11.4% (13) |
| 3 | Facing the door | 10.2% (38) | 11.4% (13) |
| 4 | Facing the door | 10.0% (37) | 8.8% (10) |
| 5 | Facing the door | 3.8% (14) | 4.4% (5) |
| 6 | Facing the TV | 10.5% (39) | 7.0% (8) |
| 7 | Facing the TV | 10.0% (37) | 6.1% (7) |
| 8 | Facing the TV | 6.2% (23) | 12.3% (14) |
| 9 | Facing the window | 7.6% (28) | 0% (0) |
| 10 | Facing the window | 5.7% (21) | 7.1% (7) |
| 11 | Facing the window | 5.4% (20) | 8.8% (10) |
| 12 | Facing the window | 8.1% (30) | 7.0% (8) |
| 13 | In the hallway | 2.4% (9) | 3.5% (4) |
| 14 | In the hallway | 0.5% (2) | 1.8% (2) |
| 15 | In the hallway | 1.1% (4) | 1.0% (1) |
| 16 | In the hallway | 0% (0) | 0% (0) |
| Chair Type | Morning Clinic n (%) | Afternoon Clinic n (%) |
|---|---|---|
| Chairs facing the door | 119 (45) | 88 (45) |
| Chairs facing the TV | 69 (26) | 50 (25) |
| Chairs facing the window | 69 (26) | 48 (23) |
| Chairs facing the hallway | 8 (3) | 14 (7) |
Publisher’s Note: MDPI stays neutral with regard to jurisdictional claims in published maps and institutional affiliations. |
© 2022 by the authors. Licensee MDPI, Basel, Switzerland. This article is an open access article distributed under the terms and conditions of the Creative Commons Attribution (CC BY) license (https://creativecommons.org/licenses/by/4.0/).
Share and Cite
Liao, E.N.; Chehab, L.Z.; Ossmann, M.; Alpers, B.; Patel, D.; Sammann, A. Using Architectural Mapping to Understand Behavior and Space Utilization in a Surgical Waiting Room of a Safety Net Hospital. Int. J. Environ. Res. Public Health 2022, 19, 13870. https://doi.org/10.3390/ijerph192113870
Liao EN, Chehab LZ, Ossmann M, Alpers B, Patel D, Sammann A. Using Architectural Mapping to Understand Behavior and Space Utilization in a Surgical Waiting Room of a Safety Net Hospital. International Journal of Environmental Research and Public Health. 2022; 19(21):13870. https://doi.org/10.3390/ijerph192113870
Chicago/Turabian StyleLiao, Elizabeth N., Lara Z. Chehab, Michelle Ossmann, Benjamin Alpers, Devika Patel, and Amanda Sammann. 2022. "Using Architectural Mapping to Understand Behavior and Space Utilization in a Surgical Waiting Room of a Safety Net Hospital" International Journal of Environmental Research and Public Health 19, no. 21: 13870. https://doi.org/10.3390/ijerph192113870
APA StyleLiao, E. N., Chehab, L. Z., Ossmann, M., Alpers, B., Patel, D., & Sammann, A. (2022). Using Architectural Mapping to Understand Behavior and Space Utilization in a Surgical Waiting Room of a Safety Net Hospital. International Journal of Environmental Research and Public Health, 19(21), 13870. https://doi.org/10.3390/ijerph192113870