


An Examination of Child Pedestrian Rule Compliance at Crosswalks around Parks in Montreal, Canada

Abstract
1. Introduction
2. Factors Associated with Child Pedestrian Safety and Compliance
2.1. Individual Characteristics
2.2. Situational Characteristics
2.3. Behavioral Characteristics
2.4. Road Environment Characteristics
3. Methods
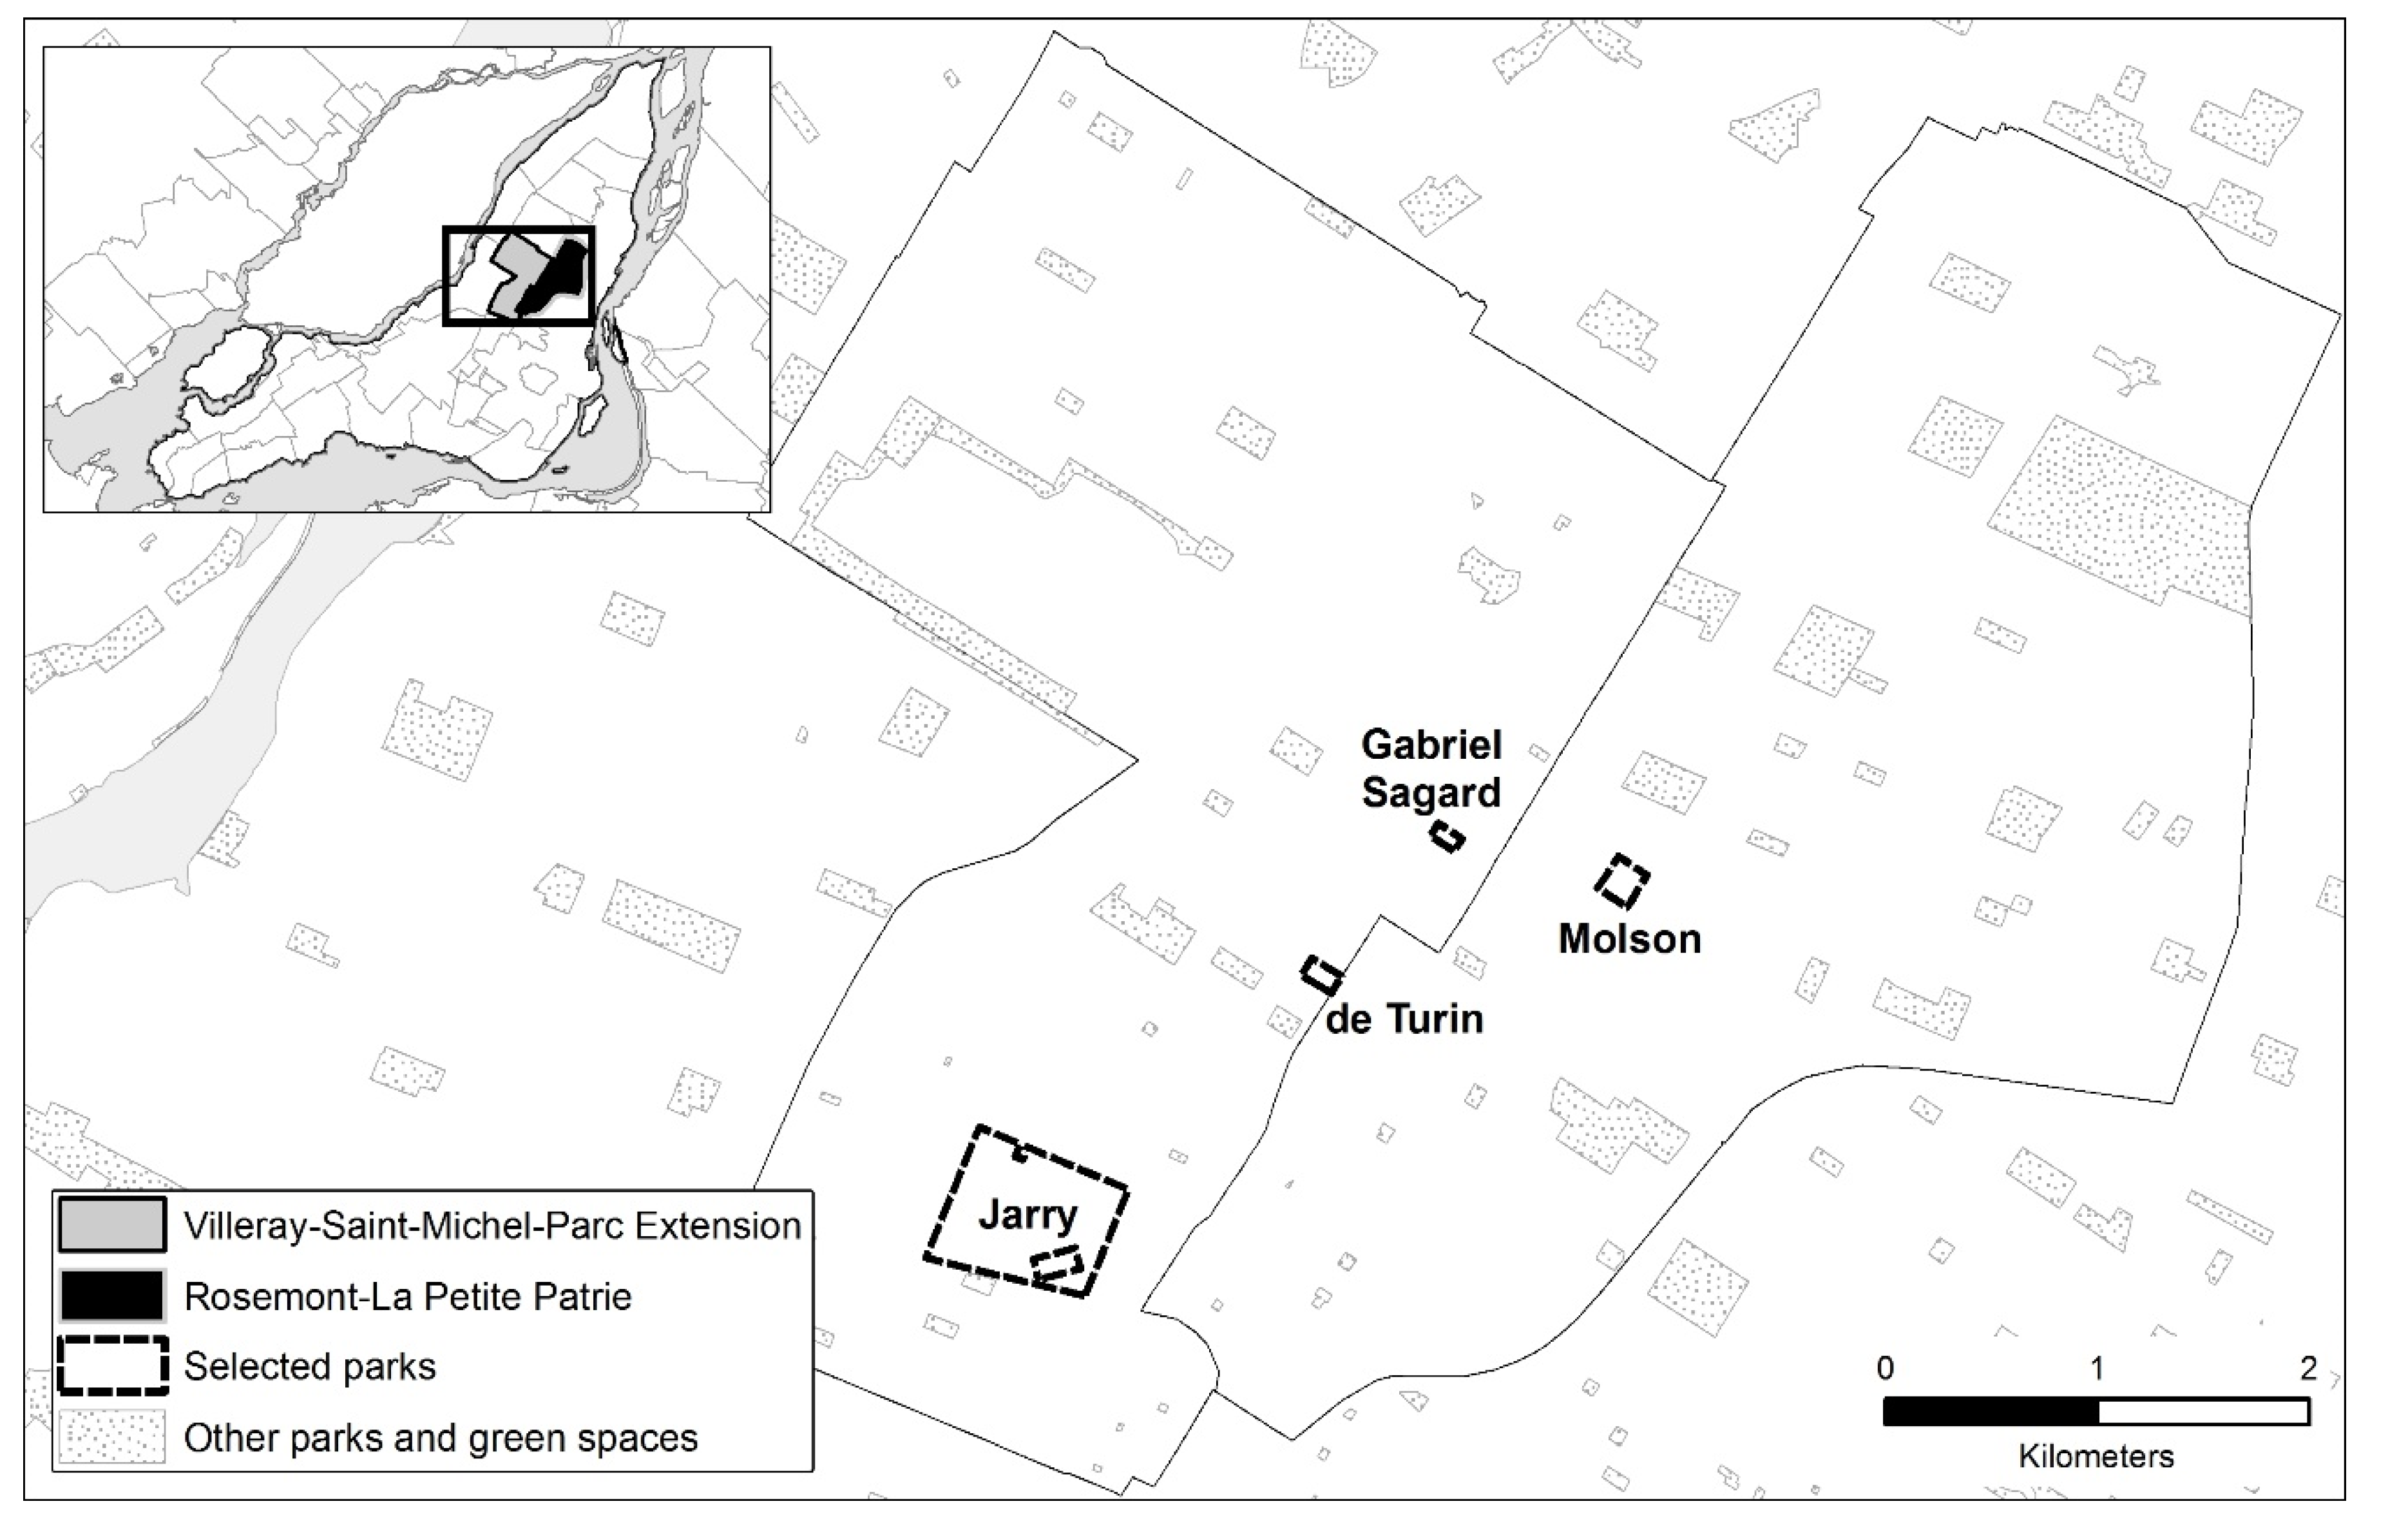
3.1. Site Selection
3.2. Observation Protocol
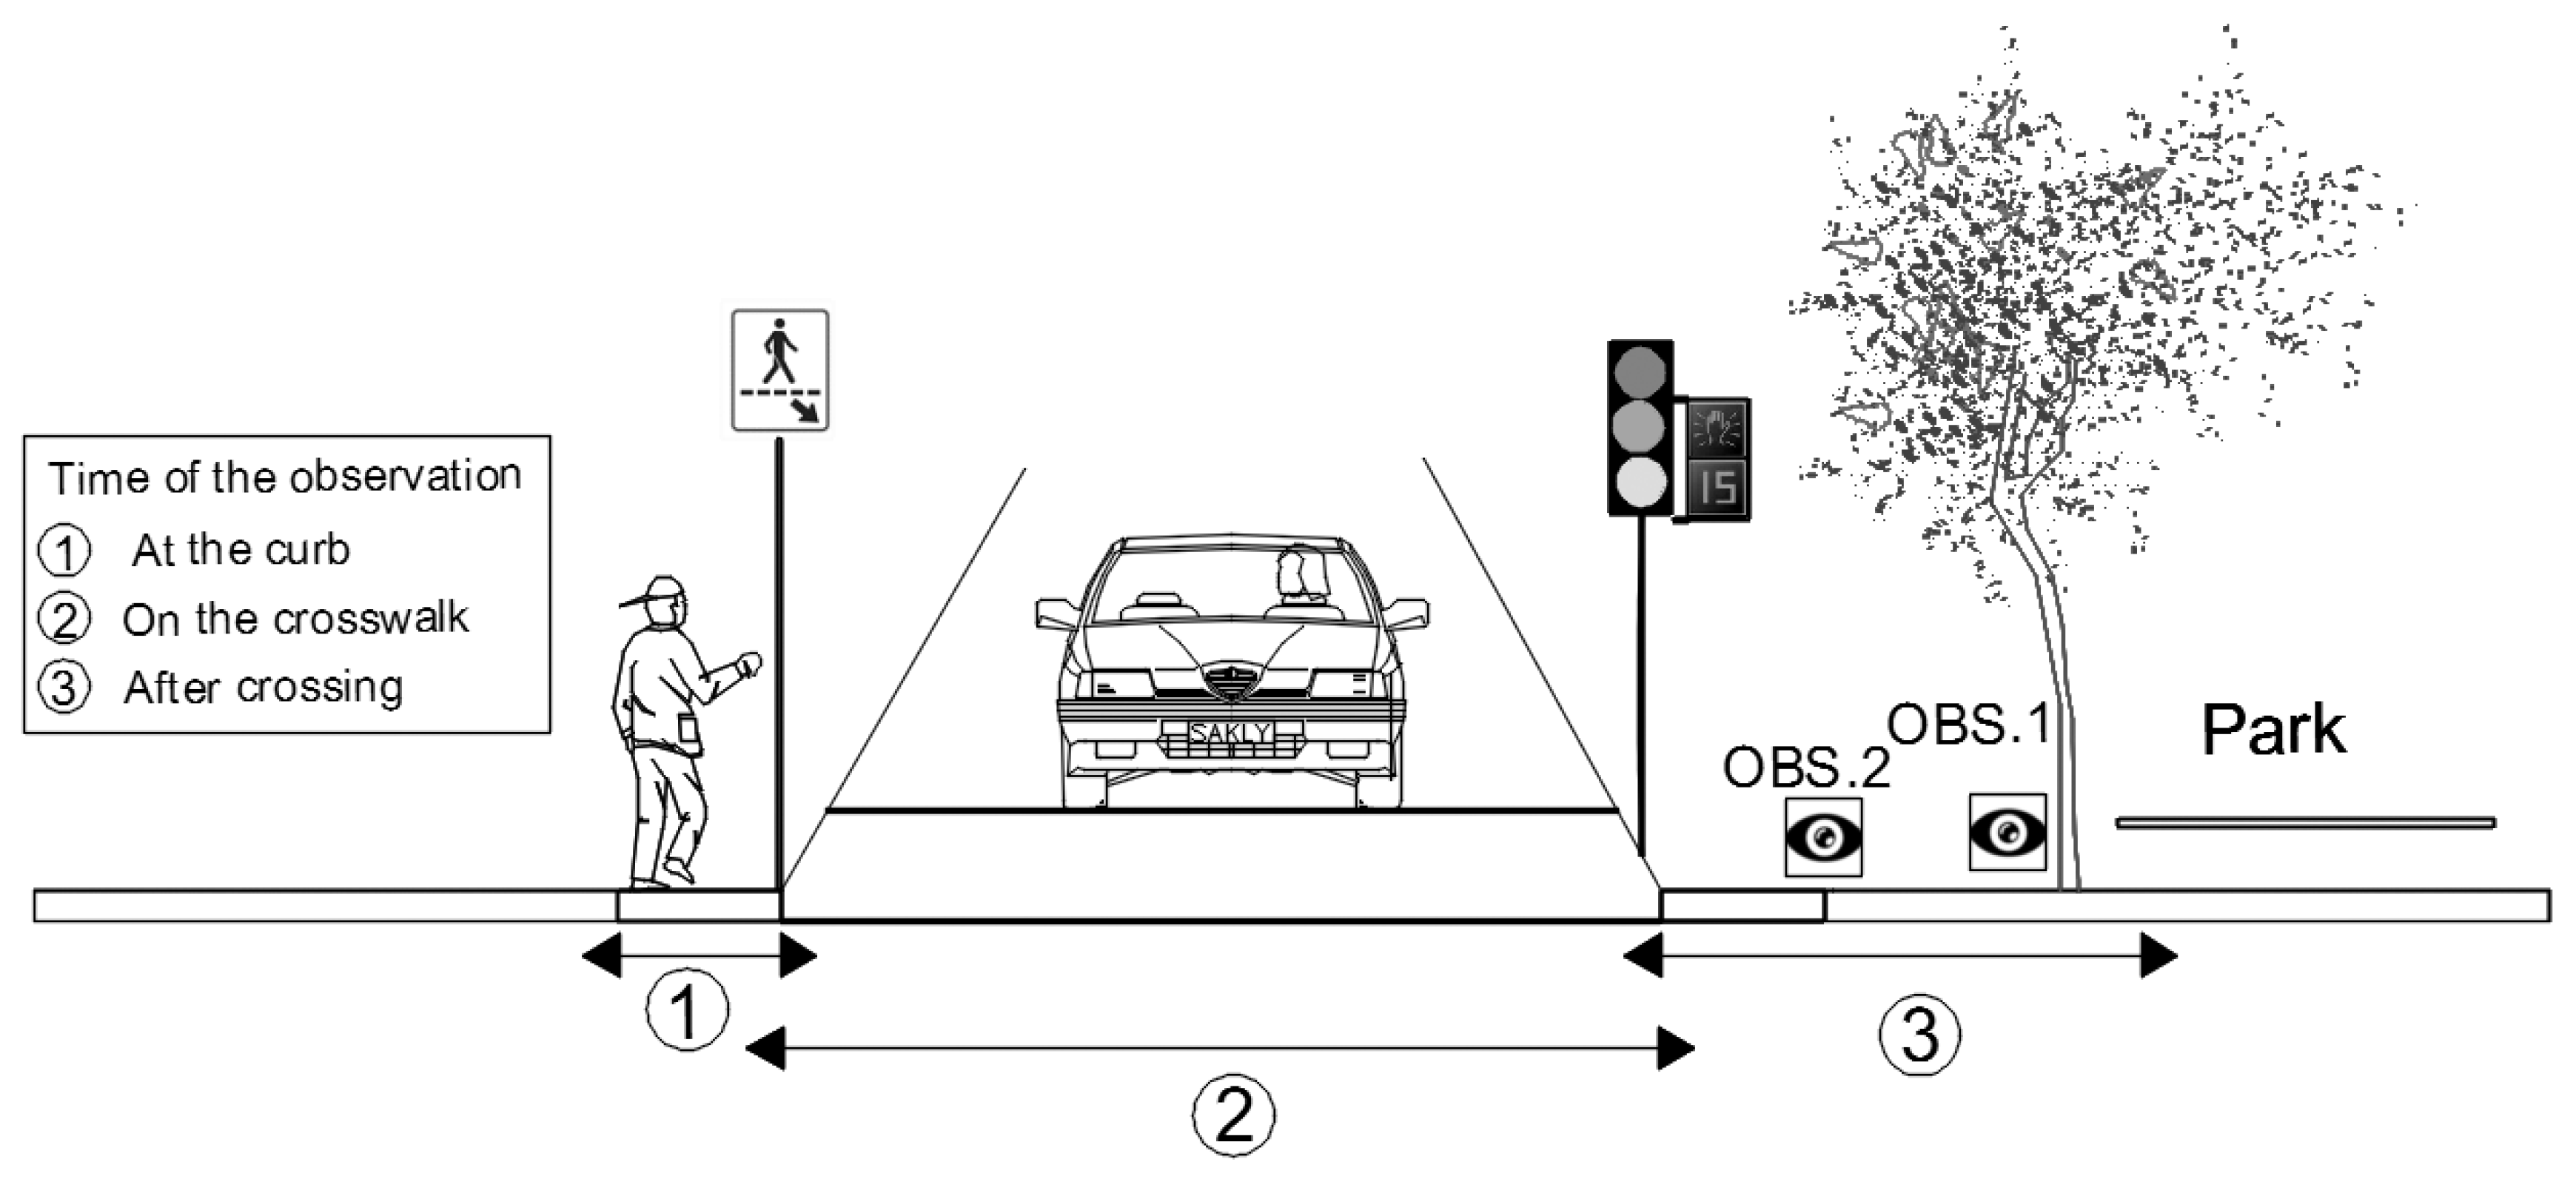
- Child pedestrian crossing behaviors were observed at three specific times (Figure 2): at the curb, on the crosswalk, after crossing. Other individual and situational characteristics were recorded for each observed children.
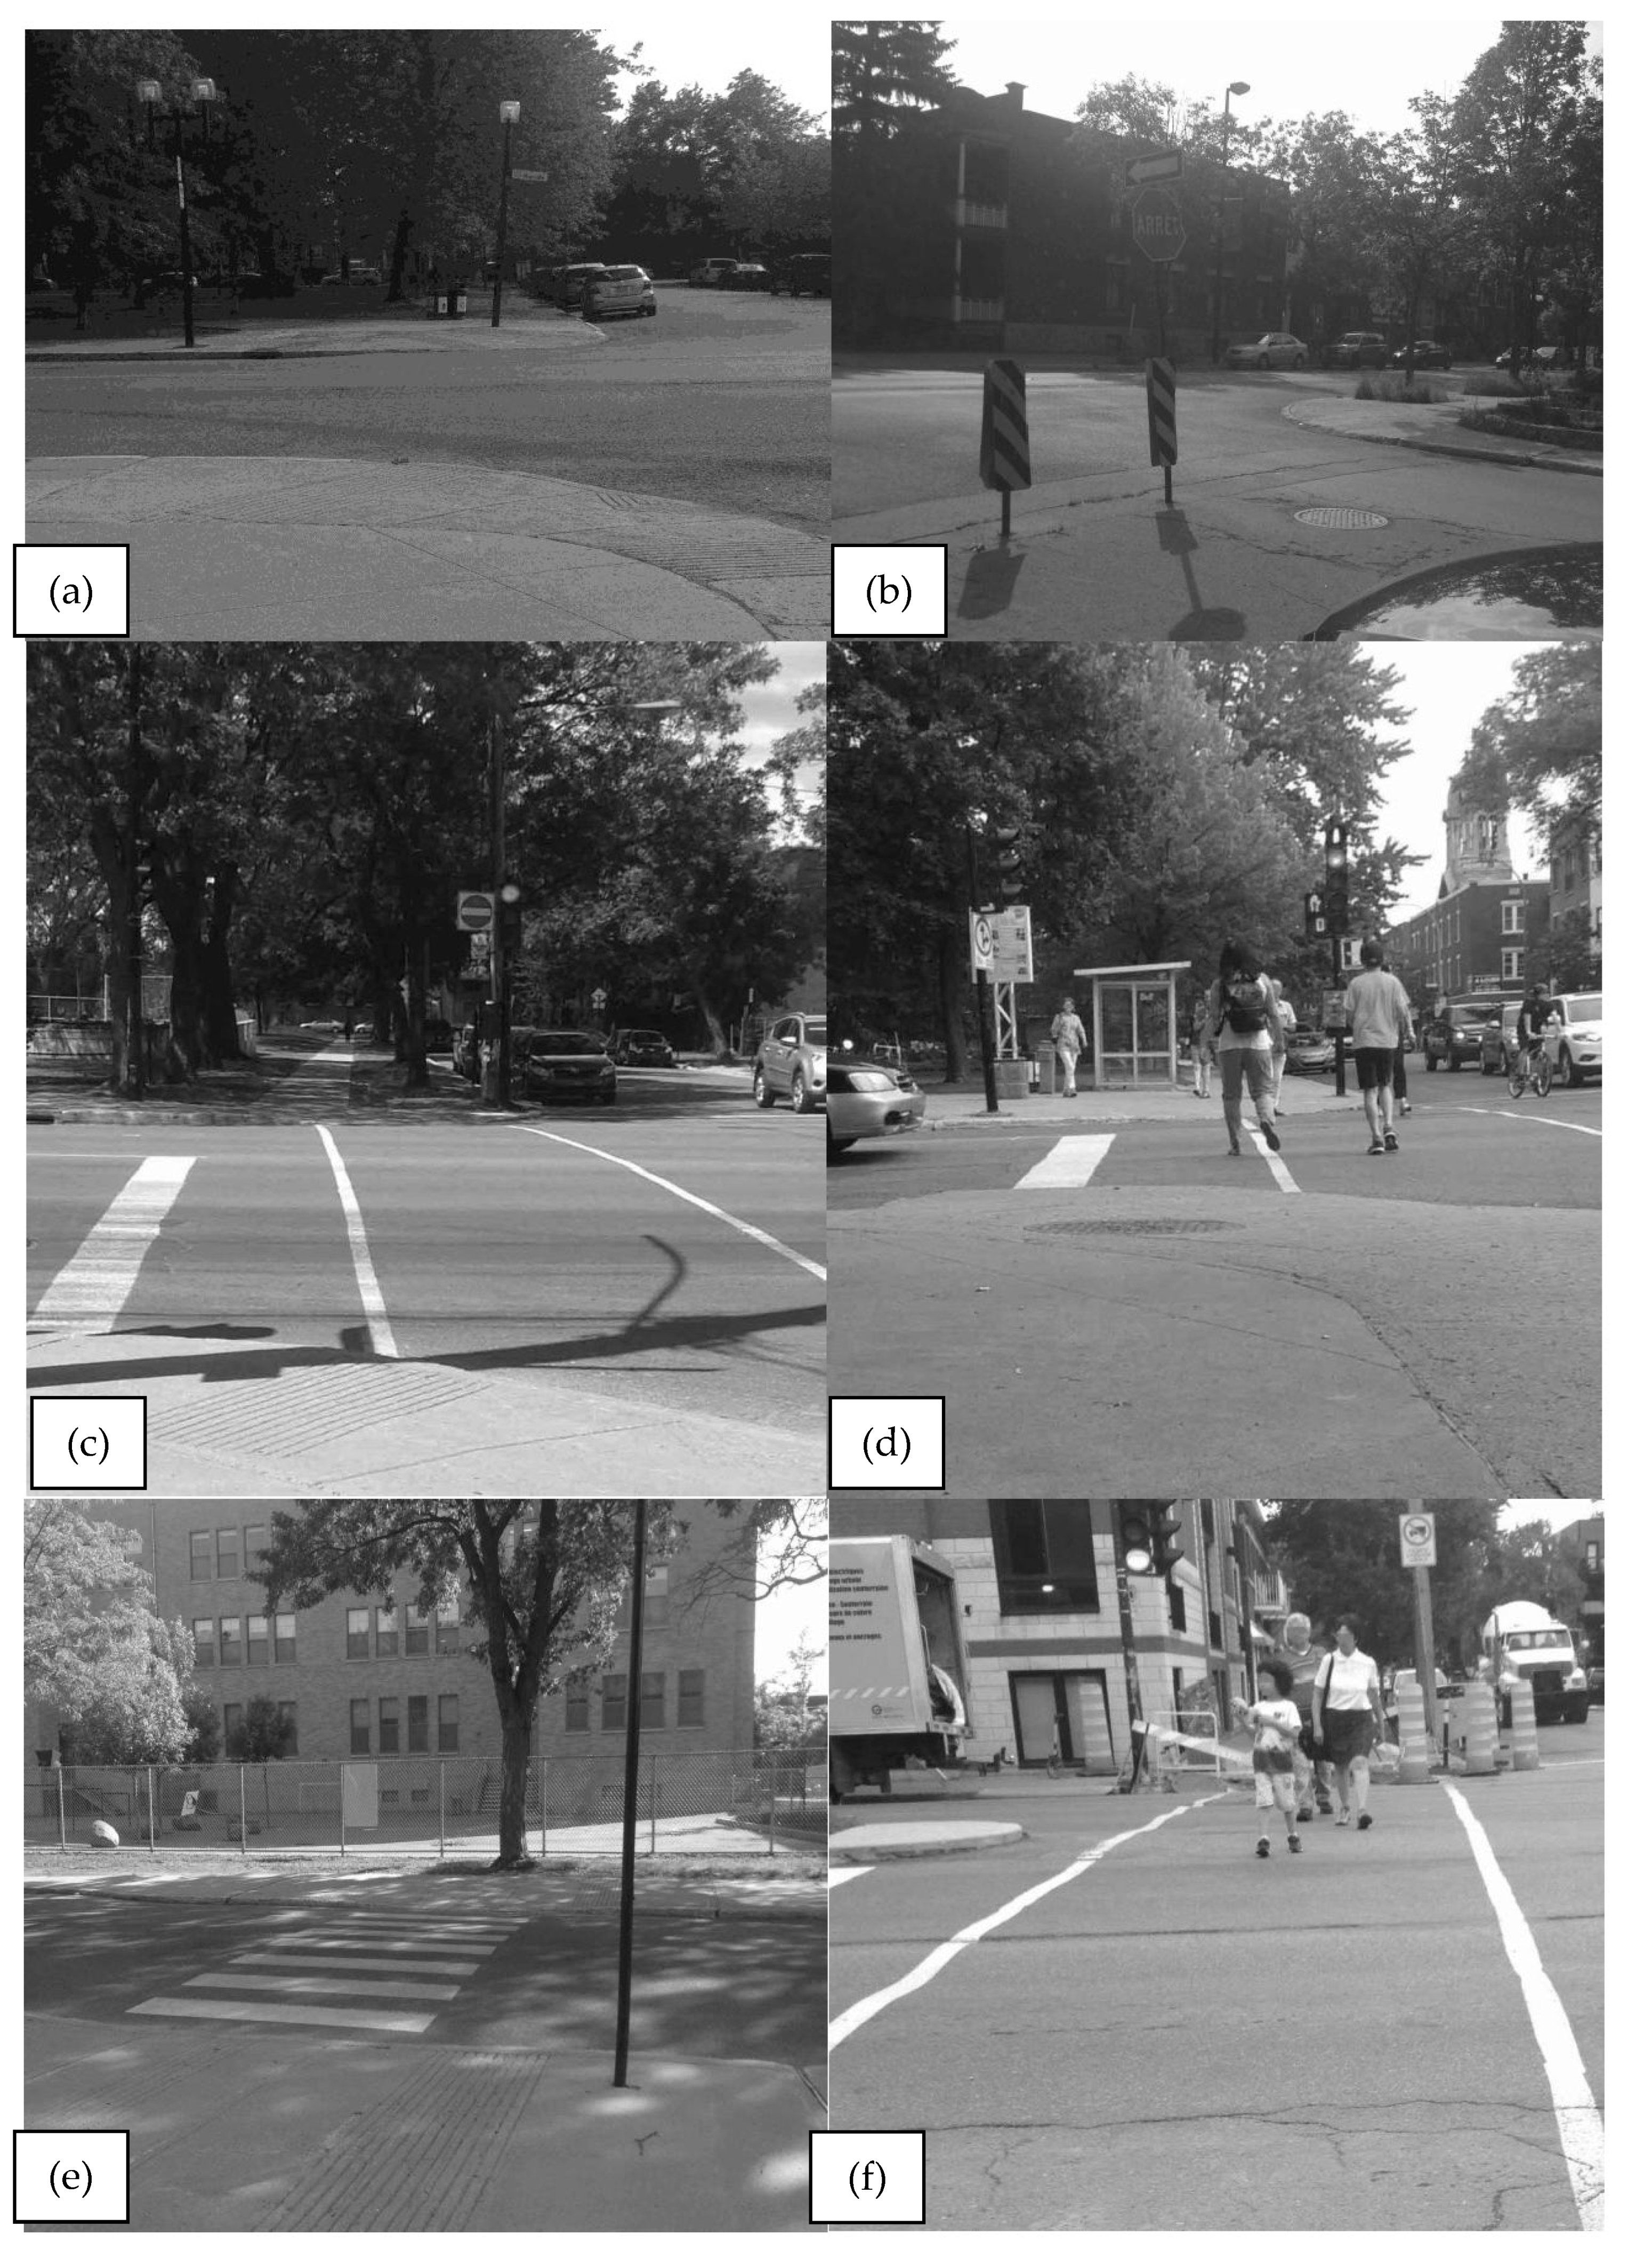
- Four crosswalk characteristics (Table 1) were recorded and used for our analysis: presence and type of traffic control sign (stop sign, traffic light, pedestrian light), crosswalk width (in meters), time permitted to cross (in seconds), and distance between the nearest entrance of the park and the crossing (see Figure 3 for examples). For street crossings with a traffic light, it was possible to calculate the ‘required speed to cross in time’: by dividing the crosswalk width by the time permitted to cross (pedestrian or green phase).
- Interactions between the child pedestrian and vehicles was recorded when the pedestrian’s path and the driver’s path crossed while the pedestrian was still on the street (on the pavement, not curb). This broader definition of conflicts was used to be able to capture events with “dangerous proximity” [60], which can be considered serious incidents, particularly for child pedestrians.


| Characteristics | Number of Crosswalks |
|---|---|
| Signage | |
| No signage | 2 |
| Stop sign | 2 |
| Traffic light without pedestrian light | 5 |
| Traffic light with pedestrian countdown display | 8 |
| Crosswalk width | |
| Less than 15 m | 6 |
| Between 15 and 25 m | 9 |
| More than 25 m | 2 |
| Required speed to cross in time (traffic lights only) | |
| 1 m/s or less | 9 |
| More than 1 m/s | 4 |
| Distance between nearest entrance and intersection | |
| 5 m or less | 15 |
| More than 5 m | 2 |
3.3. Rule Compliance
3.4. Statistical Analyses
4. Results
4.1. Individual, Situational, and Behavioral Categories
4.2. Univariate Analysis
4.3. Mixed-Effects Logistic Models
5. Discussion
5.1. Crossing Characteristics: Many Significant Factors
5.2. Children’s Characteristics and Behaviors: Age Group, Stopping at the Curb and Head Movements
5.3. Adult Supervision and Car Interaction
5.4. The Park as a Destination: Does It Influence crossing Behavior?
5.5. Implications for Policy and Practice
5.6. Study Limitations and Strengths
Author Contributions
Funding
Acknowledgments
Conflicts of Interest
References
- Yanchar, N.L.; Warda, L.J.; Fuselli, P.; Society, C.P. Injury Prevention Committee Child and youth injury prevention: A public health approach. Paediatr. Child Health 2012, 17, 511. [Google Scholar] [CrossRef] [PubMed]
- CCMTA; CCATM. Determining Driver Fitness in Canada: Part 1: A Model for the Administration of Driver Fitness Programs and Part 2: CCMTA Medical Standards for Drivers. 2013. Available online: https://www.transportation.alberta.ca/content/docType45/Production/CCMTADriverMedicalStandardsAugust2013.pdf (accessed on 30 July 2022).
- Siram, S.M.; Sonaike, V.; Bolorunduro, O.B.; Greene, W.R.; Gerald, S.Z.; Chang, D.C.; Cornwell, E.E.; Oyetunji, T. Does the Pattern of Injury in Elderly Pedestrian Trauma Mirror That of The Younger Pedestrian? J. Surg. Res. 2011, 167, 14–18. [Google Scholar] [CrossRef] [PubMed]
- Cieśla, M. Modern Urban Transport Infrastructure Solutions to Improve the Safety of Children as Pedestrians and Cyclists. Infrastructures 2021, 6, 102. [Google Scholar] [CrossRef]
- Schieber, R.A.; Thompson, N.J. Developmental risk factors for childhood pedestrian injuries. Inj. Prev. 1996, 2, 228–236. [Google Scholar] [CrossRef]
- Birken, C.S.; Parkin, P.C.; To, T.; Macarthur, C. Trends in rates of death from unintentional injury among Canadian children in urban areas: Influence of socioeconomic status. Can. Med. Assoc. J. 2006, 175, 867. [Google Scholar] [CrossRef]
- Rothman, L.; Cloutier, M.-S.; Manaugh, K.; Howard, A.W.; MacPherson, A.K.; MacArthur, C. Spatial distribution of roadway environment features related to child pedestrian safety by census tract income in Toronto, Canada. Inj. Prev. 2019, 26, 229–233. [Google Scholar] [CrossRef] [PubMed]
- Ferenchak, N.N.; Marshall, W. Redefining the child pedestrian safety paradigm: Identifying high fatality concentrations in urban areas. Inj. Prev. 2017, 23, 364–369. [Google Scholar] [CrossRef]
- Rothman, L.; Buliung, R.; Macarthur, C.; To, T.; Howard, A. Walking and child pedestrian injury: A systematic review of built environment correlates of safe walking. Inj. Prev. 2013, 20, 41–49. [Google Scholar] [CrossRef]
- McCormack, G.R.; Rock, M.; Toohey, A.M.; Hignell, D. Characteristics of urban parks associated with park use and physical activity: A review of qualitative research. Health Place 2010, 16, 712–726. [Google Scholar] [CrossRef]
- Silver, D.; Giorgio, M.; Mijanovich, T. Utilization Patterns and Perceptions of Playground Users in New York City. J. Community Health 2013, 39, 363–371. [Google Scholar] [CrossRef]
- Knapp, M.; Gustat, J.; Darensbourg, R.; Myers, L.; Johnson, C. The Relationships between Park Quality, Park Usage, and Levels of Physical Activity in Low-Income, African American Neighborhoods. Int. J. Environ. Res. Public Health 2018, 16, 85. [Google Scholar] [CrossRef] [PubMed]
- Rigolon, A.; Toker, Z.; Gasparian, N. Who has more walkable routes to parks? An environmental justice study of Safe Routes to Parks in neighborhoods of Los Angeles. J. Urban Aff. 2017, 40, 576–591. [Google Scholar] [CrossRef]
- Jerrett, M.; Su, J.G.; MacLeod, K.E.; Hanning, C.; Houston, D.; Wolch, J. Safe Routes to Play? Pedestrian and Bicyclist Crashes Near Parks in Los Angeles. Environ. Res. 2016, 151, 742–755. [Google Scholar] [CrossRef] [PubMed]
- Zeedyk, M.S.; Wallace, L.; Carcary, B.; Jones, K.; Larter, K. Children and road safety: Increasing knowledge does not improve behaviour. Br. J. Educ. Psychol. 2001, 71, 573–594. [Google Scholar] [CrossRef]
- Şimşekoğlu, Ö. How Do Attitudes, Personality Traits, and Driver Behaviors Relate to Pedestrian Behaviors?: A Turkish Case. Traffic Inj. Prev. 2014, 16, 84–89. [Google Scholar] [CrossRef] [PubMed]
- Akin, D.; Sisiopiku, V.P. Pedestrian Crossing Compliance Characteristics at-grade Signalized Crosswalks: Case Study in a Downtown-University Campus Environment. In Proceedings of the 86th Annual Meeting of Transportation Research Board, Washington, DC, USA, 21–25 January 2007. [Google Scholar] [CrossRef]
- Rosenbloom, T.; Nemrodov, D.; Barkan, H. For heaven’s sake follow the rules: Pedestrians’ behavior in an ultra-orthodox and a non-orthodox city. Transp. Res. Part F Traffic Psychol. Behav. 2004, 7, 395–404. [Google Scholar] [CrossRef]
- De Ceunynck, T.; Polders, E.; Daniels, S.; Laureshyn, A.; Hermans, E.; Brijs, T. Behavioural Analysis of Vehicle Interactions at Priority-Controlled and Right-Hand Priority Intersections. Available online: https://www.ictct.net/wp-content/uploads/25-Hasselt-2012/25-DeCeunynck-Full-paper.pdf (accessed on 30 July 2022).
- DiMaggio, C.; Li, G. Roadway Characteristics and Pediatric Pedestrian Injury. Epidemiol. Rev. 2011, 34, 46–56. [Google Scholar] [CrossRef]
- Schwebel, D.C.; McClure, L.A. Training children in pedestrian safety: Distinguishing gains in knowledge from gains in safe behavior. J. Prim. Prev. 2014, 35, 151–162. [Google Scholar] [CrossRef]
- Schuurman, N.; Cinnamon, J.; Crooks, V.A.; Hameed, S.M. Pedestrian injury and the built environment: An environmental scan of hotspots. BMC Public Health 2009, 9, 233. [Google Scholar] [CrossRef] [PubMed]
- Whitebread, D.; Neilson, K. The contribution of visual search strategies to the development of pedestrian skills by 4-11 year-old children. Br. J. Educ. Psychol. 2000, 70, 539–557. [Google Scholar] [CrossRef]
- Meir, A.; Oron-Gilad, T. Understanding complex traffic road scenes: The case of child-pedestrians’ hazard perception. J. Saf. Res. 2020, 72, 111–126. [Google Scholar] [CrossRef] [PubMed]
- Tabibi, Z.; Pfeffer, K. Finding a safe place to cross the road: The effect of distractors and the role of attention in children’s identification of safe and dangerous road-crossing sites. Infant Child Dev. 2007, 16, 193–206. [Google Scholar] [CrossRef]
- Otković, I.; Deluka-Tibljaš, A.; Šurdonja, S.; Campisi, T. Development of Models for Children—Pedestrian Crossing Speed at Signalized Crosswalks. Sustainability 2021, 13, 777. [Google Scholar] [CrossRef]
- Schwebel, D.C.; Wu, Y.; Swanson, M.; Cheng, P.; Ning, P.; Cheng, X.; Gao, Y.; Hu, G. Child pedestrian street-crossing behaviors outside a primary school: Developing observational methodologies and data from a case study in Changsha, China. J. Transp. Health 2018, 8, 283–288. [Google Scholar] [CrossRef]
- Wang, H.; Tan, D.; Schwebel, D.C.; Shi, L.; Miao, L. Effect of age on children’s pedestrian behaviour: Results from an observational study. Transp. Res. Part F Traffic Psychol. Behav. 2018, 58, 556–565. [Google Scholar] [CrossRef]
- Simeunović, M.; Tanackov, I.; Pitka, P.; Papić, Z. Determination of Moving Speed of School Age Children. Math. Probl. Eng. 2021, 2021, 9965753. [Google Scholar] [CrossRef]
- Barton, B.K.; Schwebel, D.C. The Roles of Age, Gender, Inhibitory Control, and Parental Supervision in Children’s Pedestrian Safety. J. Pediatr. Psychol. 2006, 32, 517–526. [Google Scholar] [CrossRef] [PubMed]
- Granié, M.-A. Gender differences in preschool children’s declared and behavioral compliance with pedestrian rules. Transp. Res. Part F Traffic Psychol. Behav. 2007, 10, 371–382. [Google Scholar] [CrossRef]
- Cinnamon, J.; Schuurman, N.; Hameed, S.M. Pedestrian Injury and Human Behaviour: Observing Road-Rule Violations at High-Incident Intersections. PLoS ONE 2011, 6, e21063. [Google Scholar] [CrossRef]
- Hill, R.; Lewis, V.; Dunbar, G. Young children’s concepts of danger. Br. J. Dev. Psychol. 2000, 18, 103–119. [Google Scholar] [CrossRef]
- Meir, A.; Oron-Gilad, T.; Parmet, Y. Are child-pedestrians able to identify hazardous traffic situations? Measuring their abilities in a virtual reality environment. Saf. Sci. 2015, 80, 33–40. [Google Scholar] [CrossRef]
- Morrongiello, B.A. Caregiver Supervision and Child-Injury Risk: I. Issues in Defining and Measuring Supervision; II. Findings and Directions for Future Research. J. Pediatr. Psychol. 2005, 30, 536–552. [Google Scholar] [CrossRef] [PubMed]
- Harré, N.; Brandt, T.; Dawe, M. The Development of Risky Driving in Adolescence. J. Saf. Res. 2000, 31, 185–194. [Google Scholar] [CrossRef]
- Rosenbloom, T.; Wolf, Y. Sensation seeking and detection of risky road signals: A developmental perspective. Accid. Anal. Prev. 2002, 34, 569–580. [Google Scholar] [CrossRef]
- Hoogendoorn, S. Microscopic Pedestrian Wayfinding and Dynamics Modeling. In Proceedings of the International Conference on Pedestrian and Evacuation Dynamics, Duisburg, Germany, 4–6 April 2001; Available online: https://ci.nii.ac.jp/naid/10015093114/ (accessed on 27 July 2022).
- Trozzi, V.; Manley, E.; Kasparias, I. Reliability-Based Route Choice in Public Transport Networks. 2015. Available online: https://scholar.google.com.my/scholar?hl=en&as_sdt=0%2C5&q=Reliability-Based+Route+Choice+in+Public+Transport+Networks.&btnG= (accessed on 27 July 2022).
- Cloutier, M.-S.; Lachapelle, U.; Howard, A. Are more interactions at intersections related to more collisions for pedestrians? An empirical example in Quebec, Canada. Transport Findings, 17 February 2019. [Google Scholar] [CrossRef]
- Sacchi, E.; Sayed, T. Conflict-Based Safety Performance Functions for Predicting Traffic Collisions by Type. Transp. Res. Rec. J. Transp. Res. Board 2016, 2583, 50–55. [Google Scholar] [CrossRef]
- Cloutier, M.-S.; Lachapelle, U.; D’Amours-Ouellet, A.-A.; Bergeron, J.; Lord, S.; Torres, J. “Outta my way!” Individual and environmental correlates of interactions between pedestrians and vehicles during street crossings. Accid. Anal. Prev. 2017, 104, 36–45. [Google Scholar] [CrossRef]
- Wazana, A.; Krueger, P.; Raina, P.; Chambers, L. A review of risk factors for child pedestrian injuries: Are they modifiable? Inj. Prev. 1997, 3, 295–304. [Google Scholar] [CrossRef]
- Rosenbloom, T.; Shahar, A.; Perlman, A. Compliance of Ultra-Orthodox and secular pedestrians with traffic lights in Ultra-Orthodox and secular locations. Accid. Anal. Prev. 2008, 40, 1919–1924. [Google Scholar] [CrossRef]
- Sisiopiku, V.; Akin, D. Pedestrian behaviors at and perceptions towards various pedestrian facilities: An examination based on observation and survey data. Transp. Res. Part F Traffic Psychol. Behav. 2003, 6, 249–274. [Google Scholar] [CrossRef]
- Hakkert, A.; Gitelman, V.; Ben-Shabat, E. An evaluation of crosswalk warning systems: Effects on pedestrian and vehicle behaviour. Transp. Res. Part F Traffic Psychol. Behav. 2002, 5, 275–292. [Google Scholar] [CrossRef]
- Montella, A.; Professor, A. Pedestrian Crosswalks Safety Inspections: Safety Assessment Procedure. In Proceedings of the 4th International Symposium on Highway Geometric Design, Valencia, Spain, 2–5 June 2010. [Google Scholar]
- Tarawneh, M.S. Evaluation of pedestrian speed in Jordan with investigation of some contributing factors. J. Saf. Res. 2001, 32, 229–236. [Google Scholar] [CrossRef]
- Brosseau, M.; Zangenehpour, S.; Saunier, N.; Miranda-Moreno, L. The impact of waiting time and other factors on dangerous pedestrian crossings and violations at signalized intersections: A case study in Montreal. Transp. Res. Part F Traffic Psychol. Behav. 2013, 21, 159–172. [Google Scholar] [CrossRef]
- Lipovac, K.; Vujanic, M.; Maric, B.; Nesic, M. Pedestrian Behavior at Signalized Pedestrian Crossings. J. Transp. Eng. 2013, 139, 165–172. [Google Scholar] [CrossRef]
- Paschalidis, E.; Politis, I.; Basbas, S.; Lambrianidou, P. Pedestrian compliance and cross walking speed adaptation due to countdown timer installations: A self report study. Transp. Res. Part F Traffic Psychol. Behav. 2016, 42, 456–467. [Google Scholar] [CrossRef]
- Fu, L.; Zou, N. The influence of pedestrian countdown signals on children’s crossing behavior at school intersections. Accid. Anal. Prev. 2016, 94, 73–79. [Google Scholar] [CrossRef]
- Huang, H.; Zegeer, C. The Effects of Pedestrian Countdown Signals in Lake Buena Vista; Florida Department of Transportation: Tallahassee, FL, USA, 2000. [Google Scholar]
- Vujanić, M.; Pešić, D.; Antić, B.; Smailović, E. Pedestrian risk at the signalized pedestrian crossing equipped with countdown display. Int. J. Traffic Transp. Eng. 2014, 4, 52–61. [Google Scholar] [CrossRef][Green Version]
- Wanty, D.; Wilkie, S. Trialling Pedestrian Countdown Timers at Traffic Signals. 2010. Available online: https://trid.trb.org/view/1097002 (accessed on 27 July 2022).
- Transportation Research Board. Highway Capacity Manual, Sixth Edition: A Guide for Multimodal Mobility Analysis; Transportation Research Board: Washington, WA, USA, 2016. [Google Scholar]
- Almodfer, R.; Xiong, S.; Kong, X.; Duan, P. Pedestrian Crossing Speed Patterns and running frequency analysis at a non-signalized marked crosswalk: Quantitative and qualitative approaches. Sustain. Cities Soc. 2017, 34, 183–192. [Google Scholar] [CrossRef]
- Apparicio, P.; Cloutier, M.; Séguin, A.M.; Ades, J. Accessibilité Spatiale Aux Parcs Urbains Pour Les Enfants et Injustice Environnementale. Exploration du Cas Montréalais. Rev. Int. Géomat. 2010, 20, 363–389. Available online: http://espace.inrs.ca/id/eprint/1572 (accessed on 30 July 2022). [CrossRef]
- Environmental Systems Research Institute. Survey 123 Connect for ArcGIS, Version 2.1.9. 2017. Available online: https://www.arcgis.com/features/index.html (accessed on 30 July 2022).
- Ismail, K.; Sayed, T.; Saunier, N.; Lim, C. Automated Analysis of Pedestrian–Vehicle Conflicts Using Video Data. Transp. Res. Rec. J. Transp. Res. Board 2009, 2140, 44–54. [Google Scholar] [CrossRef]
- Fullerton, A.S.; Xu, J. Ordered Regression Models: Parallel, Partial, and Non-Parallel Alternatives; CRC Press: Boca Raton, FL, USA, 2020; Available online: https://www.routledge.com/Ordered-Regression-Models-Parallel-Partial-and-Non-Parallel-Alternatives/Fullerton-Xu/p/book/9780367737214 (accessed on 27 July 2022).
- Noland, R.B.; Quddus, M. A spatially disaggregate analysis of road casualties in England. Accid. Anal. Prev. 2004, 36, 973–984. [Google Scholar] [CrossRef]
- Manual of Uniform Traffic Control Devices. In MUTCD, 4th ed.; Section B4.1.1; Transportation Association of Canada: Ottawa, ON, Canada, 1998.
- Otković, I.I.; Deluka-Tibljaš, A.; Šurdonja, S. Analysis of Children’s Traffic Behaviour at Signalized Crosswalks as a Precondition for Safe Children Routes Design: A Case Study from Croatia. J. Adv. Transp. 2021, 2021, 1–14. [Google Scholar] [CrossRef]
- Markowitz, F.; Lucero, J. Pedestrian Countdown Signals: Experience with an Extensive Pilot Installation Institute of Transportation Engineers; Institute of Transportation Engineers: Washington, DC, USA, 2006. [Google Scholar]
- Dunbar, G.; Hill, R.; Lewis, V. Children’s attentional skills and road behavior. J. Exp. Psychol. Appl. 2001, 7, 227–234. [Google Scholar] [CrossRef] [PubMed]
- Oxley, J.A.; Ihsen, E.; Fildes, B.N.; Charlton, J.; Day, R.H. Crossing roads safely: An experimental study of age differences in gap selection by pedestrians. Accid. Anal. Prev. 2005, 37, 962–971. [Google Scholar] [CrossRef] [PubMed]
- Deluka-Tibljaš, A.; Otković, I.I.; Campisi, T.; Šurdonja, S. Comparative Analyses of Parameters Influencing Children Pedestrian Behavior in Conflict Zones of Urban Intersections. Safety 2021, 7, 5. [Google Scholar] [CrossRef]
- Koh, P.; Wong, Y.D.; Chandrasekar, P. Safety evaluation of pedestrian behaviour and violations at signalised pedestrian crossings. Saf. Sci. 2014, 70, 143–152. [Google Scholar] [CrossRef]
- Thomson, J.A.; Tolmie, A.; Foot, H.C.; Mclaren, B. Child Development and the Aims of Road Safety Education: A Review and Analysis Executive Summary; Road Safety Research Report No.1; Department of Transport: London, UK, 1996. [Google Scholar]
- Tom, A.; Granié, M.-A. Gender differences in pedestrian rule compliance and visual search at signalized and unsignalized crossroads. Accid. Anal. Prev. 2011, 43, 1794–1801. [Google Scholar] [CrossRef]
- van der Molen, H.H. Behavior of children and accompanying adults at a pedestrian crosswalk. J. Saf. Res. 1982, 13, 113–119. [Google Scholar] [CrossRef]
- Langbroek, J.; De Ceunynck, T.; Daniels, S.; Svensson, A.; Laureshyn, A.; Brijs, T.; Wets, G. Analyzing Interactions between Pedestrians and Motor Vehicles at Two-Phase Signalized Intersections—An Explorative Study Combining Traffic Behaviour and Traffic Conflict Observations in a Cross-National Context. Available online: https://ictct.net/wp-content/uploads/25-Hasselt-2012/25-Langbroek-Full-paper.pdf (accessed on 30 July 2022).
- Pasanen, E.; Salmivaara, H. Driving Speeds and Pedestrian Safety in the City of Helsinki. Traffic Eng. Control 1993, 34, 308–310. Available online: https://www.safetylit.org/citations/index.php?fuseaction=citations.viewdetails&citationIds[]=citjournalarticle_63341_9 (accessed on 27 July 2022).
- Gielen, A.C.; DeFrancesco, S.; Bishai, D.; Mahoney, P.; Ho, S.; Guyer, B. Child pedestrians: The role of parental beliefs and practices in promoting safe walking in urban neighborhoods. J. Hered. 2004, 81, 545–555. [Google Scholar] [CrossRef]
- Greening, L.; Stoppelbein, L.; Chandler, C.C.; Elkin, T.D. Predictors of Children’s and Adolescents’ Risk Perception. J. Pediatr. Psychol. 2005, 30, 425–435. [Google Scholar] [CrossRef]
- Slovic, P.; Peters, E. Risk Perception and Affect. Curr. Dir. Psychol. Sci. 2006, 15, 322–325. [Google Scholar] [CrossRef]
- Rothman, L.; MacPherson, A.K.; Buliung, R.N.; MacArthur, C.; To, T.; Larsen, K.; Howard, A.D. Installation of speed humps and pedestrian-motor vehicle collisions in Toronto, Canada: A quasi-experimental study. BMC Public Health 2015, 15, 774. [Google Scholar] [CrossRef] [PubMed]
- Haleem, K.; Alluri, P.; Gan, A. Analyzing pedestrian crash injury severity at signalized and non-signalized locations. Accid. Anal. Prev. 2015, 81, 14–23. [Google Scholar] [CrossRef] [PubMed]
- Kim, J.-K.; Ulfarsson, G.F.; Shankar, V.N.; Kim, S. Age and pedestrian injury severity in motor-vehicle crashes: A heteroskedastic logit analysis. Accid. Anal. Prev. 2008, 40, 1695–1702. [Google Scholar] [CrossRef] [PubMed]
- Tapiro, H.; Oron-Gilad, T.; Parmet, Y. The effect of environmental distractions on child pedestrian’s crossing behavior. Saf. Sci. 2018, 106, 219–229. [Google Scholar] [CrossRef]
- Livingston, D.H.; Suber, I.; Snyder, D.; Clancy, S.F.; Passannante, M.R.; Lavery, R.F. Annual Pediatric Pedestrian Education Does Not Improve Pedestrian Behavior. J. Trauma Inj. Infect. Crit. Care 2011, 71, 1120–1125. [Google Scholar] [CrossRef]

| Compliance | Non-Compliance | |
|---|---|---|
| Temporal | Crossing finished on Green light, white man or flashing red hand | Crossing finished on Red light, yellow light or red hand |
| Spatial | Type of crossing Crossed in a straight line | Type of crossing Crossed outside the parallel lines or diagonally |
| Velocity | Tempo Regular pace throughout crossing | Tempo Non-regular pace before or during crossing |
| Visual search | Head movements Head towards the traffic light, straight ahead or towards the vehicles before crossing | Head movements Head towards the ground, towards other pedestrians, towards an object or towards nothing in particular before crossing |
| Total | Temporal | Spatial | Velocity | Visual | |||||
|---|---|---|---|---|---|---|---|---|---|
| N (%) | Compliance N (%) | p | Compliance N (%) | p | Compliance N (%) | p | Compliance N (%) | χ2 | |
| Total | 451 (79.4%) | 541 (74.0%) | 527 (72.1%) | 512 (70.0%) | |||||
| Individual characteristics | |||||||||
| Age | 0.77 | 0.002 | 0.877 | 0.001 | |||||
| Younger children (~4 to 8 years old) | 416 (56.9%) | 265 (58.7%) | 326 (60.3%) | 298 (56.6%) | 272 (53.1%) | ||||
| Older children (~9 to 12 years old) | 315 (43.1%) | 186 (41.2%) | 215 (39.7%) | 224 (42.4%) | 240 (46.9%) | ||||
| Gender | 0.608 | 0.138 | 0.420 | 0.513 | |||||
| Girl | 357 (48.8%) | 224 (49.6%) | 273 (50.5%) | 250 (47.4%) | 246 (48%) | ||||
| Boy | 374 (51.2%) | 227 (50.3%) | 268 (49.5%) | 272 (51.6%) | 266 (52%) | ||||
| Situational characteristics | |||||||||
| Supervision | 0.938 | 0.001 | 0.001 | 0.014 | |||||
| No adult | 117 (16.0%) | 51 (11.3%) | 69 (12.7%) | 78 (14.8%) | 95 (18.5%) | ||||
| Adult but out of reach | 94 (12.9%) | 59 (13%) | 70 (13%) | 35 (6.7%) | 66 (12.9%) | ||||
| Adult within reach or contact | 520 (71.1%) | 341(75.6%) | 402 (74%) | 409 (77.6%) | 351 (68.5%) | ||||
| Gender of accompanied adult | 0.110 | 0.200 | 0.400 | 0.030 | |||||
| Male | 144 (19.7%) | 103 (22.8%) | 104 (19%) | 106 (20.1%) | 94 (18.3%) | ||||
| Female | 366 (50.1%) | 220 (48.8%) | 290 (53.6%) | 258 (49%) | 262 (51.2%) | ||||
| Both | 104 (14.2%) | 77 (17%) | 78 (14.4%) | 80 (15.1%) | 61 (12%) | ||||
| Other pedestrians | 0.001 | 0.001 | 0.009 | 0.330 | |||||
| No other pedestrians | 457 (62.5%) | 229 (50.7%) | 350 (64.7%) | 313 (59.4%) | 329 (64.2%) | ||||
| 1 to 5 people | 213 (29.1%) | 166 (36.8%) | 165 (30.5%) | 156 (29.6%) | 142 (27.7%) | ||||
| 6 people or more | 61 (8.3%) | 56 (12.4%) | 26 (4.8%) | 53 (10%) | 41 (8%) | ||||
| Car interaction | 0.001 | 0.079 | 0.076 | 0.001 | |||||
| Yes | 135 (18.5%) | 70 (15.5%) | 108 (20%) | 88 (16.7%) | 110 (21.4%) | ||||
| No | 596 (81.5%) | 381(84.5%) | 433 (80%) | 434 (82.3%) | 402 (78.5%) | ||||
| Behavior characteristics | |||||||||
| Stopping at the curb before crossing | 0.001 | 0.014 | 0.006 | 0.557 | |||||
| Yes | 432 (59.1%) | 319 (70.7%) | 334 (61.7%) | 325 (61.63%) | 299 (58.4%) | ||||
| No | 299 (40.9%) | 132 (29.2%) | 207 (38.3%) | 197 (37.4%) | 213 (41.6%) | ||||
| Looked straight ahead/at traffic light before crossing | 0.722 | 0.002 | 0.256 | ||||||
| Yes | 385 (52.7%) | 250 (55.4%) | 303 (56%) | 268 (50.8%) | - | ||||
| No | 346 (47.3%) | 201 (44.6%) | 238 (44%) | 254 (48.2%) | - | ||||
| Looked towards the vehicles before crossing | 0.127 | 0.499 | 0.001 | ||||||
| Yes | 266 (36.4%) | 140 (31%) | 193 (35.7%) | 170 (32.2%) | - | ||||
| No | 465 (63.6%) | 311 (69%) | 348 (64.3%) | 352 (66.8%) | - | ||||
| Initiator of the crossing | 0.019 | 0.135 | 0.001 | 0.001 | |||||
| Adult and child at the same time | 413 (56.5%) | 253 (56%) | 296 (54.7%) | 294 (55.8%) | 311 (60.7%) | ||||
| Child initiator | 73 (10.0%) | 48 (10.6%) | 60 (11%) | 35 (6.6%) | 61 (11.9%) | ||||
| Adult initiator | 245 (33.5%) | 150 (33.2%) | 185 (34.2%) | 193 (36.6%) | 140 (27.3%) | ||||
| Physical environment characteristics | |||||||||
| Signage | 0.001 | 0.001 | 0.002 | 0.06 | |||||
| No signage | 81 (11.1%) | - | 56 (10.3%) | 48 (9.1%) | 52 (10.1%) | ||||
| Stop sign | 82 (11.2%) | - | 53 (9.8%) | 50 (9.5%) | 65 (12.7%) | ||||
| Traffic light without pedestrian light | 332 (45.4%) | 232 (51.4%) | 282 (52.1%) | 241 (45.7%) | 222 (43.3%) | ||||
| Traffic light with pedestrian countdown display | 236 (32.3%) | 219 (48.5%) | 150 (27.7%) | 183 (34.7%) | 173 (33.8%) | ||||
| Crosswalk width | 0.046 | 0.001 | 0.240 | 0.077 | |||||
| Less than 15 m | 296 (40.5%) | 147 (32.6%) | 192 (35.5%) | 207 (39.3%) | 195 (38%) | ||||
| Between 15 and 25 m | 353 (48.3%) | 229 (50.7%) | 303 (56%) | 250 (47.4%) | 261 (51%) | ||||
| More than 25 m | 82 (11.2%) | 75 (16.6%) | 46 (8.5%) | 65 (12.3%) | 56 (11%) | ||||
| Required speed to cross in time | 0.001 | ||||||||
| 1 m/s or less | 432 (59.1%) | 378 (83.8%) | - | - | - | ||||
| More than 1 m/s | 136 (18.6%) | 73 (16.1%) | - | - | - | ||||
| Distance between the nearest entrance and intersection | 0.150 | 0.001 | 0.016 | 0.141 | |||||
| 5 m or less | 317 (43.4%) | 213 (47.2%) | 214 (39.5%) | 241 (45.7%) | 213 (41.6%) | ||||
| More than 5 m | 414 (56.6%) | 238 (52.7%) | 327 (60.5%) | 281 (53.3%) | 299 (58.4%) | ||||
| Temporal | Spatial | Velocity | Visual | |
|---|---|---|---|---|
| Age | ||||
| Younger [Ref.] | ||||
| Older | 0.964 | 0.765 | 1.581 ** | 1.465 ** |
| Gender | ||||
| Girl [Ref.] | ||||
| Boy | 0.779 | 0.913 | 1.150 | 0.964 |
| Supervision | ||||
| No [Ref.] | ||||
| Yes | 0.901 | 1.817 *** | 3.305 *** | 1.017 |
| Other pedestrians | ||||
| Alone [Ref.] | ||||
| 1–5 people | 1.383 | 1.083 | 0.838 | 0.807 |
| 6 people or more | 1.830 | 0.434 ** | 1.285 | 0.855 |
| Car interaction | ||||
| No [Ref.] | ||||
| Yes | 0.468 *** | 1.657 * | 0.560 ** | 2.370 *** |
| Stopping at the curb before crossing | ||||
| No [Ref.] | ||||
| Yes | 3.796 *** | 1.458 * | 1.456 * | 0.754 |
| Looks at the traffic light/straight ahead | ||||
| No [Ref.] | ||||
| Yes | 0.862 | 1.562 ** | 0.829 | - |
| Initiator of the crossing | ||||
| None [Ref.] | ||||
| Child | 0.731 | 1.725 | 0.356 *** | 1.789 * |
| Adult | 0.526 ** | 0.960 | 1.186 | 0.469 *** |
| Crosswalk width | ||||
| Less than 15 m [Ref.] | ||||
| Between 15 m and 25 m | - | 2.307 *** | 0.887 | 1.88 ** |
| More than 25 m | - | 0.947 | 0.978 | 1.03 |
| Signage | ||||
| No signage [Ref.] | ||||
| Stop sign | - | 1.658 | 1.569 | 2.186 * |
| Traffic light without pedestrian light | - | 2.080 * | 2.003 ** | 1.119 |
| Traffic light with pedestrian countdown display | 3.577 *** | 0.840 | 1.924 * | 2.376 ** |
| Speed required to cross in time | ||||
| 1 m/s or less [Ref.] | ||||
| More than 1 m/s | 0.301 *** | - | - | - |
| Distance between nearest entrance and intersection | ||||
| 5 m or less | ||||
| More than 5 m | 1.813 | 1.010 | 0.712 | 1.490 * |
| Constant | 8.910 *** | 0.745 | 0.704 | 1.124 |
| Crossing site constant | 0.000 | 0.071 | 0.000 | 0.000 |
| Number of groups | 13 | 17 | 17 | 17 |
| Number of observations | 568 | 731 | 731 | 731 |
| Chi square | 89.81 | 71.59 | 77.63 | 64.86 |
| AIC | 477.346 | 762.471 | 819.083 | 851.139 |
Publisher’s Note: MDPI stays neutral with regard to jurisdictional claims in published maps and institutional affiliations. |
© 2022 by the authors. Licensee MDPI, Basel, Switzerland. This article is an open access article distributed under the terms and conditions of the Creative Commons Attribution (CC BY) license (https://creativecommons.org/licenses/by/4.0/).
Share and Cite
Cloutier, M.-S.; Rafiei, M.; Desrosiers-Gaudette, L.; AliYas, Z. An Examination of Child Pedestrian Rule Compliance at Crosswalks around Parks in Montreal, Canada. Int. J. Environ. Res. Public Health 2022, 19, 13784. https://doi.org/10.3390/ijerph192113784
Cloutier M-S, Rafiei M, Desrosiers-Gaudette L, AliYas Z. An Examination of Child Pedestrian Rule Compliance at Crosswalks around Parks in Montreal, Canada. International Journal of Environmental Research and Public Health. 2022; 19(21):13784. https://doi.org/10.3390/ijerph192113784
Chicago/Turabian StyleCloutier, Marie-Soleil, Mojgan Rafiei, Lambert Desrosiers-Gaudette, and Zeinab AliYas. 2022. "An Examination of Child Pedestrian Rule Compliance at Crosswalks around Parks in Montreal, Canada" International Journal of Environmental Research and Public Health 19, no. 21: 13784. https://doi.org/10.3390/ijerph192113784
APA StyleCloutier, M.-S., Rafiei, M., Desrosiers-Gaudette, L., & AliYas, Z. (2022). An Examination of Child Pedestrian Rule Compliance at Crosswalks around Parks in Montreal, Canada. International Journal of Environmental Research and Public Health, 19(21), 13784. https://doi.org/10.3390/ijerph192113784