Abstract
Previous research has found support for depression and anxiety associated with social networks. However, little research has explored parents’ depression and anxiety constructs as mediators that may account for children’s depression and anxiety. The purpose of this paper is to test the influence of different factors on children’s depression and anxiety, extending from parents’ anxiety and depression in Jordan. The authors recruited 857 parents to complete relevant web survey measures with constructs and items and a model based on different research models TAM and extended with trust, analyzed using SEM, CFA with SPSS and AMOS, and ML methods, using the triangulation method to validate the results and help predict future applications. The authors found support for the structural model whereby behavioral intention to use social media influences the parent’s anxiety and depression which correlate to their offspring’s anxiety and depression. Behavioral intention to use social media can be enticed by enjoyment, trust, ease of use, usefulness, and social influences. This study is unique in exploring rumination in the context of the relationship between parent–child anxiety and depression due to the use of social networks.
1. Introduction
Social networks (SNs) are websites that allow people to interact with each other through their profiles. The participants share comments, publish stories, and interact within the SN by liking /disliking them and commenting. Many types of SN were created for different purposes Facebook, Twitter, LinkedIn, Instagram, Tik-Tok, Sina Weibo, and WeChat, to name a few.
From the user’s perspective, SNs provide numerous benefits, including an e-business forum, creative expression, advertising, a means of communication, keeping up with the news, staying connected with friends, enjoyment, entertainment, amusement, and pastime. Others use SNs for professional networking, such as LinkedIn, as well as for scientific research, such as ResearchGate. Still, negative consequences related to SNs are presented in many studies that relate the use of social networks to depression [1,2,3,4,5,6,7], anxiety [8,9,10], addiction [11,12], loneliness, stress [13,14], mental illness [15], social isolation [16] and many negative connotations as shall be seen in the coming sections.
The goal of this study is to investigate the effect of SN on anxiety and depression in parents and their children within the context of an extended Technology Acceptance Model (TAM) with influencing factors such as perceived usefulness (PU), perceived ease of use (PEoU), perceived enjoyment (EN), social influence (SI), and trust (TR) on behavioral intention (BI). Furthermore, the impact of BI on parents’ anxiety and depression, as well as how this impact relates to children’s anxiety and depression. The research is being carried out in Jordan, an Arabic-speaking country where depression and anxiety are taboo and unspoken.
The motivation of this study is as follows. Many studies were conducted to investigate the negative effects of SN in many cultures, including India [17], USA [1], Spain [6], Scandinavia [2], China [18], and Latinos [14], but only one study was conducted in KSA which studied only depression [19] and in Lebanon which studied addiction [10]. Hence, there is a lack of studies on depression and anxiety in the SN-use arena in the Arabic-speaking world. Further to our knowledge, no study was conducted to show the influence of parents’ depression and anxiety and its influence on children’s anxiety and depression.
The importance of this study tackles a taboo subject in Arabic culture: depression and anxiety among SN users. Such a subject is hardly discussed; one study approached this subject in KSA [19], only tackling depression among adults., Another study was conducted in Lebanon [10] that studied smartphone addiction. Further, the study sheds light on the negative side of SN concerning children. In addition, the study discovers the influence of parents’ depression and anxiety on children’s depression and anxiety.
As for the significance of this contribution, depression and anxiety in SN use are particularly important topics that are not discussed in the Arab-speaking world. We found only two studies in this realm. One pertains to depression and the other to smartphone addiction. No study, as far as we can find, did tackle both topics of depression and anxiety. Hence, there is a big gap to fill. Further, this study extended to the influence of parents’ depression and anxiety on children’s depression and anxiety. As this research will show, there is a high correlation between SN use and parents’ depression and anxiety. Further, there is evidently a high correlation between parents’ depression and anxiety and children’s depression and anxiety. Furthermore, there is a high correlation between enjoyment, usefulness, ease of use, and SN use, despite low trust in SN.
2. Literature Review: Anxiety and Depression in SN
Negative effects of SN, such as depression, anxiety, addiction, and social isolation, have been researched in many studies: in [17] the research studied smartphone addiction in India, ref. [20] studied internet addiction, ref. [21] studied TikTok addiction, ref. [22] studied addiction on short films, ref. [11] studied mobile addiction, ref. [12] studied mobile games addiction, and ref. [23] studied Instagram addiction. In addition, ref. [24] studied depression and anxiety severity. While ref. [1,2,18,19] studied depression in Saudi Arabia, China, the USA, and Scandinavia, respectively. While ref. [6] studied depression in tweets in Spain. In fact, studies [3,4,5,15] studied depression. Furthermore, ref. [25] studied the detection of depression using AI. In addition, studies [8,9,26,27] studied depression and anxiety. Additionally, ref. [16] studied social isolation and ref. [10] studied anxiety and smartphone addiction in Lebanon. In [19], the researchers found that 95.4% of the study sample suffered from mild depression to severe depression due to the use of SN on smartphones and found that females are more affected than males. In [18], the research studied depression symptoms among users of WeChat in China. The study concluded “that using social media WeChat showed an association with lower depressive symptoms among people aged ≥45 and older in the study sample.” In [27], the research investigated the role of psychological factors on smartphone addiction proneness (SAP), namely anxiety and low self-control in Korea. In [24], the research studied depression and anxiety symptoms in users of smartphone SN. While ref. [1] studied depressive symptoms among U.S. young adults. In addition, ref. [16] studied perceived social isolation among young adults in the U.S., while ref. [2] reported that 22% of adults suffer from depressive symptoms. In [3], the research proposed a framework for diagnosing user-level depression in SN. While ref. [3] used Facebook ref. [4] used Twitter. In [9], the researchers conducted a systematic review of 70 published studies that discussed social networks (SN) with depression and anxiety. In addition, ref. [5] conducted the same systematic review of research on depression signs on social media. In [15], the study tried to detect depression on SNs by reviewing posts using natural language processing. While ref. [6] detected signs of depression in tweets in Spanish. In [25], the study investigated “Wearable Internet of Medical Things (IoMT) devices with sensors that collect motion data and provide objective measures of physical activity can help to better monitor and detect potential episodes related to the mental health conditions at earlier, more treatable stages”, while ref. [28] did the same using pictures from Instagram. For the purpose of brevity, the following Table 1 shows more than 40 studies that discussed the different negative aspects of SN.

Table 1.
Studies pertain to addiction, depression, and anxiety in using SN.
As can be seen in Table 1, none discussed the depression and anxiety of parents and their influence on children, and none discussed the social network behavioral intention in general. None of the studies extended TAM and used the moderators that were suggested by this research. Arabic-speaking cultures were never discussed within the scope suggested by this research. None used SEM, CFA, and ML to validate the results and to build a predictor model.
3. Theoretical Framework and Hypotheses Development
The proposed model is shown in Figure 1, inspired by the original TAM model proposed by Davis et al. [40], in addition to social influence constructs adopted from the TAM extended model [41,42], along with ten moderating factors. The technology acceptance model (TAM) is an information systems theory that models how users come to accept and use a technology. The model’s constructs are adopted from [43,44,45], including perceived usefulness (PU), perceived ease of use (PEoU), perceive enjoyment (EN) as well as social influence (SI), and trust (TR). As the model suggests, the five independent factors influence the parents’ behavioral intention (BI) to use the SN factor [44], which influences the parents’ depression and anxiety factors [46,47], and the effect of parent’s depression and anxiety factors on their children’s depression and anxiety [10,46,47]. The model includes two types of moderators, one pertaining to parents and the second pertaining to children. The parent moderators are age, gender, marital status, education level, internet experience, preferred SN, and time spent on SN. The child moderators are age and gender. The proposed model and hypotheses will be discussed in detail in the following sections. Depression and anxiety were measured using respective 4-item Patient-Reported Outcome Measurement Information System (PROMIS) scales.
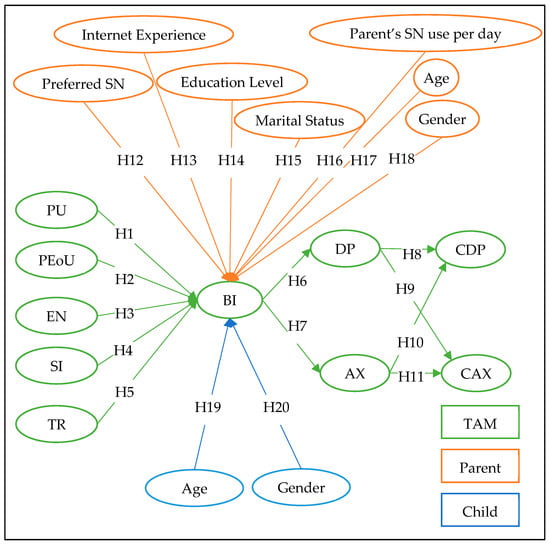
Figure 1.
Proposed Model of the Research.
The influence of PU, PEoU, EN, TR, and SI on BI are discussed in many studies in many domains. PU’s influence on BI is evident in studies [32,44,48,49,50,51,52,53]. PEoU influence on BI is shown in studies [44,48,51,52,53]. EN influence on BI is also shown in [12,44]. SI influence on BI is studied in [48,54,55] and was used to expand UTAUT. TR is a factor that was used to expand the original UTAUT in [54,55]. Hence, the following hypotheses were postulated.
Hypothesis 1 (H1).
Perceived usefulness (PU) has a positive influence on parents’ behavioral intention (BI) of using social networks (SN).
Hypothesis 2 (H2).
Perceived ease of use (PEoU) has a positive influence on parents’ behavioral intention (BI) of using social networks (SN).
Hypothesis 3 (H3).
Perceived enjoyment (EN) has a positive influence on parents’ behavioral intention (BI) of using social networks (SN).
Hypothesis 4 (H4).
Social influence (SI) has a positive influence on parents’ behavioral intention (BI) of using social networks (SN).
Hypothesis 5 (H5).
Trust (TR) has a positive influence on parents’ behavioral intention (BI) of using social networks (SN).
The following section will discuss hypotheses related to depression and anxiety and the interplay between parents’ and children’s anxiety and depression.
3.1. Anxiety and Depression
Anxiety is “The degree to which an individual’s exposure to and use of a social communication technology induces feelings of tension, worried thoughts, and physical changes like increased blood pressure” [56].
Depression affects how you feel and act. When a person is depressed, s/he may have symptoms such as sadness, hopelessness, or anxiousness; a loss of interest in things s/he once enjoyed; a lack of energy; eating more or less than used to; sleeping too little or too much; trouble thinking or concentrating. Such symptoms should last more than two weeks, and they should not have a medical cause [57].
Anxiety and depression are types of mood disorders. Among other things, depression causes feelings of sadness, hopelessness, and reduced energy. On the other hand, anxiety creates feelings of nervousness, worry, or dread, according to [57].
According to [8], the relationship between anxiety and depression “Several possible models are explored that provide different conceptions of how this relationship may best be understood: (1) that there is a variety of more or less discrete, but sometimes coexisting, syndromes within the spectrum of anxiety and depression; (2) that symptoms of depression and anxiety represent different external manifestations of a more basic underlying cause; (3) that one condition may predispose to the other; (4) that the association may be due to artifactual definitional overlap, particularly since the instruments used to measure depression and anxiety share so many items”.
Further ref. [58] stated that “Depression is a frequent complication of anxiety disorders, and anxiety symptoms are common in primary depressive illness”. The research [46] studied the associations of social media with depression, anxiety, and social isolation. While ref. [10] studied smartphone addiction’s influence on anxiety and problematic family relationships. On the other hand, ref. [33] studied children’s smartphone addiction. Research [31] studied the relationship between Korean parents’ smartphone addiction and that of their children: the mediating effects of children’s depression and social withdrawal. The paper [10] studied the relationship between smartphone addiction, anxiety, and family relations. Even ref. [37] studied developing an empirically sound measure of Facebook-based social support (Facebook Measure of Social Support [FMSS]). While ref. [38] confirmed that there is “a positive correlation between SN use and depression in psychiatric inpatients”. In study [39], depression symptoms among children and adolescents pertaining to SN were discussed. Based on the previous, the following hypotheses were postulated:
Hypothesis 6 (H6).
Behavioral intention (BI) of parents using social networks (SN) has a positive influence on parents’ depression (DP).
Hypothesis 7 (H7).
Behavioral intention (BI) of parents using social networks (SN) has a positive influence on parents’ anxiety (AX).
Hypothesis 8 (H8).
The depression of parents (DP) who use social networks has a positive influence on the depression of children (CDP) who use social networks.
Hypothesis 9 (H9).
The depression of parents (DP) who use social networks has a positive influence on the anxiety of children (CAX) who use social networks.
Hypothesis 10 (H10).
The anxiety of parents (DP) who use social networks has a positive influence on the depression of children (CDP) who use social networks.
Hypothesis 11 (H11).
The anxiety of parents (AX) who use social networks has a positive influence on the anxiety of children (CAX) who use social networks.
3.2. Moderators
In this research, there are two types of moderators pertaining to child and parent. The parent moderators are age, gender, educational level, marital status, time spent on the internet, social media venue, and internet experience. On the other hand, moderators of the child are age and gender.
The type of SN that influences behavioral intention was investigated by many [10,11,12,50]. Yang and Gong [11] found that the high quality of games’ interfaces significantly influences smartphone addiction. Ref. [12] stated that perceived enjoyment of a smartphone game is positively associated with smartphone addiction. Sanz-Blas et al. [23] found that overuse and the lack of control over the time spent on SN apps are the main causes of the SN apps addiction. Accordingly, we suggest the following hypothesis:
Hypothesis 12 (H12).
Parents’ preferred social media has a positive influence on the behavioral intention (BI) of parents using social networks.
Internet Experience is another important factor that was investigated in [39,54,59,60,61,62,63]. Hence the following hypothesis was postulated.
Hypothesis 13 (H13).
Parents’ internet experience has a positive influence on behavioral intention (BI).
Education level is an important factor that influenced behavioral intention in previous studies [54,59,64,65]. Hence the following hypothesis was postulated.
Hypothesis 14 (H14).
Parent education level has a positive influence on the behavioral intention (BI) of parents using social networks.
Marital status is one more important moderating factor that was used in other studies, including [54,66,67]. Hence the following hypothesis was proposed.
Hypothesis 15 (H15).
Parent marital status has a positive influence on the behavioral intention (BI) of parents using social networks.
Time spent using social media is a moderator factor used in a number of studies such as [55,68,69,70] found that time spent on SN “correlated with psychological distress and suicidal ideation in youth (grades 7–12).” Hence the following hypothesis was proposed:
Hypothesis 16 (H16).
Parent’s SN use per day has a positive influence on the behavioral intention (BI) of parents using social networks.
As for age and gender moderators, a number of studies were conducted to investigate age and gender influence on behavioral intention in the information technology arena [54,55,59,60,61,62,66,71,72]. Hence, both the age and gender of the respondent and the child were considered when conducting this research. Based on the previous the following four hypotheses were postulated:
Hypothesis 17 (H17).
Parents’ age has a positive influence on the behavioral intention (BI) of parents using social networks.
Hypothesis 18 (H18).
Parents’ gender has a positive influence on the behavioral intention (BI) of parents using social networks.
Hypothesis 19 (H19).
Child age has a positive influence on parents’ behavioral intention (BI) to use social networks.
Hypothesis 20 (H20).
Child gender has a positive influence on parents’ behavioral intention (BI) to use social networks.
3.3. Research Questions
This research tries to answer questions as follows: RQ1: What factors influence the Behavioral intention of the parent? Among them are PU, PEoU, EN, SI, and TR. RQ2: which moderators influence the BI? RQ3: Does BI influence the depression and anxiety of the parent? RQ4: Do the parents’ depression and anxiety influence the child’s depression and anxiety? RQ5: Does the parents’ age, gender, internet experience, education level, marital status, and preferred SN influence the behavioral intention to use SN in addition to the child’s age and gender?
4. Survey Design & Methods
In this section the research will present survey design and methods. As can be seen in Figure 1 the model is made of 5 independent constructs, three intermediate constructs, and 2 dependent constructs. The independent constructs are PU, PEoU, EN, TR, and SI. The intermediate constructs are behavioral intention (BI), DP, and AX. The dependent constructs are CAX and CDP. There are two types of moderators one pertaining to the parent and the second pertaining to the child. The parent’s moderators are age, gender, marital status, education level, internet experience, preferred SN, and parent’s time spent on SN. The child’s moderators are age and gender. Since research on this issue was limited, the researchers developed a model shown in Figure 1, and in turn, developed the hypotheses above. A questionnaire was developed and assessed, then from a sample of convenience, the data was collected. The next four sections (research context, measurement items, participants and procedure, and measurement instruments) will explain in detail the survey design and method of this research.
4.1. Research Context
Many studies were conducted to investigate the relationship between depression and anxiety and SN as shown in Table 1, where more than 40 research were listed pertaining to such an idea but none in the Arab-speaking world. The question raised does the parent’s depression and anxiety influence the child’s depression and anxiety. Hence, this study was conducted as follows.
4.2. Measurement Items
A questionnaire survey was created to test the research model proposed for this study. The survey items were developed based on previous research. There are nineteen variables (independent, mediating, dependent, and moderating) in the model. Each variable was measured as follows:
Parents’ age into five groups, gender into two groups, educational level into five groups, Internet experience into three groups, marital status in two groups, child’s age in six groups, time spent on SN in five groups, preferred SN in seven groups, seen in Table A1. The construct PU was measured by five items, and PEoU was measured by four items. EN was measured by three items. Trust (TR) was measured by five items. SI was measured by four items. BI was measured by four items. DP and CDP were measured with four items adopted from [47], and AX and CAX were measured using five items also adopted from [47]. All measurements are shown in Table A1. Next, the participants and collection procedures are presented.
4.3. Participants and Procedure
Using Google docs, a web-based survey questionnaire was prepared in both Arabic and English, using a five-point Likert scale ranging from strongly disagree (1) to strongly agree (5). The survey was reviewed by a panel of 11 academicians. Feedback was collected, and the questionnaire was rectified accordingly. Consequently, the survey was piloted on 25 SN users in Jordan to test the understandability of the questions. Revisions were made to the survey.
The survey link was distributed via parents’ school groups, researchers, and Jordan residents on Facebook, LinkedIn, and through schools’ parent WhatsApp groups in Jordan. The convenience sampling method was applied in this study. Participants were voluntary, and no financial incentive was offered.
According to Morgan table data, 384 respondents should be reached for the optimum size of the statistical sample of this research [73]. The survey was conducted from 15 June 2022 to 10 August 2022, and after removing the deficient surveys, 857 SN application users remained. As shown in Table 2, the demographic profile of the respondents for this study showed that the participants were almost equal regarding parents (i.e., males and females), most of them between 28 to less than 38, divorced, holding diploma and bachelor’s degrees, had good and excellent internet experience, spent five hours and more on social media, specifically, on Snapchat and Instagram. Additionally, the demographic profile regarding the children indicated that typically males, between 6 to less than 9 and 12 to less than 15 years old.
Table 2.
Description of the respondents’ demographic profiles.
4.4. Measurement Instruments
The constructs were measured by adopting items from prior well-established instruments with minor wording modifications. A five-point Likert scale, from “strongly disagree” (tagged with 1) to “strongly agree” (tagged with 5), was employed. Table A1 shows the final measurements of constructs.
5. Data Analysis and Results
This section presents the results of this study. First, to show the clustering and dispersion of the sample responses, a descriptive analysis was conducted. Second, to test the research hypotheses structural equation model (SEM) was employed with five machine learning methods to validate the results of SEM. Third, the moderators’ effects are presented in this section.
5.1. Descriptive Analysis
To describe the responses and thus the attitude of the respondents toward each question they were asked in the survey, the mean and the standard deviation were estimated. While the mean shows the central tendency of the data, the standard deviation measures the dispersion, which offers an index of the spread or variability in the data [74,75]. In other words, a small standard deviation for a set of values reveals that these values are clustered closely about the mean or located close to it; a large standard deviation indicates the opposite. The level of each item was determined by the following formula: (highest point in Likert scale − lowest point in Likert scale)/the number of the levels used = (5 − 1)/5 = 0.80, where 1–1.80 reflected by “very low”, 1.81–2.60 reflected by “low”, 2.61–3.40 reflected by “moderate”, 3.41–4.20 reflected by “high,” and 4.21–5 reflected by “very high”. Then the items were ordered based on their means. Table 3 and Table 4 show the results.
Table 3.
Overall mean and standard deviation of the study’s variables.
Table 4.
Properties of the final measurement model.
5.2. SEM Analysis
SEM analysis was employed to test the research hypotheses. First, Confirmatory factor analysis (CFA) was conducted to ensure the validity and reliability of the observed variables’ responses by calculating Cronbach alpha, composite reliability (CR), and Average Variance Extracted (AVE) for the constructs, and calculating Factor Loadings, Std. Error, Square Multiple Correlation, and Error Variance for every item to each variable. Second, SEM using Amos 20 was performed to test the study hypotheses.
5.2.1. Measurement Model
CFA was conducted to check the properties of the instrument items. Indeed, the measurement model indicates how latent variables or hypothetical constructs are assessed in terms of observed variables; and embodies the validity and reliability of the observed variables’ responses to the latent variables [77,78,79,80]. Table 3 shows the mean, standard deviation, level, order, Cronbach alpha, CR, and AVE for the constructs. Further, Table 4 demonstrates the mean, standard deviation, level, and order scores, Factor Loadings, Std. Error, Square Multiple Correlation, and Error Variance for every item to each variable.
In Table 4, all of the indicators of the factor loadings exceeded the value of (0.50), except one item (PU4 = 0.253) was eliminated to obtain a better fitting measurement model, thus constituting evidence of convergent validity [77,81], Indeed, the measurement reached convergent validity at the item level because all the factor loadings went above 0.50.
In Table 3, all the composite reliability (CR) values exceeded the value of (0.60), demonstrating a high level of internal consistency for the latent variables. In addition, since each value of AVE exceeded the value of (0.50) [77,78], the convergent validity was proved. Further, as presented in Table 3, data analysis results have shown that all research variables are applied to very high levels, whereas the respondent’s attribute of Trust does exist moderately, with a mean of (2.6397).
In addition, as noticed in Table 5, all the intercorrelations between pairs of constructs were less than the square root of the AVE estimates of the two constructs, providing discriminant validity [78]. Consequently, the measurement results indicated that this study had adequate levels of convergent and discriminant validity. Further, the correlation between constructs depending on the absolute value of R can be classified as no relation, weak relation, moderate and strong relation in quarters. Hence, values of less than (0.25) are considered no relation, and values above (0.75) are considered strong relations, while values between [0.25–0.50] are considered weak relations, and values between [0.50–0.75] are considered moderate relations. In the light of the previous one, may read the following:
Table 5.
Correlations of constructs.
First, there are 13 strong relationships between the pairs (PU, PEoU), (PEoU, TR), (EN, SI), (SI, AX), (SI, CAX), (TR, BI), (TR, DP), (TR, AX), (TR, CDP), (BI, DP), (BI, AX), (BI, CAX), and (DP, CDP).
Second, there are 13 moderate relationships between the pairs (PU, EN), (PU, BI), (PU, CAX), (PEoU, EN), (EN, DP), (EN, AX), (EN, CDP), (EN, CAX), (SI, CDP), (TR, CAX), (BI, CDP), (DP, AX), and (DP, CAX).
5.2.2. Structural Model
Structural equation modeling using Amos 20 was performed to test the study hypotheses. The results showed that PU, PEoU, EN, SI, and TR positively and significantly impacted BI; thus, H1, H2, H3, H4, and H5 were supported. In addition, BI positively and significantly affected both DP and AX; therefore, H6 and H7 were accepted. DP positively and significantly impacted both CDP and CAX; besides, AX affected both CDP and CAX. Thus, H8-H11 were accepted. Moreover, the coefficient of determination (R²) for the endogenous research variables for BI, DP, AX, CDP, and CAX were (0.752), (0.717), (0.640), (0.698), and (0.488), respectively, which indicates that the model does account for the variation of the proposed model. One can interpret the R² as the proportion of variation in the dependent variable that is predicted by the statistical model. Table 6 provides a summary of the tested hypotheses.
Table 6.
Summary of proposed results for the theoretical model.
5.3. Moderation Effects
As reflected in the model, there are two types of moderators one pertaining to the parent and the second pertaining to the child. The parent moderators are age, gender, marital status, education level, internet experience, preferred SN, and parent’s time spent on SN. The child’s moderators are age and gender. Hypotheses H12–H20 argued that there is a significant difference in the respondents’ BI due to the parent’s age, gender, educational level, marital status, time spent on the internet, preferred SN, internet experience, and child’s age, and gender. ANOVA test was employed to examine if there were any significant differences in the respondent BI that can be attributed to the parent’s age, educational level, time spent on the internet, preferred SN, internet experience, and child’s age. In addition, the Independent Samples t-test was employed to investigate if there were any significant differences in the respondent’s BI that can be attributed to the parent’s gender, marital status, and child’s gender.
Results of the ANOVA test, shown in Table 7, indicated that there is a significant difference in the respondents’ BI in favor of parent’s age, educational level, time spent on the internet, preferred SN, internet experience, and child’s age.
Table 7.
ANOVA Analysis of respondent Behavioral Intention (BI) attributed to parent age, parent educational level, parent time spent on the internet, parent’s preferred SN, parent’s internet experience, and children’s age.
Results of the t-test, shown in Table 8, indicated that there is a significant difference in the behavioral intention (BI) that can be attributed to parent’s gender, that goes for females more than males. In addition, there is a significant difference in the BI due to the parent’s marital status, which goes for divorced more than married. Further, results indicated that there is a significant difference in the BI that can be attributed to the child’s gender, which goes for females more than males.
Table 8.
t-test of the respondent Behavioral Intention (BI) attributed to parent gender, parent marital status, and child gender.
5.4. ML Validation and Verification of SEM Results
In this section, the research shows that results from SEM can be validated and verified using five ML classification techniques. They are further predicting the influence of DP and AX on CPD and CAX. Modern systems have deployed machine learning techniques as an intelligent technology for decision-making. The techniques have proved their effectiveness in assisting decision-makers in various environments. Therefore, we evaluate five Machine Learning (ML) classification techniques that debrief information from a dataset’s input into a beneficial pattern [82]. Experimentally different ML techniques were selected from various families such as functions, Meta, tree, lazy, and Bayesian techniques. The most effective models that evaluated the depression datasets are Artificial Neural Network (ANN) [83], Linear Regression [84], Sequential Minimal Optimization algorithm for Support Vector Machine (SMO) [85], Bagging using REPTree model [86], and Random Forest [87]. The ANN technique constructs a graph of weights and attached biases to connect the inputs and the target outputs. The training phase uses the back-propagation method to update the weights and bias parameters based on the errors estimated between the predicted and actual output values. The linear regression techniques evaluate the coefficient weights of a linear polynomial function, which are the independent variables (inputs), to reduce the errors of the actual and estimated targets. The SVM techniques depend on vector space to maximize the margin between the targets, whereas evolving updates the values of the weight related to vectors in sequential iterations using the Sequential Minimal Optimization algorithm (SMO). The bagging approach is a member of the Meta family that theorizes that weak learners build strong models (or models). Using a random selection of the instances and features from the training set, REPTree was employed as a weak learner to construct a strong model of significant REPTree models, where the average value of the trees predicts the final value. The Random Forest (RF) is one of the Tree-based models that build an ensemble of a set of decision tree (DT) models. The technique builds the models using samples for each sub-tree model and a random sampling of training data instances. The final output of the model is the average value of the DT trees.
Using a 10-fold cross-validation technique, the models were validated before choosing the optimal version. The 10-fold cross-validation approach is utilized in the evaluation step. This approach chooses 10% of the dataset for testing and 90% for training in a sequential manner (the remaining 9 folds). A classifier model was developed and its effectiveness was evaluated at each step. The average performance is then represented. Hence, reducing the likelihood of over-fitting by using such a strategy, which guarantees that the entire dataset is utilized during the training and testing phases. A difficulty occurs when the model successfully classifies all the training data but is unable to fit the test sets.
ML Results and Discussion
The excessive use of social networks leads to two problems, which are depression and anxiety. There are a set of factors that have an impact on children’s depression and anxiety, extending from parents’ anxiety and depression. Hence, a group of datasets was created that relate the input factors to the target variable under study. These datasets are derived from the hypotheses of the studying model in Figure 1, which are (1) dataset 1 incorporates PU, PEoU, EN, SI, and TR (H1-H5) as inputs and BI as output, (2) The BI factor is considered as input with DP (H6) factor to form dataset 2 and with AX (H7) to form dataset 3. (3) The DP and AX are input to CDP (H8, H10) output to form dataset 4, and to CAX (H9, H11) output for dataset 5.
ML algorithms, as intelligent procedures, extract inherited important information from datasets to comprehend the relationship between the components (or inputs) and the issues. However, the use of the five datasets to evaluate how well ML models perform. The experimental results are shown in Figure 2 and Figure 3 using R2 and Mean Square Error (MSE) as evaluation metrics. The R2 and MSE values are on the y-axis, and the datasets are on the x-axis. The predicted effect of the independent variables on the dependent variable is indicated by the R2 statistic (target). The MSE determines the typical divergence between a model’s expected and actual output values.
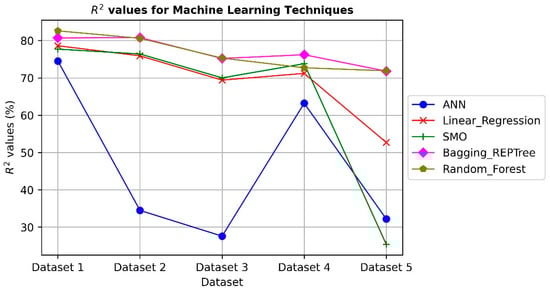
Figure 2.
The results of using ML techniques on depression dataset R2.
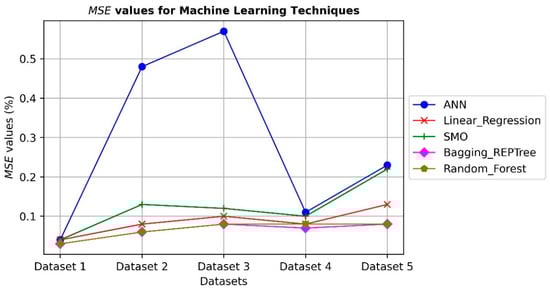
Figure 3.
The results of using ML techniques on depression dataset MSE.
On five datasets models, the Bagging_REPTree and Random_Forest show reasonable results, with average R2 values of 81%. The linear regression and SMO models obtain competitive results reaching up to 75%. The ANN technique provides less performance in comparison with other models due to the divergence of datasets that affects the gradient descent technique during the training phase of the model. The MSE values reflect the error between the actual and predicted values on test sets of the datasets, which have a mirror effect from the R2 values. The results indicate the ability of ML techniques, especially the Bagging_REPTree and Random_Forest methods, to predict the children’s depression and anxiety are also extended from the parents’ anxiety and depression when they use social networks.
6. Discussion, Implications, and Conclusions
This section will present a discussion of the results, the theoretical and practical implications, and, finally, the conclusion. The section will begin with a discussion of each of the constructs.
The independent construct trust (TR) was of remarkably interesting results. TR was measured with five items: trustworthiness, honesty of SN, Security, protection, and usage trust. In all five items, responders answered very negatively. On the question of trustworthiness, 67% answered disagree, and on the honesty item question 67.1% answered “disagree” to “strongly disagree.” On the security question item, 67.4% disagreed, and 18.2% strongly disagreed. On the fourth item pertaining to information protection of the users, 67% disagreed, and among them 18% strongly disagreed. In the fifth item, which asked, “I trust in social media that I’m using,” we found that 49.2% disagreed while 17.6% strongly disagreed. One may draw a conclusion that although the responders do use SN, yet there is a lack of trust.
Figure 4 shows some important results reflected in the proposed model—the mean of each construct, the coefficient value, and the R-squared. The mean gives the central tendency of a set of data; hence the calculated mean of the constructs gives an idea of the tendency of the answers by the respondents. The coefficient value shows how much the dependent variable is expected to increase when that independent variable increases by one. Hence reflecting the strength of the independent variable on the dependent variable. As stated before, one can interpret the R² as the proportion of variation in the dependent variable that is predicted by the statistical model.
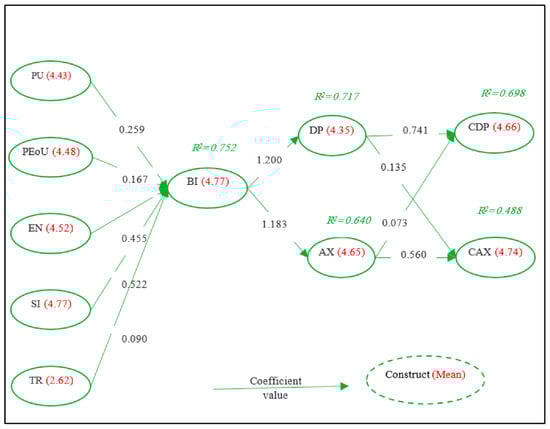
Figure 4.
Prosed model of the research with mean, coefficient value, and R-squared.
Negative side effects, such as depression, anxiety, and addiction, are evident in several studies associated with technology such as smartphones, computer games, and SN, comparable with such studies as [17,20,21,26,29]. Yet people still enjoy and continue to use such technology. In the Enjoyment (EN) constructs, responders answered regarding delightfulness, enjoyability, and entertainment with 96%, 97%, and 97% with “agree” and “strongly agree.” EN construct mean was 4.5, which is an important indicator as the incentive of using SN. As opposed to TR, which is with a mean of (2.6). Responders indicated within their responses that although they may not trust SNs, they enjoy SNs.
Perceived usefulness (PU) was portrayed using five items pertaining to usefulness in daily life, reconnection with people, ease of staying in touch, staying informed, and increased knowledge and education. PU2 and PU4 were the highest in Table 3, with means of 4.77 and 4.94, respectively. The overall mean of the PU construct is 4.4394 and was of order four as shown in Table 2. PU has a strong relationship with PEoU and a moderate relationship with EN, BI, and CAX, as evident in Table 5. PU influence on BI was evident with the support of H1, with a coefficient value of 0.259. Hence, agrees with findings of [43,44,48,49,51,54].
Perceived ease of use (PEoU) was interpreted using four items pertaining to ease of learning, clarity, ease to use, and competency. PU2 and PU3 were the highest in Table 3 with means of 4.76 and 4.77, respectively. The overall mean of the PEoU construct is 4.4837 and was of order three as shown in Table 2. PEoU has a strong relationship with TR and PU, and a moderate relationship with EN shown in Table 5. PEoU influence on BI was evident with the support of H2, with a coefficient value of 0.167. Hence, these results are consistent with findings of [12,48,49,51,54], but not [43,44].
Perceived enjoyment (EN) was interpreted using three items pertaining to delightfulness, enjoyability, and entertainment. EN2 was the highest in Table 3 with a mean of (4.90). The overall mean of the PEoU construct is 4.5235 and was of order two, as shown in Table 2. EN has a strong relationship with SI and a moderate relationship with DP, AX, CDP, CAXPU, and PEoU, as shown in Table 5. EN influence on BI was evident with the support of H3, with a coefficient value of 0.455, which is more than the coefficient values of both PU and PEoU combined. Hence, this is consistent with findings of [12,44,48].
Social Influence (SI) was interpreted using four items pertaining to what people close to the responder think, recommend, and advise, and the fourth is what other people think. S1, S2, and S3 were the highest in Table 3, with means of 4.90, 4.89, and 4.91, respectively. Hence, the closer the people are, the more influence they have. The overall mean of the EN construct is 4.7798 and was of order one, as shown in Table 2. SI has a strong relationship with EN, AX, and CAX, with a moderate relationship with CDP, as seen in Table 5. SI influence on BI was evident with the support of H4, with a coefficient value of (0.522) which is more than the coefficient values of both PU and PEoU combined and EN. Hence, agrees with findings of [48,54,55].
Trust (TR) was investigated using five items pertaining to trustworthiness, honesty, security, protection, and trust. All items were of moderate level. The highest was TR2, and the lowest was TR3. Hence responders doubt the honesty and security of SN. In fact, the security item was the lowest compared with all items in the questionnaire. The whole construct means, as shown in Table 3, had the lowest mean (2.6397). There is a strong relationship between TR and BI, DP, AX, CDP, and PEoU, with a moderate relationship with CAX, as seen in Table 5. BI was evident with the support of H5, with a coefficient value of 0.090. Hence, it agrees with the findings of [44,48].
The behavioral intention (BI) construct was measured by four items pertaining to future use, whenever I can, planning to use in the future, and recommending to others. BI2, BI3, and BI4 were the highest in Table 4, with means of 4.91, 4.91, and 4.87, respectively. The overall mean of the BI construct is 4.7748 and was of order one, as shown in Table 3. BI has a strong relationship, according to Table 5, with TR, DP, AX, CAX, and moderate relation with CDP and PU. Further, according to findings in Table 7 and Table 8 that there is a significant difference in the BI attributed to parent gender (female), parent marital status (divorced), and child gender (female). In addition, according to findings seen in Table 6, BI was positively influenced by PU, PEoU, EN, SI, and TR where H1–H5 were supported. Moreover, BI positively influences DP and AX where H6- and H7 were supported with coefficient values of 1.200 and 1.183, respectively. This agrees with the findings of [10].
The parent’s anxiety (AX) construct was measured by four items pertaining to uneasiness, nervousness, calming down, and anxiousness. The highest were AX2 and AX4 in Table 4, which is an item asking nervousness item with a mean of 4.84 and 4.83, respectively. The overall mean of the AX construct is 4.6511 and was of order two, as shown in Table 3. As seen in Table 5, AX had a strong relationship with SI, TR, and BI while it had a moderate relationship with EN and DP. AX, as a mediator construct in the proposed model, was influenced by BI according to the supported H7. In fact, the coefficient value was 1.183. and influenced CDP and CAX with coefficient values of (0.073) and (0.560), respectively. Which agrees with findings of [10,31,34,57,58].
The parent’s depression (DP) construct was measured by six items pertaining to cheer up, unhappiness, interest, loneliness, upset, and depression. DP3, DP4, and DP5 were the highest in Table 4 with means 4.82, 4.84, and 4.82, respectively. This entails that the responder uses SN to reduce unhappiness, to make life interesting, and so they would not feel lonely. The overall mean of the DP construct is 4.3587 and was of order three, as shown in Table 3. DP had a strong relationship with TR, and BI, as shown in Table 5, while having a moderate relationship with EN and a weak relationship with SI. DP was influenced by BI according to the supported H6 with a coefficient value of 1.200. And DP did influence CDP and CAX with coefficient values of 0.741 and 0.135, respectively. Which agrees with findings of [10,31,57,58]. The study [38] stated that there is “a positive correlation between SN use and depression in psychiatric inpatients,” which agrees with the finding of H6.
The child’s depression (CDP) construct was measured by six items pertaining to cheer up, unhappiness, interest, loneliness, upset, depressed. The highest items were DP1, DP2, and DP6 with means of 4.86, 4.87, and 4.86, respectively. The overall mean of the CDP construct is 4.6622 and was of order two, as shown in Table 3. CDP had a strong relationship with TR and DP, as seen in Table 5, with a moderate relationship with EN, SI, and BI. CDP was positively influenced by DP and AX according to the supported H8, and H10 with coefficient values of 0.741 and 0.073. This agrees with the findings of [10,31,34].
The child’s anxiety (CAX) construct was measured by four items pertaining to uneasiness, nervousness, calming down, and anxiousness. The highest were CAX2 and CAX3 with means (4.87) and (4.88) respectively. The overall mean of the CAX construct is (4.7447) and was of order one as shown in Table 3. CAX had a strong relationship with SI and BI as seen in Table 5, with a moderate relationship with PU, EN, and BI. CAX was positively influenced by DP and AX according to the supported H9, and H11 with coefficient values of 0.135 and 0.560, respectively, which agrees with findings from [10,12,23,31,34].
The moderators that affected BI were parents’ gender (female), parents’ marital status (divorced), and child’s gender (female). Further, there was a significant difference in the respondent BI in favor of parents’ age, parents’ educational level, parents’ time spent on the internet [38], parents’ preferred SN, parents’ internet experience, and child’s age. Age and gender agree with the finding of [54,61], time spent agrees with the findings of [55,70] and disagree with [38].
In conclusion, the research found that BI is influenced by all five independent constructs which are EN, TR, PU, PEoU, and SI. Additionally BI, the intermediate construct, influences parents’ depression and anxiety. Both parents’ depression and anxiety influence both child’s depression and anxiety. Further, BI to use SN is influenced by moderators: parents’ and child’s gender, and parents’ marital status towards female and divorced, respectively. In addition, other moderators did have an influence on BI including parents’ age, educational level, time spent on the internet, preferred SN, internet experience, and child’s age.
6.1. Theoretical Implications
In this section, the research presents the theoretical implications. First, social networks (SN) are a new ecosystem with both positive and negative aspects. As a result, this research area is underserved. As a result, this study will serve as a springboard for further investigation by researchers, practitioners, educators, and parents.
Second, the findings are consistent with the arguments of social network analysis and its relation to depression and anxiety of both parents and children, as shown in the previous section.
Third, as shown above, the gender of parent and child, as well as marital status had a significant difference in favor of female and divorced status; such findings must be investigated further.
Fourth, there is an obvious conflict between enjoyment and trust. Hence people have a lack of trust in SNs, yet they enjoy the SNs. Further, social influence (SI) is a major factor that influences user behavior. This is understandable since the word of mouth and the peer pressure to join certain SN.
6.2. Practical Implications
As for the practical implications of this research, they are as follows: this study was successfully able to provide further understanding regarding this important problem related to the negative aspects of SN. Knowing that SNs are new technology, hence developers may include warnings for users regarding time spent. Further psychological evaluation tests can be developed to detect depression and anxiety symptoms.
In addition, this study provides empirical evidence about the key dimensions that should be considered by researchers and SN developers and their social and moral responsibilities towards SN users. Further, SN users should be alert to such claims that associate SN use with anxiety and depression.
The high correlation shown in this study between the use of behavioral intention (BI) with parents’ depression and anxiety does not mean causation, but it does require more in-depth research. Further, such a finding must be a wake-up call to SN users and designers and developers. Further, the high correlation between parents’ depression and anxiety with the child’s depression needs to be investigated.
Some suggestions can be made regarding the long hours while using SN is to have an alarm that will alert the SN user. Hence, a framework for depression and anxiety detection software can alert parents and children regarding their depression and anxiety.
Another practical implication is the rating of SN, whether it is fit for kids or not, as with the movies, rather than leaving such matters in the hands of industry. Views and likes motivate the user.
As SN is a new culture, more education must be provided for parents through schools and SN itself. Adults should be aware of the negative effects of SN to protect themselves and their children.
6.3. Limitations and Directions for Further Research
Many difficulties were faced in this research. First, Jordanian and most Arab communities are very reserved when talking about topics such as depression and anxiety. In fact, people consider such topics taboo and prefer not to discuss them. Hence, the questionnaire promised anonymity, and the data will be used only as part of scientific research. Therefore, it was hard to collect data about respondents and their children. Further, respondents may try to protect their children from being stigmatized.
Second, there was an underrepresentation of parents over 48, which is understandable since we were targeting parents with children less than 17 years old, and parents’ educational level of Ph.D. and high school or less. In addition, the children’s gender was mainly male 69.4%. Of the marital status of parents, the divorced only constituted 34.4%. Parents’ preferred SN was Snapchat and Instagram, 47.7% and 30%, respectively. Children’s ages included 0–3, 3–6, 9–12, and 15–17, but the majority were 6–9 (65%) and 12–15 (28.4%).
Third, SNs are constantly developing and changing. Hence, to measure one SN and its relation to depression and anxiety is almost impossible. Still, there is an obvious need to develop a constant measure with the help of information technology and psychiatry professionals that help in the diagnosis of the initial stages of depression and anxiety.
Another difficulty faced is that SN does not share data with researchers. Given the publicly available data, it does not provide the researchers with the essential data needed to analyze the parent’s depression and anxiety and its influence on the children’s depression and anxiety.
Still, other areas of investigation, such as word of mouth and peer pressure are other aspects that should be investigated in this arena. Especially from the perspective of the parent. A high correlation between parents’ depression and anxiety with the child’s depression but not with the child’s anxiety was noticed. As such, this relationship should be investigated further.
Additionally, because these findings were correlational rather than predictive, the researchers were only able to demonstrate the existence of a trend between the variables and were unable to create a model that would predict how they would interact.
6.4. Conclusions
This study used an extended model TAM to study the influence of parents’ anxiety and depression on children’s anxiety and depression when using SNs. The research used CFA, SEM, and five ML methods to validate and verify the findings as in [88,89,90,91]. The research found that there is a high correlation between parents’ depression and anxiety with children’s depression and a weak correlation with children’s anxiety. In addition, it was found that although parents enjoy the use of SNs, they do not trust SNs. There is a high correlation between ease of use and usefulness with the use of SNs. There is a difference between divorced vs. married in favor of divorce, and gender in favor of females when using SNs.
The study did support conclusions from many studies. PU influence on BI agrees with findings of [43,44,48,49,51,54]. PEoU influence on BI agrees with findings of [12,48,49,51,54], but not [43,44]. EN influence on BI consistent with findings of [12,44,48]. TR’s influence on BI agrees with findings of [44,48]. BI influences on DP and AX agree with the findings of [10]. AX influence on CAX agrees with the findings of [10,31,34,57,58]. DP influence on CAX and CDP agrees with the findings of [10,31,34,57,58]. The moderators’ influence on BI, as explained previously, was supported by many studies, including [54,55,61,70].
Author Contributions
Conceptualization, E.M.A.-T. and I.A.; Data curation, I.A. and A.A.; Formal analysis, E.M.A.-T., R.M. and R.S.A.; Investigation, R.S.A. and A.A.; Methodology, E.M.A.-T., I.A., S.K. and A.A.; Project administration, E.M.A.-T.; Resources, I.A.; Software, R.M. and R.S.A.; Validation, R.M.; Writing—original draft, E.M.A.-T. and I.A.; Writing—review and editing, E.M.A.-T., S.K. and A.A. All authors have read and agreed to the published version of the manuscript.
Funding
This research received no external funding.
Institutional Review Board Statement
Not applicable.
Informed Consent Statement
Not applicable.
Data Availability Statement
Collected responses is available upon request.
Conflicts of Interest
The authors declare no conflict of interest.
Appendix A
Table A1.
Constructs and items.
Table A1.
Constructs and items.
| Constructs | ID: Items/Measure | Adopted from |
|---|---|---|
| Demographic Information | Parent Gender 1: Male. 2: Female. | [55] |
| Parent Age (years) 1: 18 to less than 28. 2: 28 to less than 38 years old. 3: 38 to less than 48 years old. 4: 48 to less than 58 years old. 5: Over 58 years old. | [55] | |
| Parent Educational level 1. High school and less. 2: Diploma. 3: Bachelor. 4: Master. 5: Ph.D. | [92] | |
| Marital Status 1: Divorced. 2: Married. | [54,66] | |
| Child Gender 1: Male. 2: Female. | [55] | |
| Child Age (years) 1: From less than 1 to less than 3. 2: 3 to less than 6 years old. 3: 6 to less than 9 years old. 4: 9 to less than 12 years old. 5: 12 to less than 15 years old. 6: 15 to less than 17 years old. | [55] | |
| Parent Internet experience 1: Low. 2: Good. 3: Excellent. | [93] | |
| Time spent on social media (hours) 1: one. 2: two. 3: three. 4: four. 5: Five and more. | [55] | |
| Which of the following is your favorite social network that you are using most of the time? 1: Facebook. 2: Twitter. 3: TikTok. 4: Snapchat. 5: LinkedIn. 6: YouTube. 7: Instagram. 8: Other. | ||
| Perceived usefulness (PU) | PU1: social media is useful in my daily personal life. PU2: Using social media enables me to get re-connected with people that matter to me. PU3: Using social media makes it easier to stay in touch with others effectively. PU4: Using social media makes it easier to stay informed with my friends and family. PU5: Using social media increases my educational, knowledge, and cultural levels. | [32,44,48,49,50,51,52,53] |
| Perceived ease of use (PEoU) | PEoU1: Learning how to use social media is easy for me. PEoU2: My interaction with social media is clear and understandable. PEoU3: social media is easy to use. PEoU4: It is easy for me to become skillful at using social media. | [44,48,51,52,53] |
| Perceived enjoyment (EN) | EN1: I feel that using social media is delightful. EN2: I feel that using social is enjoyable. EN3: I feel that using social is very entertaining. | [48,54,55] |
| Trust (TR) | TR1: I believe that social media is trustworthy, so I use them. TR2: I do not doubt the honesty of social media. TR3: social media provides security for my information. TR4: I feel assured that legal and technological structures adequately protect me from problems of using social media. TR5: I trust in social media that I’m using. | [94] |
| Social Influence (SI) | SI1: People I know, think that I should use social media. SI2: People who are important to me would recommend that I use social media. SI3: People, who are important, think that I should use social media. SI4: Everyone around me is thinking that I should use social media because they are using it. | [55,95] |
| Behavioral Intention (BI) | BI1: I intend to use social media in the future. BI2: I am using social media and I always try to use it whenever I can at any time. BI3: I plan to keep using social media in the future. BI4: I will recommend others to use social media. | [55,94] |
| Parent—Anxiety (AX) | AX1: I feel uneasy when I do not use social media. AX2: I feel nervous when I do not use social media. AX3: I have difficulty calming down when I do not use social media. AX4: I felt anxious when I do not use social media. | [47] |
| Parent—Depression (DP) | DP1: I feel that nothing could cheer me up except when I’m using social media. DP2: I feel unhappy when I’m not using social media. DP3: I feel that nothing was interesting except using social media. DP4: I feel lonely when I’m not using social media. DP5: I feel upset for no reason when I’m not using social media. DP6: I feel depressed when I’m not using social media. | [47] |
| Child—Anxiety (CAX) | CAX1: my child feels uneasy when he/she does not use social media. CAX2: my child feels nervous when he/she does not use social media. CAX3: my child has difficulty calming down when he/she does not use social media. CAX4: my child feels anxious when he/she does not use social media. | [47] |
| Childe Depression (CDP) | CDP1: my child feels that nothing could cheer him/her up except when he/she is using social media. CDP2: my child feels unhappy when he/she is not using social media. CDP3: my child feels that nothing was interesting except using social media. CDP4: my child feels lonely when he/she is not using social media. CDP5: my child feels upset for no reason when he/she is not using social media. CDP6: my child feels depressed when he/she is not using social media. | [47] |
References
- Shensa, A.; Escobar-Viera, C.G.; Sidani, J.E.; Bowman, N.D.; Marshal, M.P.; Primack, B.A. Problematic Social Media Use and Depressive Symptoms among U.S. Young Adults: A Nationally Representative Study. Soc. Sci. Med. 2017, 182, 150–157. [Google Scholar] [CrossRef] [PubMed]
- Ghaemi, S.N. Digital Depression: A New Disease of the Millennium? Acta Psychiatr. Scand. 2020, 141, 356–361. [Google Scholar] [CrossRef] [PubMed]
- Yang, X.; McEwen, R.; Ong, L.R.; Zihayat, M. A Big Data Analytics Framework for Detecting User-Level Depression from Social Networks. Int. J. Inf. Manag. 2020, 54, 102141. [Google Scholar] [CrossRef]
- Lia, R.J.; Siddikk, A.B.; Muntasir, F.; Rahman, S.S.M.M.; Jahan, N. Depression Detection from social media Using Twitter’s Tweet. In Big Data Intelligence for Smart Applications; Springer: Berlin/Heidelberg, Germany, 2022; pp. 209–226. [Google Scholar] [CrossRef]
- Salas-Zárate, R.; Alor-Hernández, G.; Salas-Zárate, M.D.P.; Paredes-Valverde, M.A.; Bustos-López, M.; Sánchez-Cervantes, J.L. Detecting Depression Signs on social media: A Systematic Literature Review. Healthcare 2022, 10, 291. [Google Scholar] [CrossRef] [PubMed]
- Leis, A.; Ronzano, F.; Mayer, M.A.; Furlong, L.I.; Sanz, F. Detecting Signs of Depression in Tweets in Spanish: Behavioral and Linguistic Analysis. J. Med. Internet Res. 2019, 21, e14199. [Google Scholar] [CrossRef]
- Panicheva, P.; Mararitsa, L.; Sorokin, S.; Koltsova, O.; Rosso, P. Predicting Subjective Well-Being in a High-Risk Sample of Russian Mental Health App Users. EPJ Data Sci. 2022, 11, 21. [Google Scholar] [CrossRef]
- Frances, A.; Manning, D.; Marin, D.; Kocsis, J.; McKinney, K.; Hall, W.; Kline, M. Relationship of Anxiety and Depression. Psychopharmacology 1992, 106, S82–S86. [Google Scholar] [CrossRef]
- Seabrook, E.M.; Kern, M.L.; Rickard, N.S. Social Networking Sites, Depression, and Anxiety: A Systematic Review. JMIR Ment. Health 2016, 3, e50. [Google Scholar] [CrossRef]
- Hawi, N.S.; Samaha, M. Relationships among Smartphone Addiction, Anxiety, and Family Relations. Behav. Inf. Technol. 2017, 36, 1046–1052. [Google Scholar] [CrossRef]
- Yang, Q.; Gong, X. The Engagement–Addiction Dilemma: An Empirical Evaluation of Mobile User Interface and Mobile Game Affordance. Internet Res. 2021. ahead of print. [Google Scholar] [CrossRef]
- Sun, Y.-Q.; Zhao, Y.; Jia, S.-Q.; Zheng, D.-Y. Understanding the Antecedents of Mobile Game Addiction: The Roles of Perceived Visibility, perceived Enjoyment and Flow. In Proceedings of the 19th Pacific Asia Conference on Information Systems (PACIS 2015), Singapore, 5–9 July 2015; Available online: https://aisel.aisnet.org/pacis2015/141/ (accessed on 1 August 2022).
- Kelley, S.W.; Mhaonaigh, C.N.; Burke, L.; Whelan, R.; Gillan, C.M. Machine Learning of Language Use on Twitter Reveals Weak and Non-Specific Predictions. NPJ Digit. Med. 2022, 5, 35. [Google Scholar] [CrossRef] [PubMed]
- Franco, J.A.; Carrier, L.M. Social Media Use and Depression, Anxiety, and Stress in Latinos: A Correlational Study. Hum. Behav. Emerg. Technol. 2020, 2, 227–241. [Google Scholar] [CrossRef]
- Guntuku, S.C.; Yaden, D.B.; Kern, M.L.; Ungar, L.H.; Eichstaedt, J.C. Detecting Depression and Mental Illness on Social Media: An Integrative Review. Curr. Opin. Behav. Sci. 2017, 18, 43–49. [Google Scholar] [CrossRef]
- Primack, B.A.; Shensa, A.; Sidani, J.E.; Whaite, E.O.; Lin, L.; Rosen, D.; Colditz, J.B.; Radovic, A.; Miller, E. Social Media Use and Perceived Social Isolation among Young Adults in the U.S. Am. J. Prev. Med. 2017, 53, 1–8. [Google Scholar] [CrossRef] [PubMed]
- Chatterjee, S.; Chaudhuri, R.; Vrontis, D.; Thrassou, A. Dark side of smartphone applications and its consequence to the Asian society. J. Asia Bus. Stud. 2021. ahead of print. [Google Scholar] [CrossRef]
- Qu, X.; Houser, S.H.; Zhang, J.; Wen, J.; Zhang, W. Association between Using Social Media WeChat and Depressive Symptoms among Middle-Aged and Older People: Findings from a National Survey. BMC Geriatr. 2022, 22, 351. [Google Scholar] [CrossRef] [PubMed]
- AlHamad, N.; AlAmri, K. The Association between Social Media Use and Depressive Symptoms among Adults in Riyadh, Saudi Arabia. J. Fam. Med. Prim. Care 2021, 10, 3336. [Google Scholar] [CrossRef] [PubMed]
- Kardefelt-Winther, D. A Conceptual and Methodological Critique of Internet Addiction Research: Towards a Model of Compensatory Internet Use. Comput. Hum. Behav. 2014, 31, 351–354. [Google Scholar] [CrossRef]
- Tian, X.; Bi, X.; Chen, H. How Short-Form Video Features Influence Addiction Behavior? Empirical Research from the Opponent Process Theory Perspective. Inf. Technol. People 2022. ahead of print. [Google Scholar] [CrossRef]
- Zhang, X.; Wu, Y.; Liu, S. Exploring Short-Form Video Application Addiction: Socio-Technical and Attachment Perspectives. Telemat. Inform. 2019, 42, 101243. [Google Scholar] [CrossRef]
- Sanz-Blas, S.; Buzova, D.; Miquel-Romero, M.J. From Instagram Overuse to Instastress and Emotional Fatigue: The Mediation of Addiction. Span. J. Mark. ESIC 2019, 23, 143–161. [Google Scholar] [CrossRef]
- Shensa, A.; Sidani, J.E.; Dew, M.A.; Escobar-Viera, C.G.; Primack, B.A. Social Media Use and Depression and Anxiety Symptoms: A Cluster Analysis. Am. J. Health Behav. 2018, 42, 116–128. [Google Scholar] [CrossRef] [PubMed]
- Kumar, A.; Sangwan, S.R.; Arora, A.; Menon, V.G. Depress-DCNF: A Deep Convolutional Neuro-Fuzzy Model for Detection of Depression Episodes Using IoMT. Appl. Soft Comput. 2022, 122, 108863. [Google Scholar] [CrossRef]
- Elhai, J.D.; Tiamiyu, M.; Weeks, J. Depression and Social Anxiety in Relation to Problematic Smartphone Use. Internet Res. 2018, 28, 315–332. [Google Scholar] [CrossRef]
- Kwak, M.-J.; Cho, H.; Kim, D.-J. The Role of Motivation Systems, Anxiety, and Low Self-Control in Smartphone Addiction among Smartphone-Based Social Networking Service (SN) Users. Int. J. Environ. Res. Public Health 2022, 19, 6918. [Google Scholar] [CrossRef] [PubMed]
- Reece, A.G.; Danforth, C.M. Instagram Photos Reveal Predictive Markers of Depression. EPJ Data Sci. 2017, 6, 15. [Google Scholar] [CrossRef]
- Chen, C.; Zhang, K.Z.; Gong, X.; Lee, M. Dual Mechanisms of Reinforcement Reward and Habit in Driving Smartphone Addiction. Internet Res. 2019, 29, 1551–1570. [Google Scholar] [CrossRef]
- Hong, J.; Kim, J.; Kim, S.; Oh, J.; Lee, D.; Lee, S.; Uh, J.; Yoon, J.; Choi, Y. Depressive Symptoms Feature-Based Machine Learning Approach to Predicting Depression Using Smartphone. Healthcare 2022, 10, 1189. [Google Scholar] [CrossRef] [PubMed]
- Lim, S.-I.; Jeong, S. The Relationship between Korean Parents’ Smartphone Addiction and That of Their Children: The Mediating Effects of Children’s Depression and Social Withdrawal. Int. J. Environ. Res. Public Health 2022, 19, 5593. [Google Scholar] [CrossRef] [PubMed]
- Luo, M.M.; Remus, W. Uses and Gratifications and Acceptance of Web-Based Information Services: An Integrated Model. Comput. Hum. Behav. 2014, 38, 281–295. [Google Scholar] [CrossRef]
- Ihm, J. Social Implications of Children’s Smartphone Addiction: The Role of Support Networks and Social Engagement. J. Behav. Addict. 2018, 7, 473–481. [Google Scholar] [CrossRef] [PubMed]
- Ko, C.-H.; Liu, T.-L.; Wang, P.-W.; Chen, C.-S.; Yen, C.-F.; Yen, J.-Y. The Exacerbation of Depression, Hostility, and Social Anxiety in the Course of Internet Addiction among Adolescents: A Prospective Study. Compr. Psychiatry 2014, 55, 1377–1384. [Google Scholar] [CrossRef]
- Primack, B.A.; Shensa, A.; Sidani, J.E.; Escobar-Viera, C.G.; Fine, M.J. Temporal Associations between Social Media Use and Depression. Am. J. Prev. Med. 2020, 60, 179–188. [Google Scholar] [CrossRef]
- Primack, B.A.; Shensa, A.; Escobar-Viera, C.G.; Barrett, E.L.; Sidani, J.E.; Colditz, J.B.; James, A.E. Use of Multiple Social Media Platforms and Symptoms of Depression and Anxiety: A Nationally Representative Study among U.S. Young Adults. Comput. Hum. Behav. 2017, 69, 1–9. [Google Scholar] [CrossRef]
- McCloskey, W.; Iwanicki, S.; Lauterbach, D.; Giammittorio, D.M.; Maxwell, K. Are Facebook “Friends” Helpful? Development of a Facebook-Based Measure of Social Support and Examination of Relationships among Depression, Quality of Life, and Social Support. Cyberpsychol. Behav. Soc. Netw. 2015, 18, 499–505. [Google Scholar] [CrossRef] [PubMed]
- McDougall, M.A.; Walsh, M.; Wattier, K.; Knigge, R.; Miller, L.; Stevermer, M.; Fogas, B.S. The Effect of Social Networking Sites on the Relationship between Perceived Social Support and Depression. Psychiatry Res. 2016, 246, 223–229. [Google Scholar] [CrossRef]
- Cunningham, S.; Hudson, C.C.; Harkness, K. Social media and Depression Symptoms: A Meta-Analysis. Res. Child. Adolesc. Psychopathol. 2021, 49, 241–253. [Google Scholar] [CrossRef] [PubMed]
- Davis, F.D.; Bagozzi, R.P.; Warshaw, P.R. User Acceptance of Computer Technology: A Comparison of Two Theoretical Models. Manag. Sci. 1989, 35, 982–1003. [Google Scholar] [CrossRef]
- Siau, K.; Shen, Z. Building Customer Trust in Mobile Commerce. Commun. ACM 2003, 46, 91–94. [Google Scholar] [CrossRef]
- Gefen, D.; Karahanna, E.; Straub, D.W. Trust and TAM in Online Shopping: An Integrated Model. MIS Q. 2003, 27, 51–90. [Google Scholar] [CrossRef]
- Shaw, B.; Kesharwani, A. Moderating Effect of Smartphone Addiction on Mobile Wallet Payment Adoption. J. Internet Commer. 2019, 18, 291–309. [Google Scholar] [CrossRef]
- Alalwan, A.A.; Baabdullah, A.M.; Rana, N.P.; Tamilmani, K.; Dwivedi, Y.K. Examining Adoption of Mobile Internet in Saudi Arabia: Extending TAM with Perceived Enjoyment, Innovativeness and Trust. Technol. Soc. 2018, 55, 100–110. [Google Scholar] [CrossRef]
- Maqableh, M.; Abuhashesh, M.; Dahabiyeh, L.; Al Nawayseh, M.K.; Masa’Deh, R. The Effect of Facebook Users’ Satisfaction and Trust on Stickiness: The Role of Perceived Values. Int. J. Data Netw. Sci. 2021, 5, 245–256. [Google Scholar] [CrossRef]
- Meshi, D.; Ellithorpe, M. Problematic Social Media Use and Social Support Received in Real-Life versus on social media: Associations with Depression, Anxiety and Social Isolation. Addict. Behav. 2021, 119, 106949. [Google Scholar] [CrossRef] [PubMed]
- Pilkonis, P.A.; Choi, S.W.; Reise, S.P.; Stover, A.M.; Riley, W.T.; Cella, D. Item banks for measuring emotional distress from the patient-reported outcomes measurement information system (PROMIS®): Depression, anxiety, and anger. Assessment 2011, 18, 263–283. [Google Scholar] [CrossRef]
- Bashir, I.; Madhavaiah, C. Consumer Attitude and Behavioural Intention towards Internet Banking Adoption in India. J. Indian Bus. Res. 2015, 7, 67–102. [Google Scholar] [CrossRef]
- Mpinganjira, M. Cognitive Absorption and Behavioural Intentions in Virtual Health Communities. J. Syst. Inf. Technol. 2019, 21, 122–145. [Google Scholar] [CrossRef]
- Steininger, K.; Stiglbauer, B. EHR Acceptance among Austrian Resident Doctors. Health Policy Technol. 2015, 4, 121–130. [Google Scholar] [CrossRef]
- Akter, S.; Islam, M.A. Perceived Value of social media in Students’ Participation in Social Movement. Digit. Libr. Perspect. 2019. ahead of print. [Google Scholar] [CrossRef]
- Li, J.; Chang, X. Improving Mobile Health Apps Usage: A Quantitative Study on MPower Data of Parkinson’s Disease. Inf. Technol. People 2020. ahead of print. [Google Scholar] [CrossRef]
- Ambrose, G.J.; Meng, J.; Ambrose, P.J. Why Do Millennials Use Facebook? Enduring Insights. Qual. Mark. Res. Int. J. 2020, 23, 171–197. [Google Scholar] [CrossRef]
- Smeda, A.M.; Shiratuddin, M.F.; Wong, K.W. Measuring the Moderating Influence of Gender on the Acceptance of E-Book amongst Mathematics and Statistics Students at Universities in Libya. Knowl. Manag. E-Learn. Int. J. 2017, 9, 177–199. [Google Scholar] [CrossRef]
- Puriwat, W.; Tripopsakul, S. Explaining Social Media Adoption for a Business Purpose: An Application of the UTAUT Model. Sustainability 2021, 13, 2082. [Google Scholar] [CrossRef]
- Bixter, M.T.; Blocker, K.A.; Mitzner, T.L.; Prakash, A.; Rogers, W.A. Understanding the Use and Non-Use of Social Communication Technologies by Older Adults: A Qualitative Test and Extension of the ATAUT Model. Gerontechnology 2019, 18, 70–88. [Google Scholar] [CrossRef] [PubMed]
- Watson, S. Depression vs. Anxiety: Which One Do I Have? 2021 WebMD, LLC. Available online: https://www.webmd.com/depression/depression-or-anxiety (accessed on 1 August 2022).
- Tuma, A.H.; Maser, J. (Eds.) Anxiety and the Anxiety Disorders; Routledge: London, UK, 2019. [Google Scholar] [CrossRef]
- Jbeen, A.; Ur Rehman, S.; Mahmood, K. Awareness, Use and Attitudes of Students towards E-Books: Differences Based on Gender, Discipline and Degree Level. Glob. Knowl. Mem. Commun. 2021, 71, 449–467. [Google Scholar] [CrossRef]
- Glavee-Geo, R.; Shaikh, A.A.; Karjaluoto, H. Mobile Banking Services Adoption in Pakistan: Are There Gender Differences? Int. J. Bank Mark. 2017, 35, 1090–1114. [Google Scholar] [CrossRef]
- Chawla, D.; Joshi, H. The Moderating Role of Gender and Age in the Adoption of Mobile Wallet. Foresight 2020. ahead of print. [Google Scholar] [CrossRef]
- Merhi, M.; Hone, K.; Tarhini, A.; Ameen, N. An Empirical Examination of the Moderating Role of Age and Gender in Consumer Mobile Banking Use: A Cross-National, Quantitative Study. J. Enterp. Inf. Manag. 2020. ahead of print. [Google Scholar] [CrossRef]
- Soja, E.; Soja, P. Fostering ICT Use by Older Workers. J. Enterp. Inf. Manag. 2020, 33, 407–434. [Google Scholar] [CrossRef]
- Zhou, Q.; Lee, C.S.; Sin, S.-C.J.; Lin, S.; Hu, H.; Bin Ismail, M.F.F. Understanding the Use of YouTube as a Learning Resource: A Social Cognitive Perspective. Aslib J. Inf. Manag. 2020, 72, 339–359. [Google Scholar] [CrossRef]
- Kagzi, M.; Guha, M. Does Board Demographic Diversity Influence Firm Performance? Evidence from Indian-Knowledge Intensive Firms. Benchmarking: Int. J. 2018, 25, 1028–1058. [Google Scholar] [CrossRef]
- Escobar-Rodríguez, T.; Grávalos-Gastaminza, M.A.; Pérez-Calañas, C. Facebook and the Intention of Purchasing Tourism Products: Moderating Effects of Gender, Age and Marital Status. Scand. J. Hosp. Tour. 2016, 17, 129–144. [Google Scholar] [CrossRef]
- Sabri Alrawi, M.A.; Narayana Samy, G.; Mohd Yusoff, R.C.; Shanmugam, B.; Lakshmiganthan, R.; Maarop, N.; Kamaruddin, N. Examining Factors That Effect on the Acceptance of Mobile Commerce in Malaysia Based on Revised UTAUT. Indones. J. Electr. Eng. Comput. Sci. 2020, 20, 1173. [Google Scholar] [CrossRef]
- Griffith, D.A.; Lee, H.S.; Yalcinkaya, G. The Use of social media and the Prevalence of Depression: A Multi-Country Examination of Value Co-Creation and Consumer Well-Being. Int. Mark. Rev. 2022, 39, 1–31. [Google Scholar] [CrossRef]
- Coyne, S.M.; Rogers, A.A.; Zurcher, J.D.; Stockdale, L.; Booth, M. Does Time Spent Using Social Media Impact Mental Health? An Eight Year Longitudinal Study. Comput. Hum. Behav. 2019, 104, 106160. [Google Scholar] [CrossRef]
- Sampasa-Kanyinga, H.; Lewis, R.F. Frequent Use of Social Networking Sites Is Associated with Poor Psychological Functioning among Children and Adolescents. Cyberpsychology Behav. Soc. Netw. 2015, 18, 380–385. [Google Scholar] [CrossRef] [PubMed]
- Windasari, N.A.; Albashrawi, M. Behavioral Routes to Loyalty across Gender on M-Banking Usage. Rev. Int. Bus. Strategy 2020. ahead of print. [Google Scholar] [CrossRef]
- Peng, L.; Liao, Q.; Wang, X.; He, X. Factors Affecting Female User Information Adoption: An Empirical Investigation on Fashion Shopping Guide Websites. Electron. Commer. Res. 2016, 16, 145–169. [Google Scholar] [CrossRef]
- Hair, J.; Black, W.; Babin, B.; Anderson, R.; Tatham, R. Multivariate Data Analysis, 7th ed.; Prentice-Hall: Hoboken, NJ, USA, 2010. [Google Scholar]
- Pallant, J. SPSS Survival Manual: A Step Guide to Data Analysis Using SPSS for Windows Version 12; Open University Press: Chicago, IL, USA, 2005. [Google Scholar]
- Sekaran, U.; Bougie, R. Research Methods for Business: A Skill-Building Approach, 6th ed.; Wiley: New York, NY, USA, 2013. [Google Scholar]
- Fornell, C.; Larcker, D.F. Evaluating Structural Equation Models with Unobservable Variables and Measurement Error. J. Mark. Res. 1981, 18, 39–50. [Google Scholar] [CrossRef]
- Bagozzi, R.P.; Yi, Y. On the Evaluation of Structural Equation Models. J. Acad. Mark. Sci. 1988, 16, 74–94. [Google Scholar] [CrossRef]
- Hair, J.F.; Black, W.C.; Babin, B.J.; Anderson, R.E. Multivariate Data Analysis; Pearson Prentice Hall: Upper Saddle River, NJ, USA, 2021. [Google Scholar]
- Newkirk, H.E.; Lederer, A.L. The Effectiveness of Strategic Information Systems Planning under Environmental Uncertainty. Inf. Manag. 2006, 43, 481–501. [Google Scholar] [CrossRef]
- Principles and Practice of Structural Equation Modeling: Fourth Edition. Available online: https://www.guilford.com/books/Principles-and-Practice-of-Structural-Equation-Modeling/Rex-Kline/9781462523344 (accessed on 1 January 2022).
- Creswell, J. Research Design: Qualitative, Quantitative, and Mixed Methods Approaches, 3rd ed.; Sage Publications: Thousand Oaks, CA, USA, 2009. [Google Scholar]
- Witten, I.H.; Frank, E.; Hall, M.A.; Pal, C.J. Data Mining, Fourth Edition: Practical Machine Learning Tools and Techniques, 4th ed.; Morgan Kaufmann Publishers Inc.: San Francisco, CA, USA, 2016. [Google Scholar]
- Da Silva, I.N.; Spatti, D.H.; Flauzino, R.A.; Liboni, L.H.B.; dos Reis Alves, S.F. Artificial neural network architectures and training processes. In Artificial Neural Networks; Springer: Berlin/Heidelberg, Germany, 2017; pp. 21–28. [Google Scholar]
- Yao, W.; Li, L. A new regression model: Modal linear regression. Scand. J. Stat. 2014, 41, 656–671. [Google Scholar] [CrossRef]
- Platt, J. Sequential Minimal Optimization: A Fast Algorithm for Training Support Vector Machines. 1998. Available online: https://www.microsoft.com/en-us/research/publication/sequential-minimal-optimization-a-fast-algorithm-for-training-support-vector-machines/ (accessed on 1 August 2022).
- Breiman, L. Bagging Predictors. Mach. Learn. 1996, 24, 123–140. [Google Scholar] [CrossRef]
- Tasin, T.; Habib, M.A. Computer-Aided Cataract Detection Using Random Forest Classifier. In Proceedings of the International Conference on Big Data, IoT, and Machine Learning, Sydney, Australia, 22–23 October 2022; Springer: Berlin/Heidelberg, Germany, 2022; pp. 27–38. [Google Scholar]
- Abu-Taieh, E.M.; AlHadid, I.; Abu-Tayeh, S.; Masa’deh, R.; Alkhawaldeh, R.S.; Khwaldeh, S.; Alrowwad, A. Continued Intention to Use of M-Banking in Jordan by Integrating UTAUT, TPB, TAM and Service Quality with ML. J. Open Innov. Technol. Mark. Complex. 2022, 8, 120. [Google Scholar] [CrossRef]
- Abu-Taieh, E.; AlHadid, I.; Masa’deh, R.; Alkhawaldeh, R.S.; Khwaldeh, S.; Alrowwad, A. Factors Influencing YouTube as a Learning Tool and Its Influence on Academic Achievement in a Bilingual Environment Using Extended Information Adoption Model (IAM) with ML Prediction—Jordan Case Study. Appl. Sci. 2022, 12, 5856. [Google Scholar] [CrossRef]
- AlHadid, I.; Abu-Taieh, E.; Alkhawaldeh, R.S.; Khwaldeh, S.; Masa’deh, R.; Kaabneh, K.; Alrowwad, A. Predictors for E-Government Adoption of SANAD App Services Integrating UTAUT, TPB, TAM, Trust, and Perceived Risk. Int. J. Environ. Res. Public Health 2022, 19, 8281. [Google Scholar] [CrossRef]
- Masa’deh, R.; AlHadid, I.; Abu-Taieh, E.; Khwaldeh, S.; Alrowwad, A.; Alkhawaldeh, R.S. Factors Influencing Students’ Intention to Use E-Textbooks and Their Impact on Academic Achievement in Bilingual Environment: An Empirical Study Jordan. Information 2022, 13, 233. [Google Scholar] [CrossRef]
- Owusu Kwateng, K.; Osei Atiemo, K.A.; Appiah, C. Acceptance and Use of Mobile Banking: An Application of UTAUT2. J. Enterp. Inf. Manag. 2019, 32, 118–151. [Google Scholar] [CrossRef]
- Samsudeen, S.N.; Selvaratnam, G.; Hayathu Mohamed, A.H. Intention to Use Mobile Banking Services: An Islamic Banking Customers’ Perspective from Sri Lanka. J. Islam. Mark. 2020, 13, 410–433. [Google Scholar] [CrossRef]
- Tiwari, P.; Tiwari, S.K.; Gupta, A. Examining the Impact of Customers’ Awareness, Risk and Trust in M-Banking Adoption. FIIB Bus. Rev. 2021, 10, 413–423. [Google Scholar] [CrossRef]
- Baabdullah, A.M.; Alalwan, A.A.; Rana, N.P.; Kizgin, H.; Patil, P. Consumer Use of Mobile Banking (M-Banking) in Saudi Arabia: Towards an Integrated Model. Int. J. Inf. Manag. 2019, 44, 38–52. [Google Scholar] [CrossRef]


Publisher’s Note: MDPI stays neutral with regard to jurisdictional claims in published maps and institutional affiliations. |
© 2022 by the authors. Licensee MDPI, Basel, Switzerland. This article is an open access article distributed under the terms and conditions of the Creative Commons Attribution (CC BY) license (https://creativecommons.org/licenses/by/4.0/).