1. Introduction
Falls are common external causes of unintentional injuries. In everyday life, people might experience falls due to different reasons: illness, frailty, or loss of balance in any normal activity. Given that frequency of falls increases with age, older adults are more likely to experience falls than individuals in other age groups(Rajagopalan et al. [
1]). Approximately 28–35% of people aged 65 and over fall each year, and this increases to 32–42% for those over 70 years of age (Habib et al. [
2]). Failure to provide immediate care to the person who has fallen may lead to irreparable harm, such as chronic disability or death. Real-time detection and prediction of falls can help to reduce the negative consequences of falls as it allows for timely prevention and/or receiving medical attention. In such cases, having a fall detection system would be of great help.
There are three main techniques by which fall data are collected: ambiance sensors, wearable devices, and vision-based devices. The method of data collection is different in each of the mentioned techniques. Each of these techniques will be explained below.
Ambient sensors are sensors installed in the environment, such as infrared devices, floor-based devices, pressure sensors, etc. The data collected through ambient sensors are mostly used in activity detection models where the environmental conditions may affect correct detection. This study does not refer to work conducted using ambient sensors because the focus of this research, regardless of environmental conditions, is only on examining changes in key points of the body during a fall.
In wearable devices, data are frequently collected through inertial measurement units (IMUs), such as accelerometers and gyroscopes attached to different parts of the person’s body. This includes sensors embedded in smartphones, smartwatches, and other portable devices. Wearable-sensor fall detection approaches [
3,
4,
5,
6] use IMUs to characterize and detect a fall using time series data. They investigated a variety of deep learning (DL) models, such as LSTM, convolutional neural network (CNN), autoencoder-CNN-LSTM, decision tree (DT), K-nearest neighbor (KNN), and support vector machine (SVM) to detect falls. Another type of wearable-sensor-based approach for fall detection was reported by Shi and Chen [
7]. They reported accurate fall prediction by applying a CNN technique and a class activation mapping (CAM) method. This highlighted the class-specific region in the data and obtained a hot map of the fall data. Learning was again based on the real-time data from an IMU-sensor mounted on the person’s waist.
Wearable devices have gained noticeable popularity among all other fall detection systems due to their ease of use and portability. However, the use of wearable sensors may have some flaws. Sensors may not always provide accurate data. Namely, the sensors that are measuring a person’s acceleration or rotation might show different measurements even if they are manufactured in the same company and have the same brand. Furthermore, the presence of noise in such data is inevitable (Marsico et al. [
8]). Therefore, some preprocessing methods are needed to be applied to data to make them ready to be used in machine learning (ML) models, and this may be time-consuming. Another consideration is regarding misalignment of sensors that could lead to erroneous readings. There are also concerns about sensors’ battery replacement/charging; otherwise, they may have erroneous measurements. Since the target community of this research is mostly older adults and/or people who are unable to maintain their balance, it seems that attaching an external object, such as a sensor to their body, might cause inconveniences.
However, use of data generated by video images does not seem to have the above-mentioned problems. Here are some of the newest methods in which video images are deployed for fall detection.
According to computer-vision fall detection methods [
9,
10,
11], to distinguish between fall and non-fall events, the human head/body is tracked in consecutive frames using the best-fit approximated ellipse and projection histograms. In other studies [
12,
13,
14,
15], based on computer-vision, to distinguish falls from not-fall activities, the histogram of oriented gradient (HOG) and optical flow techniques were used to produce a human body’s contour. In order to implement their works, the authors in Refs. [
12,
13,
14,
15] have used a variety of ML and DL models, such as SVM, KNN, multi-layer perceptron (MLP), and CNN. Another computer-vision-based solution [
16,
17,
18] for fall detection leverages the human skeleton from Kinect and OpenPose to obtain body key points. These key points are used to identify and predict falls using DL models, such as CNN, recurrent neural network (RNN), and LSTM. Compared to human contour recognition, skeleton recognition is less susceptible to environmental disturbance and offers better privacy protection. The training time is reduced since the training data are based on joint points rather than images.
Finally, it seems that the fall prediction methods obtain more accurate results as they are more convenient to integrate image-processing techniques and machine-learning algorithms for reliable estimation of fall risks and provide timely alerts before the occurrence of a fall (Lin et al. [
18]).
In our study, a motion description model based on body kinematic changes is established by detecting the human body in an active frame and marking the body’s skeleton key points. The fall behavior detection models proposed in this work are evaluated using well-known statistical parameters: precision, recall, F1-score, and accuracy.
This study aims to assist caregivers to predict falls in a timely manner using images extracted from videos recorded by surveillance systems and can play a significant role in intelligent safety systems for older adults. However, to be able to accurately differentiate between a fall and not-fall behavior, development of an intelligent system is needed. Such an intelligent system is fed by images and will be able to improve itself using feedback in order to achieve higher accuracies.
The present study proposes a System for Alarming of Fall in oldEr adults (SAFE), an integrated approach consisting of body kinematics and ML techniques. The model data consist of video recordings collected in the UP-Fall Detection dataset experiment.
In this article, our contributions are:
Using the MediaPipe framework algorithm (Algorithm 1), a simplified descriptive geometry using only three human skeleton key points is drawn (
Figure 1). These key points could conveniently explore the characteristics of the human motion pose. Extracting only three body key points from the image, in addition to spending a short time for image processing, achieves high accuracy in fall detection.
The output of the MediaPipe algorithm is used to calculate some angles for the selected three key points (
Section 2.3.3). To the best of the authors’ knowledge, this is the first time that this approach has been used to detect falls.
2. Materials and Methods
2.1. Data and Materials
The data used in this work are the well-known UP-Fall Detection dataset (Mardinez and Ponse [
14]). This dataset consists of falls and several activity daily living (ADL) data. The data are acquired by a multimodal approach using 14 devices to measure activity in three different ways using wearables, context-aware sensors, and cameras, all at the same time. Data were collected from 17 healthy young adults called subjects (9 male and 8 female) ranging from 18 to 24 years of age without impairment. The subjects’ mean height was 1.66 m, and their mean weight was 66.8 kg. Of course, collecting these data for older adults is more desirable, but the risk of such a simulation is too high because of possible injuries and harm. On the other hand, since we are looking for body posture of some key points, angles, and coordinates, the age of subjects may have little influence on the results.
Wearable sensors consisted of inertial sensors collecting raw data, namely 3-axis accelerometers, 3-axis gyroscopes, and the ambient light sensors. These wearables sensors were located on the left wrist, on the neck, in the right pocket of their pants, in the middle of the waist (on the belt), and on the left ankle. Moreover, one electroencephalogram (EEG) headset was worn by all subjects on their foreheads in order to measure the raw brainwave signal. The ambient sensors used were six infrared sensors as a grid. The infrared sensors measured the changes in the interruption of the optical devices and were installed 0.40 m above the floor. Keeping in mind that the focus of this research is only on examining changes in key points of the body during a fall, we only use images received from video cameras and, therefore, do not refer to data gathered using wearable sensors or any of the context-aware sensors, such as EEG, and ambient sensors.
The cameras used were Microsoft LifeCam Cinema cameras, which were located 1.82 m above the floor. Cameras were used to capture video images of subjects, with a resolution of 640 × 480 pixels. Along with these images, the time-stamp label and the target tag (Activity ID) in each image were also stored in the dataset. Two cameras were used for this task, one for a lateral view and the other for a frontal view. The sampling frequency of images was tuned at ∼18 Hz and in a time-series order.
The UP-Fall Detection dataset comprises 11 activities, including 6 human daily activities (i.e., walking, standing, picking up an object, sitting, jumping, and lying down) and 5 human falls (falling forward using hands, falling forward using knees, falling backward, falling while sitting in an empty chair, and falling sideward). Three trials are recorded for each activity. Since this work is based on the information extracted from frame images, only images acquired by the lateral camera were used. Given that the purpose of this study is to find a new approach to detecting falls, only images of subjects experiencing forward and sideward falling were deployed. Note that the UP-Fall Detection dataset has a time label.
2.2. System Configuration
Processing and calculations were completed at the TUF Gaming FX505DV_FX505DV workstation based on an NVIDIA GeForce RTX 2060, an AMD Ryzen 7 3750H with Radeon Vega Mobile Gfx, 4 cores, and 64 GB memory. On the software side, Python (version 3.8.5) was used to code the model in a Jupyter notebook (version 2.2.6). The preprocessing, preparation, and training of the models were completed in Python. The final model was set up with Tensorflow (API 2.5.0). Loading and managing the data were completed in the pandas (version 1.1.3) and NumPy (version 1.19.5) libraries. Matplotlib (version 3.3.2) was used for visualization of the data.
2.3. Methodology
To diagnose falling, the points on the body that have the greatest impact on maintaining subject stability were used. The points that are commonly selected in similar research are the nose, shoulders, hips, and knees. Finally, the data used in this research are the coordinates of 3 key points of the body in the three directions of X, Y, and Z and are extracted starting from frames where the subject is still in a stable condition. In the first stage of image processing, the coordinates of specified body key points were extracted from each image.
The parameters primarily considered for fall detection consisted of:
Coordinates of the nose, left shoulder, right shoulder, left hip, right hip, left knee, right knee.
The rate of change in the angle between the connected line from the nose, left shoulder, right shoulder, left hip, and right hip body key points to the origin with the x-axis.
The ratio of the y-coordinate of nose to the y-coordinate of left hip in two consecutive frames.
The performance of each one of these parameters was investigated, where the best of them were used in this work. However, too many feature parameters may cause the recognition rate to either decrease or become more complicated. By testing many combinations of different parameters, only 3 points were retained as training feature values. As shown in
Figure 2, the body key points used in this work were: nose (N), left shoulder (LSh), and left hip (LH).
With extraction of the body key points in each frame image, simultaneously, the angle of the body key point with respect to the x-axis and the time-derivatives related to each body key point were calculated.
The proposed method is an integrated approach consisting of body kinematics and machine learning, where it is anticipated there is a higher accuracy in fall detection. In this work, the well-known LSTM network model has been deployed. This model is concisely introduced in the upcoming sub-section.
2.3.1. LSTM Model Description
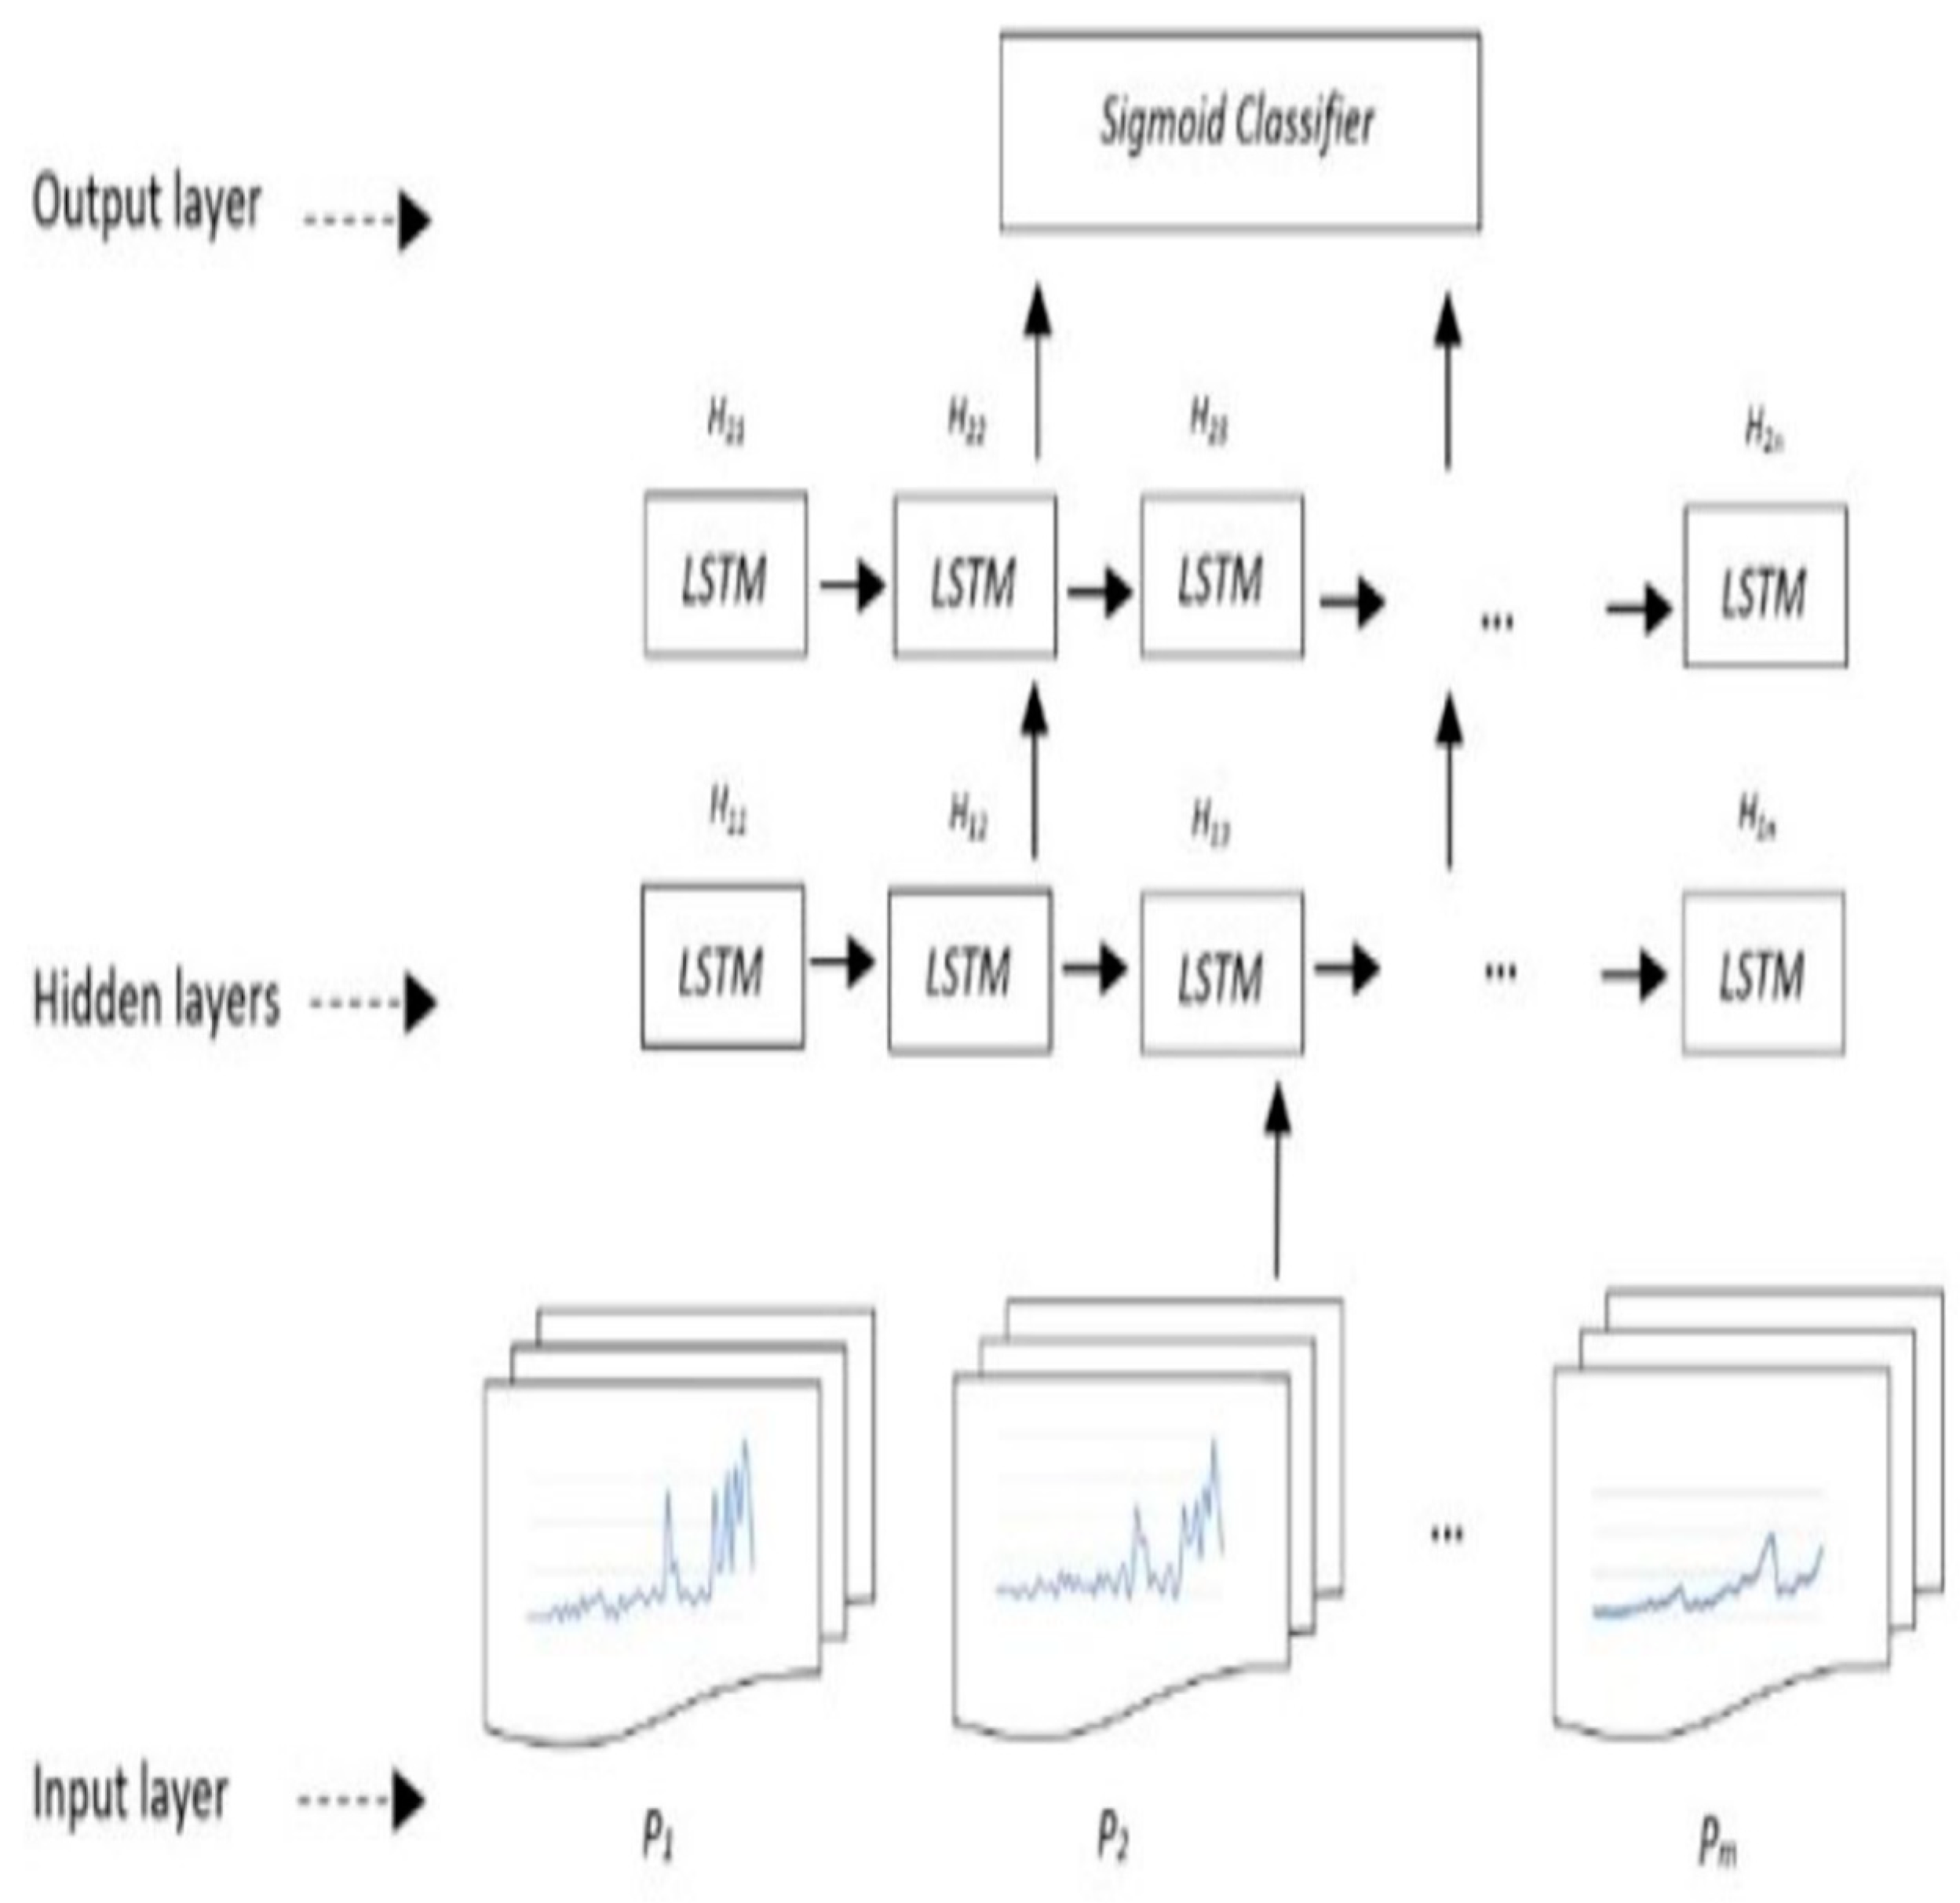
As mentioned earlier, the model used in this work is LSTM network. An overview of the network architecture is shown in
Figure 2. The calculated parameters, described in
Section 2.3.3, are fed into the first LSTM layer and the model is trained, where its output is passed to the second layer. These two LSTM layers are followed by a dropout of 0.3 to avoid overfitting. Next, a dense layer holding one output neuron can detect falls and not-fall conditions. The Adam optimizer is used to change the attributes of the neural network, such as weights and learning rate, to reduce the losses. The first LSTM layer neurons are involved with one sequence of data. The first and second LSTM layer both hold 100 neurons. To control how well the network model learns the training dataset, the relu activation function is applied in the model. As the case in this study is a binary classification task, at last, the sigmoid activation function is used in the dense layer to distinguish between falls and not-falls.
The concept of each layer as shown in
Figure 2 is as follows:
The input layer consists of P
1, P
2…, P
m, all calculated parameters described in
Section 2.3.3, where the value of m depends on the number of parameters used in the models described in
Section 2.3.4.
The hidden layers are two layers, H1n and H2n, for the nth LSTM neuron in the first hidden layer, and the nth LSTM neuron in the second hidden layer, respectively.
The output layer contains the calculated parameters mapped into two classes of fall and not-fall by a sigmoid classifier in the form of a vector. This vector has three dimensions, where it has been decomposed into a sliding window with a length of 18. The input data of LSTM are the time series of the 18 × m matrix.
To apply the LSTM model to the present work, we need to define an experimental space through which the coordinates of different key points of the subject’s body can be calculated. This space is defined in sub-
Section 2.3.2 below.
2.3.2. Visualization of the Experimental Space
To distinguish between the balance and imbalance of a human body, it is necessary to consider the body orientation with respect to a fixed coordinate system. Moreover, this coordinate system will be used to visualize the space in which the required input parameters are being calculated. Mardinez and Ponse [
14] have taken the axes of the coordinate system at the outer left corner in the depth of the image, where the positive y-axis points down towards the floor, the positive x-axis points to the right side of the image, and the positive z-axis points toward the frame, as shown in
Figure 1a.
To fully visualize the motion posture and also to be able to analyze the motion instability of the human body, a simplified descriptive geometry is drawn in
Figure 1b. This geometry contains only three human skeleton key points by which the characteristics of the motions can be explored. This simplification takes place in the preprocessing stage with a lower complexity in the computations. It is believed that, by extracting only 3 body key points in an active image frame, and with the help of physical characteristics of a human body due to various standing postures, we might be able to predict the subject’s fall correctly. The pseudo-code of the extraction of the key points algorithm is completed through a light-weighted algorithm MediaPipe framework (Algorithm 1) below.
| Algorithm 1. Key point detection algorithm on the human body using Media Pipe framework |
Input: The continuous frames F in the video;
Output: X, Y, and Z coordinate values of key points (Kp): “Nose, Left Shoulder, Left Hip”;
for i ← 1 to #F do
Capture current frame Fi;
Detect the person in the current image using pose Detector ();
Extract key points from the person’s body using mpPose.Pose;
Calculate the key point values with respect to X-, Y-, and Z-axis coordinates using mpPose.Pose;
Connect the related specified key points to form the human skeleton;
Construct the human-body-specified key point set Kp;
end
return Kp. |
The outputs of Algorithm 1 are used to calculate some angles for the above-mentioned 3 key points (Equations (1)–(3)) below.
2.3.3. Input Parameters Calculation
According to the theory of human body dynamics, the balance and stability of the human body are closely related to the position of the body and the position of the support plate (Zhang and Wu [
17]). The key points that were used in this study are nose (N:1), left shoulder (LSh:2), and left hip (LH:3), as shown in
Figure 1. The extracted information from images consists of only x and y-coordinates of N, LSh, and LH key points, where the other required input parameters will be calculated by these coordinates in the next steps.
The parameters used as input in the proposed models have been calculated through the following steps:
Step 1: calculation of the angle between the connected line from each body key point to the origin with the x-axis (Equation (1)):
where
A is in radian,
X, and
Y are coordinates.
Step 2: the rate of change in angle
between two consecutive frames (Equation (2));
where
i takes
N,
LSh, and
LH for nose, left shoulder, and left hip, respectively, and ∆
t is the time interval between two consecutive frames.
Step 3: the ratio of the
to
in every active frame (Equation (3)):
In these three equations, 4 parameters of , for nose, left shoulder, and left hip, respectively, and also R as the ratio of the to were calculated. Here, Nx and Ny are the x and y-coordinates of nose, respectively.
2.3.4. Models Description
Three different Systems for Alarming of Fall in oldEr adults (SAFE) are proposed in this work as below.
Model with Four Parameters (4p-SAFE)
In this model, the LSTM network will be applied and four parameters of Nx, Ny, (Equation (2)), and the R (Equation (3)) will be used as input.
Model with Five Parameters (5p-SAFE)
In 5p-model, again, the LSTM network will be applied, where, this time, five parameters of Nx, Ny, and the
(Equation (2)) will be deployed as input.
Model with Six Parameters (6p-SAFE)
Finally, in the 6p-model, the LSTM network with six input parameters of
Nx,
Ny,
(Equation (2)), and the
R (Equation (3)) will be proposed. In all three models, the network setting is as shown in
Table 1.
4. Discussion
4.1. 4p-SAFE
When a person is experiencing a fall, the dwN (Equation (2)) is usually higher than when he/she is bending forward intentionally. Although it seems that choosing the dwN parameter is a good choice for fall detection, there might be cases in which someone bends forward at a higher rate compared to when bending forward intentionally (for instance, in exercise).
To be able to distinguish between balance and imbalance postures, it was decided to use dwN along with the ratio of the y-coordinate of the nose to the y-coordinate of the left hip (Equation (3)). The closer the person’s head to the ground, the larger would be this ratio. Hence, if the amount of this ratio exceeds 1 and at the same time dwN becomes large enough, the person is more likely to fall.
The final correct recognition rate of the LSTM network achieved in the 4p-SAFE model is 96.99%.
4.2. 5p-SAFE
When a person bends forward intentionally, even if their dw1 value is large enough and the dwLSh and dwLH (Equation (2)) are not large enough, it seems it is possible for them to be able to keep their balance. On the other hand, if the dwLSh and dwLH increase steadily along with dwN, the possibility of stability would be significantly reduced and the person is more likely to fall. Therefore, it seems that using all three parameters as model input may have a significant impact regarding correct diagnosis of a fall.
The rate of fall detection shows a noticeable improvement of 97.74% in the 5p-SAFE model.
4.3. 6p-SAFE
The improvement in correct recognition rate in 6p-SAFE seems to be due to the deployment of the R (Equation (3)) parameter. There might be cases in which the observer is expecting that someone is about to fall but the person can well regain his/her stability at that moment. In these cases, we believe that the ratio R would help in correct fall predictions. This means that, when a person is experiencing an increase in the three parameters dwN, dwLSh, and dwLH, and at the same time their nose reaches close enough to the ground, they probably lose their balance, and a fall is almost definite.
According to the results obtained, using the 6p-SAFE model, a significant increase in correct fall and not-fall diagnosis is achieved. The model performance shows 98.5% in accuracy.
It is found that use of body key points improves training time effectively as well as eliminating the effects of traditional image-based approaches, such as blurriness, light, and shadows (Lin et al. [
18]).
The best accuracy we achieved in this work was about 98.5%, which is comparable with the work of Zhang and Wu [
17], where the accuracy in fall prediction was claimed to be 97.9%.
The difference between this work and the one of Zhang and Wu [
17] lies in the technique of the Lagrangian mechanical system, which is not directly used in this work. In the work of Zhang and Wu [
17], rotational energy and generalized force with five key points were used, while, in this work, only three key points and some angles that were easy to calculate with low time consumption was proposed. The assumption of the connecting rod is used in our work as well, but the change in angle of these rods and the coordinate of their endpoints is what we used in this work. The use of Lagrangian mechanics can result in some complexity because the correct mass of subjects and the density distribution throughout the body is needed in order to be able to correctly calculate the force and rotational energy where this information cannot be extracted from the image.
5. Conclusions
Falls, especially for older adults, are one of the common causes of injury and illness. To prevent these events and to promote the health and wellness of older adults, especially in healthcare premises and streets in daily life, accurate prediction and awareness are essential. The present study proposed an integrated approach consisting of body kinematics and machine learning. The model data consisted of video recordings collected in an experiment conducted by Mardinez and Ponse [
14]. Three LSTM-network-based models of 4p-SAFE, 5p-SAFE, and 6p-SAFE were developed. The parameters needed for these models consisted of some body key points coordinates and angles extracted from the videos supplied by fixed cameras, which could be installed everywhere, especially on aged-care premises. The body key points are nose, left shoulder, and left hip.
The results show acceptable performance in using the traditional machine learning algorithms, with acceptable accuracy of fall and not-fall recognition. These accuracy values were 96.99, 97.74, and 98.5 percent for the 4p-SAFE, 5p-SAFE, and 6p-SAFE models, respectively. In the 4p-SAFE model, four parameters that can easily be extracted from images were used. Although the accuracy in this model is lower than in the other two models, by developing a feedback mechanism, one might gradually increase accuracy in prediction. Of course, this is true for the other two models as well. However, if feedback is not possible, then the 6p-SAFE model is strongly recommended.
What makes the proposed method suitable for use in aged-care premises is highlighted as follows:
The models have relied on minimum parameters.
The method is novel, simple, accurate, and reliable for applying to elderlies, especially in aged-care premises.
The method can use feedback data and improve its accuracy in prediction.
Finally, the simplicity assumed in this work expedites prediction and simplifies calculation. However, by advancements in camera technology and computer processors, more key points could be used in models of the same logic.


