
A Systematic Review with Framework Synthesis of the Ways That Urban Environments Influence Opportunities for Healthy and Sustainable Mobility in Older Age
 ,
,  , ,
, , 
Abstract
1. Introduction
2. Methods
2.1. Identification of Studies
2.2. Selection of Studies
2.3. Inclusion of Studies
2.4. Appraisal of Studies
2.5. Analysis of Studies
2.6. Synthesis of Studies
3. Results
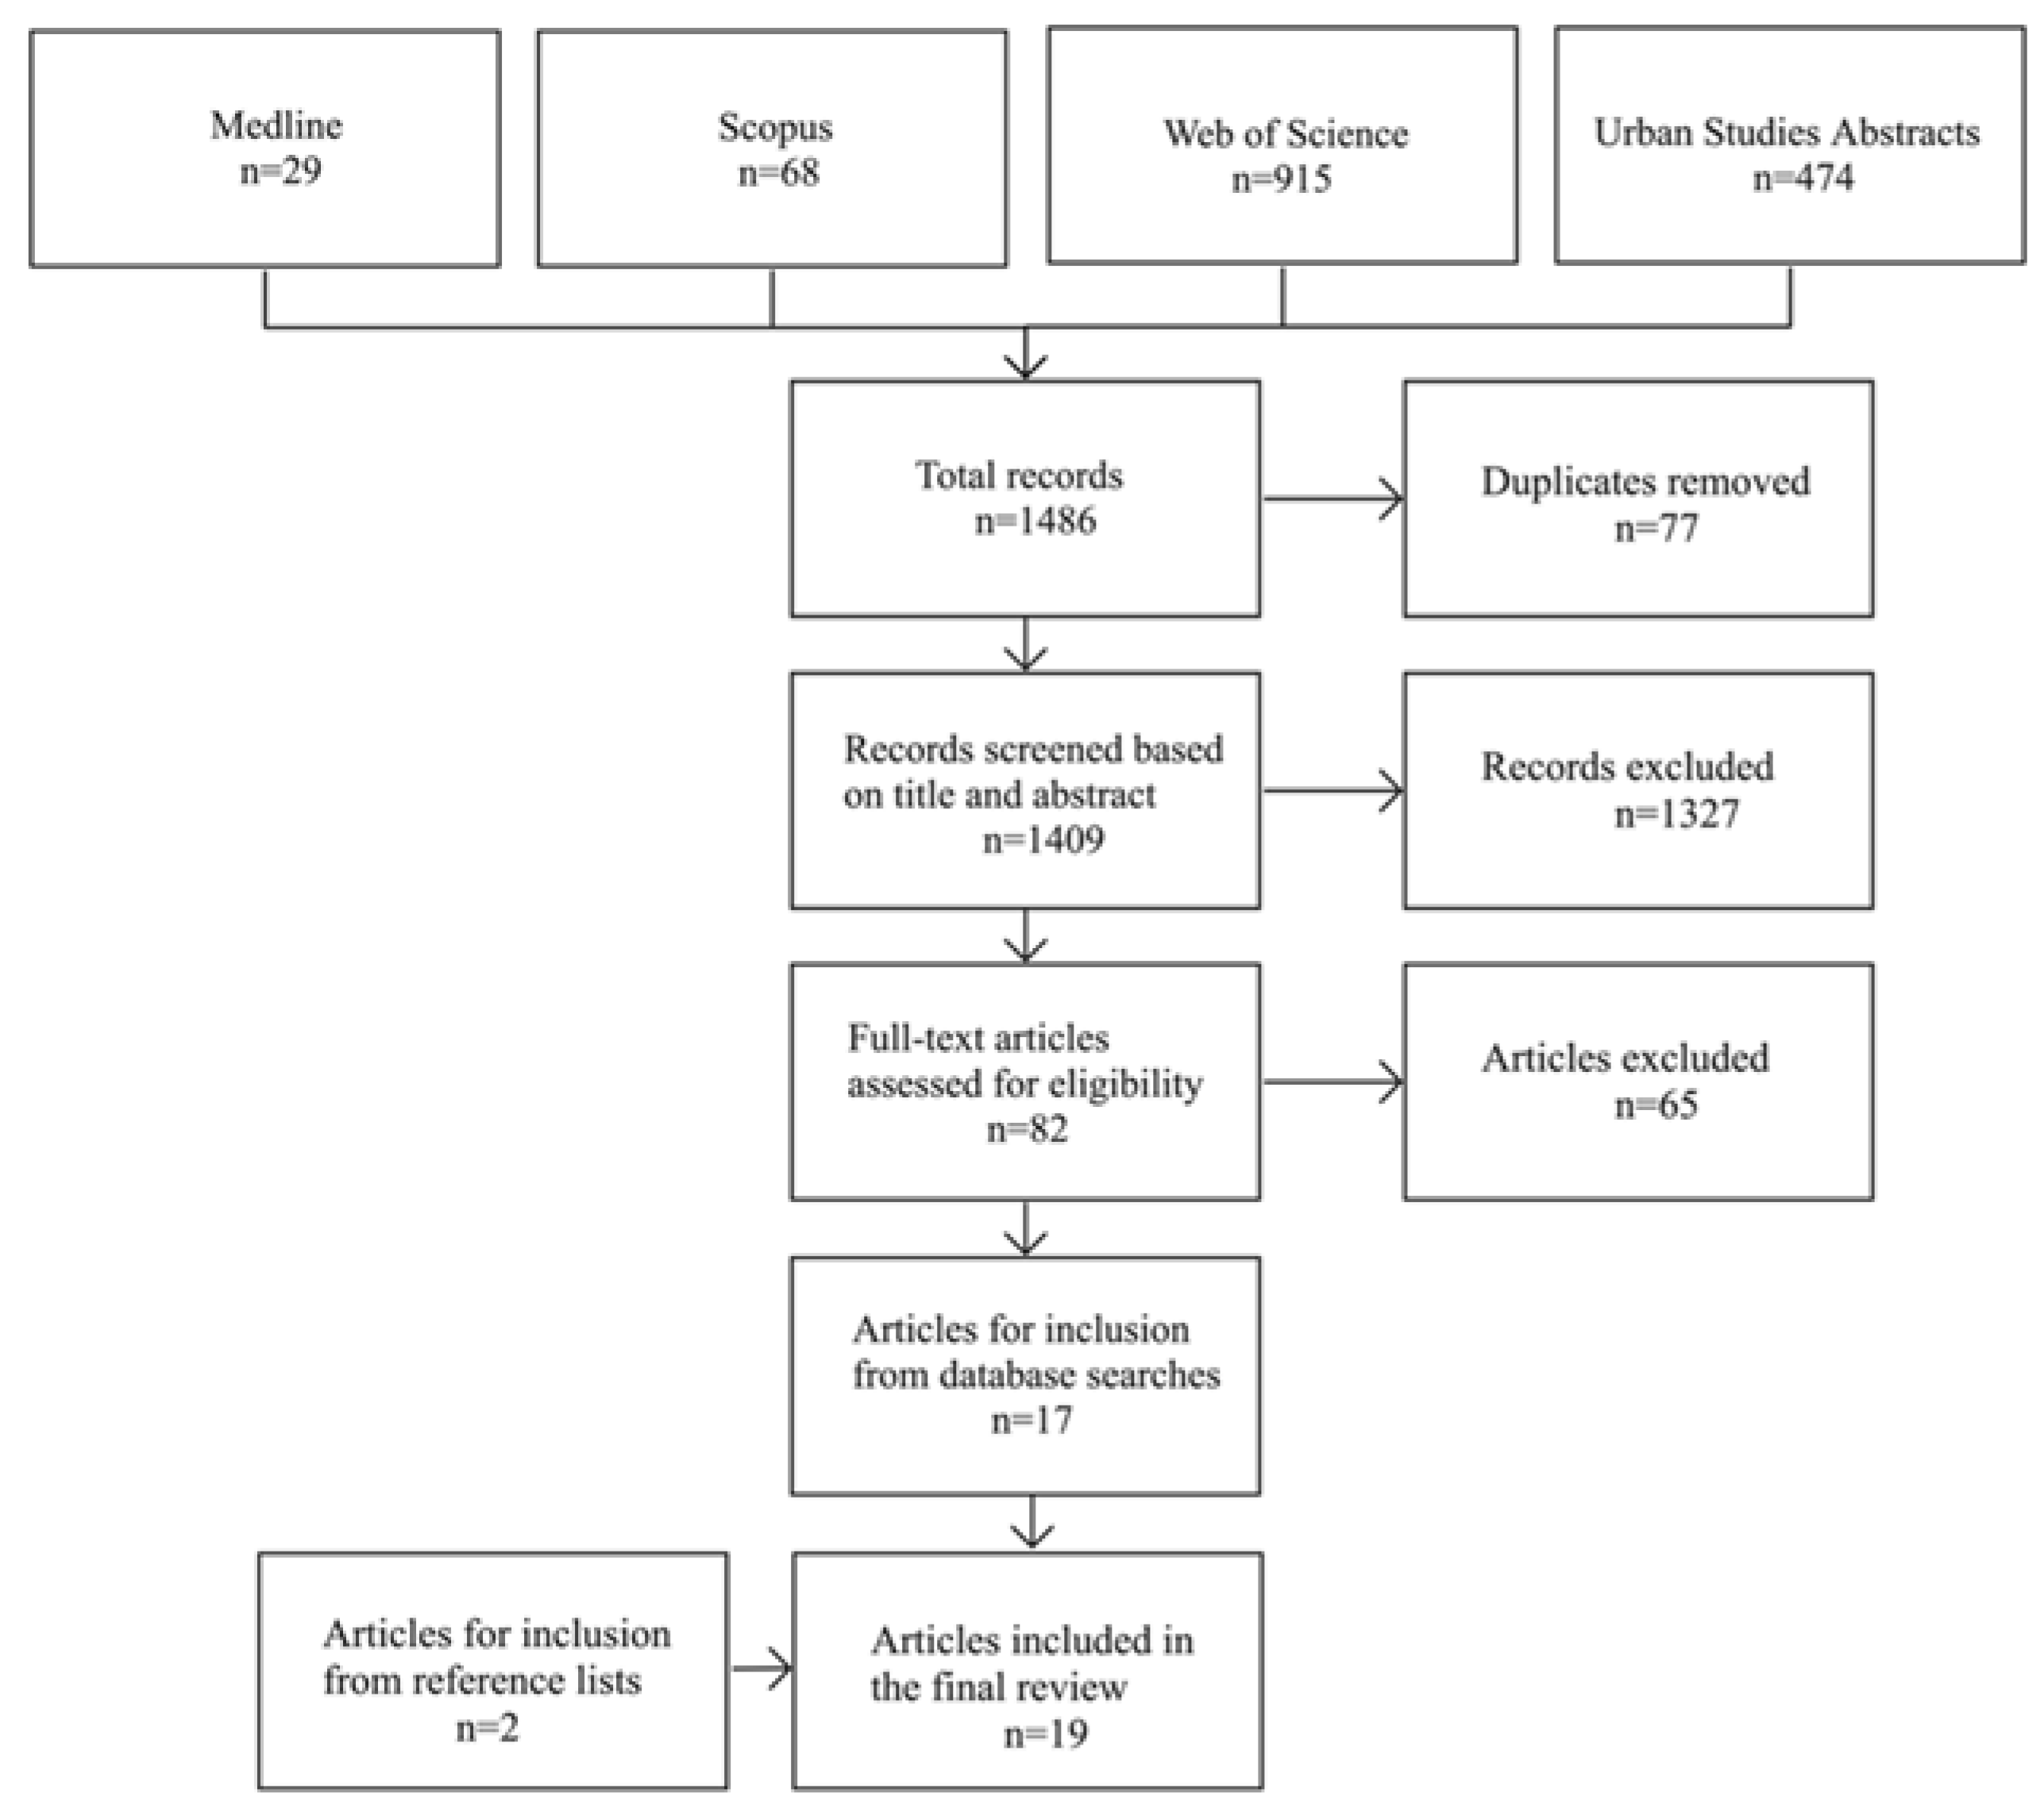
3.1. Selection of Studies
3.2. Characteristics of Studies
3.3. Appraisal of Studies
3.4. Synthesis of Studies
4. Discussion
4.1. Key Findings
4.2. Methodological Considerations
4.3. Future Research Directions
5. Conclusions
Author Contributions
Funding
Institutional Review Board Statement
Informed Consent Statement
Data Availability Statement
Conflicts of Interest
Appendix A

| #1 | Population | elderly or seniors or “older adults” or “older people” or “older persons” or “older citizens” or “older residents” or “older age” or “late life” or “later life” or ag*ing |
| #2 | Concept | “urban accessibility” or “community accessibility” or “transport accessibility” or “transit accessibility” or “urban connectivity” or “transport connectivity” or “transit connectivity” or walkability or “urban mobility” or “community mobility” or “life space mobility” or “life-space mobility” or “transport mobility” or “transit mobility” or (transport OR transportation OR transit OR mobility) W/5 (inclusion OR exclusion OR equity OR inequity OR equitable OR inequitable OR justice OR injustice OR disparity OR polari?ation OR disadvantage) or “equitable use” or “universal design” or age-friend* or “age friendly” or “age friendliness” |
| #3 | Exclusions | “air transport” or “air transportation” or “air travel” or “residential mobility” |
| #1 (AB, KW) AND #2 (AB, KW) NOT #3 (AB, KW) Limit to: articles; English; USA, Canada, and Australia; 2009 | ||
Appendix B
| Broome et al., 2013 [54] [Study ID: 1; Paper ID: 1a] | ||||
| Quantitative Non-Randomized | Yes | No | Can’t Tell | Comments |
| 3.1. Are the participants representative of the target population? | X | While older non-bus users are specified to be within the target population, it is not clear how they were sampled. Study 1 utilised on board surveys, which is limited to bus users. Study 2 might have sampled non-bus users as the cohort came from another study, however, this was not specified. There was no information on attempts to achieve a sample of participants that represents the target population. | ||
| 3.2. Are measurements appropriate regarding both the outcome and exposure/intervention? | X | |||
| 3.3. Are there complete outcome data? | X | |||
| 3.4. Are the confounders accounted for in the design and analysis? | X | In Study 2, participants were asked to rate whether they were using the buses more, the same, or less frequently compared with 3 years ago. Changes in this measure could be a result of other factors, not necessarily attributable to the intervention, such as changes in the need for bus services. However, these other factors were not asked about in the data collection, and therefore could not be accounted for in the analysis. The explanation of what was modelled is also unclear. A regression model was employed to address outcomes 1 and 3 about satisfaction and frequency of use, yet the authors explained the outcome to be location and time period whereas satisfaction and frequency of use were the explanatory variables. | ||
| 3.5. During the study period, is the intervention/exposure administered as intended? | X | |||
| Broome et al., 2012 [55] [Study ID: 1; Paper ID: 1b] | ||||
| Quantitative Non-Randomized | Yes | No | Can’t Tell | Comments |
| 3.1. Are the participants representative of the target population? | X | |||
| 3.2. Are measurements appropriate regarding both the outcome and exposure/intervention? | X | One aspect is unclear, which is the ticket sales data. Ticket sales data seem to be for all routes rather than only the route that received the intervention. | ||
| 3.3. Are there complete outcome data? | X | Presumably all data from ticket sales are complete. There was no information provided on the response rate or completion rate for the satisfaction surveys. | ||
| 3.4. Are the confounders accounted for in the design and analysis? | X | |||
| 3.5. During the study period, is the intervention/exposure administered as intended? | X | |||
| Broome et al., 2010 [56] [Study ID: 1; Paper ID: 1c] | ||||
| Qualitative | Yes | No | Can’t Tell | Comments |
| 1.1. Is the qualitative approach appropriate to answer the research question? | X | |||
| 1.2. Are the qualitative data collection methods adequate to address the research question? | X | |||
| 1.3. Are the findings adequately derived from the data? | X | |||
| 1.4. Is the interpretation of results sufficiently substantiated by data? | X | |||
| 1.5. Is there coherence between qualitative data sources, collection, analysis and interpretation? | X | |||
| Broome et al., 2010 [57] [Study ID: 1; Paper ID: 1d] | ||||
| Qualitative | Yes | No | Can’t Tell | Comments |
| 1.1. Is the qualitative approach appropriate to answer the research question? | X | |||
| 1.2. Are the qualitative data collection methods adequate to address the research question? | X | |||
| 1.3. Are the findings adequately derived from the data? | X | |||
| 1.4. Is the interpretation of results sufficiently substantiated by data? | X | |||
| 1.5. Is there coherence between qualitative data sources, collection, analysis and interpretation? | X | |||
| Quantitative Descriptive | Yes | No | Can’t Tell | Comments |
| 4.1. Is the sampling strategy relevant to address the research question? | X | |||
| 4.2. Is the sample representative of the target population? | X | |||
| 4.3. Are the measurements appropriate? | X | |||
| 4.4. Is the risk of nonresponse bias low? | X | |||
| 4.5. Is the statistical analysis appropriate to answer the research question? | X | |||
| Mixed Methods | Yes | No | Can’t Tell | Comments |
| 5.1. Is there an adequate rationale for using a mixed methods design to address the research question? | X | |||
| 5.2. Are the different components of the study effectively integrated to answer the research question? | X | |||
| 5.3. Are the results adequately brought together into overall interpretations? | X | |||
| 5.4. Are divergences and inconsistencies between quantitative and qualitative results adequately addressed? | X | |||
| 5.5. Do the different components of the study adhere to the quality criteria of each tradition of the methods involved? | X | |||
| Nathan et al., 2012 [58] [Study ID: 2; Paper ID: 2] | ||||
| Quantitative Non-Randomized | Yes | No | Can’t Tell | Comments |
| 3.1. Are the participants representative of the target population? | X | |||
| 3.2. Are measurements appropriate regarding both the outcome and exposure/intervention? | X | |||
| 3.3. Are there complete outcome data? | X | Missing data were reported. | ||
| 3.4. Are the confounders accounted for in the design and analysis? | X | Demographic variables were accounted for, but not contextual factors (e.g., community safety, access to other modes of transport; habit of frequenting targeted destinations in other neighbourhoods). | ||
| 3.5. During the study period, is the intervention/exposure administered as intended? | X | Ideally, the data on household address and neighbourhood destinations are accurate as of the date of data collection for self-reported walking. However, this was not clear. | ||
| Zeitler et al., 2015 [59] [Study ID: 3; Paper ID: 3a] | ||||
| Qualitative | Yes | No | Can’t Tell | Comments |
| 1.1. Is the qualitative approach appropriate to answer the research question? | X | |||
| 1.2. Are the qualitative data collection methods adequate to address the research question? | X | |||
| 1.3. Are the findings adequately derived from the data? | X | |||
| 1.4. Is the interpretation of results sufficiently substantiated by data? | X | |||
| 1.5. Is there coherence between qualitative data sources, collection, analysis and interpretation? | X | |||
| Zeitler et al., 2012 [60] [Study ID: 3; Paper ID: 3b] | ||||
| Qualitative | Yes | No | Can’t Tell | Comments |
| 1.1. Is the qualitative approach appropriate to answer the research question? | X | |||
| 1.2. Are the qualitative data collection methods adequate to address the research question? | X | |||
| 1.3. Are the findings adequately derived from the data? | X | |||
| 1.4. Is the interpretation of results sufficiently substantiated by data? | X | |||
| 1.5. Is there coherence between qualitative data sources, collection, analysis and interpretation? | X | The comparative aspect is unclear. | ||
| Vine et al., 2012 [61] [Study ID: 3; Paper ID: 3c] | ||||
| Qualitative | Yes | No | Can’t Tell | Comments |
| 1.1. Is the qualitative approach appropriate to answer the research question? | X | |||
| 1.2. Are the qualitative data collection methods adequate to address the research question? | X | |||
| 1.3. Are the findings adequately derived from the data? | X | |||
| 1.4. Is the interpretation of results sufficiently substantiated by data? | X | |||
| 1.5. Is there coherence between qualitative data sources, collection, analysis and interpretation? | X | |||
| Vine et al., 2012 [62] [Study ID: 3; Paper ID: 3d] | ||||
| Qualitative | Yes | No | Can’t Tell | Comments |
| 1.1. Is the qualitative approach appropriate to answer the research question? | X | |||
| 1.2. Are the qualitative data collection methods adequate to address the research question? | X | |||
| 1.3. Are the findings adequately derived from the data? | X | |||
| 1.4. Is the interpretation of results sufficiently substantiated by data? | X | |||
| 1.5. Is there coherence between qualitative data sources, collection, analysis and interpretation? | X | |||
| Gardner 2014 [63] [Study ID: 4; Paper ID: 4] | ||||
| Qualitative | Yes | No | Can’t Tell | Comments |
| 1.1. Is the qualitative approach appropriate to answer the research question? | X | |||
| 1.2. Are the qualitative data collection methods adequate to address the research question? | X | |||
| 1.3. Are the findings adequately derived from the data? | X | |||
| 1.4. Is the interpretation of results sufficiently substantiated by data? | X | |||
| 1.5. Is there coherence between qualitative data sources, collection, analysis and interpretation? | X | |||
| Grant et al., 2010 [64] [Study ID: 5; Paper ID: 5a | ||||
| Qualitative | Yes | No | Can’t Tell | Comments |
| 1.1. Is the qualitative approach appropriate to answer the research question? | X | |||
| 1.2. Are the qualitative data collection methods adequate to address the research question? | X | |||
| 1.3. Are the findings adequately derived from the data? | X | |||
| 1.4. Is the interpretation of results sufficiently substantiated by data? | X | |||
| 1.5. Is there coherence between qualitative data sources, collection, analysis and interpretation? | X | |||
| Grant et al., 2010 [65] [Study ID: 5; Paper ID: 5b] | ||||
| Qualitative | Yes | No | Can’t Tell | Comments |
| 1.1. Is the qualitative approach appropriate to answer the research question? | X | |||
| 1.2. Are the qualitative data collection methods adequate to address the research question? | X | |||
| 1.3. Are the findings adequately derived from the data? | X | |||
| 1.4. Is the interpretation of results sufficiently substantiated by data? | X | |||
| 1.5. Is there coherence between qualitative data sources, collection, analysis and interpretation? | X | The authors stated that quantitative indicators of the neighbourhood were collected, which implied that they would be analysed. However, it seems that these data were used for context only—to populate descriptive tables. Sample characteristics were also included in descriptive tables yet these were not mentioned in their data collection. In other words, there was inconsistent reporting of methods since the data collected for descriptive tables in one instance were mentioned and not the other. | ||
| Leger et al., 2019 [66] [Study ID: 6; Paper ID: 6 | ||||
| Qualitative | Yes | No | Can’t Tell | Comments |
| 1.1. Is the qualitative approach appropriate to answer the research question? | X | |||
| 1.2. Are the qualitative data collection methods adequate to address the research question? | X | |||
| 1.3. Are the findings adequately derived from the data? | X | |||
| 1.4. Is the interpretation of results sufficiently substantiated by data? | X | |||
| 1.5. Is there coherence between qualitative data sources, collection, analysis and interpretation? | X | |||
| Mah et al., 2017 [67] [Study ID: 7; Paper ID: 7] | ||||
| Qualitative | Yes | No | Can’t Tell | Comments |
| 1.1. Is the qualitative approach appropriate to answer the research question? | X | |||
| 1.2. Are the qualitative data collection methods adequate to address the research question? | X | |||
| 1.3. Are the findings adequately derived from the data? | X | |||
| 1.4. Is the interpretation of results sufficiently substantiated by data? | X | |||
| 1.5. Is there coherence between qualitative data sources, collection, analysis and interpretation? | X | |||
| Quantitative Non-Randomized | Yes | No | Can’t Tell | Comments |
| 3.1. Are the participants representative of the target population? | X | There was no information about the target population nor the selection criteria. While the recruitment methods were described, the authors did not explain what they are recruiting for. | ||
| 3.2. Are measurements appropriate regarding both the outcome and exposure/intervention? | X | The choice of the measure “You would be impacted if this FTS program was no longer available to you” is not well described. It is unclear what the authors meant by “impact”, which could have been operationalized. It is unclear whether this tool is a standard one or whether it has been validated. | ||
| 3.3. Are there complete outcome data? | X | |||
| 3.4. Are the confounders accounted for in the design and analysis? | X | |||
| 3.5. During the study period, is the intervention/exposure administered as intended? | X | |||
| Mixed Methods | Yes | No | Can’t Tell | Comments |
| 5.1. Is there an adequate rationale for using a mixed methods design to address the research question? | X | The authors have not articulated a rationale. | ||
| 5.2. Are the different components of the study effectively integrated to answer the research question? | X | The two components addressed different aspects of the research question and each had a different sample. | ||
| 5.3. Are the results adequately brought together into overall interpretations? | X | The two components addressed different aspects of the research question and each had a different sample | ||
| 5.4. Are divergences and inconsistencies between quantitative and qualitative results adequately addressed? | X | The two components do not overlap. | ||
| 5.5. Do the different components of the study adhere to the quality criteria of each tradition of the methods involved? | X | See quality appraisal for each component. | ||
| Mitra et al., 2015 [68] [Study ID: 8; Paper ID: 8] | ||||
| Qualitative | Yes | No | Can’t Tell | Comments |
| 1.1. Is the qualitative approach appropriate to answer the research question? | X | |||
| 1.2. Are the qualitative data collection methods adequate to address the research question? | X | |||
| 1.3. Are the findings adequately derived from the data? | X | |||
| 1.4. Is the interpretation of results sufficiently substantiated by data? | X | |||
| 1.5. Is there coherence between qualitative data sources, collection, analysis and interpretation? | X | It is unclear what hand-drawn walking routes and GIS mapping added as the analysis and reporting did not mention these sources. It’s possible that discussion of maps were included in the interviews and therefore transcribed and analysed but this was not clear. | ||
| Ottoni et al., 2017 [69] [Study ID: 9; Paper ID: 9a] | ||||
| Qualitative | Yes | No | Can’t Tell | Comments |
| 1.1. Is the qualitative approach appropriate to answer the research question? | X | |||
| 1.2. Are the qualitative data collection methods adequate to address the research question? | X | |||
| 1.3. Are the findings adequately derived from the data? | X | |||
| 1.4. Is the interpretation of results sufficiently substantiated by data? | X | |||
| 1.5. Is there coherence between qualitative data sources, collection, analysis and interpretation? | X | |||
| Winters et al., 2015 [70] [Study ID: 9; Paper ID: 9b] | ||||
| Qualitative | Yes | No | Can’t Tell | Comments |
| 1.1. Is the qualitative approach appropriate to answer the research question? | X | |||
| 1.2. Are the qualitative data collection methods adequate to address the research question? | X | |||
| 1.3. Are the findings adequately derived from the data? | X | |||
| 1.4. Is the interpretation of results sufficiently substantiated by data? | X | |||
| 1.5. Is there coherence between qualitative data sources, collection, analysis and interpretation? | X | |||
| Quantitative Descriptive | Yes | No | Can’t Tell | Comments |
| 4.1. Is the sampling strategy relevant to address the research question? | X | The researchers mailed letters to 3402 households with at least one adult aged 60 and over and which was located within ~2 blocks of the planned greenway, but it is not clear how these 3402 households were selected. Recruitment did not identify whether the respondents were cyclist or not. Since cycling behaviour was not asked until the questionnaire, the researchers would not have been in a position to determine if respondents matched the target population and could have ended up in a scenario where all respondents were non-cyclists. | ||
| 4.2. Is the sample representative of the target population? | X | The target population is described as older adults who live in Vancouver, Canada yet recruitment was targeted at those living in a geographically restricted downtown area next to a planned greenway. Sample descriptive statistics were not compared to that of older adults in Vancouver. | ||
| 4.3. Are the measurements appropriate? | X | |||
| 4.4. Is the risk of nonresponse bias low? | X | Responders and non-responders may differ on cycling behaviours. The information provided in the recruitment letter may have led to selection bias; however, this information was not available. | ||
| 4.5. Is the statistical analysis appropriate to answer the research question? | X | It is unclear why multivariate analysis was not conducted. There was no information provided as to the type of statistical test conducted. | ||
| Mixed Methods | Yes | No | Can’t Tell | Comments |
| 5.1. Is there an adequate rationale for using a mixed methods design to address the research question? | X | The authors have not articulated a rationale. | ||
| 5.2. Are the different components of the study effectively integrated to answer the research question? | X | The two components addressed different aspects of the research question and each had a different sample. | ||
| 5.3. Are the results adequately brought together into overall interpretations? | X | The two components addressed different aspects of the research question and each had a different sample | ||
| 5.4. Are divergences and inconsistencies between quantitative and qualitative results adequately addressed? | X | The two components do not overlap. | ||
| 5.5. Do the different components of the study adhere to the quality criteria of each tradition of the methods involved? | X | See quality appraisal for each component. | ||
| Adorno et al., 2018 [71] [Study ID: 10; Paper ID: 10] | ||||
| Qualitative | Yes | No | Can’t Tell | Comments |
| 1.1. Is the qualitative approach appropriate to answer the research question? | X | |||
| 1.2. Are the qualitative data collection methods adequate to address the research question? | X | |||
| 1.3. Are the findings adequately derived from the data? | X | |||
| 1.4. Is the interpretation of results sufficiently substantiated by data? | X | |||
| 1.5. Is there coherence between qualitative data sources, collection, analysis and interpretation? | X | |||
| Gallagher et al., 2010 [72] [Study ID: 11; Paper ID: 11] | ||||
| Qualitative | Yes | No | Can’t Tell | Comments |
| 1.1. Is the qualitative approach appropriate to answer the research question? | X | |||
| 1.2. Are the qualitative data collection methods adequate to address the research question? | X | |||
| 1.3. Are the findings adequately derived from the data? | X | |||
| 1.4. Is the interpretation of results sufficiently substantiated by data? | X | |||
| 1.5. Is there coherence between qualitative data sources, collection, analysis and interpretation? | X | |||
Appendix C


References
- Mindell, J.S.; Karlsen, S. Community Severance and Health: What Do We Actually Know? J. Hered. 2012, 89, 232–246. [Google Scholar] [CrossRef] [PubMed]
- Boniface, S.; Scantlebury, R.; Watkins, S.; Mindell, J. Health implications of transport: Evidence of effects of transport on social interactions. J. Transp. Health 2015, 2, 441–446. [Google Scholar] [CrossRef]
- Khreis, H.; Warsow, K.M.; Verlinghieri, E.; Guzman, A.; Pellecuer, L.; Ferreira, A.; Jones, I.; Heinen, E.; Rojas-Rueda, D.; Mueller, N.; et al. The health impacts of traffic-related exposures in urban areas: Understanding real effects, underlying driving forces and co-producing future directions. J. Transp. Health 2016, 3, 249–267. [Google Scholar] [CrossRef]
- United Nations. World Population Prospects: The 2017 Revision; Working Paper No. ESA/P/WP/248; United Nations: New York, NY, USA, 2017. [Google Scholar]
- Musselwhite, C.; Holland, C.; Walker, I. The role of transport and mobility in the health of older people. J. Transp. Health 2015, 2, 1–4. [Google Scholar] [CrossRef]
- Prohaska, T.R.; Anderson, L.A.; Hooker, S.P.; Hughes, S.L.; Belza, B. Mobility and Aging: Transference to Transportation. J. Aging Res. 2011, 2011, 1–3. [Google Scholar] [CrossRef]
- Schwanen, T.; Páez, A. The mobility of older people–an introduction. J. Transp. Geogr. 2010, 18, 591–595. [Google Scholar] [CrossRef]
- World Health Organization. Global Age-Friendly Cities: A Guide, 2007. Available online: http://www.who.int/ageing/publications/age_friendly_cities_guide/en/ (accessed on 14 February 2019).
- Götschi, T.; Tainio, M.; Maizlish, N.; Schwanen, T.; Goodman, A.; Woodcock, J. Contrasts in active transport behaviour across four countries: How do they translate into public health benefits? Prev. Med. 2015, 74, 42–48. [Google Scholar] [CrossRef]
- Rojas-Rueda, D.; de Nazelle, A.; Andersen, Z.J.; Braun-Fahrländer, C.; Bruha, J.; Bruhova-Foltynova, H.; Desqueyroux, H.; Praznoczy, C.; Ragettli, M.S.; Tainio, M.; et al. Health Impacts of Active Transportation in Europe. PLoS ONE 2016, 11, e0149990. [Google Scholar] [CrossRef]
- Shaw, C.; Randal, E.; Keall, M.; Woodward, A. Health consequences of transport patterns in New Zealand’s largest cities. N. Z. Med. J. 2018, 131, 64–72. [Google Scholar]
- Jang, K.M.; Kim, J.; Lee, H.-Y.; Cho, H.; Kim, Y. Urban Green Accessibility Index: A Measure of Pedestrian-Centered Accessibility to Every Green Point in an Urban Area. ISPRS Int. J. Geo-Inf. 2020, 9, 586. [Google Scholar] [CrossRef]
- Liu, D.; Kwan, M.; Kan, Z. Analyzing disparities in transit-based healthcare accessibility in the Chicago Metropolitan Area. Can. Geogr./Le Géographe Can. 2021, 66, 248–262. [Google Scholar] [CrossRef]
- Hosford, K.; Beairsto, J.; Winters, M. Is the 15-minute city within reach? Evaluating walking and cycling accessibility to grocery stores in Vancouver. Transp. Res. Interdiscip. Perspect. 2022, 14, 100602. [Google Scholar] [CrossRef]
- Ryan, J.; Wretstrand, A. What’s mode got to do with it? Exploring the links between public transport and car access and opportunities for everyday activities among older people. Travel Behav. Soc. 2018, 14, 107–118. [Google Scholar] [CrossRef]
- Davey, J.A. Older people and transport: Coping without a car. Ageing Soc. 2006, 27, 49–65. [Google Scholar] [CrossRef]
- UNDP. Sustainable Development Goals. Available online: https://www.undp.org/content/undp/en/home/sustainable-development-goals.html (accessed on 2 December 2019).
- The New Urban Agenda, Habitat III. Available online: http://habitat3.org/the-new-urban-agenda/ (accessed on 17 March 2020).
- Hjorthol, R.J.; Levin, L.; Sirén, A. Mobility in different generations of older persons: The development of daily travel in different cohorts in Denmark, Norway and Sweden. J. Transp. Geogr. 2010, 18, 624–633. [Google Scholar] [CrossRef]
- Newbold, B.; Scott, D.; Spinney, J.E.; Kanaroglou, P.; Paez, A. Travel behavior within Canada’s older population: A cohort analysis. J. Transp. Geogr. 2005, 13, 340–351. [Google Scholar] [CrossRef]
- O׳hern, S.; Oxley, J. Understanding travel patterns to support safe active transport for older adults. J. Transp. Health 2015, 2, 79–85. [Google Scholar] [CrossRef]
- Kim, S.; Ulfarsson, G.F. Travel Mode Choice of the Elderly: Effects of Personal, Household, Neighborhood, and Trip Characteristics. Transp. Res. Rec. J. Transp. Res. Board 2004, 1894, 117–126. [Google Scholar] [CrossRef]
- Sandra, R. Meeting Transportaton Needs in an Aging-Friendly Community. Gener. J. Am. Soc. Aging 2009, 33, 33–43. [Google Scholar]
- Coughlin, J.F. Longevity, Lifestyle, and Anticipating the New Demands of Aging on the Transportation System. Public Work. Manag. Policy 2009, 13, 301–311. [Google Scholar] [CrossRef]
- Hwang, E. Impacts of objective neighborhood built environment on older adults’ walking: Literature review. Hous. Soc. 2017, 44, 141–155. [Google Scholar] [CrossRef]
- Rosso, A.L.; Auchincloss, A.H.; Michael, Y.L. The Urban Built Environment and Mobility in Older Adults: A Comprehensive Review. J. Aging Res. 2011, 2011, 1–10. [Google Scholar] [CrossRef]
- Cerin, E.; Nathan, A.; van Cauwenberg, J.; Barnett, D.W.; Barnett, A.; Council on Environment and Physical Activity (CEPA)–Older Adults working group. The neighbourhood physical environment and active travel in older adults: A systematic review and meta-analysis. Int. J. Behav. Nutr. Phys. Act. 2017, 14, 15. [Google Scholar] [CrossRef]
- Levasseur, M.; Généreux, M.; Bruneau, J.-F.; Vanasse, A.; Chabot, É.; Beaulac, C.; Bédard, M.-M. Importance of proximity to resources, social support, transportation and neighborhood security for mobility and social participation in older adults: Results from a scoping study. BMC Public Health 2015, 15, 503. [Google Scholar] [CrossRef] [PubMed]
- Yen, I.H.; Flood, J.F.; Thompson, H.; Anderson, L.A.; Wong, G. How Design of Places Promotes or Inhibits Mobility of Older Adults. J. Aging Health 2014, 26, 1340–1372. [Google Scholar] [CrossRef]
- Zhu, X.; Wang, F.; Chen, C.; Reed, D.D. Personalized incentives for promoting sustainable travel behaviors. Transp. Res. Part C Emerg. Technol. 2019, 113, 314–331. [Google Scholar] [CrossRef]
- Ortúzar, J.D.D. Future transportation: Sustainability, complexity and individualization of choices. Commun. Transp. Res. 2021, 1, 100010. [Google Scholar] [CrossRef]
- Cagney, K.A.; Cornwell, E.Y. Neighborhoods and Health in Later Life: The Intersection of Biology and Community. Annu. Rev. Gerontol. Geriatr. 2010, 30, 323–348. [Google Scholar] [CrossRef]
- Kawachi, I.; Berkman, L.F. Neighborhoods, Aging, and Functional Limitations. In Neighborhoods and Health; Oxford University Press: Oxford, UK, 2003; Available online: http://www.oxfordscholarship.com/view/10.1093/acprof:oso/9780195138382.001.0001/acprof-9780195138382-chapter-14 (accessed on 25 March 2019).
- Church, A.; Frost, M.; Sullivan, K. Transport and social exclusion in London. Transp. Policy 2000, 7, 195–205. [Google Scholar] [CrossRef]
- OECD. Rethinking Urban Sprawl: Moving Towards Sustainable Cities; OECD: Paris, France, 2018. [Google Scholar]
- United Nations. Reviewed Work: World Urbanization Prospects: The 1996 Revision by United Nations, Department of Economic and Social Affairs. Available online: https://population.un.org/wup/Publications/Files/WUP2018-Report.pdf (accessed on 20 April 2021).
- Andrews, G.J.; Hall, E.; Evans, B.; Colls, R. Moving beyond walkability: On the potential of health geography. Soc. Sci. Med. 2012, 75, 1925–1932. [Google Scholar] [CrossRef] [PubMed]
- Battista, G.A.; Manaugh, K. Stores and mores: Toward socializing walkability. J. Transp. Geogr. 2018, 67, 53–60. [Google Scholar] [CrossRef]
- Shashank, A.; Schuurman, N. Unpacking walkability indices and their inherent assumptions. Health Place 2018, 55, 145–154. [Google Scholar] [CrossRef]
- Rachele, J.N.; Sugiyama, T.; Davies, S.; Loh, V.H.; Turrell, G.; Carver, A.; Cerin, E. Neighbourhood built environment and physical function among mid-to-older aged adults: A systematic review. Health Place 2019, 58, 102137. [Google Scholar] [CrossRef]
- Yen, I.H.; Michael, Y.L.; Perdue, L. Neighborhood Environment in Studies of Health of Older Adults: A Systematic Review. Am. J. Prev. Med. 2009, 37, 455–463. [Google Scholar] [CrossRef]
- Hong, Q.N.; Pluye, P.; Fàbregues, S.; Bartlett, G.; Boardman, F.; Cargo, M.; Dagenais, P.; Gagnon, M.-P.; Griffiths, F.; Nicolau, B.; et al. Mixed Methods Appraisal Tool (MMAT), version 2018, Registration fo Copyright (#1148552); Canadian Intellectual Property Office, Industry Canada: Gatineau, QC, Canada, 2018. [Google Scholar]
- Pace, R.; Pluye, P.; Bartlett, G.; Macaulay, A.C.; Salsberg, J.; Jagosh, J.; Seller, R. Testing the reliability and efficiency of the pilot Mixed Methods Appraisal Tool (MMAT) for systematic mixed studies review. Int. J. Nurs. Stud. 2011, 49, 47–53. [Google Scholar] [CrossRef]
- Souto, R.Q.; Khanassov, V.; Hong, Q.N.; Bush, P.L.; Vedel, I.; Pluye, P. Systematic mixed studies reviews: Updating results on the reliability and efficiency of the mixed methods appraisal tool. Int. J. Nurs. Stud. 2015, 52, 500–501. [Google Scholar] [CrossRef]
- Hong, Q.N.; Gonzalez-Reyes, A.; Pluye, P. Improving the usefulness of a tool for appraising the quality of qualitative, quantitative and mixed methods studies, the Mixed Methods Appraisal Tool (MMAT). J. Eval. Clin. Pract. 2018, 24, 459–467. [Google Scholar] [CrossRef]
- Hong, Q.N.; Pluye, P.; Fàbregues, S.; Bartlett, G.; Boardman, F.; Cargo, M.; Dagenais, P.; Gagnon, M.-P.; Griffiths, F.; Nicolau, B.; et al. Improving the content validity of the mixed methods appraisal tool: A modified e-Delphi study. J. Clin. Epidemiol. 2019, 111, 49–59. [Google Scholar] [CrossRef]
- Hannes, K. Chapter 4: Critical appraisal of qualitative research, In Supplementary Guidance for Inclusion of Qualitative Research in Cochrane Systematic Reviews of Interventions, Version 1 (updated August 2011); Cochrane Collaboration Qualitative Methods Group: 2011. Available online: http://cqrmg.cochrane.org/supplemental-handbook-guidance (accessed on 20 November 2019).
- O’Neill, J.; Tabish, H.; Welch, V.; Petticrew, M.; Pottie, K.; Clarke, M.; Evans, T.; Pardo, J.P.; Waters, E.; White, H.; et al. Applying an equity lens to interventions: Using PROGRESS ensures consideration of socially stratifying factors to illuminate inequities in health. J. Clin. Epidemiol. 2013, 67, 56–64. [Google Scholar] [CrossRef]
- Hsieh, H.-F.; Shannon, S.E. Three Approaches to Qualitative Content Analysis. Qual. Health Res. 2005, 15, 1277–1288. [Google Scholar] [CrossRef]
- Petticrew, M.; Rehfuess, E.; Noyes, J.; Higgins, J.; Mayhew, A.; Pantoja, T.; Shemilt, I.; Sowden, A. Synthesizing evidence on complex interventions: How meta-analytical, qualitative, and mixed-method approaches can contribute. J. Clin. Epidemiol. 2013, 66, 1230–1243. [Google Scholar] [CrossRef] [PubMed]
- Carroll, C.; Booth, A.; Cooper, K. A worked example of "best fit" framework synthesis: A systematic review of views concerning the taking of some potential chemopreventive agents. BMC Med. Res. Methodol. 2011, 11, 29. [Google Scholar] [CrossRef] [PubMed]
- Barnett-Page, E.; Thomas, J. Methods for the synthesis of qualitative research: A critical review. BMC Med. Res. Methodol. 2009, 9, 59. [Google Scholar] [CrossRef]
- Carroll, C.; Booth, A.; Leaviss, J.; Rick, J. “Best fit” framework synthesis: Refining the method. BMC Med. Res. Methodol. 2013, 13, 37. [Google Scholar] [CrossRef] [PubMed]
- Broome, K.; Worrall, L.; Fleming, J.; Boldy, D. Evaluation of age-friendly guidelines for public buses. Transp. Res. Part A Policy Pract. 2013, 53, 68–80. [Google Scholar] [CrossRef]
- Broome, K.; Worrall, L.; Fleming, J.; Boldy, D. Evaluation of flexible route bus transport for older people. Transp. Policy 2012, 21, 85–91. [Google Scholar] [CrossRef]
- Broome, K.; Nalder, E.; Worrall, L.; Boldy, D. Age-friendly buses? A comparison of reported barriers and facilitators to bus use for younger and older adults. Australas. J. Ageing 2010, 29, 33–38. [Google Scholar] [CrossRef]
- Broome, K.; Worrall, L.; McKenna, K.; Boldy, D. Priorities for an Age-Friendly Bus System. Can. J. Aging/La Rev. Can. du Vieil. 2010, 29, 435–444. [Google Scholar] [CrossRef]
- Nathan, A.; Pereira, G.; Foster, S.; Hooper, P.; Saarloos, D.; Giles-Corti, B. Access to commercial destinations within the neighbourhood and walking among Australian older adults. Int. J. Behav. Nutr. Phys. Act. 2012, 9, 133. [Google Scholar] [CrossRef]
- Zeitler, E.; Buys, L. Mobility and out-of-home activities of older people living in suburban environments: ‘Because I’m a driver, I don’t have a problem’. Ageing Soc. 2014, 35, 785–808. [Google Scholar] [CrossRef]
- Zeitler, E.; Buys, L.; Aird, R.; Miller, E. Mobility and Active Ageing in Suburban Environments: Findings from In-Depth Interviews and Person-Based GPS Tracking. Curr. Gerontol. Geriatr. Res. 2012, 2012, 1–10. [Google Scholar] [CrossRef] [PubMed]
- Vine, D.; Buys, L.; Aird, R. The use of amenities in high density neighbourhoods by older urban Australian residents. Landsc. Urban Plan. 2012, 107, 159–171. [Google Scholar] [CrossRef]
- Vine, D.; Buys, L.; Aird, R. Experiences of Neighbourhood Walkability Among Older Australians Living in High Density Inner-City Areas. Plan. Theory Pract. 2012, 13, 421–444. [Google Scholar] [CrossRef]
- Gardner, P. The role of social engagement and identity in community mobility among older adults aging in place. Disabil. Rehabilitation 2013, 36, 1249–1257. [Google Scholar] [CrossRef] [PubMed]
- Grant, T.L.; Edwards, N.; Sveistrup, H.; Andrew, C.; Egan, M. Neighborhood Walkability: Older People’s Perspectives From Four Neighborhoods in Ottawa, Canada. J. Aging Phys. Act. 2010, 18, 293–312. [Google Scholar] [CrossRef]
- Grant, T.L.; Edwards, N.; Sveistrup, H.; Andrew, C.; Egan, M. Inequitable walking conditions among older people: Examining the interrelationship of neighbourhood socio-economic status and urban form using a comparative case study. BMC Public Health 2010, 10, 677. [Google Scholar] [CrossRef]
- Leger, S.J.; Dean, J.L.; Edge, S.; Casello, J.M. “If I had a regular bicycle, I wouldn’t be out riding anymore”: Perspectives on the potential of e-bikes to support active living and independent mobility among older adults in Waterloo, Canada. Transp. Res. Part A Policy Pract. 2018, 123, 240–254. [Google Scholar] [CrossRef]
- Mah, S.; Mitra, R. The effects of a free bus program on older adults travel behaviour: A case study of a Canadian suburban municipality. Case Stud. Transp. Policy 2017, 5, 460–466. [Google Scholar] [CrossRef]
- Mitra, R.; Siva, H.; Kehler, M. Walk-friendly suburbs for older adults? Exploring the enablers and barriers to walking in a large suburban municipality in Canada. J. Aging Stud. 2015, 35, 10–19. [Google Scholar] [CrossRef]
- Ottoni, C.A.; Sims-Gould, J.; Winters, M.; Heijnen, M.; McKay, H.A. “Benches become like porches”: Built and social environment influences on older adults’ experiences of mobility and well-being. Soc. Sci. Med. 2016, 169, 33–41. [Google Scholar] [CrossRef]
- Winters, M.; Sims-Gould, J.; Franke, T.; McKay, H. “I grew up on a bike”: Cycling and older adults. J. Transp. Health 2015, 2, 58–67. [Google Scholar] [CrossRef]
- Adorno, G.; Fields, N.; Cronley, C.; Parekh, R.; Magruder, K. Ageing in a low-density urban city: Transportation mobility as a social equity issue. Ageing Soc. 2016, 38, 296–320. [Google Scholar] [CrossRef]
- Gallagher, N.A.; Gretebeck, K.A.; Robinson, J.C.; Torres, E.R.; Murphy, S.L.; Martyn, K.K. Neighborhood Factors Relevant for Walking in Older, Urban, African American Adults. J. Aging Phys. Act. 2010, 18, 99–115. [Google Scholar] [CrossRef] [PubMed]
- Ryan, J.; Wretstrand, A.; Schmidt, S.M. Exploring public transport as an element of older persons’ mobility: A Capability Approach perspective. J. Transp. Geogr. 2015, 48, 105–114. [Google Scholar] [CrossRef]
- Habib, K.M.N.; Hui, V. An activity-based approach of investigating travel behaviour of older people. Transportation 2015, 44, 555–573. [Google Scholar] [CrossRef]
- Cassarino, M.; Setti, A. Complexity As Key to Designing Cognitive-Friendly Environments for Older People. Front. Psychol. 2016, 7, 1329. [Google Scholar] [CrossRef]
- Phillips, J.; Walford, N.; Hockey, A.; Foreman, N.; Lewis, M. Older people and outdoor environments: Pedestrian anxieties and barriers in the use of familiar and unfamiliar spaces. Geoforum 2013, 47, 113–124. [Google Scholar] [CrossRef]
- Forsyth, A.; Krizek, K. Urban Design: Is there a Distinctive View from the Bicycle? J. Urban Des. 2011, 16, 531–549. [Google Scholar] [CrossRef]
- Panter, J.; Guell, C.; Humphreys, D.; Ogilvie, D. Title: Can changing the physical environment promote walking and cycling? A systematic review of what works and how. Health Place 2019, 58, 102161. [Google Scholar] [CrossRef] [PubMed]
- Cottrill, C.D.; Brooke, S.; Mulley, C.; Nelson, J.D.; Wright, S. Can multi-modal integration provide enhanced public transport service provision to address the needs of vulnerable populations? Res. Transp. Econ. 2020, 83, 100954. [Google Scholar] [CrossRef]
- Valentina, V.; Opromolla, A.; Parente, G.A.; Medaglia, C.M. Towards a Multi-modal Transportation Scenario: An Analysis About Elderly Needs. In International Conference on Human-Computer Interaction; Springer: Cham, Switzerland, 2019; pp. 118–129. [Google Scholar]
- Haustein, S.; Siren, A. Older People’s Mobility: Segments, Factors, Trends. Transp. Rev. 2015, 35, 466–487. [Google Scholar] [CrossRef]
- Steinbach, R.; Green, J.; Datta, J.; Edwards, P. Cycling and the city: A case study of how gendered, ethnic and class identities can shape healthy transport choices. Soc. Sci. Med. 2011, 72, 1123–1130. [Google Scholar] [CrossRef] [PubMed]
- De Witte, A.; Hollevoet, J.; Dobruszkes, F.; Hubert, M.; Macharis, C. Linking modal choice to motility: A comprehensive review. Transp. Res. Part A Policy Pract. 2013, 49, 329–341. [Google Scholar] [CrossRef]
- Shove, E. Putting practice into policy: Reconfiguring questions of consumption and climate change. Contemp. Soc. Sci. 2012, 9, 415–429. [Google Scholar] [CrossRef]
- Yang, Y. Interactions between psychological and environmental characteristics and their impacts on walking. J. Transp. Health 2014, 2, 195–198. [Google Scholar] [CrossRef][Green Version]

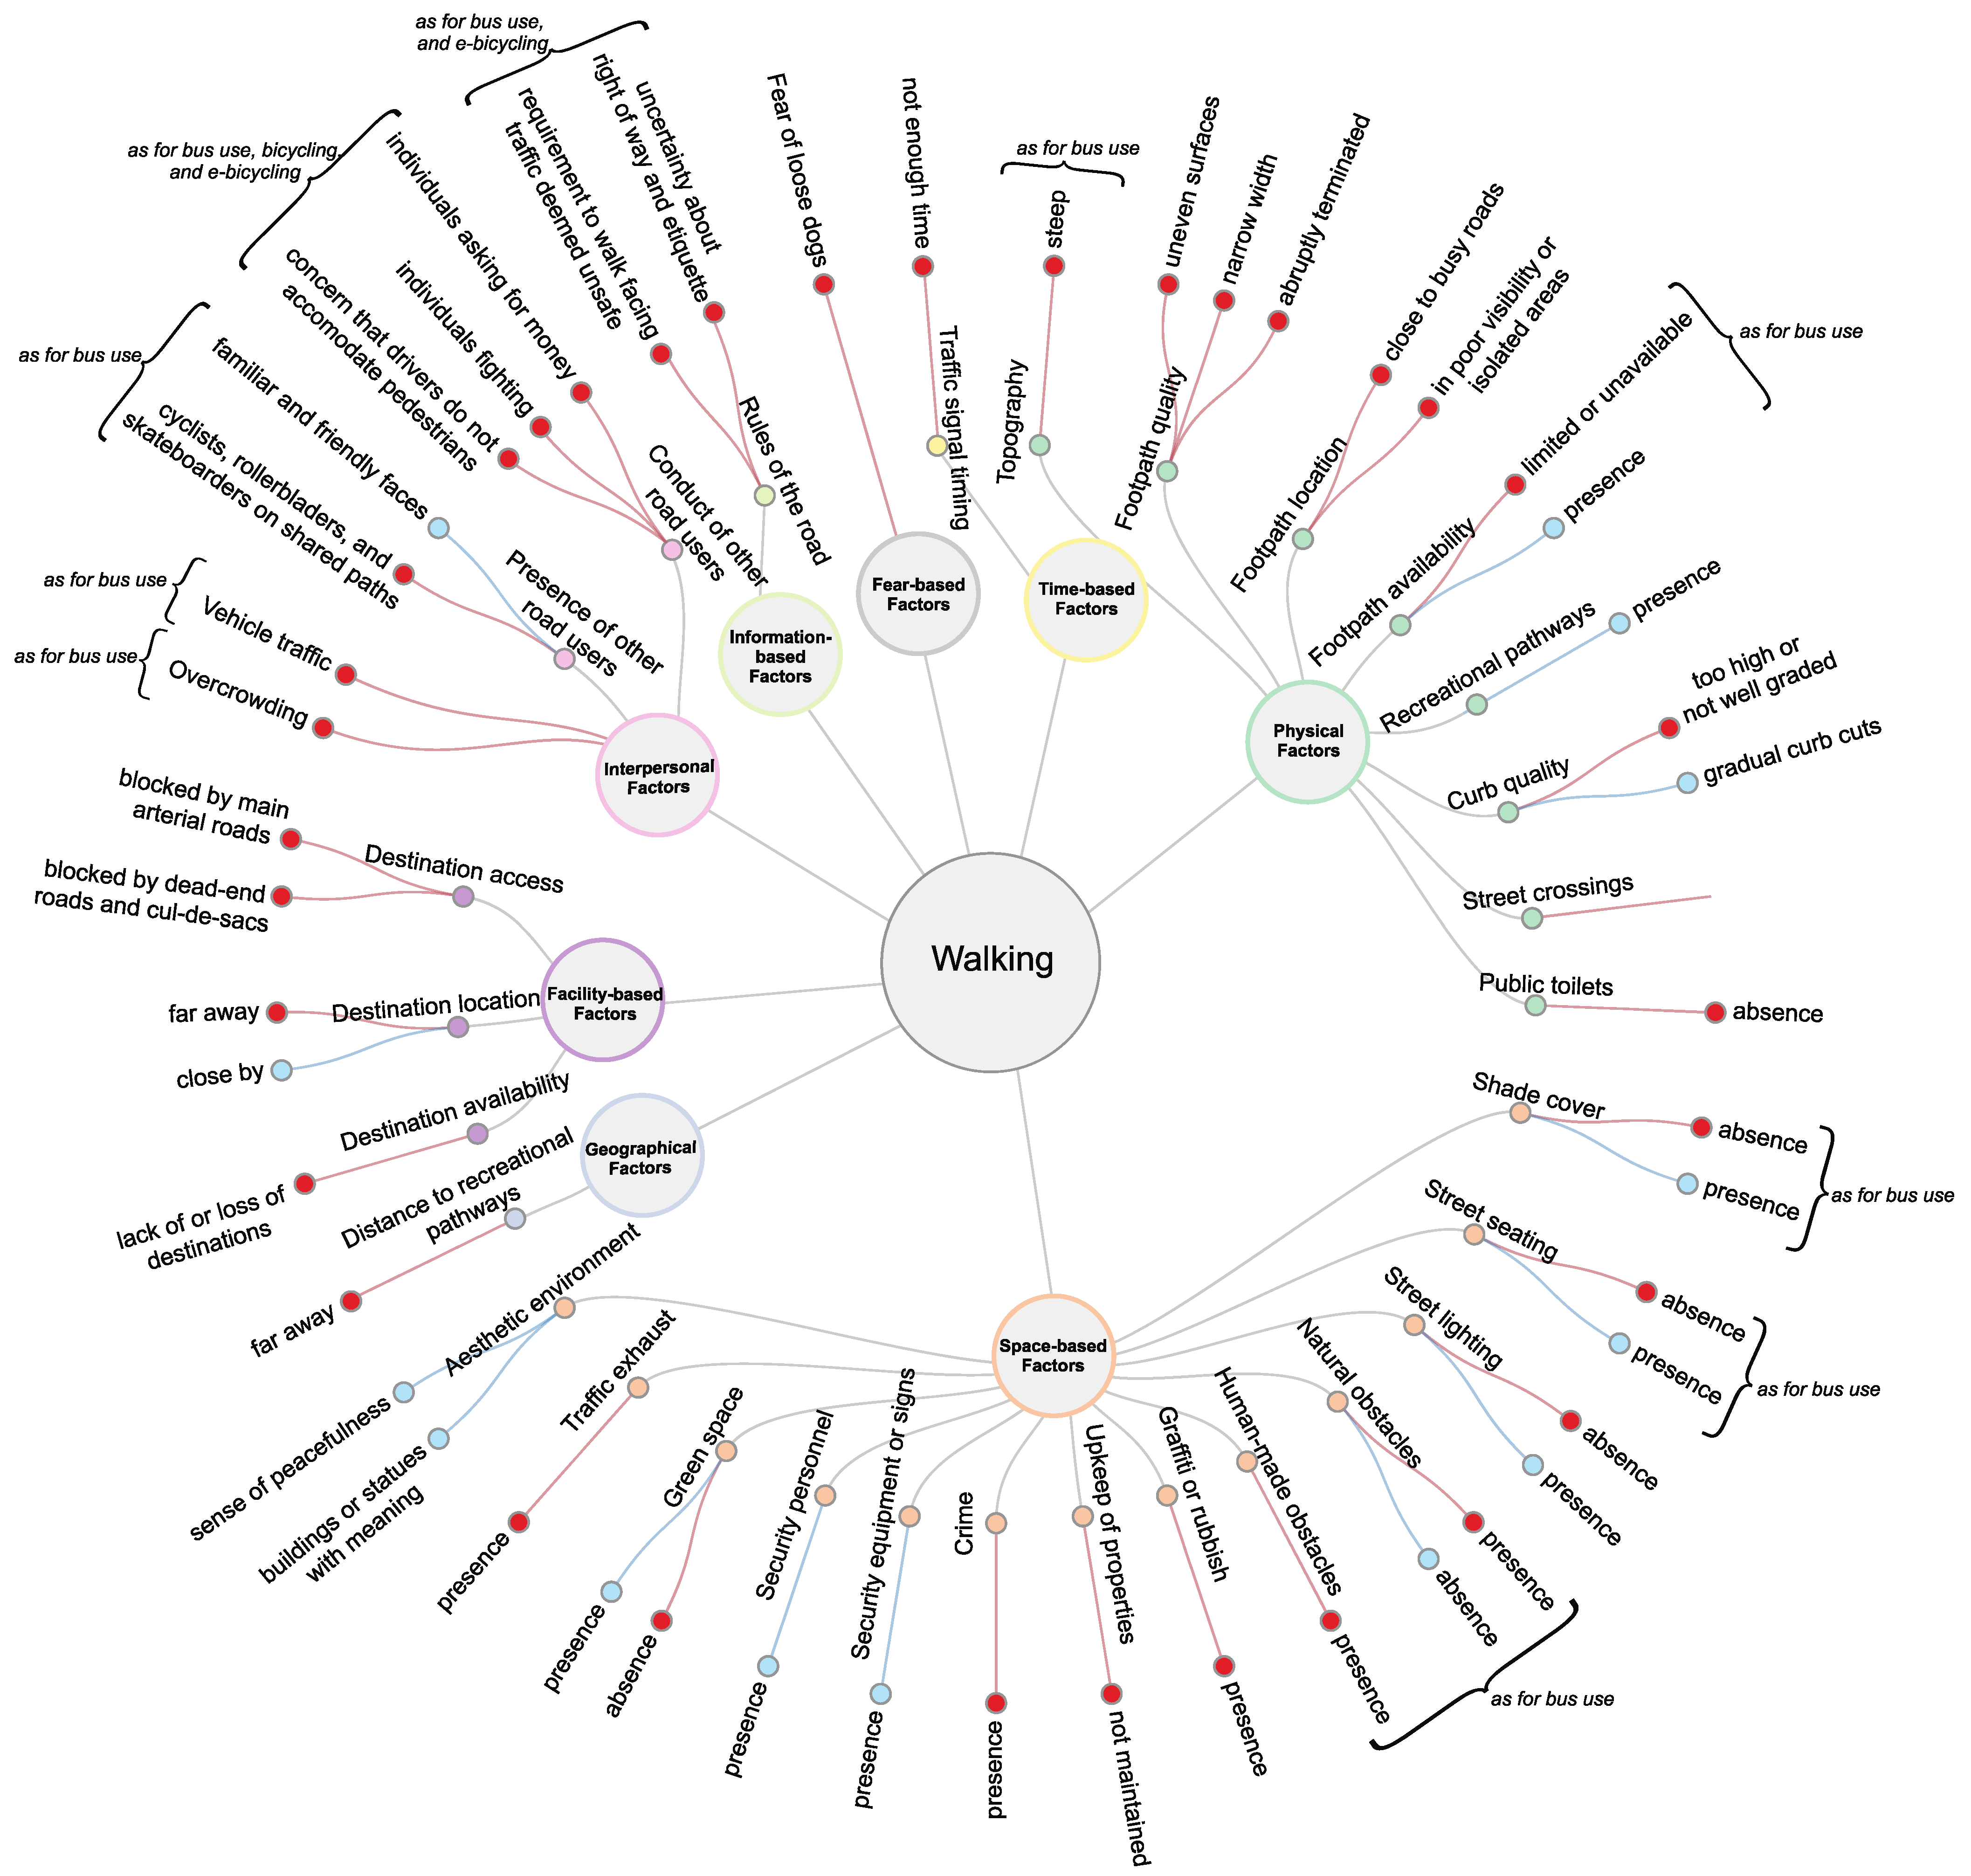
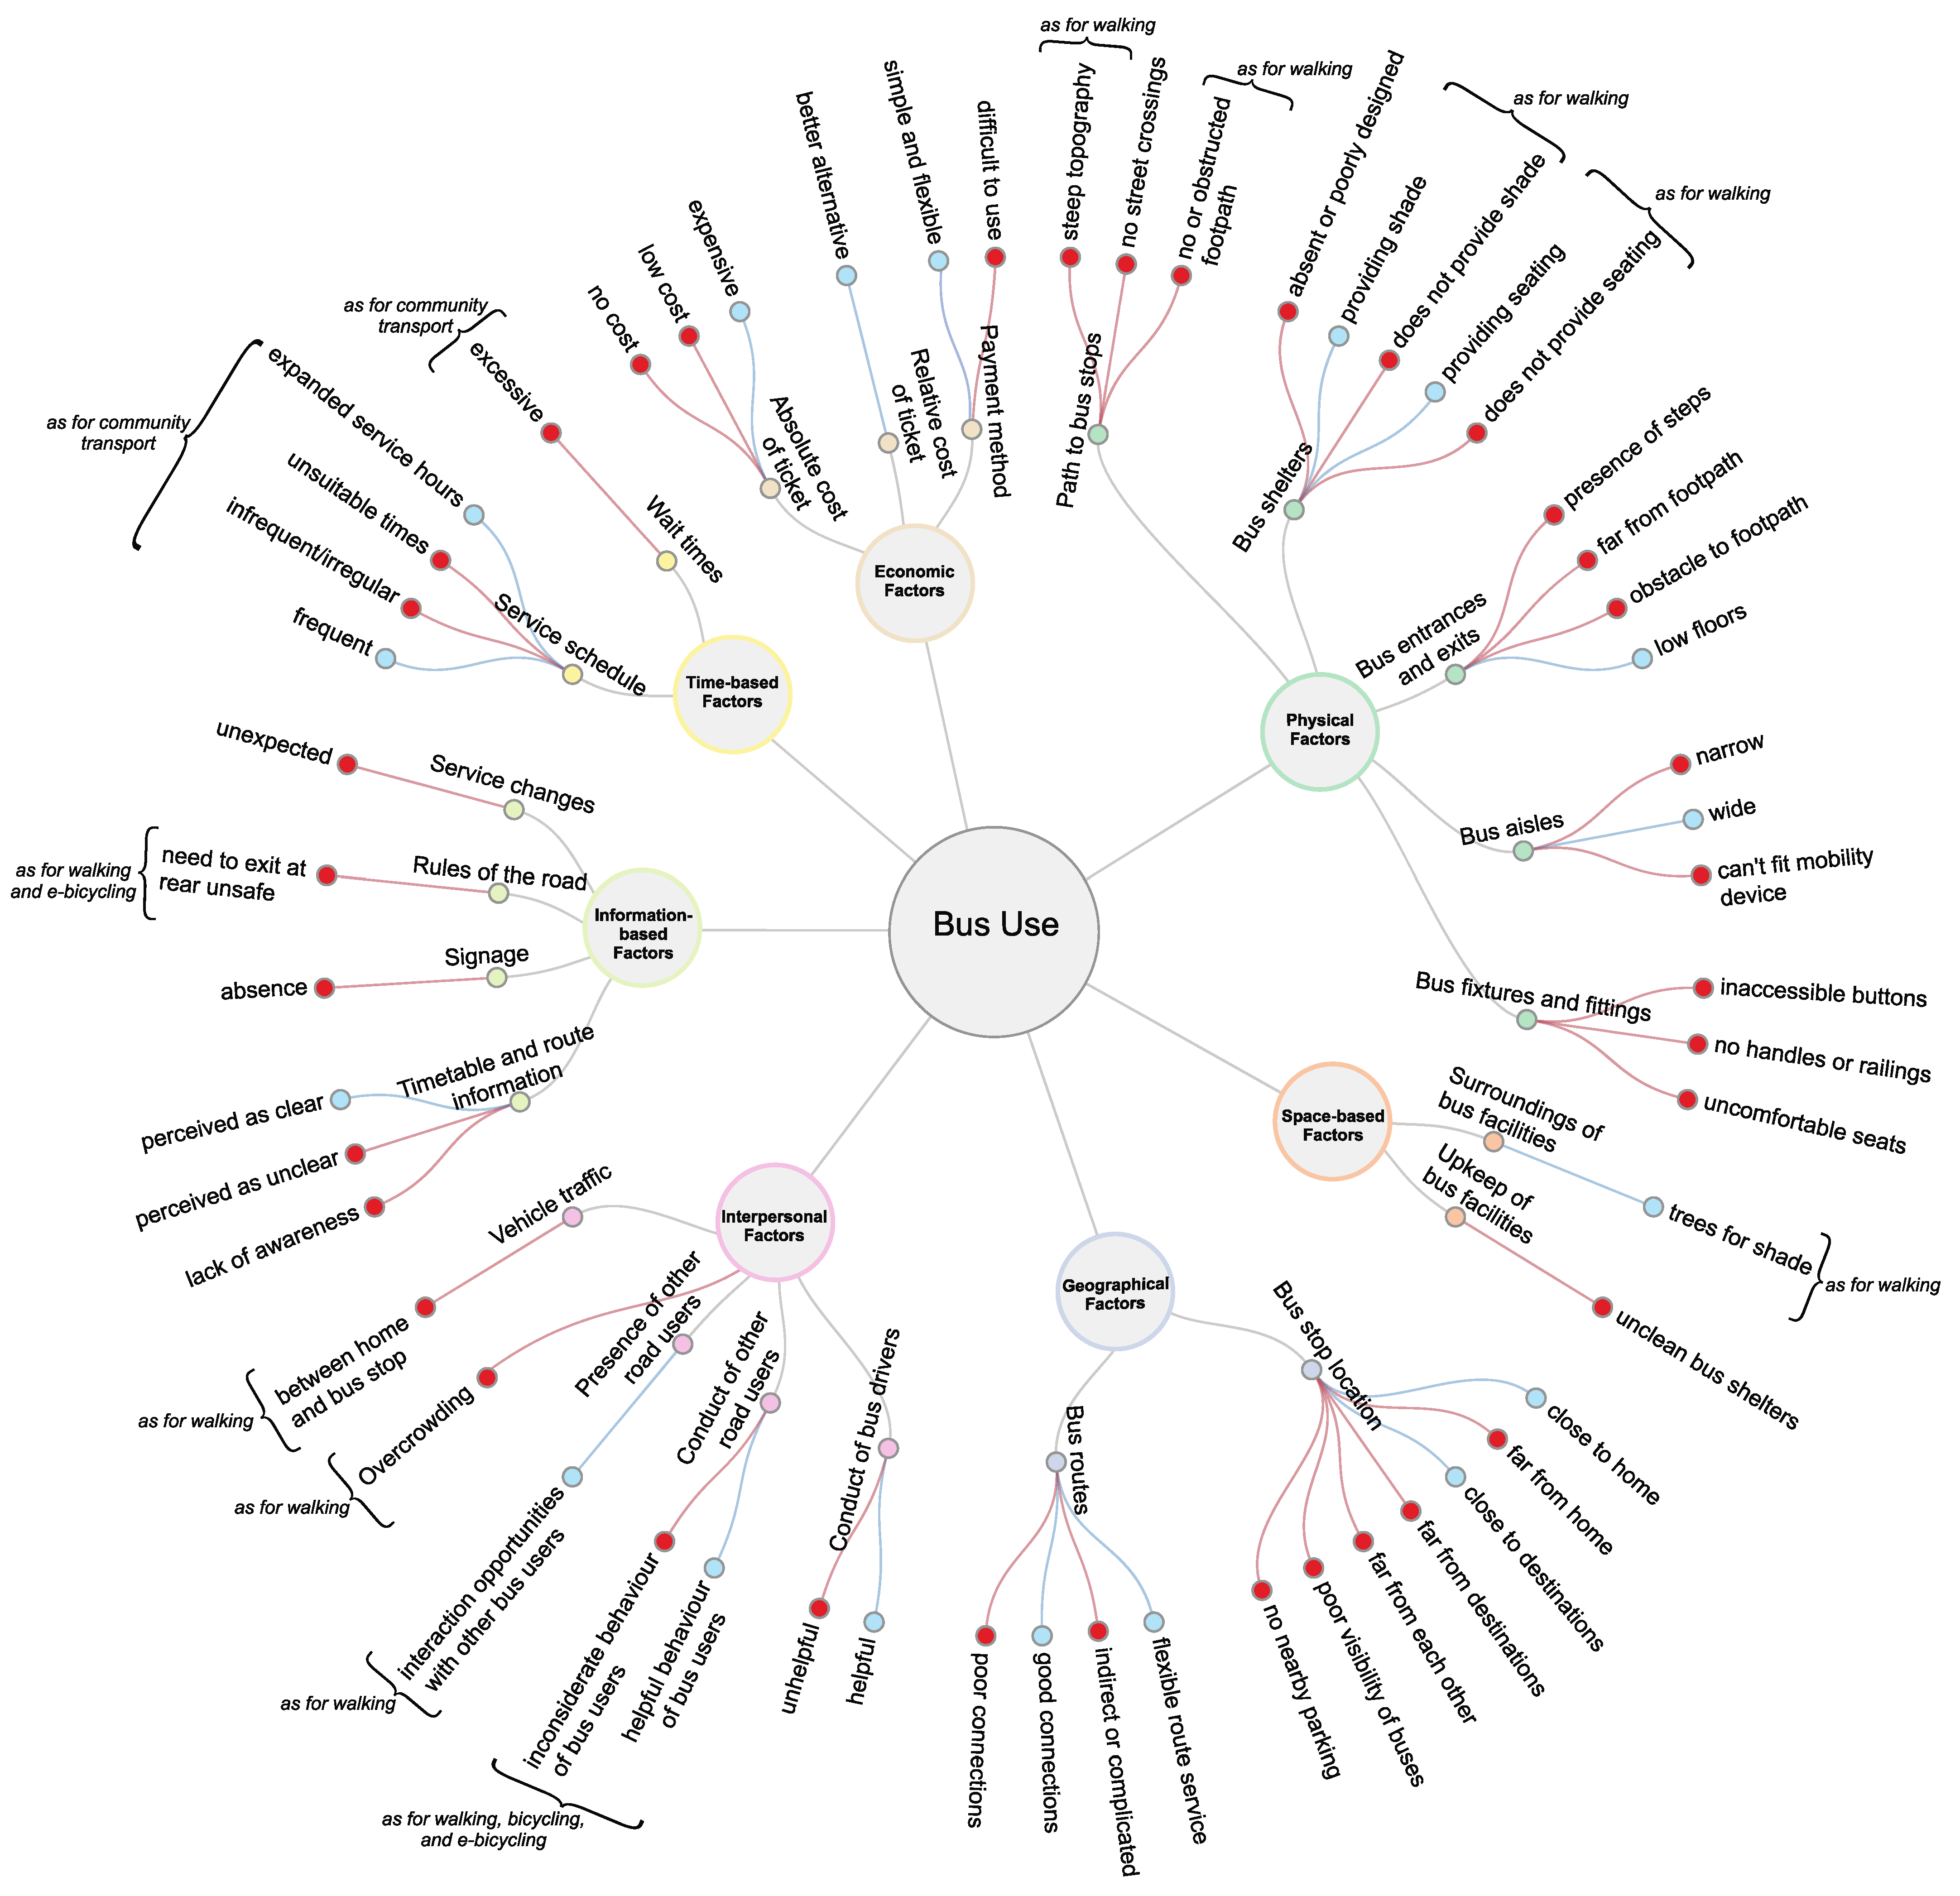
| Category | Definition |
|---|---|
| Environmental | |
| Physical | Physical barriers associated with the transport system and built environment |
| Geographical | Peripherality or spatial isolation |
| Facility-Based | The location of facilities |
| Space-Based | The design, surveillance, and management of public space |
| Individual | |
| Economic | Income constraints and inability to absorb travel costs |
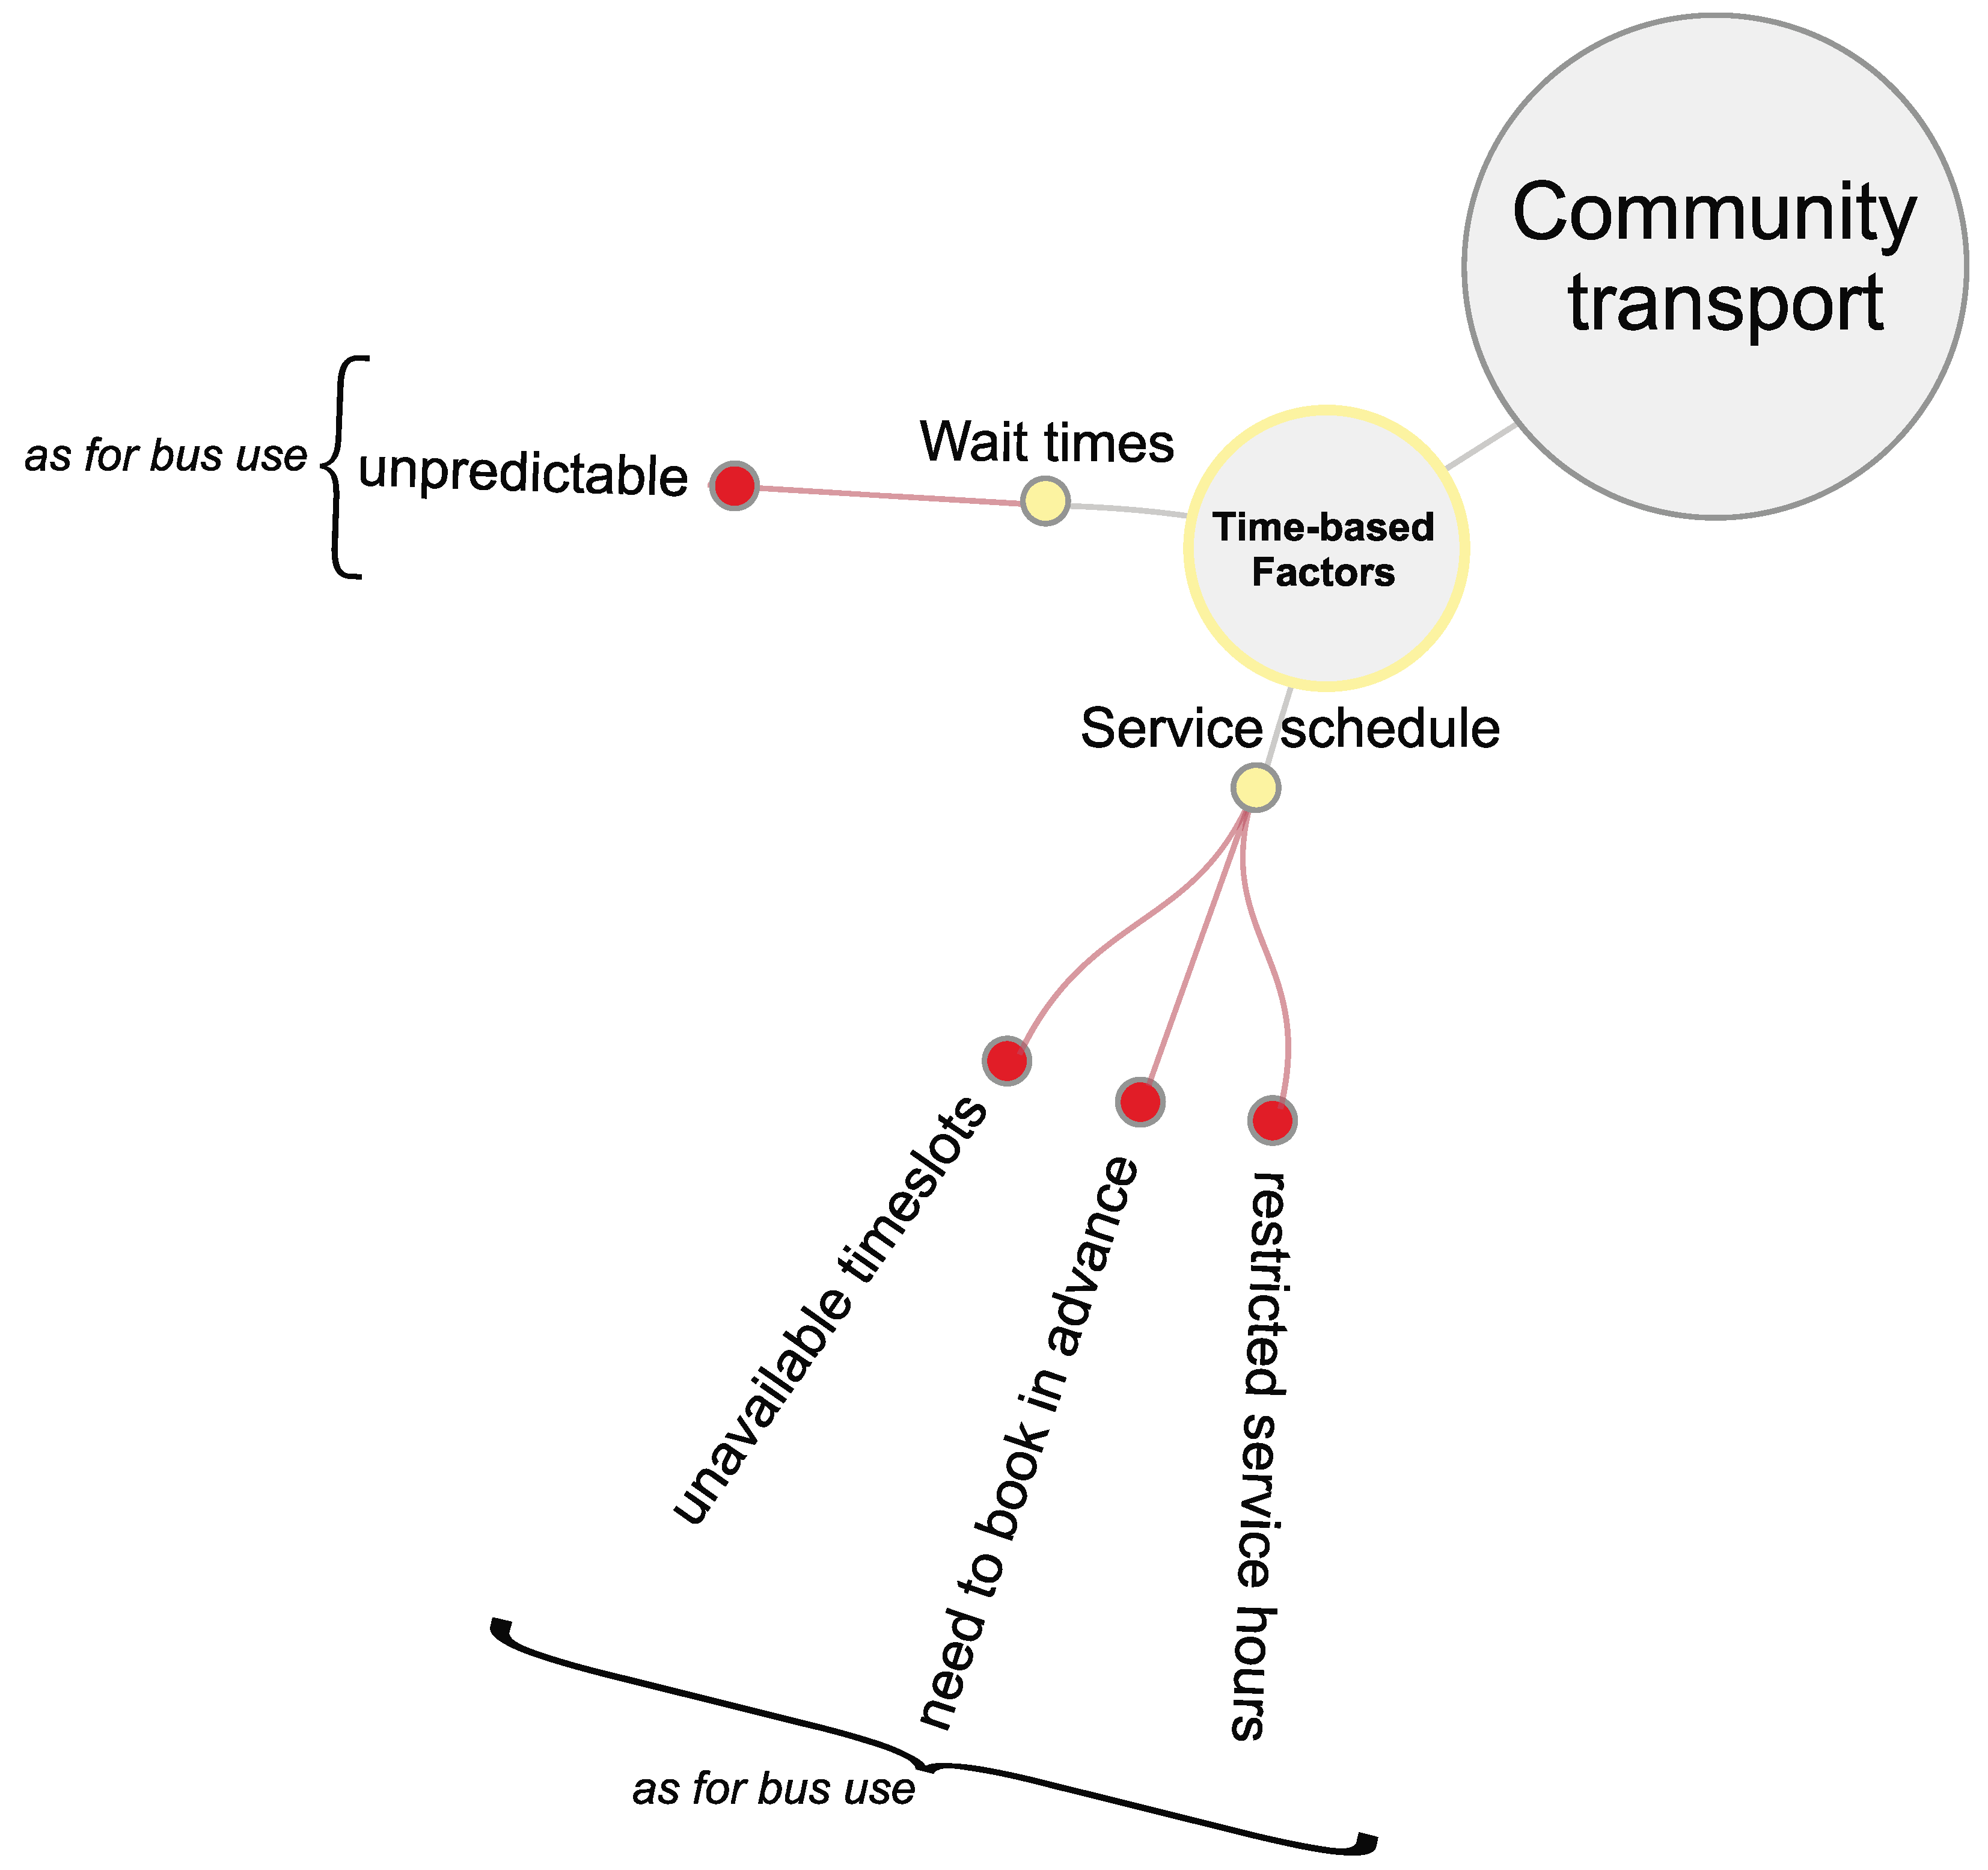
| Time-Based | Time constraints |
| Fear-Based | Attitudes toward public space |
| Study ID | Article ID | Reference | Aim | Description | Positive (+) or Negative (−) Influences on Older People’s Opportunities for Mobility |
|---|---|---|---|---|---|
| 1 | 1a | Broome et al., 2013 [54] | To evaluate the impact of implementing age-friendly guidelines for public buses on bus use, useability, and social participation for older people. [bus] | Quantitative: The authors analysed self-reported information on demographic characteristics, driving behaviour, bus use behaviour, and bus satisfaction gathered from surveys with non-matched bus users before and after the intervention. They also analysed self-reported information on frequency of bus use, perceived ease of bus use, and social participation gathered from surveys with the same cohort of older people before and after the intervention. Participants were aged 60 or older and lived either in Hervey Bay where the intervention took place or Brisbane, which served as a control site. [Australia] | (+) low floors; flexible route service; helpful bus drivers; frequent bus services; |
| 1 | 1b | Broome et al., 2012 [55] | To investigate whether the replacement of a fixed route bus service with a flexible route bus service improves the use of, and satisfaction with, buses particularly among older people. [bus] | Quantitative: Using a pre- and post- test design without a control, the authors evaluated a service in Hervey Bay that allowed the bus to be dynamically redirected to go past users’ residences, and which was accompanied by improvements to scheduling. Data on bus use were sourced from ticket sales collected from electronic ticketing records, with older adults identified via the Pensioner ticket type; and data on bus usability were collected from on-board satisfaction surveys, with older adults identified by being aged 60 and over. [Australia] | (+) flexible route service; expanded service hours |
| 1 | 1c | Broome et al., 2010 [56] | To compare barriers to and facilitators of use of public transport for older and younger adults to determine whether age-friendly guidelines are needed for public transport. [bus] | Qualitative: Using qualitative content analysis, the authors reported on the barriers and facilitators generated and ranked via nominal group technique administered within focus groups of 301 bus and non-bus users, of which 76.7% were aged 60 and older. Focus groups were separated by age. All participants lived in Hervey Bay or Brisbane. [Australia] | (+) helpful bus drivers; frequent services; bus stops close to home and destinations; low floors enabling ease of entry and exit; low cost; timetables and routes easy to understand; bus shelters available to provide shade and seating; bus routes were appropriate with good connections to destinations; simple and flexible ticketing system; co-ordination of services and ticketing with trains, airlines, and other buses; use of mini-buses to connect with major routes or at night (−) unsuitable service times; infrequent/irregular services; lack of connection of routes to desired destinations; bus stops far from home, destination, and each other; presence of steps making entry and exit difficult; driver not parking close to curb making entry and exit difficult; indirect bus routes; excessive wait times between connections; lack of co-ordination with other bus, train and ferry services; needing to change buses; unhelpful bus drivers; lack of bus shelters to provide shade and seating |
| 1 | 1d | Broome et al., 2010 [57] | To explore the barriers and facilitators to all stages of bus use for older people and their relative impact on bus usability. [bus] | Mixed Methods: The authors reported on the barriers and facilitators identified via nominal group technique administered within focus groups of 227 participants and focused ethnography with 40 participants which involved a pre-trip interview, observation of actual bus use, and a stimulated recall interview. All participants were aged 60 or older living in Hervey Bay or Brisbane. Analyses used a thematic approach. [Australia] | (+) wide bus aisles; helpful behaviour of other road users including helping the participant at risk of falling, stopping a participant’s stepping out in front of a moving car; calling out to the bus driver to avoid overshooting the bus during a bus journey, helping participant who was unable to understand a map (−) steep topography, lack of street crossings, and no or obstructed footpaths on the path to bus stops; absent or poorly designed bus shelters; bus entry and exit made difficult by steps or obstacles on footpaths; narrow bus aisles; mobility device not fitting in bus aisles; inaccessible buttons; no handles or railings; uncomfortable seats; trees for shade; unclean bus shelters; bus stops located far from home; poor visibility of buses; no parking near bus stops; indirect or complicated bus routes; bus routes with poor connections; unhelpful bus drivers; inconsiderate behaviour of other bus users; overcrowding; vehicle traffic between home and bus stop; timetable and route information unclear; no signage; service changes that were unexpected or not communicated; infrequent or irregular service schedules; unsuitable service times; expensive ticketing; payment and purchasing method was difficult |
| 2 | 2 | Nathan et al., 2012 [58] | To examine associations between access to and mix of commercial destinations within the neighbourhood and walking in a sample of older adults. [walking] | Quantitative: The authors modelled the relationship between activity levels as measured via the Active Australia Survey within the state-wide Health and Wellbeing Surveillance System and access to each commercial destination type (food retail, general retail, medical care services, financial services, general services, and social infrastructure) within 400 m and 800 m from participants’ home address as computed using spatial data among 2918 residents of the Perth metropolitan region who were aged 65–84 years. [Australia] | (+) destinations close by |
| 3 | 3a | Zeitler et al., 2015 [59] | To investigate the use of transportation by older people and its implications for their out-of-home activities within suburban environments. [bus] | Qualitative: The authors analysed mobility patterns gathered from time-use diaries and GPS mapping as well as perspectives and experiences on safety, affordability, availability, accessibility, and walkability gathered from interviews of 13 participants aged 55 or older living in Brisbane. [Australia] | (−) bus stop locations far from intended destination; unaware of public transport service options |
| 3 | 3b | Zeitler et al., 2012 [60] | To explore if and how suburban environments impact older people’s mobility and their use of different modes of transport. [walking] [bus] | Qualitative: The authors analysed mobility patterns gathered from time-use diaries, GPS mapping, and interviews of 13 participants aged 55 or older living in low density areas in Brisbane. [Australia] | Walk (−) limited footpaths or not having footpaths on both sides of the road; pedestrian crossing time being too fast; uneven footpath surfaces; steep topography Bus (+) bus stop location close to home; frequent services (−) bus stop location far from home; bus stop far from destination; bus being overcrowded; infrequent services |
| 3 | 3c | Vine et al., 2012 [61] | To explore the effect of the neighbourhood environment and its influence on liveability for older urban residents. [walking] [bus] | Qualitative: The authors analysed mobility patterns gathered from time-use diaries, GPS mapping, and interviews of 12 participants aged 55 or older living in high density areas in Brisbane. Analyses used a thematic approach. [Australia] | Walk (−) uneven footpath surfaces; steep topography; overcrowding; footpaths too close to busy roads; pedestrian crossing signals not long enough; lack of shade; lack of street seating Bus (−) bus stops far from desired destinations; infrequent/irregular services; steep topography when travelling to bus stops; excessive wait times; timetable and route information unclear In General (−) minimal amenity choice within reasonable distance |
| 3 | 3d | Vine et al., 2012 [62] | To explore neighbourhood walkability as older adults experience this phenomenon through time and space. [walking] [bus] | Qualitative: The authors analysed mobility patterns gathered from time-use diaries, GPS mapping, and interviews of 12 participants aged 55 or older living in high density areas in Brisbane. Analyses were guided by an a priori framework on the built environment’s influence on physical activity. [Australia] | Walk (+) destinations close to home (−) steep topography; presence of cyclists on shared paths and potential for conflict; insufficient time for older people to cross the road; confusion about right of way protocol; narrow footpaths; proximity of footpaths to busy roads and merging of footpaths with vehicle traffic; overcrowding; insufficient green space; insufficient street lighting; lack of shade; lack of street seating; unavailability of clean and safe public toilets Bus (−) indirect routes to get to destinations; lack of awareness about timetable and route information; infrequent/irregular services; steep topography on path to bus stops; excessive wait times; timetable and route information unclear In General (−) minimal amenity choice within reasonable distance |
| 4 | 4 | Gardner, 2014 [63] | To understand how neighbourhoods—as physical and social environments—influence community mobility of older adults. [walking] | Qualitative: The author completed an ethnographic study of 6 participants age 75 or older living in Toronto to understand how neighbourhoods were experienced and what challenges were encountered in negotiating the physical environment. Data were collected over 8 months in auditory, textual, and visual formats on go-along interviews. [Canada] | (−) curbs that were too high or were not properly; footpaths that were not cleared of snow, ice, leaves or branches; uneven footpath surfaces; the lack of street seating; graffiti and debris |
| 5 | 5a | Grant et al., 2010 [64] | To develop a more thorough understanding of older people’s neighbourhood walking experiences with an emphasis on daily life. [walking] [bus] | Qualitative: The authors thematically analysed the everyday walking experiences as derived from focus groups and interviews of 75 participants aged 65 or older living in Ottawa. [Canada] | Walk (+) bus stops with benches for resting (−) destinations separated by main arterial roads; obstacles such as newspaper boxes and vending displays on footpaths; uncertainty about the rules of the road and needing a “rule book for walking”; the need to walk on the street facing traffic as required by law resulted in exposures to hazards; location of destinations beyond walking distance; inadequate crossing signal times; traffic exhaust; long crossing distances across multiple lanes; vehicle traffic; cyclists, rollerbladers, and skateboarders on footpaths Bus (−) the need to exit at rear of bus; obstacles on footpaths such as snowbanks which made it difficult to enter and exit buses; bus stops located far from destinations |
| 5 | 5b | Grant et al., 2010 [65] | To examine how urban form and neighbourhood SES inter-relate to affect the experiences of older people who walk in their neighbourhoods. [walking] [bus] | Qualitative: In this comparative case study of 4 neighbourhoods, the authors collected information on where people walked and why, what the supportive and unsupportive aspects of the neighbourhood environment were, and what positive and negative neighbourhood changes affected walking. This information was collected via interviews and focus groups with 75 participants aged 65 or older living in Ottawa. Analyses used a thematic approach. [Canada] | Walk (+) presence of footpaths which separated vehicle and pedestrian traffic, allowed for spontaneous meeting opportunities, and legitimize walking as a form of transportation; presence of recreational pathways; desired destinations were located close by (−) footpath grading too high; hazards on footpaths such as carts and fallen fruit; distance to recreational pathways was too far; lack of grocery store nearby or loss of commercial destinations nearby; the need to cross main traffic roadways to reach destinations; heavy vehicle traffic; cyclists and skateboarders on shared paths Bus (−) obstacles between footpaths and bus entrances/exits; indirect or complicated bus routes |
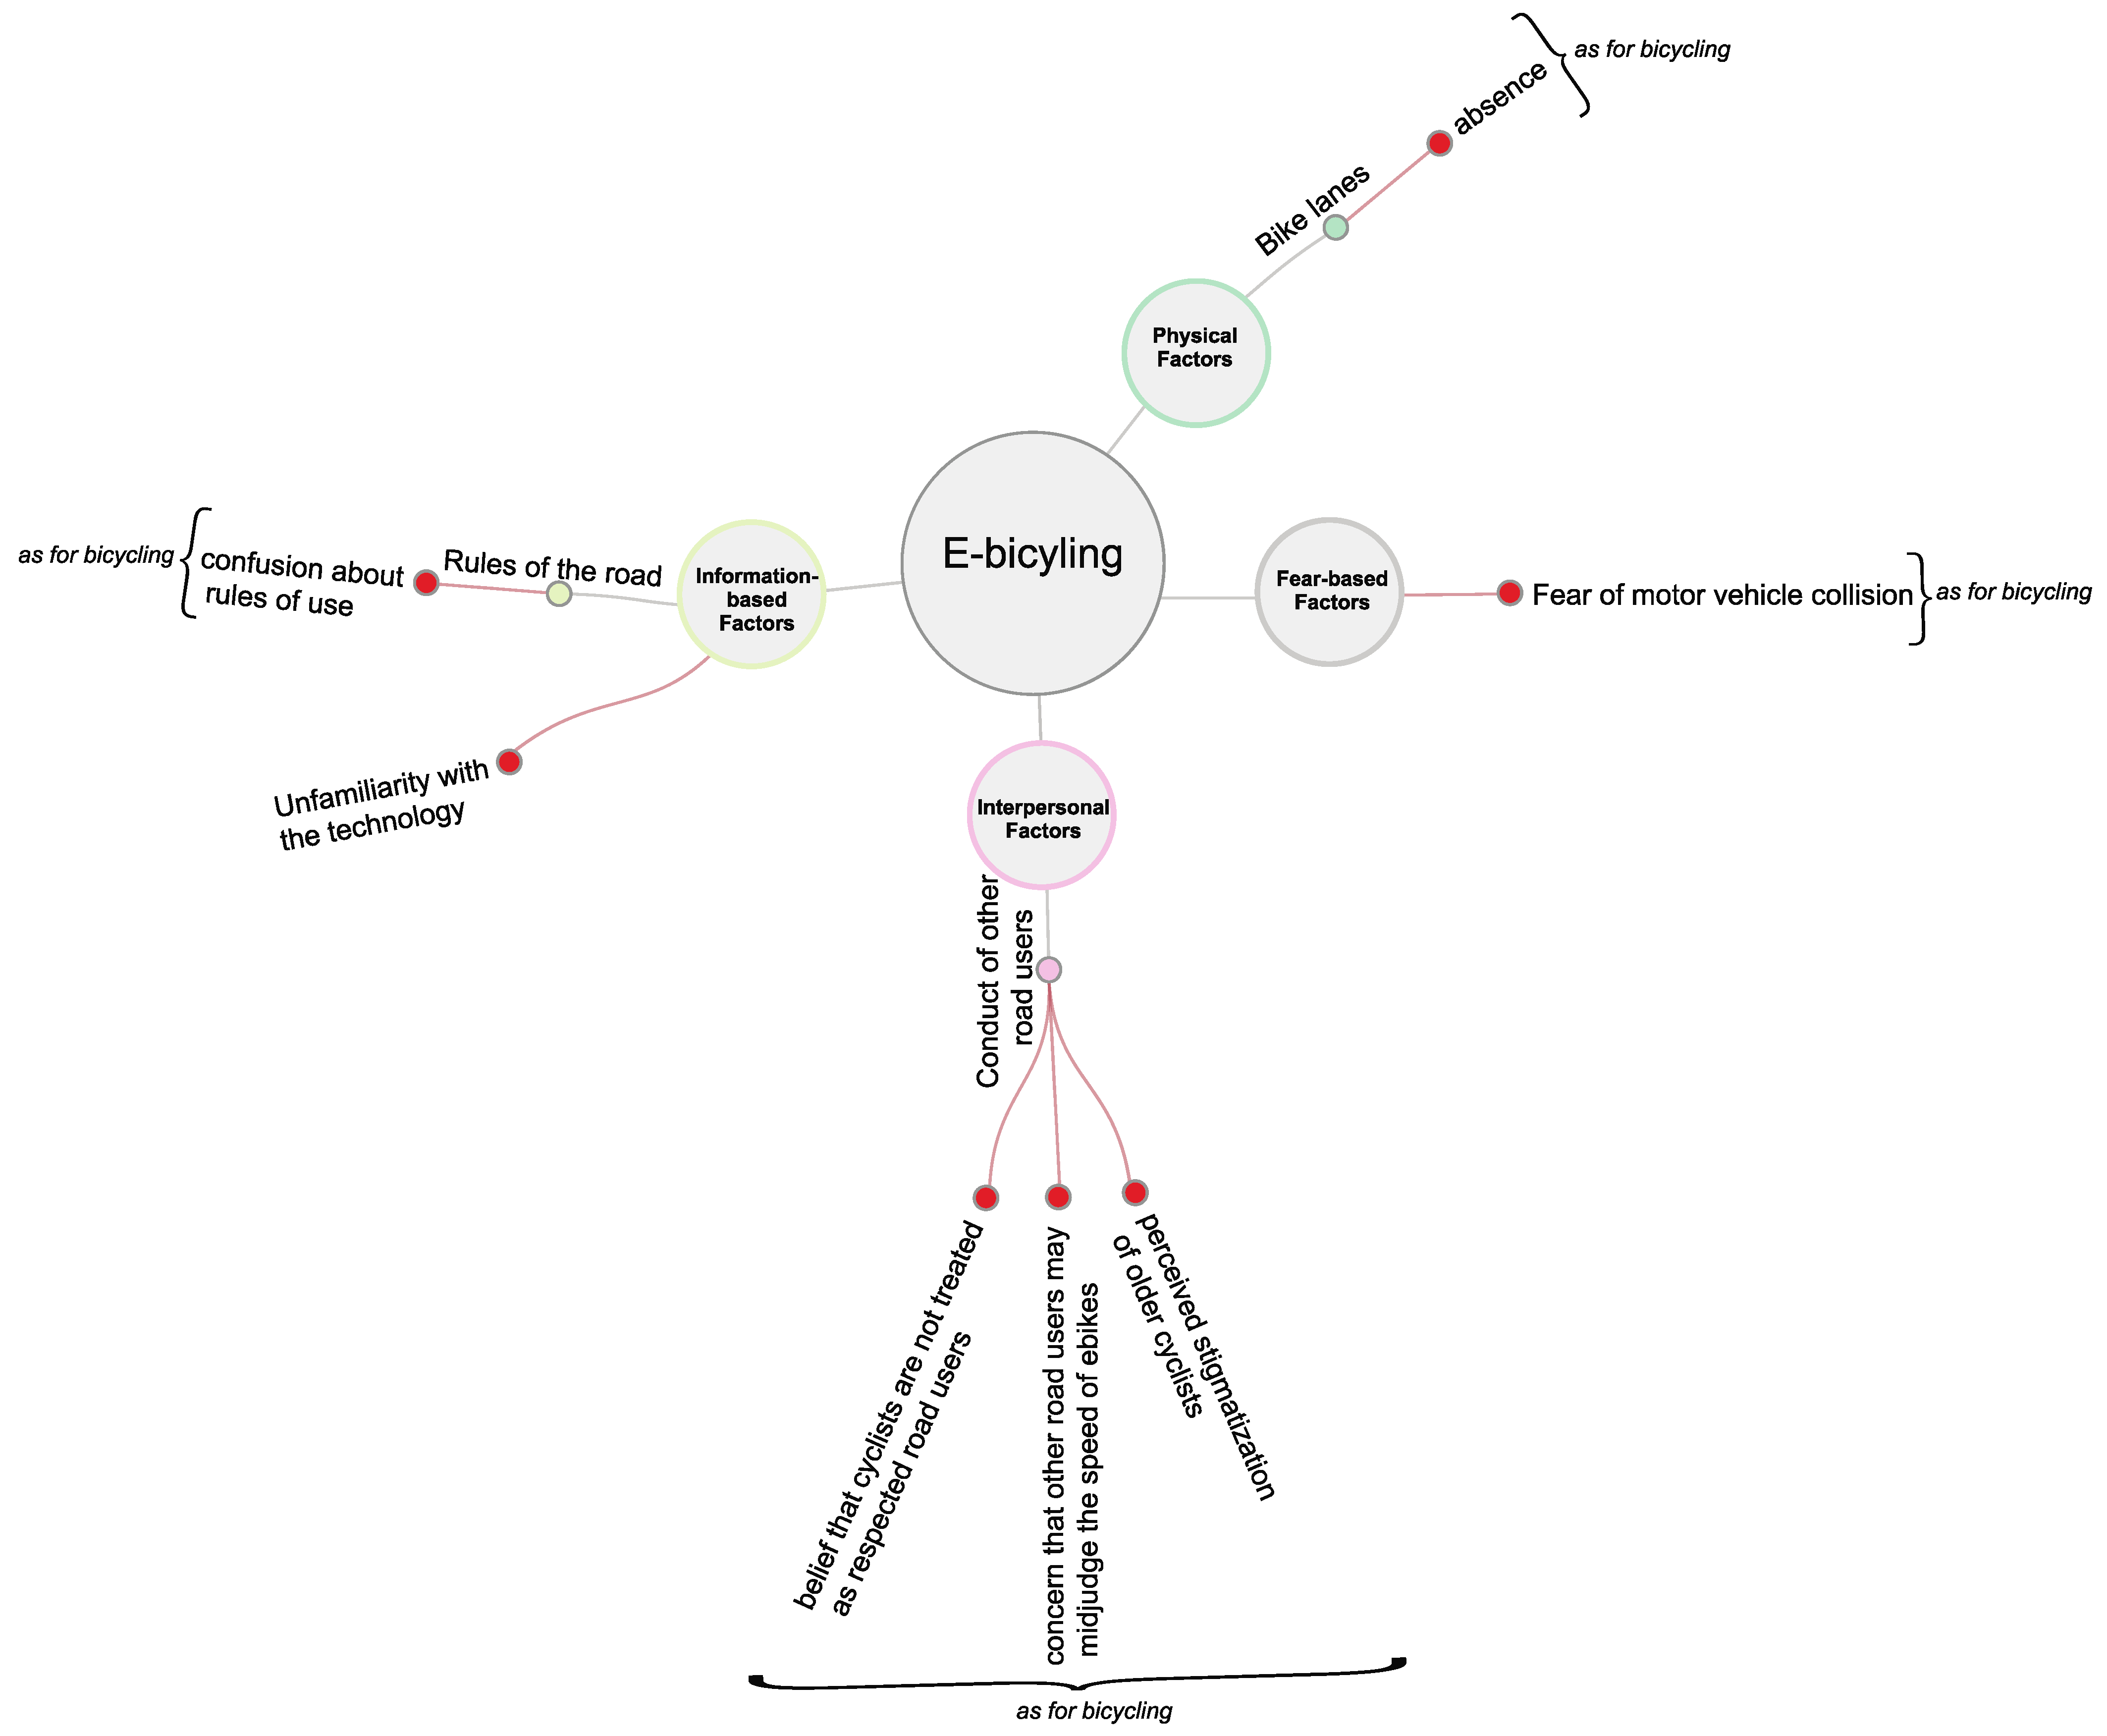
| 6 | 6 | Leger et al., 2019 [66] | To explore the perceived viability of older adult e-bike adoption in the Canadian context with a focus on the determinants of older adult mobility. [e-bicycling] | Qualitative: The authors conducted interviews with 17 governance and community stakeholders as well as focus groups with 37 participants aged 55 and older with a range of bicycling experience living in Waterloo. Analyses were guided by a theoretical framework that incorporates various life-space locations. [Canada] | (−) poor bicycling infrastructure; fear of motor vehicle collision; perceived stigmatization of older cyclists; concern that other road users may misjudge the speed of e-bikes; belief that cyclists are not treated as respected road users; unfamiliarity with the e-bike technology; confusion about rules of use |
| 7 | 7 | Mah et al., 2017 [67] | To examine the potential effect of a free bus program on travel behaviour of older adults in a suburban municipality. [bus] | Mixed Methods: The authors modelled the results of a questionnaire answered by 131 participants aged 65 or older living in Oakville to determine the socioeconomic, access, and travel behaviour predictors of being impacted by the free bus program. They also thematically analysed older adults’ experiences with the free bus program gathered via interviews with 16 participants aged 65 or older living in Oakville. [Canada] | (+) no cost bus service; helpful bus drivers; social interaction opportunities with other bus users (−) had a cheaper alternative |
| 8 | 8 | Mitra et al., 2015 [68] | To explore the relationship between the neighbourhood built environment and walking among a small group of older adults in a large suburban municipality in Canada. [walking] | Qualitative: The authors thematically analysed the perceptions and experiences of walking of 14 participants aged 65 or older living in Mississauga using data from photographs of barriers or facilitators in the built environment that affected walking, drawings of walking routes, and interviews. [Canada] | (+) presence of footpaths; gradual curb cuts; presence of street seating; shade cover; neighbourhood watch signs; security cameras; presence of recreational pathways; street lights (−) timing of traffic lights and pedestrian signals not congruent with older adults’ walking speed; lack of connectivity to destinations due to dead end streets and cul-de-sacs; limited or unavailable footpaths on both sides of the street; uneven footpath surfaces; obstructions on footpaths like loose stones; busy places or crowds; lack of proximity to destinations; vehicular traffic; concern that drivers do not accommodate pedestrians |
| 9 | 9a | Ottoni et al., 2016 [69] | To explore how a specific micro-scale feature of the built environment influence older adults’ experiences of mobility and well-being, from the perspective of older adults, and how these experiences both affect and are affected by the social environment of their neighbourhood. [walking] | Qualitative: The authors analysed observational field notes and transcripts from sit-down and walk-along interviews with 28 participants aged 60 or older living in Vancouver. Data were collected on participants’ health, physical activity, travel behaviours, perceptions of their everyday experiences of their social and physical environments, their practices of engaging with their environment, and their local built and social environments. Analyses were guided by an a priori framework on the topics of built environment and mobility. [Canada] | (+) presence of street seating |
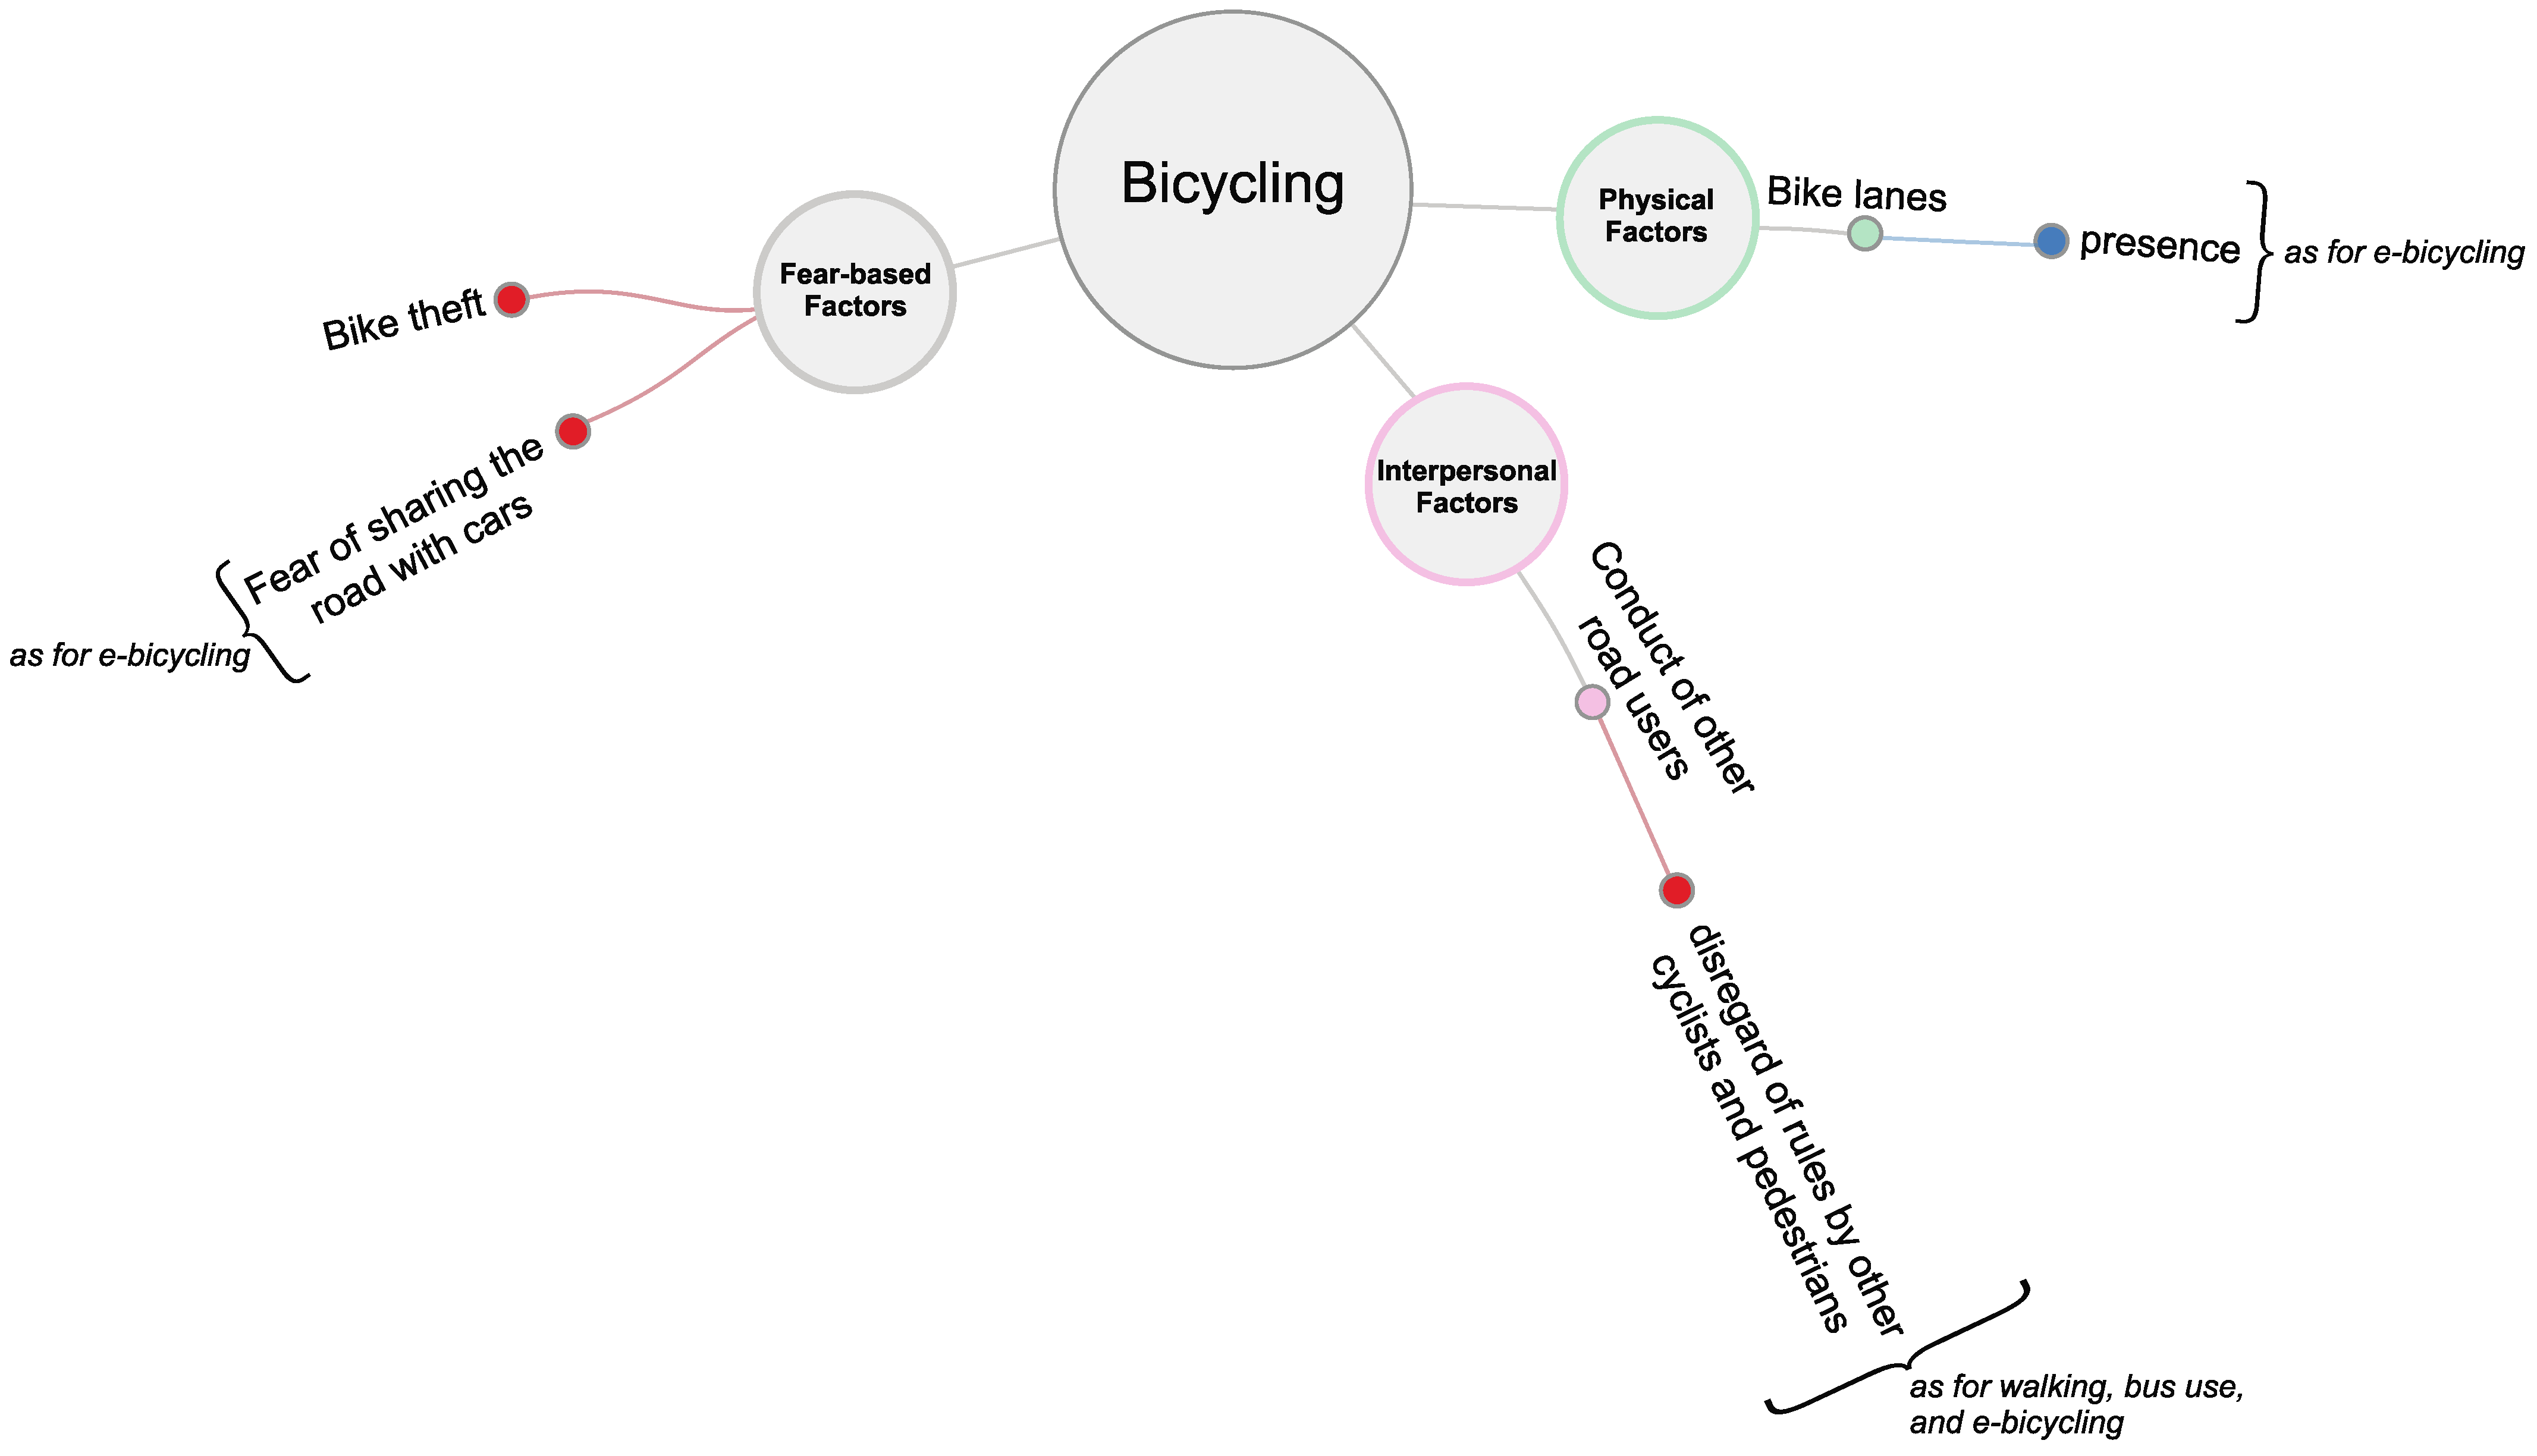
| 9 | 9b | Winters et al., 2015 [70] | To describe the bicycling behaviours of older adults and identify factors that facilitate or deter older adults from bicycling in an ideal environment. [bicycling] | Mixed Methods: From a sample of 193 older adults who were aged 60 or over living adjacent to a planned greenway in downtown Vancouver, the authors quantitatively described bicycling behaviour; determined relationships between bicycling behaviour and demographic, health, physical activity, and social connection status; and compared perceptions of bicycling between those who cycled and those who did not. Data were reported via questionnaire and travel diary. Among a subset of 27 participants, the authors further analysed information on participants’ health, physical activity, travel behaviours, and perceptions of their local built and social environments reported via interview. Analyses were guided by an a priori framework on the topics of built environment and mobility. [Canada] | (+) presence of bike lanes (−) fear of sharing the road with cars; concerns that other cyclists and pedestrians disregard the rules of the road; fear of bike theft |
| 10 | 10 | Adorno et al., 2018 [71] | To examine older adults’ experiences and perspectives regarding transportation mobility. [community transport] | Qualitative: The authors conducted interviews with 15 participants and focus groups with 45 participants on what it means to ‘age well’ in the community. All participants were aged 55 and older living in Arlington. Analyses were guided by an a priori framework based on the World Health Organization’s Age-Friendly Checklist. [USA] | (−) unpredictable wait times for pick up and drop off; requirement to book service in advance; unavailable time slots; restricted service hours |
| 11 | 11 | Gallagher et al., 2010 [72] | To identify the salient factors of the neighbourhood environment that encourage or discourage walking in older, urban African Americans. [walking] | Qualitative: Explored the perceptions of that which “encouraged or discouraged neighbourhood walking” among 21 African American participants aged 60 or older living in Detroit through photovoice-based focus groups. Content and thematic analyses were used. [USA] | (+) presence of familiar and friendly faces; peaceful surroundings; buildings or statues with personal or historical meaning; green space; shade; presence of a senior patrol, police, or security; shovelled footpaths free of obstacles; presence of recreational pathways(−) overcrowding; individuals asking for money; people fighting; vacant houses; overgrown lots; trash; inadequate lighting; fallen trees or branches; criminal activity; footpaths that are abruptly terminated; footpaths overgrown with weeds or icy sidewalks; fear of loose dogs; trails that are isolated or are in poor visibility areas |
| Quality Assessment Item | N, Articles for Which Item Applies | n, Articles Scoring ‘Yes’ |
|---|---|---|
| Category 1: Qualitative studies | ||
| 1.1. Is the qualitative approach appropriate to answer the research question? | 13 | 13 |
| 1.2. Are the qualitative data collection methods adequate to address the research question? | 13 | 13 |
| 1.3. Are the findings adequately derived from the data? | 13 | 13 |
| 1.4. Is the interpretation of results sufficiently substantiated by data? | 13 | 13 |
| 1.5. Is there coherence between qualitative data sources, collection, analysis and interpretation? | 13 | 10 |
| Category 3: Quantitative non-randomized studies | ||
| 3.1. Are the participants representative of the target population? | 3 | 2 |
| 3.2. Are measurements appropriate regarding both the outcome and exposure/intervention? | 3 | 2 |
| 3.3. Are there complete outcome data? | 3 | 0 |
| 3.4. Are the confounders accounted for in the design and analysis? | 3 | 0 |
| 3.5. During the study period, is the intervention/exposure administered as intended? | 3 | 0 |
| Category 5: Mixed methods studies | ||
| 5.1. Is there an adequate rationale for using a mixed methods design to address the research question? | 3 | 1 |
| 5.2. Are the different components of the study effectively integrated to answer the research question? | 3 | 1 |
| 5.3. Are the results adequately brought together into overall interpretations? | 3 | 1 |
| 5.4. Are divergences and inconsistencies between quantitative and qualitative results adequately addressed? | 3 | 1 |
| 5.5. Do the different components of the study adhere to the quality criteria of each tradition of the methods involved? * | 3 | 1 |
Publisher’s Note: MDPI stays neutral with regard to jurisdictional claims in published maps and institutional affiliations. |
© 2022 by the authors. Licensee MDPI, Basel, Switzerland. This article is an open access article distributed under the terms and conditions of the Creative Commons Attribution (CC BY) license (https://creativecommons.org/licenses/by/4.0/).
Share and Cite
Ma, T.; Kim, J.; Godinho, M.A.; de Leeuw, E.; Clapham, K.; Kobel, C.; Ivers, R. A Systematic Review with Framework Synthesis of the Ways That Urban Environments Influence Opportunities for Healthy and Sustainable Mobility in Older Age. Int. J. Environ. Res. Public Health 2022, 19, 13014. https://doi.org/10.3390/ijerph192013014
Ma T, Kim J, Godinho MA, de Leeuw E, Clapham K, Kobel C, Ivers R. A Systematic Review with Framework Synthesis of the Ways That Urban Environments Influence Opportunities for Healthy and Sustainable Mobility in Older Age. International Journal of Environmental Research and Public Health. 2022; 19(20):13014. https://doi.org/10.3390/ijerph192013014
Chicago/Turabian StyleMa, Tracey, Jinhee Kim, Myron Anthony Godinho, Evelyne de Leeuw, Kathleen Clapham, Conrad Kobel, and Rebecca Ivers. 2022. "A Systematic Review with Framework Synthesis of the Ways That Urban Environments Influence Opportunities for Healthy and Sustainable Mobility in Older Age" International Journal of Environmental Research and Public Health 19, no. 20: 13014. https://doi.org/10.3390/ijerph192013014
APA StyleMa, T., Kim, J., Godinho, M. A., de Leeuw, E., Clapham, K., Kobel, C., & Ivers, R. (2022). A Systematic Review with Framework Synthesis of the Ways That Urban Environments Influence Opportunities for Healthy and Sustainable Mobility in Older Age. International Journal of Environmental Research and Public Health, 19(20), 13014. https://doi.org/10.3390/ijerph192013014