

An Integrated Spatial Autoregressive Model for Analyzing and Simulating Urban Spatial Growth in a Garden City, China

 , ,
, ,
Abstract
1. Introduction
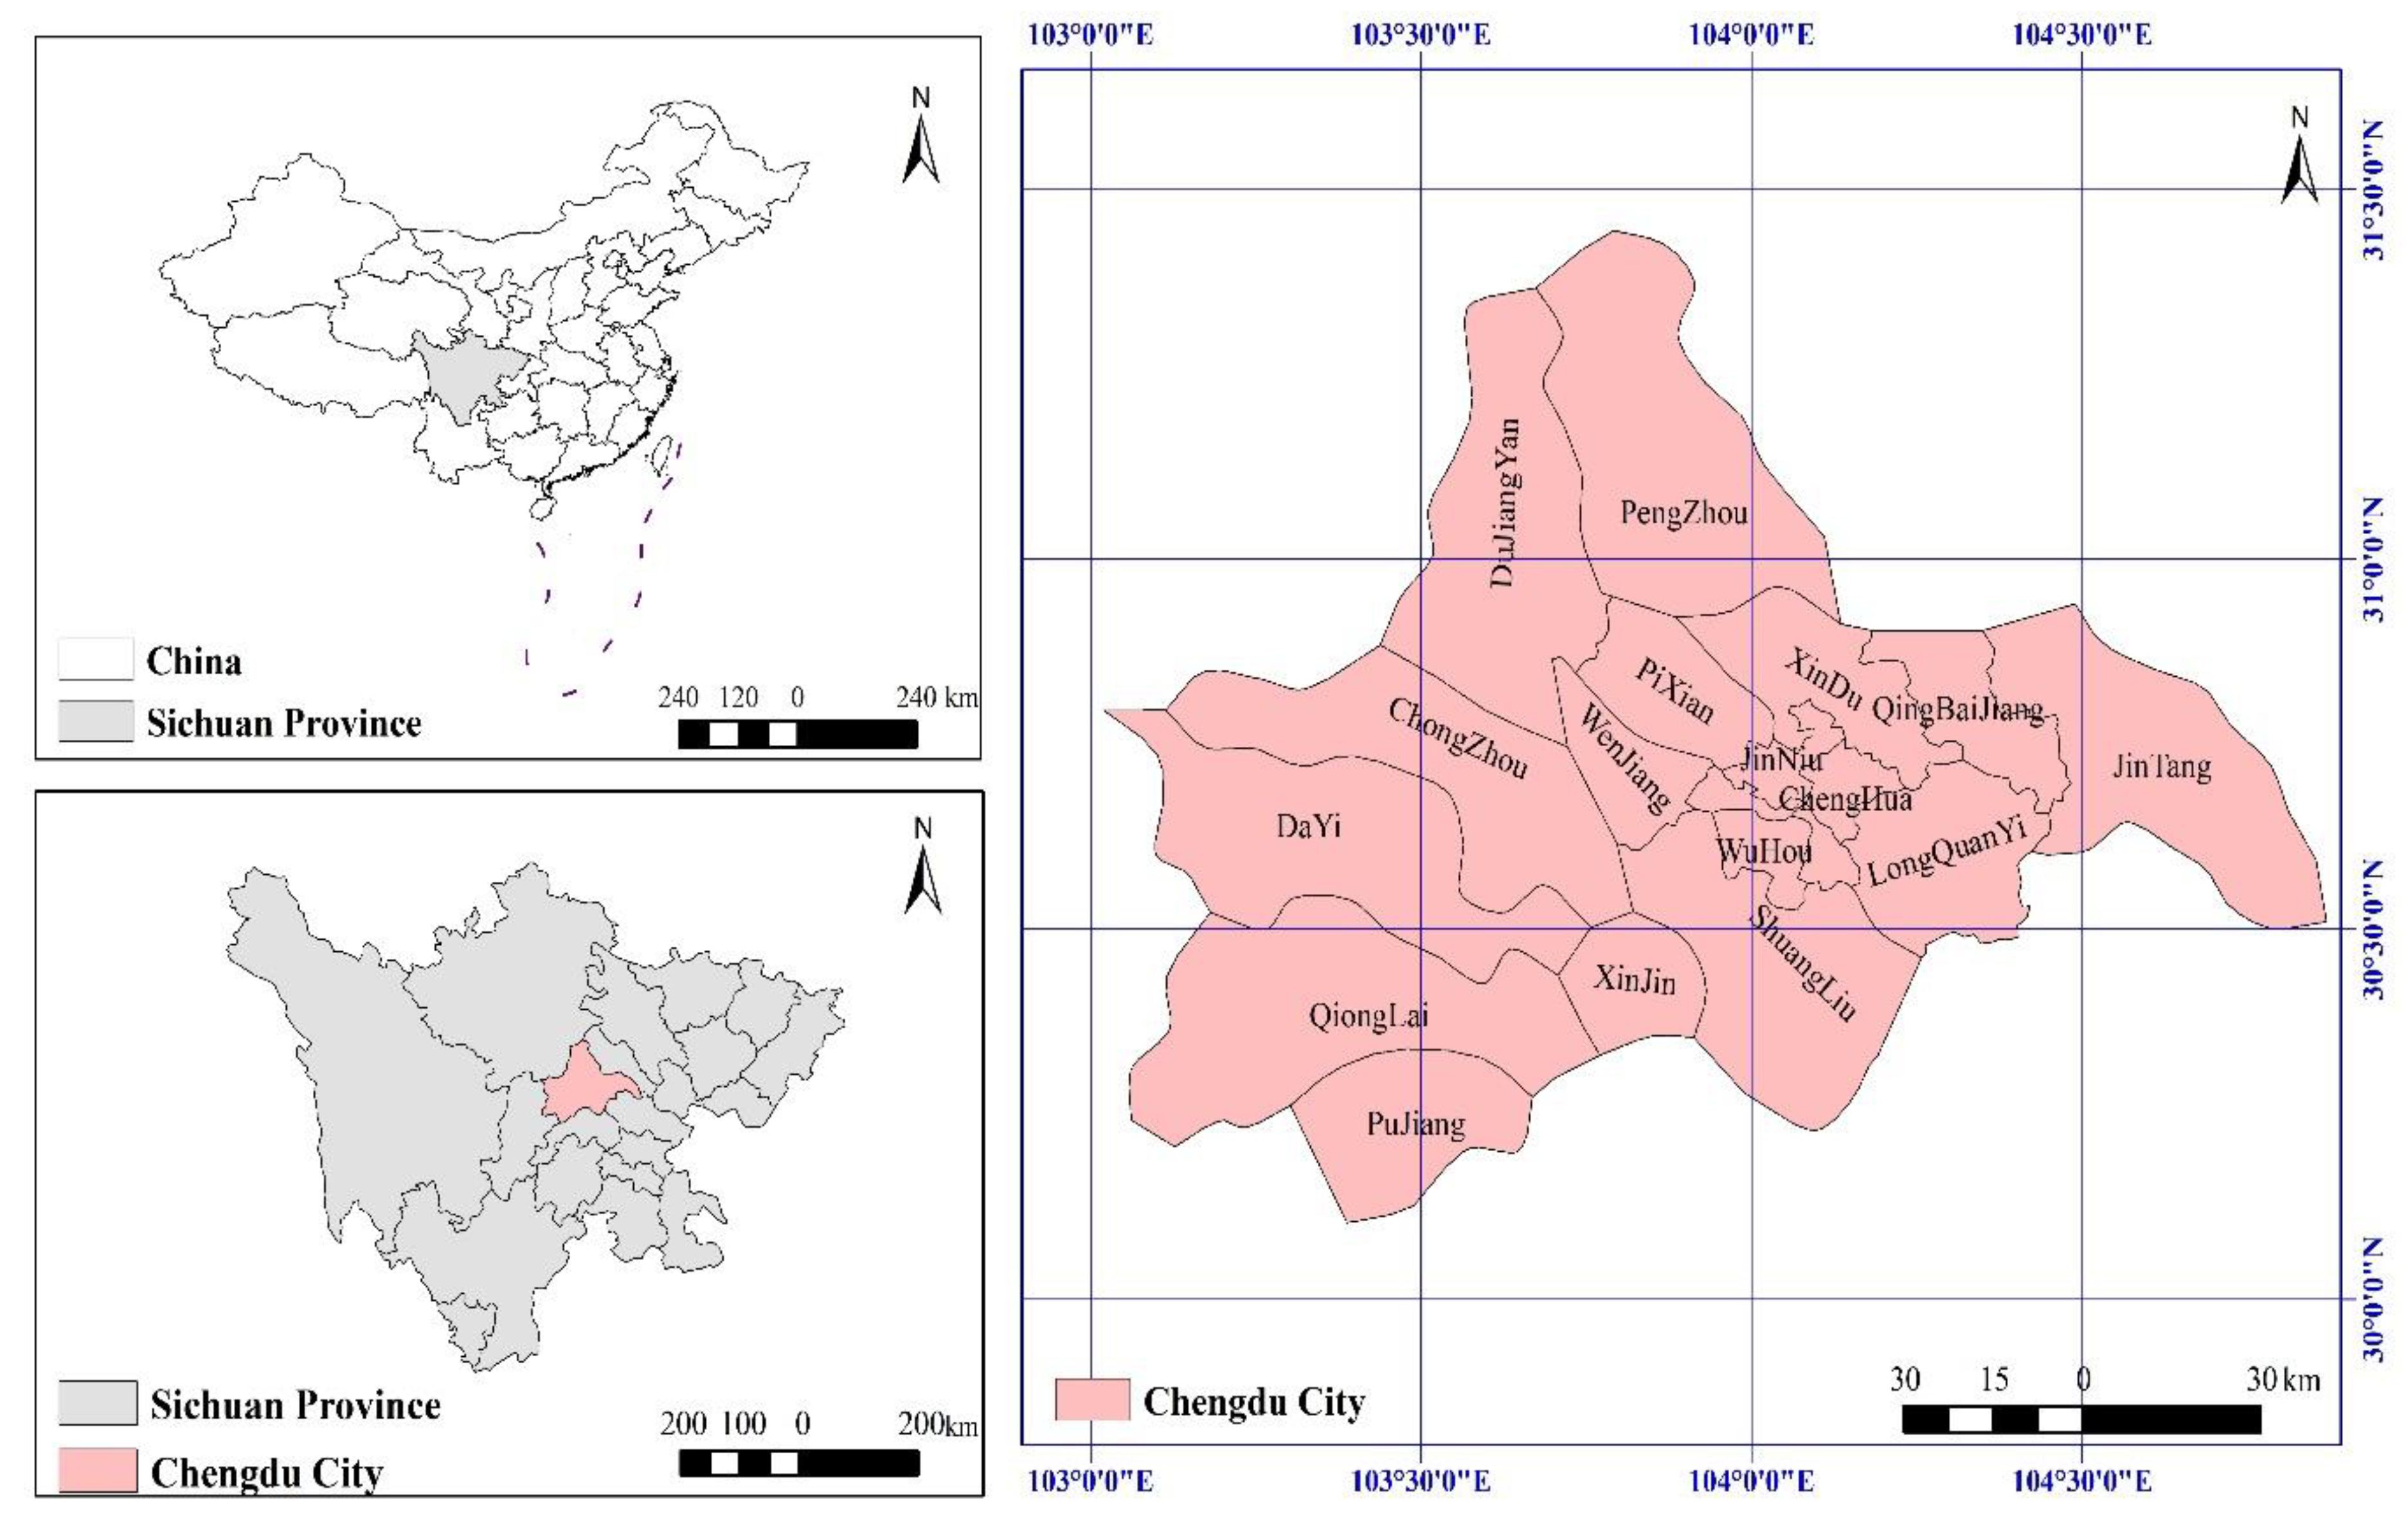
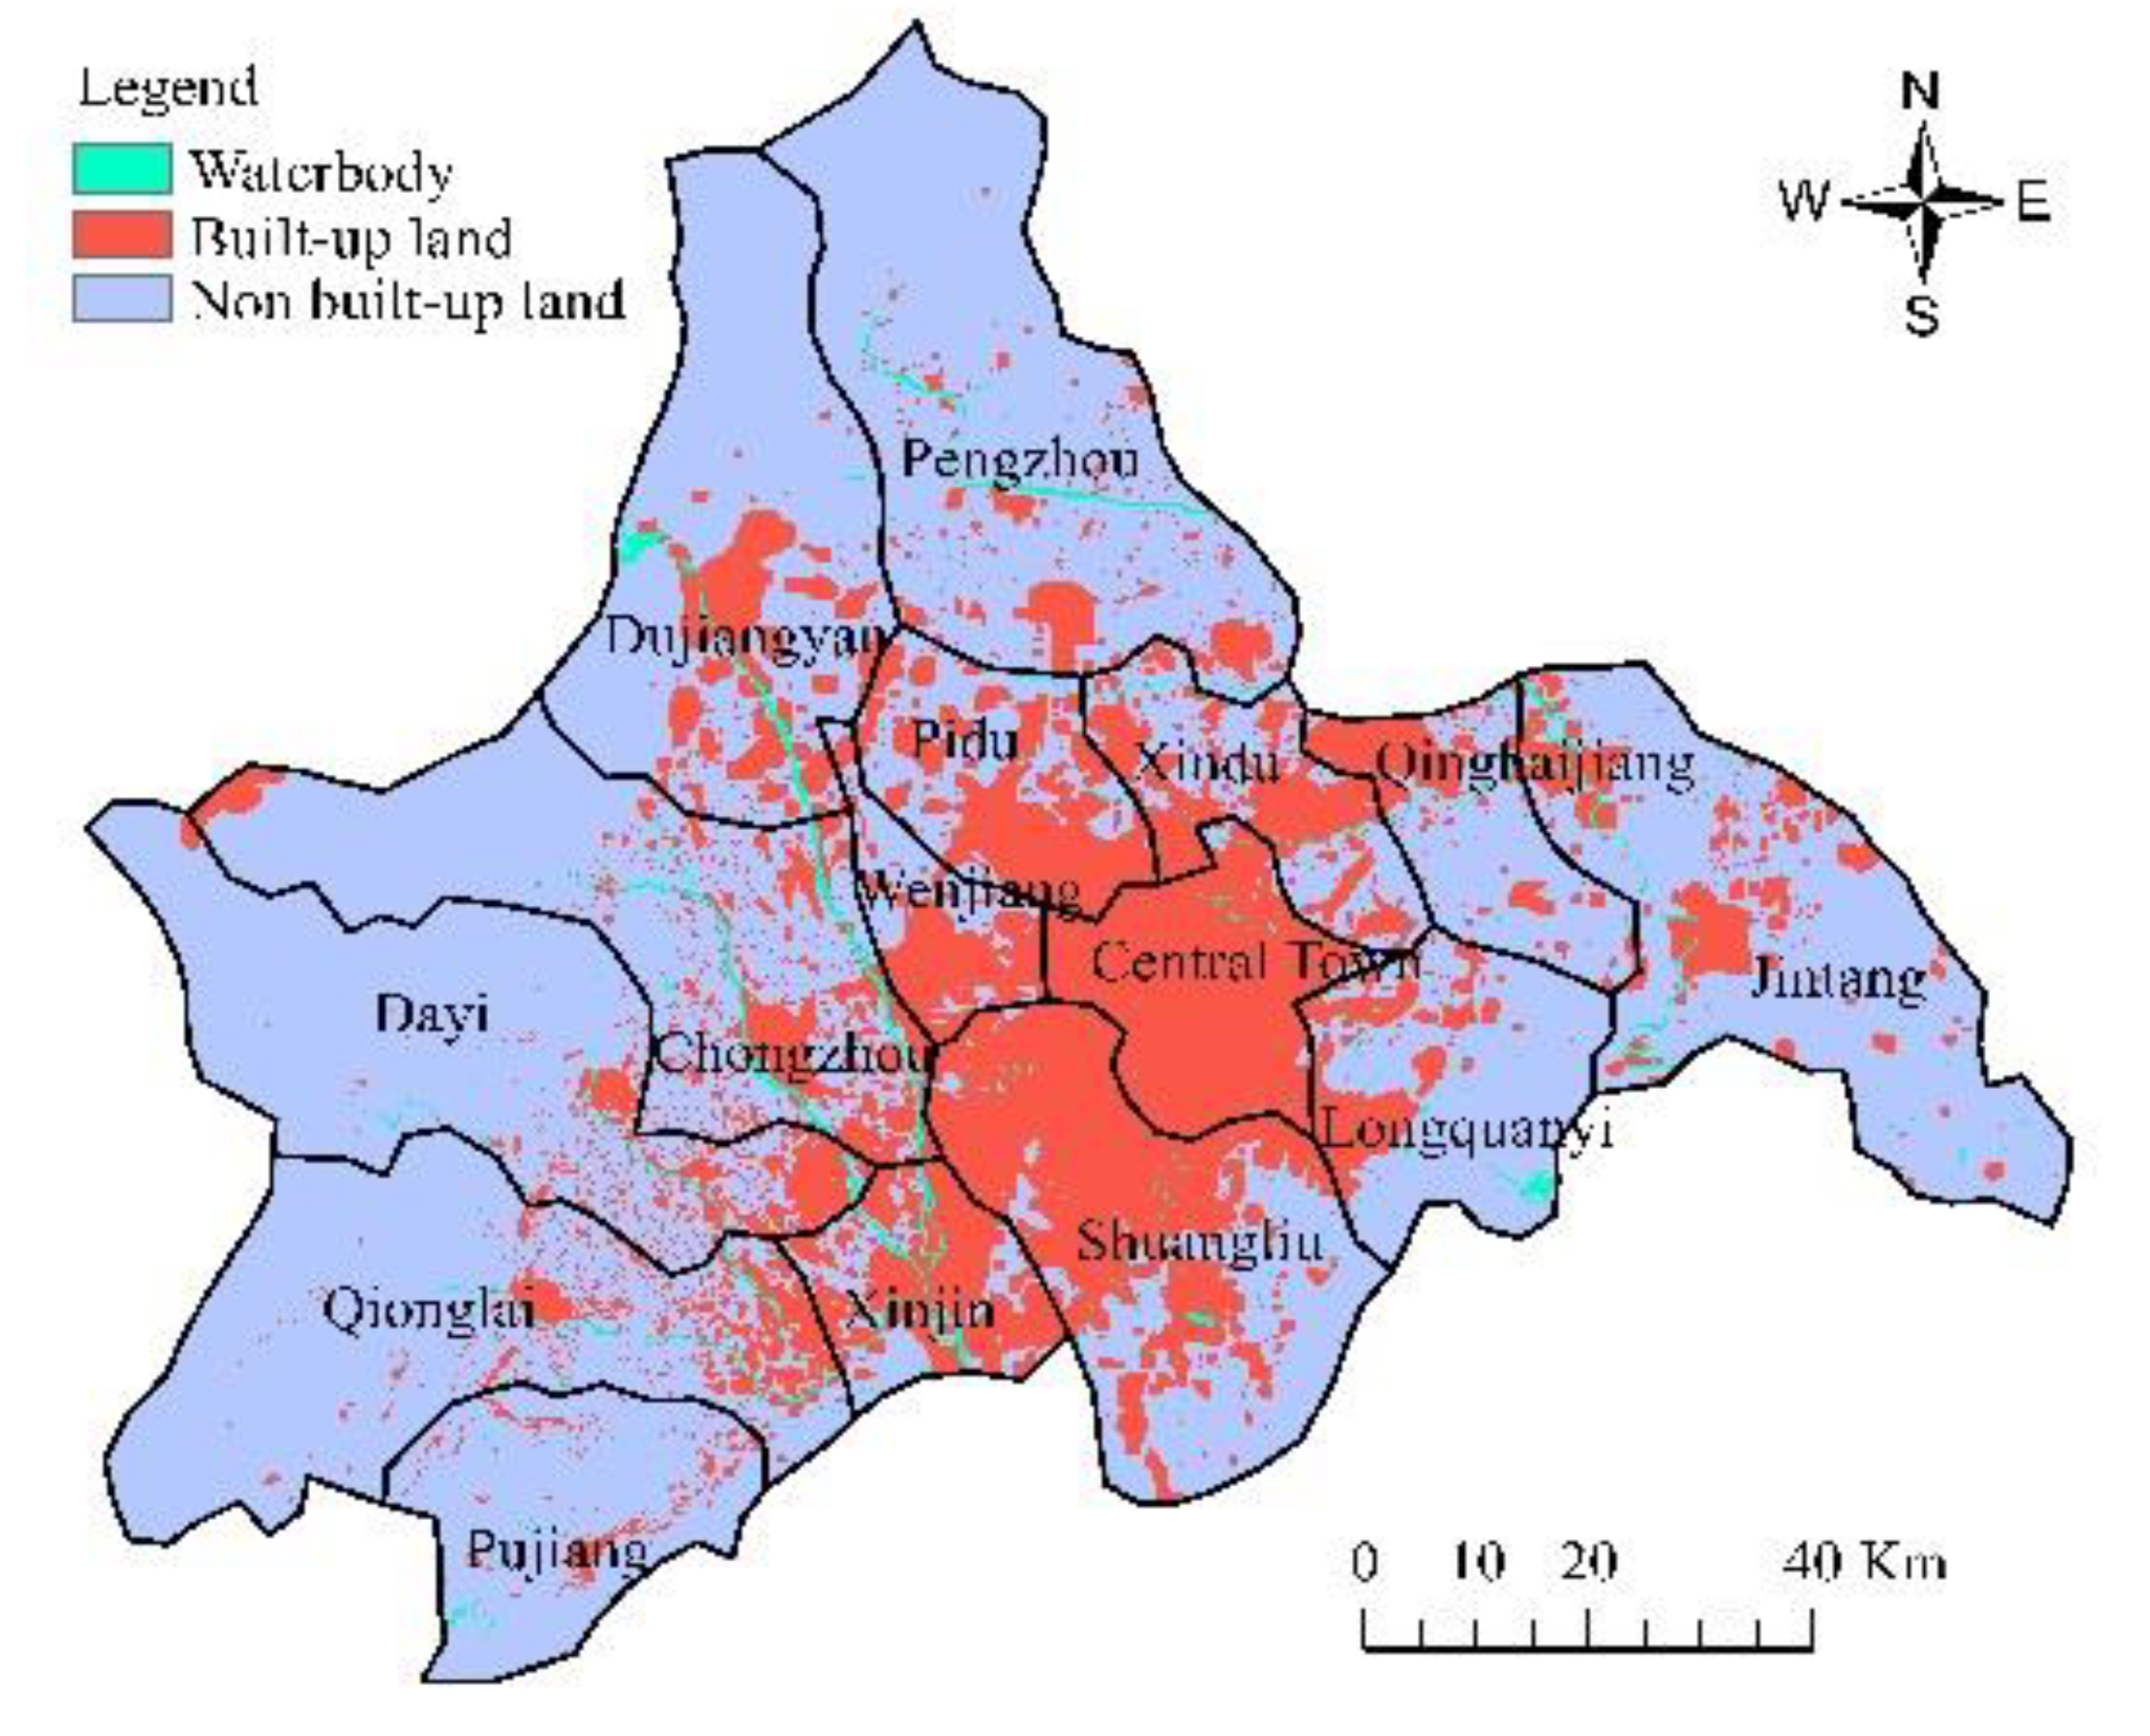
2. Study Area
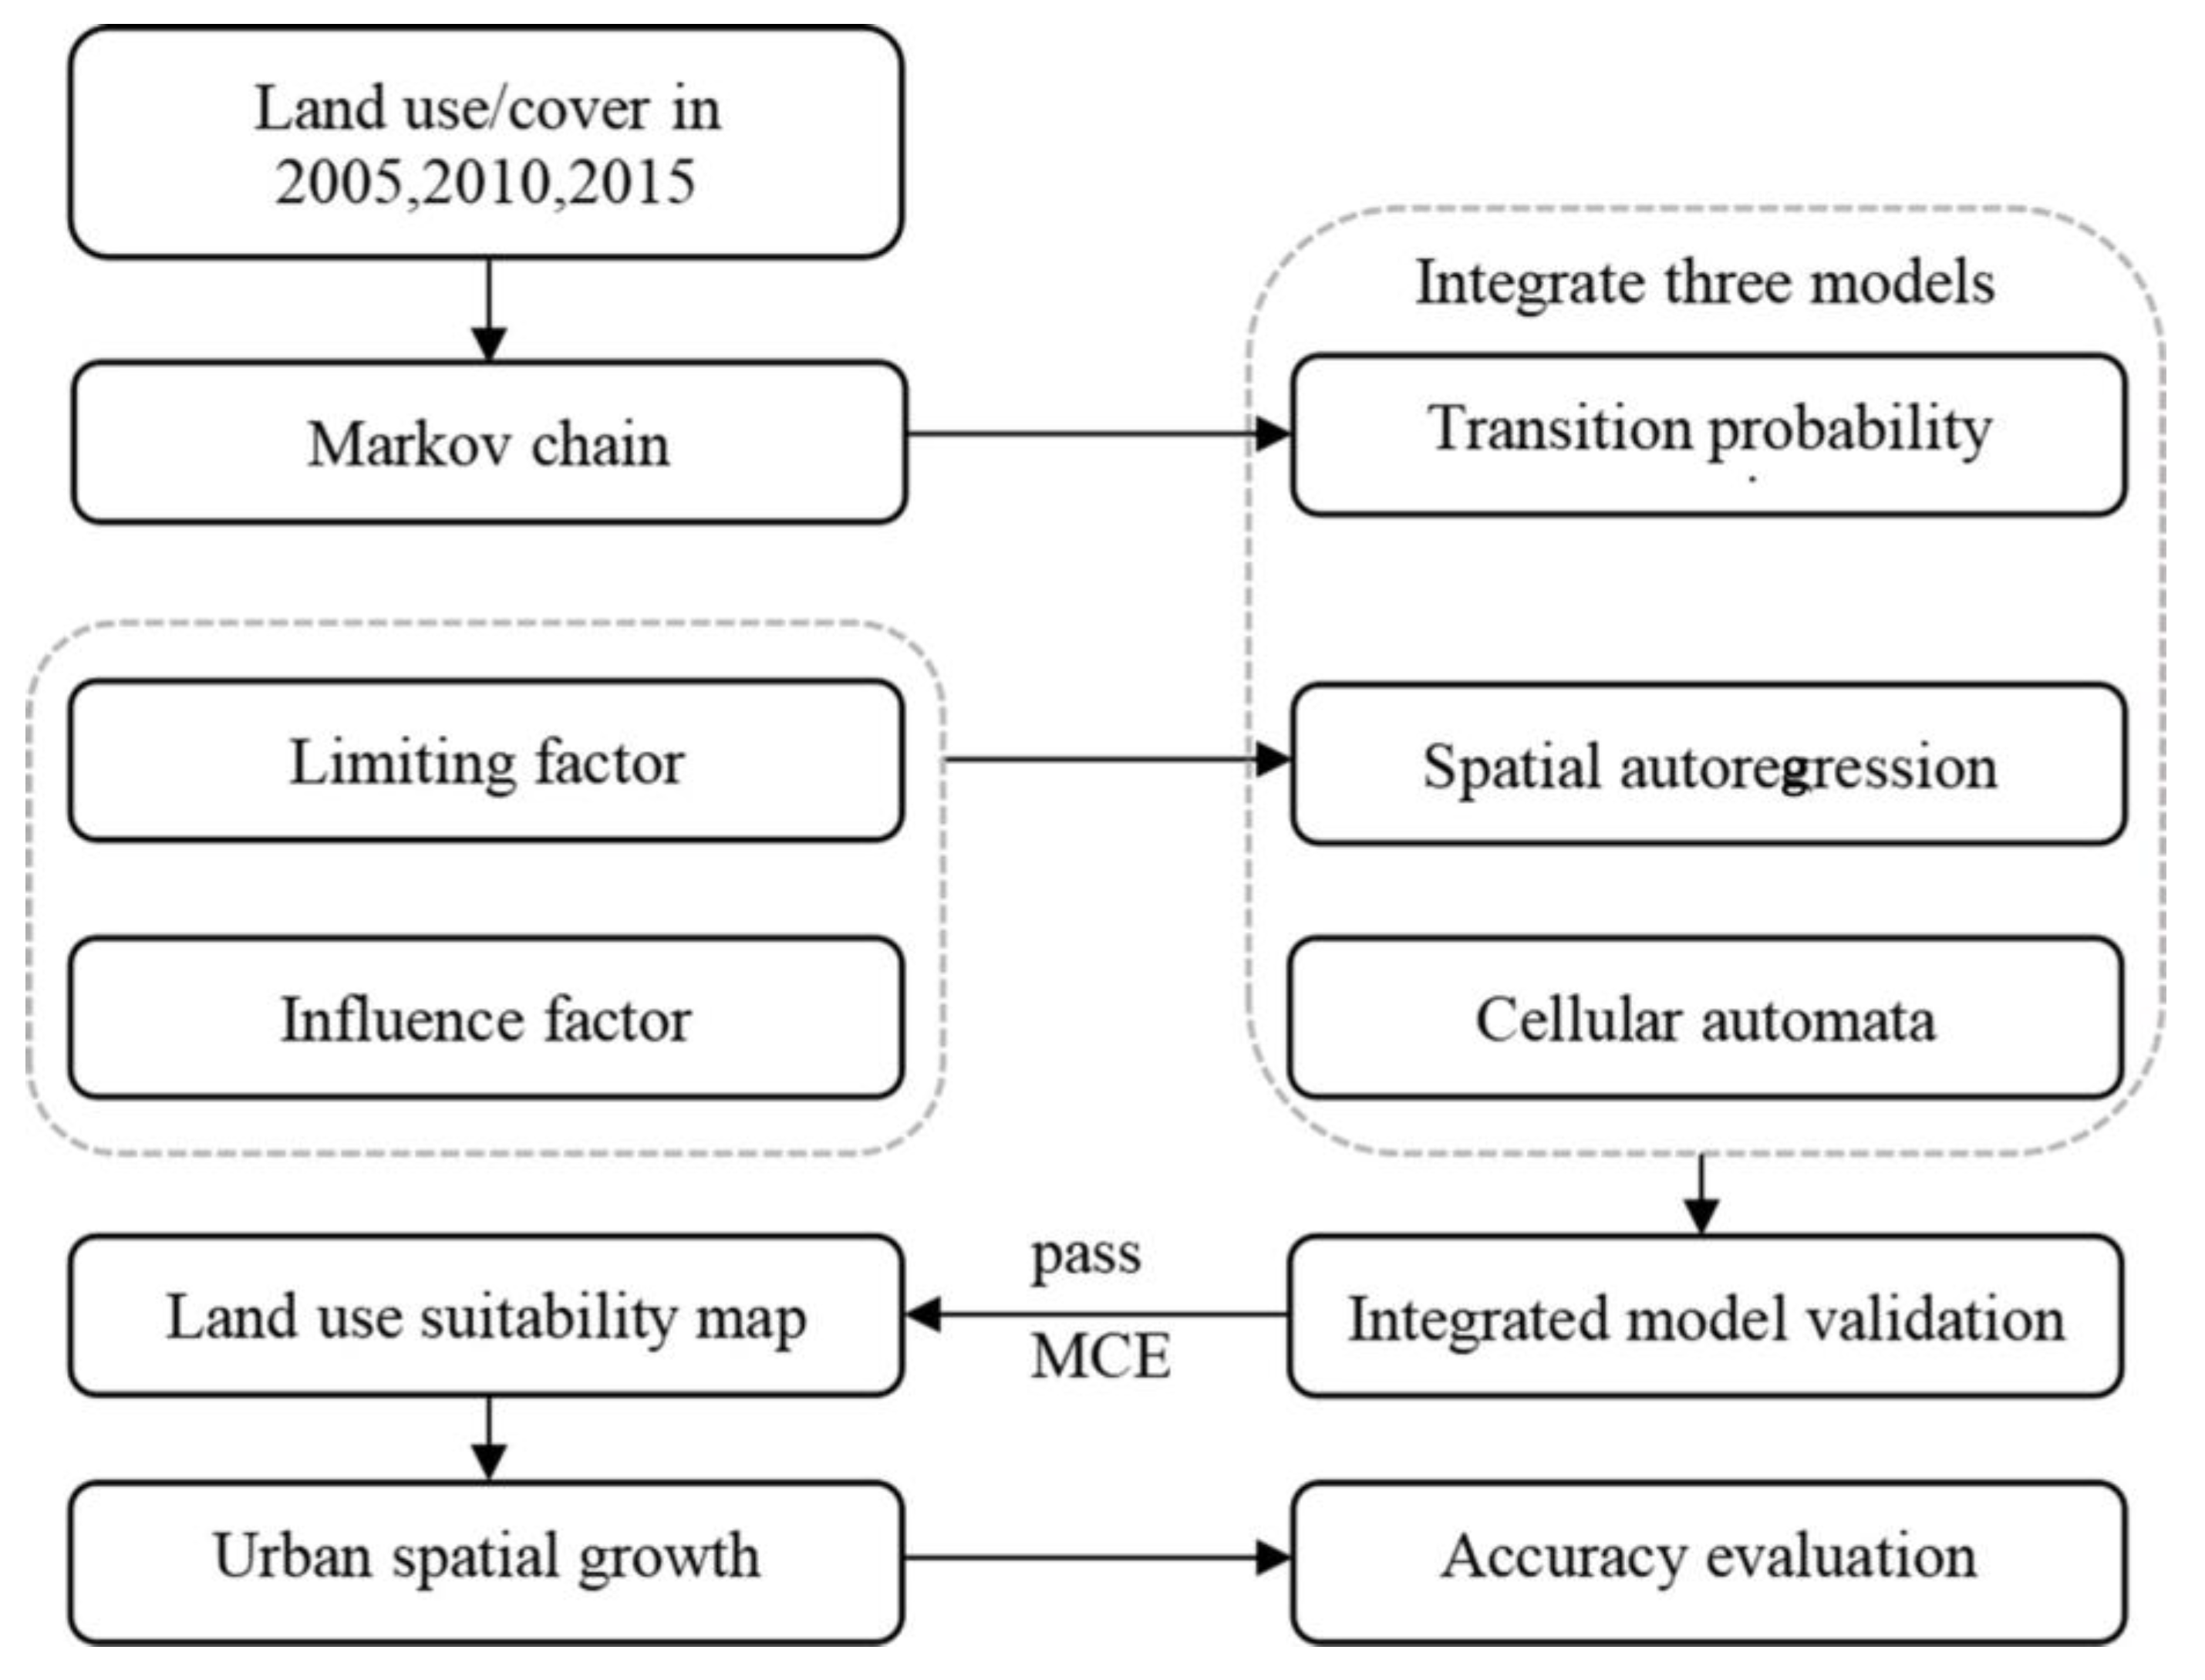
3. Methodology
3.1. Markov Chain
3.2. Neighborhood Influence
3.3. Spatial Autoregressive Model
3.4. Comprehensive Transition Probability
3.5. Methods of Model Evaluation
4. Results
4.1. Transition Rules
4.2. Simulation Based on CA and Markov Chains
5. Discussions
6. Conclusions
Author Contributions
Funding
Institutional Review Board Statement
Informed Consent Statement
Data Availability Statement
Acknowledgments
Conflicts of Interest
References
- Caruso, G.; Cavailhès, J.; Peeters, D.; Thomas, I.; Frankhauser, P.; Vuidel, G. Greener and larger neighbourhoods make cities more sustainable! A 2D urban economics perspective. Comput. Environ. Urban Syst. 2015, 54, 82–94. [Google Scholar] [CrossRef]
- Barbier, E.B. Long run agricultural land expansion, booms and busts. Land Use Policy 2020, 93, 103808. [Google Scholar] [CrossRef]
- Miller, J.R. Biodiversity conservation and the extinction of experience. Trends Ecol. Evol. 2005, 20, 430–434. [Google Scholar] [CrossRef] [PubMed]
- Israel, A.; Wynberg, R. Multifunctional landscapes in a rural, developing country context: Conflicts and synergies in Tshidzivhe, South Africa. Landsc. Res. 2019, 44, 404–417. [Google Scholar] [CrossRef]
- Cabral, I.; Keim, J.; Engelmann, R.; Kraemer, R.; Siebert, J.; Bonn, A. Ecosystem services of allotment and community gardens: A Leipzig, Germany case study. Urban For. Urban Green. 2017, 23, 44–53. [Google Scholar] [CrossRef]
- Teuber, S.; Schmidt, K.; Kuhn, P.; Scholten, T. Engaging with urban green spaces—A comparison of urban and rural allotment gardens in Southwestern Germany. Urban For. Urban Green. 2019, 43, 126381. [Google Scholar] [CrossRef]
- Clarke, L.W.; Jenerette, G.D. Biodiversity and direct ecosystem service regulation in the community gardens of Los Angeles, CA. Landsc. Ecol. 2015, 30, 637–653. [Google Scholar] [CrossRef]
- Vernet, N.; Coste, A. Garden Cities of the 21st Century: A Sustainable Path to Suburban Reform. Urban Plan. 2017, 2, 45–60. [Google Scholar] [CrossRef]
- Fox-Kämper, R.; Wesener, A.; Münderlein, D.; Sondermann, M.; McWilliam, W.; Kirk, N. Urban community gardens: An evaluation of governance approaches and related enablers and barriers at different development stages. Landsc. Urban Plan. 2018, 170, 59–68. [Google Scholar] [CrossRef]
- Bhatti, S.S.; Tripathi, N.K.; Nitivattananon, V.; Rana, I.A.; Mozumder, C. A multi-scale modeling approach for simulating urbanization in a metropolitan region. Habitat Int. 2015, 50, 354–365. [Google Scholar] [CrossRef]
- Madureira, H.; Andresen, T.; Monteiro, A. Green structure and planning evolution in Porto. Urban For. Urban Green. 2011, 10, 141–149. [Google Scholar] [CrossRef]
- Ye, Y.-C.; Kuang, L.-H.; Zhao, X.-M.; Guo, X. Scenario-based simulation of land use in Yingtan (Jiangxi Province, China) using an integrated genetic algorithm-cellular automata-Markov model. Environ. Sci. Pollut. Res. 2020, 27, 30390–30404. [Google Scholar] [CrossRef] [PubMed]
- Guo, H.; Li, B.; Hou, Y.; Sun, T. Cellular Automata Model and Multi-agent Model for the Simulation of Land Use Change: A Review. Prog. Geogr. 2011, 30, 1336–1344. [Google Scholar]
- Evans, T.P.; Kelley, H. Multi-scale analysis of a household level agent-based model of landcover change. J. Environ. Manag. 2004, 72, 57–72. [Google Scholar] [CrossRef] [PubMed]
- Valbuena, D.; Verburg, P.H.; Bregt, A.K. A method to define a typology for agent-based analysis in regional land-use research. Agric. Ecosyst. Environ. 2008, 128, 27–36. [Google Scholar] [CrossRef]
- Mermer, C.; Şengül, H. Addressing potential resource scarcity for boron mineral: A system dynamics perspective. J. Clean. Prod. 2020, 270, 122192. [Google Scholar] [CrossRef]
- Choi, C.H.; Cao, J.; Zhao, F. System Dynamics Modeling of Indium Material Flows under Wide Deployment of Clean Energy Technologies. Resour. Conserv. Recycl. 2016, 114, 59–71. [Google Scholar] [CrossRef]
- Glöser, S.; Soulier, M.; Tercero Espinoza, L.A. Dynamic Analysis of Global Copper Flows. Global Stocks, Postconsumer Material Flows, Recycling Indicators, and Uncertainty Evaluation. Environ. Sci. Technol. 2013, 47, 6564–6572. [Google Scholar] [CrossRef]
- Zuser, A.; Rechberger, H. Considerations of resource availability in technology development strategies: The case study of photovoltaics. Resour. Conserv. Recycl. 2011, 56, 56–65. [Google Scholar] [CrossRef]
- Rui, X.T.; Gu, J.J.; Zhang, J.S.; Zhou, Q.B.; Yang, H.G. Visualized simulation and design method of mechanical system dynamics based on transfer matrix method for multibody systems. Adv. Mech. Eng. 2017, 9, 1687814017714729. [Google Scholar] [CrossRef]
- Swinerd, C.; McNaught, K.R. Design classes for hybrid simulations involving agent-based and system dynamics models. Simul. Model. Pract. Theory 2012, 25, 118–133. [Google Scholar] [CrossRef]
- Galeano, D.A.R.; RodrÍGuez, S.C.B. An Integrated Method of Environmental Analysis and System Dynamics for Management of Mobile Phone Waste in Colombia. J. Clean. Prod. 2020, 279, 123768. [Google Scholar] [CrossRef]
- Yao, L.; Liu, T.; Chen, X.; Mahdi, M.; Ni, J. An integrated method of life-cycle assessment and system dynamics for waste mobile phone management and recycling in China. J. Clean. Prod. 2018, 187, 852–862. [Google Scholar] [CrossRef]
- Peng, K.F.; Jiang, W.G.; Deng, Y.; Liu, Y.H.; Wu, Z.F.; Chen, Z. Simulating wetland changes under different scenarios based on integrating the random forest and CLUE-S models: A case study of Wuhan Urban Agglomeration. Ecol. Indic. 2020, 117, 106671. [Google Scholar] [CrossRef]
- Wu, C.Y.; Chen, B.W.; Huang, X.J.; Wei, Y.H.D. Effect of land-use change and optimization on the ecosystem service values of Jiangsu province, China. Ecol. Indic. 2020, 117, 106507. [Google Scholar] [CrossRef]
- Shi, S.X.; Chang, Y.; Wang, G.D.; Li, Z.; Hu, Y.M.; Liu, M.; Li, Y.H.; Li, B.L.; Zong, M.; Huang, W.T. Planning for the wetland restoration potential based on the viability of the seed bank and the land -use change trajectory in the Sanjiang Plain of China. Sci. Total Environ. 2020, 733, 139208. [Google Scholar] [CrossRef]
- Lamichhane, S.; Shakya, N.M. Integrated Assessment of Climate Change and Land Use Change Impacts on Hydrology in the Kathmandu Valley Watershed, Central Nepal. Water 2019, 11, 2059. [Google Scholar] [CrossRef]
- Li, H.H.; Song, W. Evolution of rural settlements in the Tongzhou District of Beijing under the new-type urbanization policies. Habitat Int. 2020, 101, 102198. [Google Scholar] [CrossRef]
- Tang, L.P.; Ke, X.L.; Zhou, T.; Zheng, W.W.; Wang, L.Y. Impacts of cropland expansion on carbon storage: A case study in Hubei, China. J. Environ. Manag. 2020, 265, 110515. [Google Scholar] [CrossRef]
- Tian, Y.; Huang, Y.; Zhang, Q.; Tao, J.; Zhang, Y.; Zhou, G.; Han, X.; Yang, Y.; Lin, J. Simulation of land cover and biodiversity in Nanliu river basin in Beibu Gulf. China Environ. Sci. 2020, 40, 1320–1334. [Google Scholar]
- Zhu, W.; Gao, Y.; Zhang, H.; Liu, L. Optimization of the land use pattern in Horqin Sandy Land by using the CLUMondo model and Bayesian belief network. Sci. Total Environ. 2020, 739, 139929. [Google Scholar] [CrossRef] [PubMed]
- Li, M.M.; Stein, A.; Bijker, W.; Zhan, Q.M. Urban land use extraction from Very High Resolution remote sensing imagery using a Bayesian network. ISPRS J. Photogramm. Remote Sens. 2016, 122, 192–205. [Google Scholar] [CrossRef]
- Ding, W.J.; Wang, R.Q.; Wu, D.Q.; Liu, J. Cellular automata model as an intuitive approach to simulate complex land-use changes: An evaluation of two multi-state land-use models in the Yellow River Delta. Stoch. Environ. Res. Risk Assess. 2013, 27, 899–907. [Google Scholar] [CrossRef]
- Basse, R.M.; Omrani, H.; Charif, O.; Gerber, P.; Bodis, K. Land use changes modelling using advanced methods: Cellular automata and artificial neural networks. The spatial and explicit representation of land cover dynamics at the cross-border region scale. Appl. Geogr. 2014, 53, 160–171. [Google Scholar] [CrossRef]
- Feng, Y.; Yang, Q.; Cui, L.; Liu, Y. Simulation and Prediction of Urban Land Use Change with Spatial Autoregressive Model Based Cellular Automata. Geogr. Geo-Inf. Sci. 2016, 32, 37–44. [Google Scholar]
- Roodposhti, M.S.; Aryal, J.; Bryan, B.A. A novel algorithm for calculating transition potential in cellular automata models of land-use/cover change. Environ. Model. Softw. 2019, 112, 70–81. [Google Scholar] [CrossRef]
- Tobler, W.R. A Computer Movie Simulating Urban Growth in the Detroit Region. Econ. Geogr. 1970, 46, 234–240. [Google Scholar] [CrossRef]
- Azadi, H.; Barati, A.A.; Rafiaani, P.; Taheri, F.; Gebrehiwot, K.; Witlox, F.; Lebailly, P. Evolution of land use-change modeling: Routes of different schools of knowledge. Landsc. Ecol. Eng. 2017, 13, 319–332. [Google Scholar] [CrossRef]
- Liu, X.; Ou, J.; Li, X.; Ai, B. Combining system dynamics and hybrid particle swarm optimization for land use allocation. Ecol. Model. 2013, 257, 11–24. [Google Scholar] [CrossRef]
- Ma, S.; Ai, B.; Nian, P. Pre-assessment and Warning of Land Use Planning with Constrained Cellular Automata. Geogr. Geo-Inf. Sci. 2014, 30, 51–55. [Google Scholar]
- Barros, K.D.; Ribeiro, C.; Marcatti, G.E.; Lorenzon, A.S.; de Castro, N.L.M.; Domingues, G.F.; de Carvalho, J.R.; dos Santos, A.R. Markov chains and cellular automata to predict environments subject to desertification. J. Environ. Manag. 2018, 225, 160–167. [Google Scholar] [CrossRef] [PubMed]
- Rahman, M.T.U.; Tabassum, F.; Rasheduzzaman, M.; Saba, H.; Sarkar, L.; Ferdous, J.; Uddin, S.Z.; Islam, A.Z.M.Z. Temporal dynamics of land use/land cover change and its prediction using CA-ANN model for southwestern coastal Bangladesh. Environ. Monit. Assess. 2017, 189, 1–18. [Google Scholar] [CrossRef] [PubMed]
- Omrani, H.; Tayyebi, A.; Pijanowski, B. Integrating the multi-label land-use concept and cellular automata with the artificial neural network-based Land Transformation Model: An integrated ML-CA-LTM modeling framework. GIScience Remote Sens. 2017, 54, 283–304. [Google Scholar] [CrossRef]
- Tayyebi, A.; Pijanowski, B.C.; Pekin, B. Two rule-based Urban Growth Boundary Models applied to the Tehran Metropolitan Area, Iran. Appl. Geogr. 2011, 31, 908–918. [Google Scholar] [CrossRef]
- Fu, X.; Wang, X.; Yang, Y.J. Deriving suitability factors for CA-Markov land use simulation model based on local historical data. J. Environ. Manag. 2018, 206, 10–19. [Google Scholar] [CrossRef] [PubMed]
- Qian, Y.; Xing, W.; Guan, X.; Yang, T.; Wu, H. Coupling cellular automata with area partitioning and spatiotemporal convolution for dynamic land use change simulation. Sci. Total Environ. 2020, 722, 137738. [Google Scholar] [CrossRef] [PubMed]
- Zhou, X.C.; Fu, W.N. A Multi-Agent Simulation Method of Urban Land Layout Structure Based on FPGA. Mob. Netw. Appl. 2020, 25, 1572–1581. [Google Scholar] [CrossRef]
- Feng, Y.; Tong, X. Dynamic land use change simulation using cellular automata with spatially nonstationary transition rules. GIScience Remote Sens. 2018, 55, 678–698. [Google Scholar] [CrossRef]
- Cliff, A.D.; Ord, J.K. Spatial Processes: Models & Applications. Q. Rev. Biol. 1982, 82, 1–20. [Google Scholar]
- Shi, B.; Hu, G.; Henry, H.A.L.; Stover, H.J.; Sun, W.; Xu, W.; Wang, C.; Fu, X.; Liu, Z. Temporal changes in the spatial variability of soil respiration in a meadow steppe: The role of abiotic and biotic factors. Agric. For. Meteorol. 2020, 287, 107958. [Google Scholar] [CrossRef]
- National Bureau of Statistics of China. Chengdu Statistical Yearbook; China Statistics Press: Beijing, China, 2016. [Google Scholar]
- Dufa, G. Pridiction of Land Use and Land Cover Patterns in Recent Yellow River Delta Using Markov Chain Model. Soils 2006, 38, 42–47. [Google Scholar]
- Feng, Y.; Tong, H. Development and Application of Geographical Cellular Automata Modelling Framework Based on GIS. Geogr. Geo-Inf. Sci. 2010, 26, 41–43. [Google Scholar]
- Xiao, X.; Li, Y.; Zhu, X. Markov Model Based On Driving Forces of Land Use Change and Its Application. Soils 2011, 43, 822–827. [Google Scholar]
- Landis, J.R.; Koch, G.G. The measurement of observer agreement for data by categorical data. Biometrics 1977, 33, 159–174. [Google Scholar] [CrossRef]
- Guiping, W.; Yongnian, Z.; Bin, Z.O.U.; Qingchao, Q.I.; Song, Y. Simulation on Spatial Land Use Patterns Using AutoLogistic Method: A Case Study of Yongding County, Zhangjiajie. Acta Geogr. Sin. 2008, 63, 156–164. [Google Scholar]
- Liu, X.; Li, X.; Shi, X.; Huang, K.; Liu, Y. A multi-type ant colony optimization (MACO) method for optimal land use allocation in large areas. Int. J. Geogr. Inf. Sci. 2012, 26, 1325–1343. [Google Scholar] [CrossRef]
- Song, E.; Won, S.; Lee, W. Using the corrected Akaike’s information criterion for model selection. Korean J. Appl. Stat. 2017, 30, 119–133. [Google Scholar] [CrossRef]
- Liu, P.J.; Hu, Y.C.; Jia, W.T. Land use optimization research based on FLUS model and ecosystem services-setting Jinan City as an example. Urban CLim. 2021, 40, 13. [Google Scholar] [CrossRef]


| Model | Residuals’ Descriptive Statistics | Residuals’ Space Autocorrelation | ||
|---|---|---|---|---|
| Average Value | Sum of Squares | Moran’s I | p-Value | |
| SAR | −4 × 10⁻⁸ | 2797.8751 | 0.0225 | 0.3087 |
| Dcenter | Droads | Drailways | Dwater | GDP | Population | Slope | ||
|---|---|---|---|---|---|---|---|---|
| 0.9125 | 16.3855 | 2.7102 | 10.2794 | −7.1392 | −16.5288 | 10.5513 | 14.2627 | 14.4775 |
Publisher’s Note: MDPI stays neutral with regard to jurisdictional claims in published maps and institutional affiliations. |
© 2022 by the authors. Licensee MDPI, Basel, Switzerland. This article is an open access article distributed under the terms and conditions of the Creative Commons Attribution (CC BY) license (https://creativecommons.org/licenses/by/4.0/).
Share and Cite
Qiu, B.; Zhou, M.; Qiu, Y.; Liu, S.; Ou, G.; Ma, C.; Tu, J.; Li, S. An Integrated Spatial Autoregressive Model for Analyzing and Simulating Urban Spatial Growth in a Garden City, China. Int. J. Environ. Res. Public Health 2022, 19, 11732. https://doi.org/10.3390/ijerph191811732
Qiu B, Zhou M, Qiu Y, Liu S, Ou G, Ma C, Tu J, Li S. An Integrated Spatial Autoregressive Model for Analyzing and Simulating Urban Spatial Growth in a Garden City, China. International Journal of Environmental Research and Public Health. 2022; 19(18):11732. https://doi.org/10.3390/ijerph191811732
Chicago/Turabian StyleQiu, Bingkui, Min Zhou, Yang Qiu, Shuhan Liu, Guoliang Ou, Chaonan Ma, Jiating Tu, and Siqi Li. 2022. "An Integrated Spatial Autoregressive Model for Analyzing and Simulating Urban Spatial Growth in a Garden City, China" International Journal of Environmental Research and Public Health 19, no. 18: 11732. https://doi.org/10.3390/ijerph191811732
APA StyleQiu, B., Zhou, M., Qiu, Y., Liu, S., Ou, G., Ma, C., Tu, J., & Li, S. (2022). An Integrated Spatial Autoregressive Model for Analyzing and Simulating Urban Spatial Growth in a Garden City, China. International Journal of Environmental Research and Public Health, 19(18), 11732. https://doi.org/10.3390/ijerph191811732