Spatial Differences of Ecological Well-Being Performance in the Poyang Lake Area at the Local Level
Abstract
:1. Introduction
2. Literature Review
3. Materials and Methods
3.1. Materials
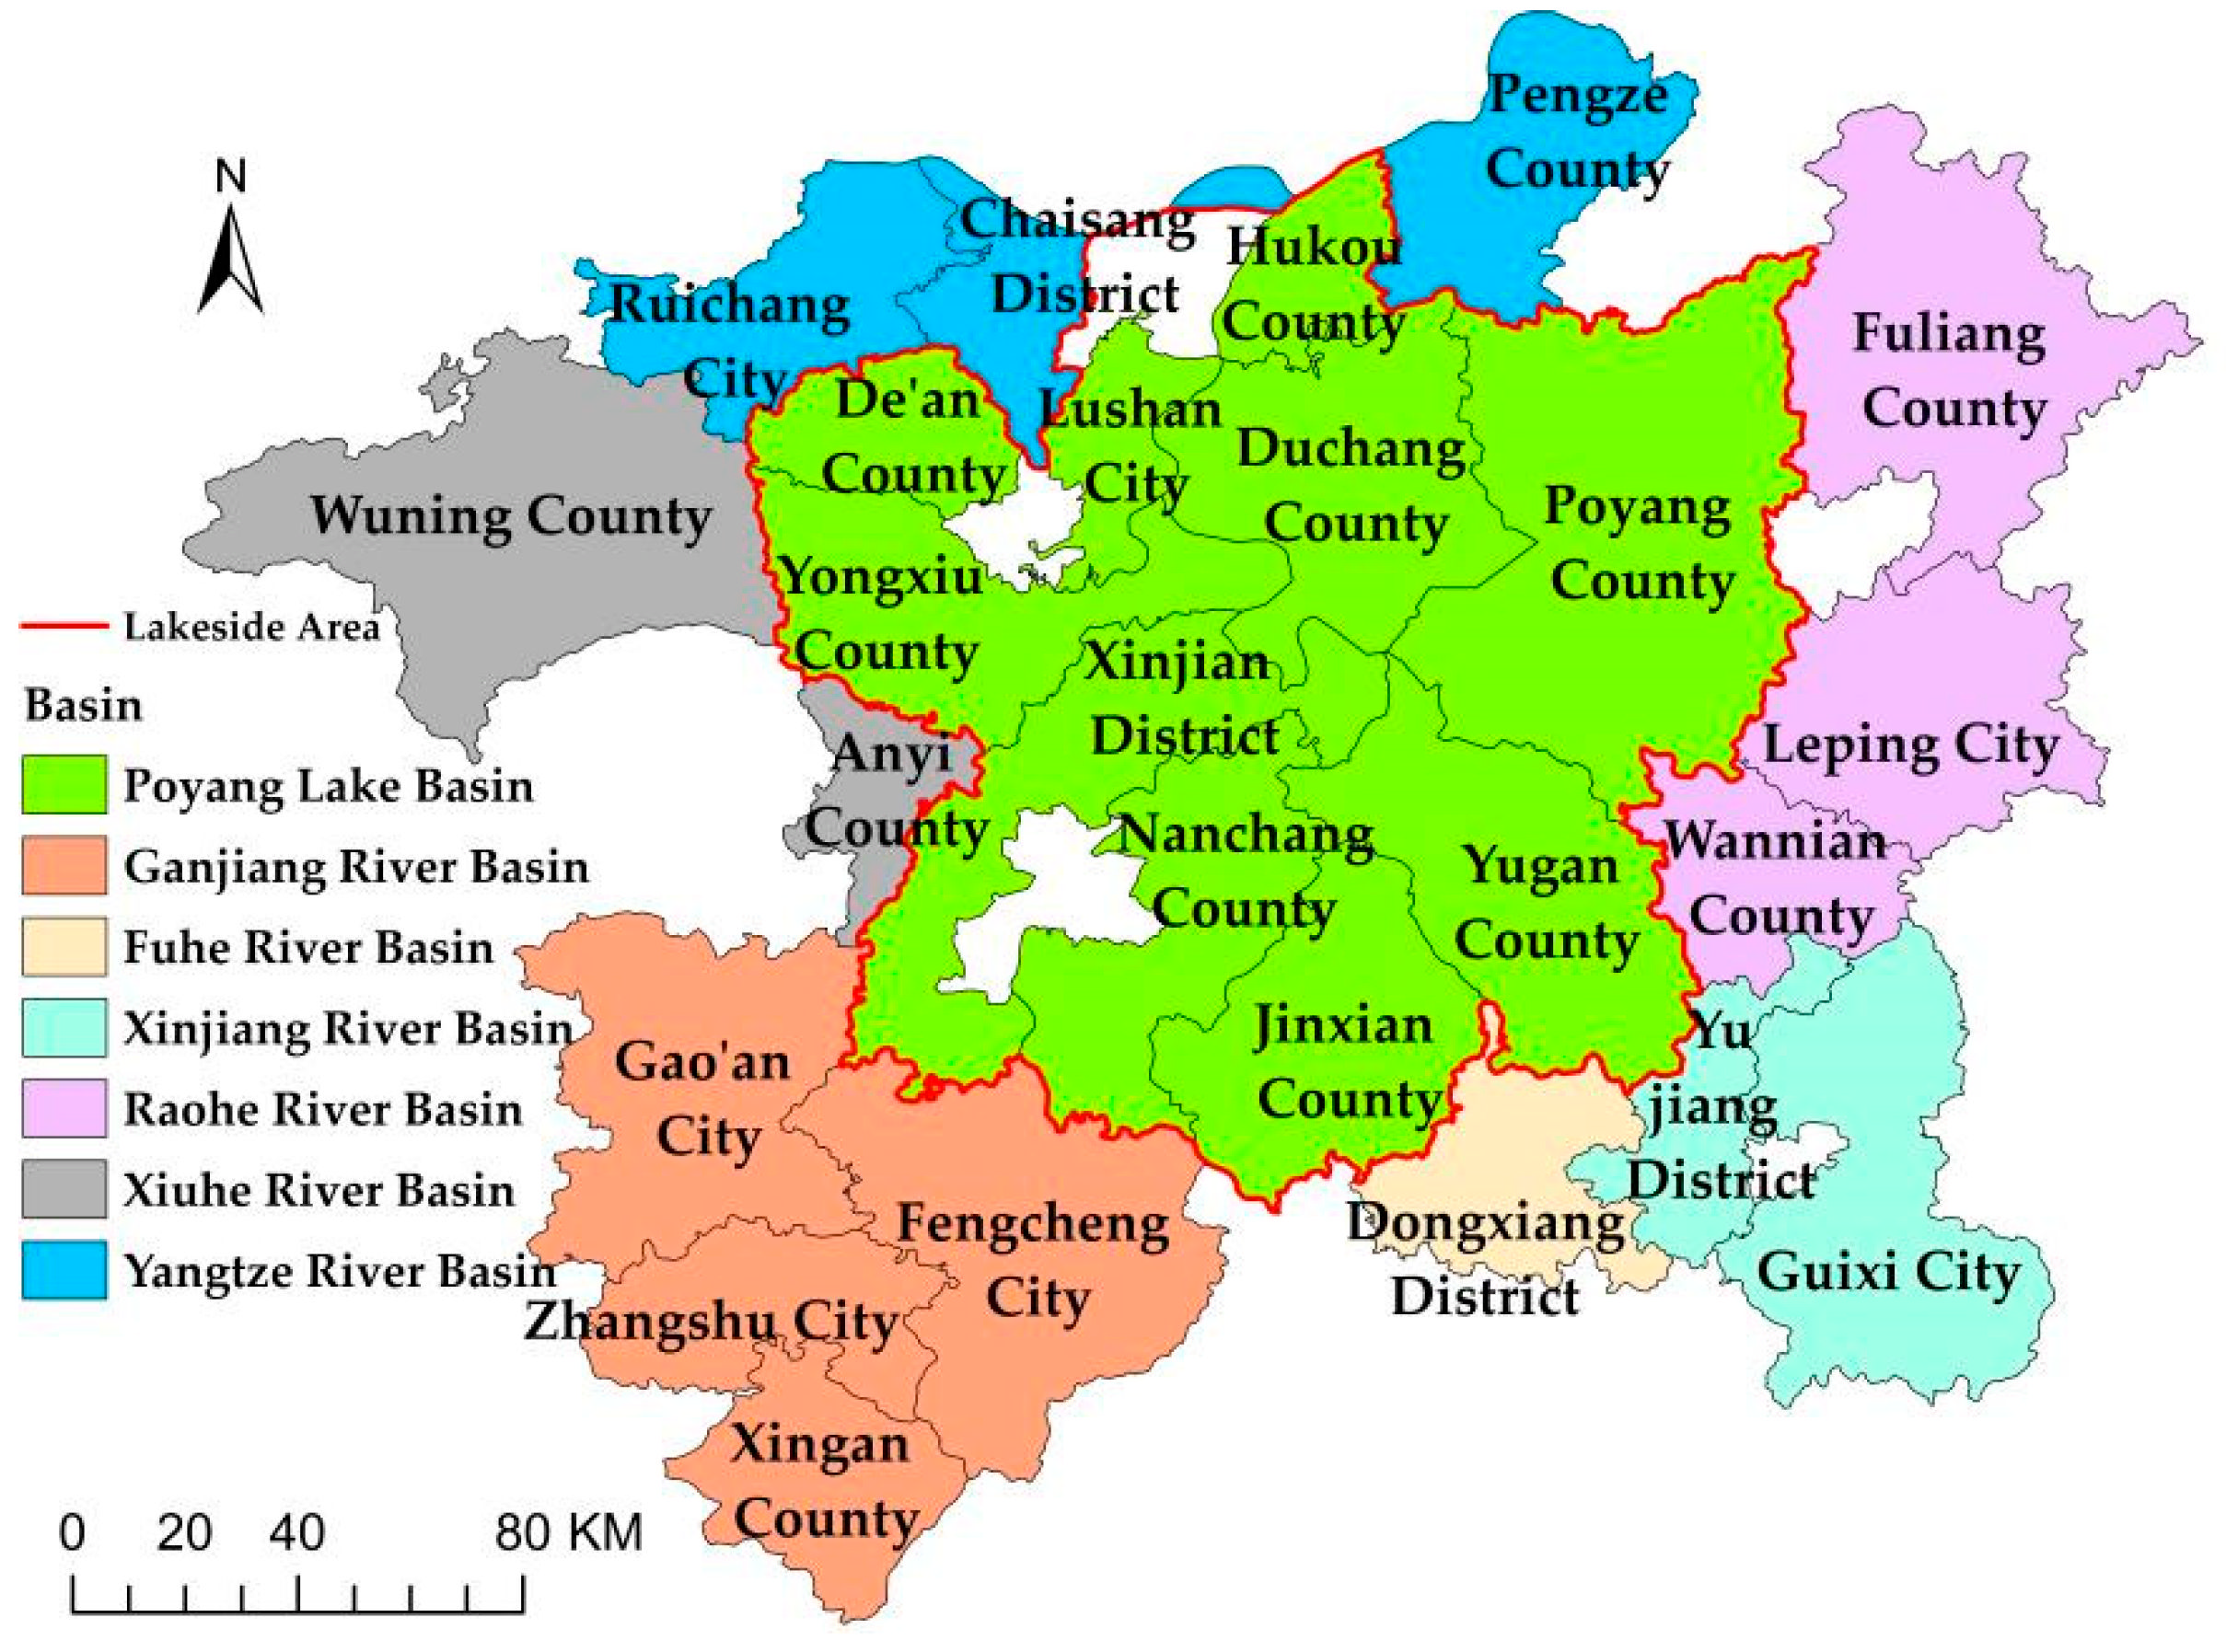
3.1.1. Division of Regions
3.1.2. EWP Analysis Framework and Indicator Selection
3.1.3. Data Sources
3.2. Methods
3.2.1. EWP Evaluation Model: Two-Stage Super-NSBM Model and DEA Window Analysis
3.2.2. Spatial Differences Measurement: Dagum Gini Coefficient Decomposition
4. Results
4.1. Spatial and Temporal Pattern Evolution of EWP in the Poyang Lake Area
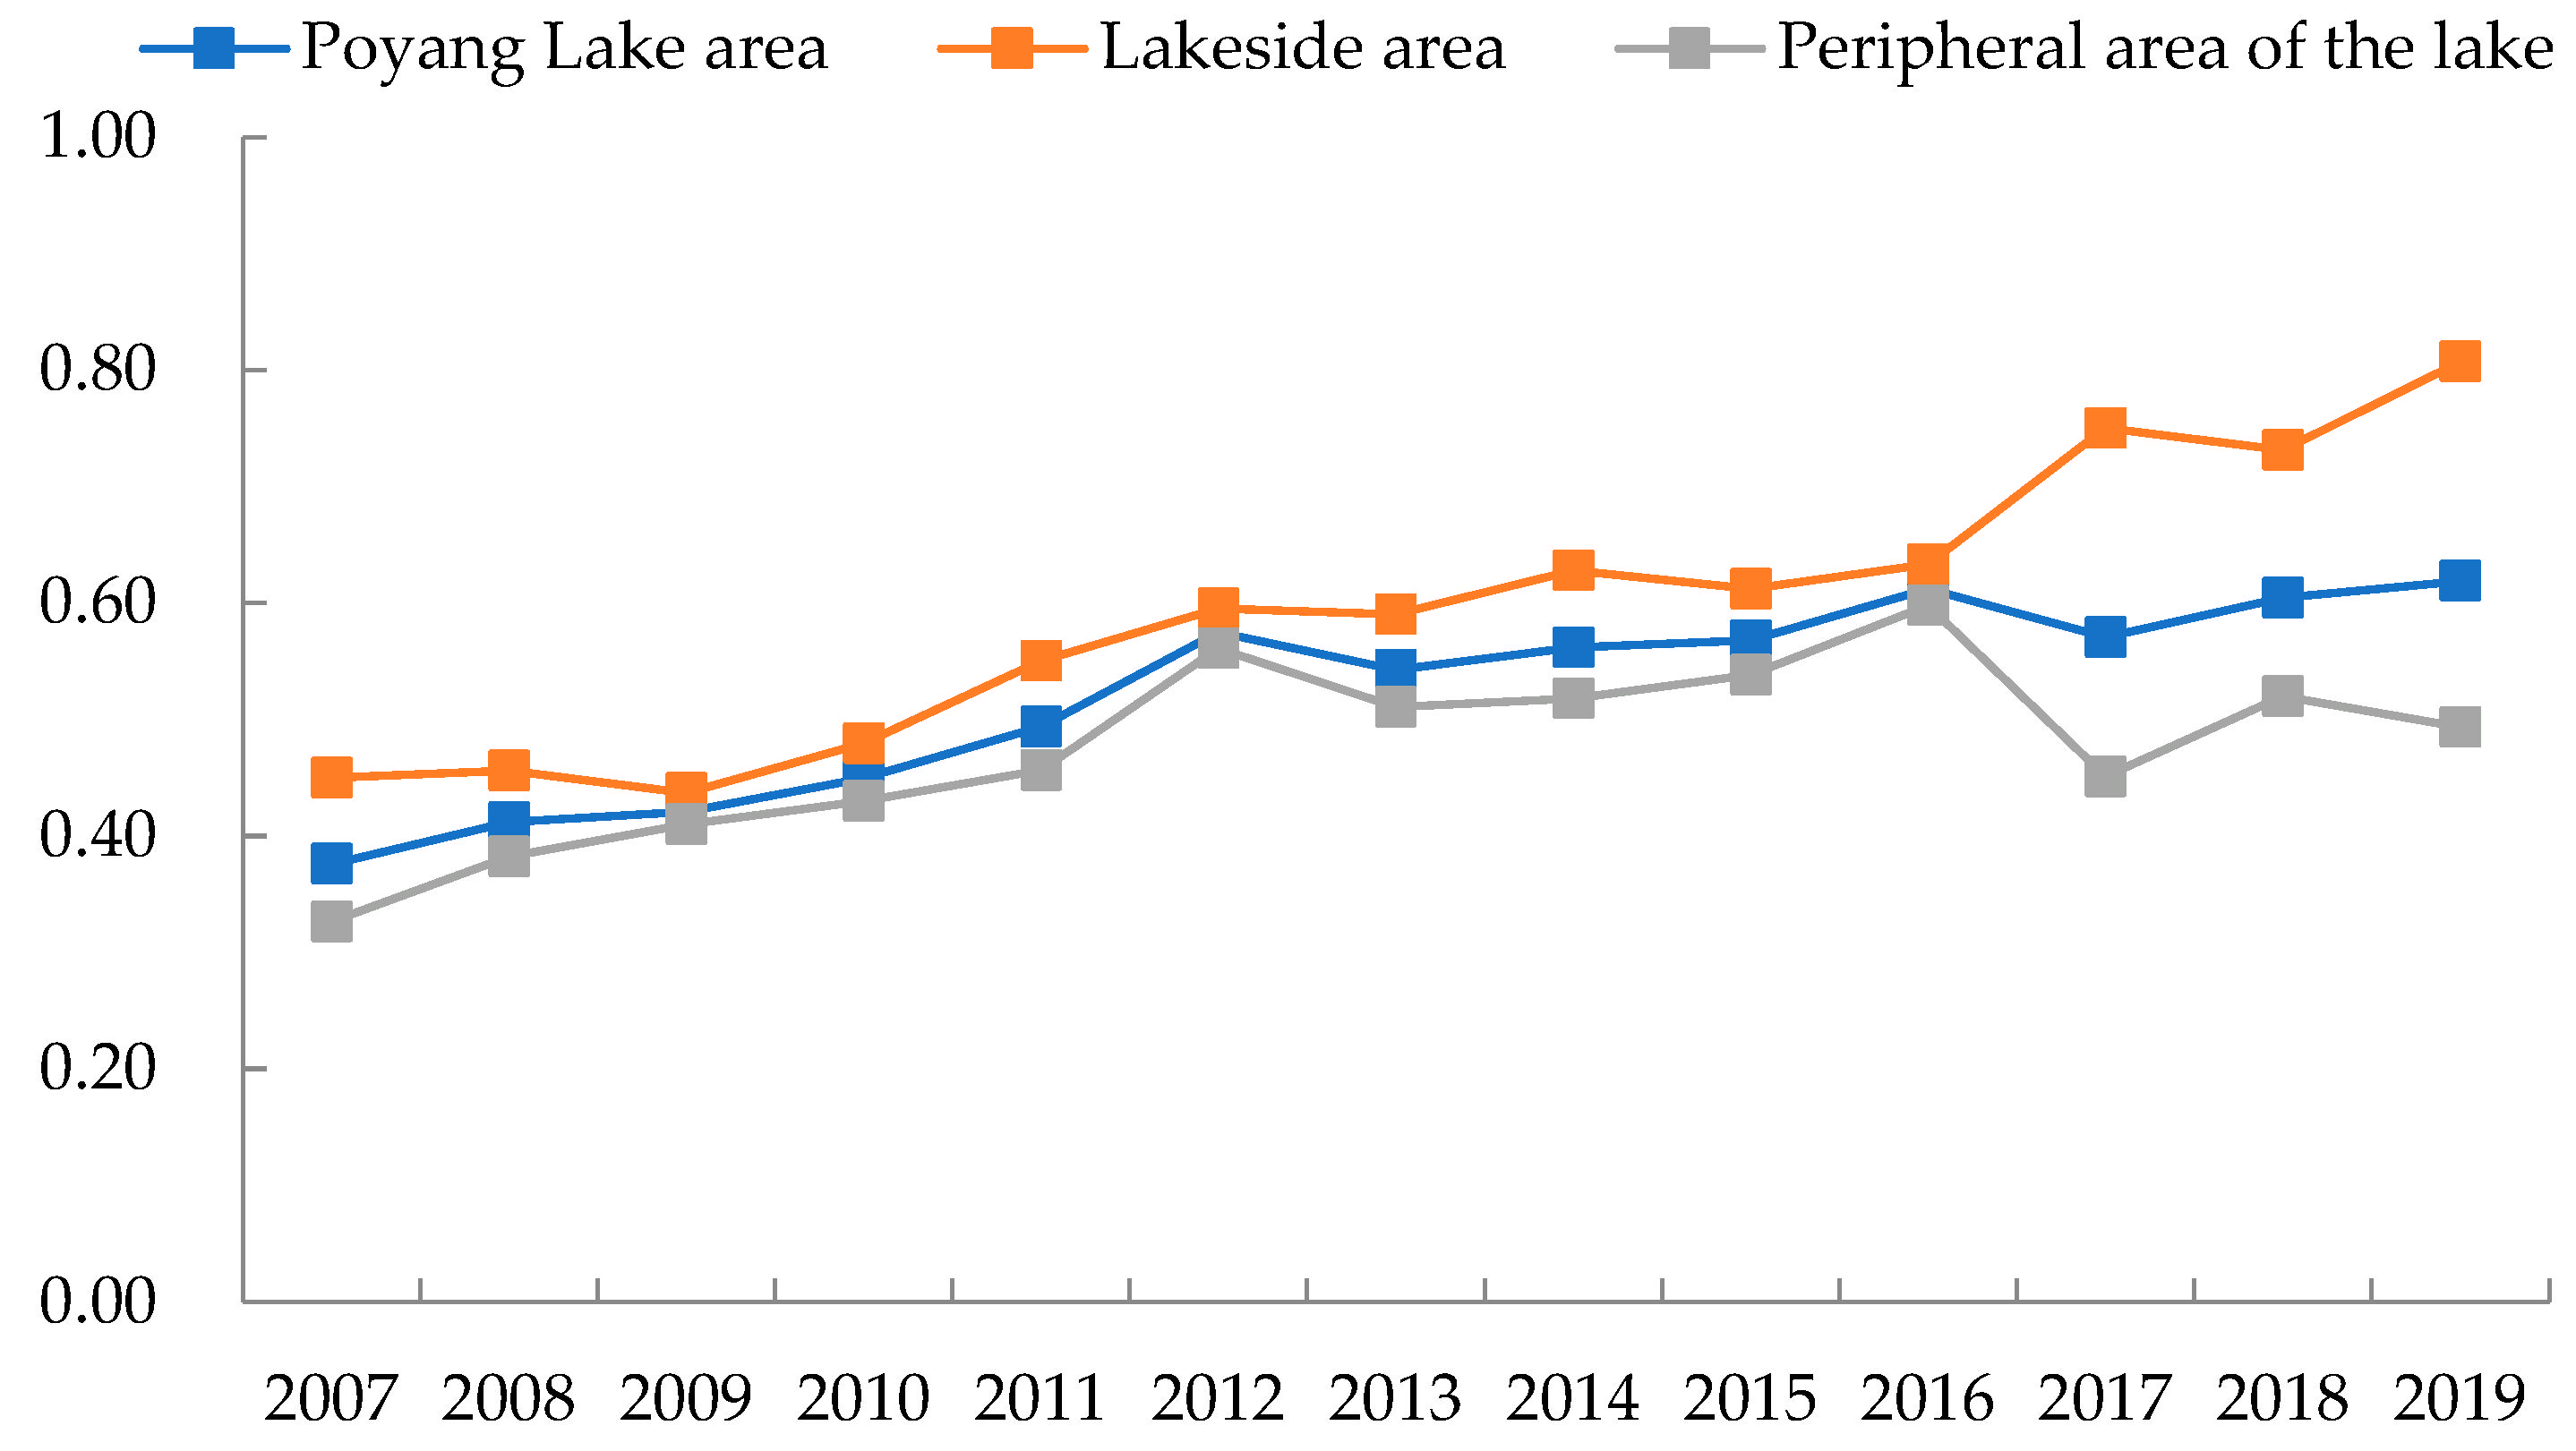
4.1.1. Time-Series Evolution of EWP in the Poyang Lake Area
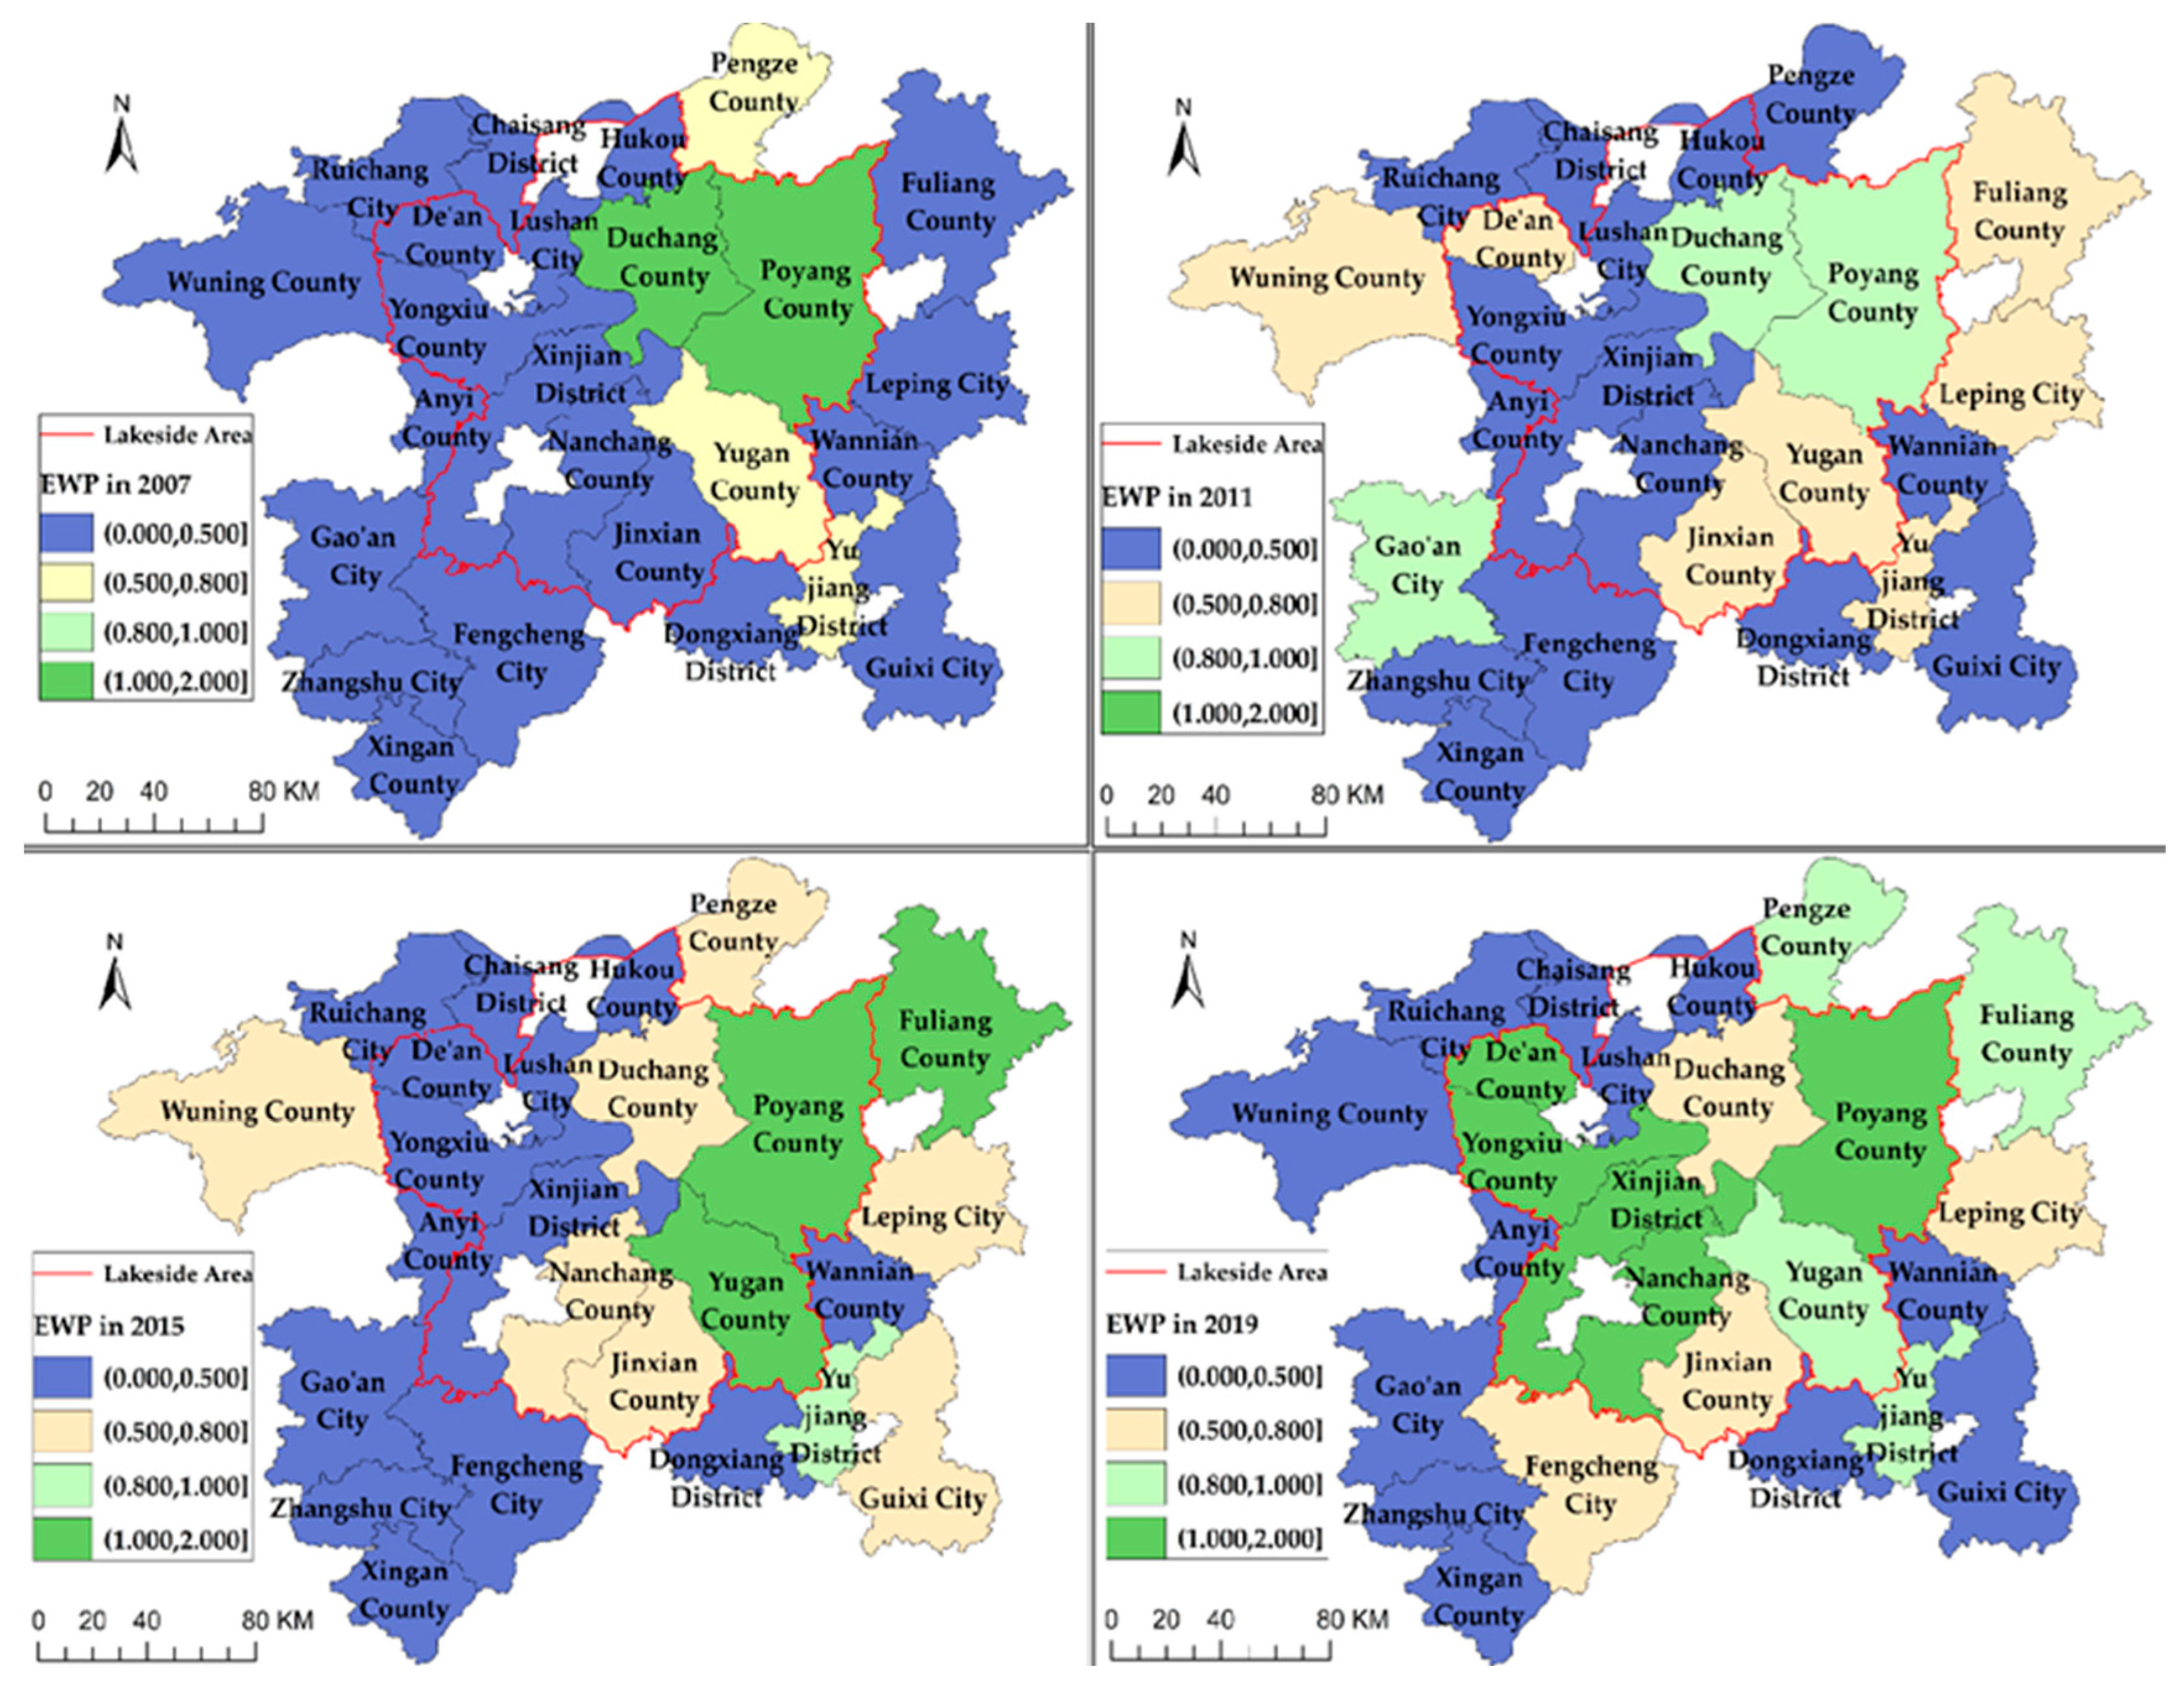
4.1.2. Spatial Pattern of EWP in the Poyang Lake Area
4.2. Analysis of Sub-Stage Efficiency and Redundancy of EWP in the Poyang Lake Area
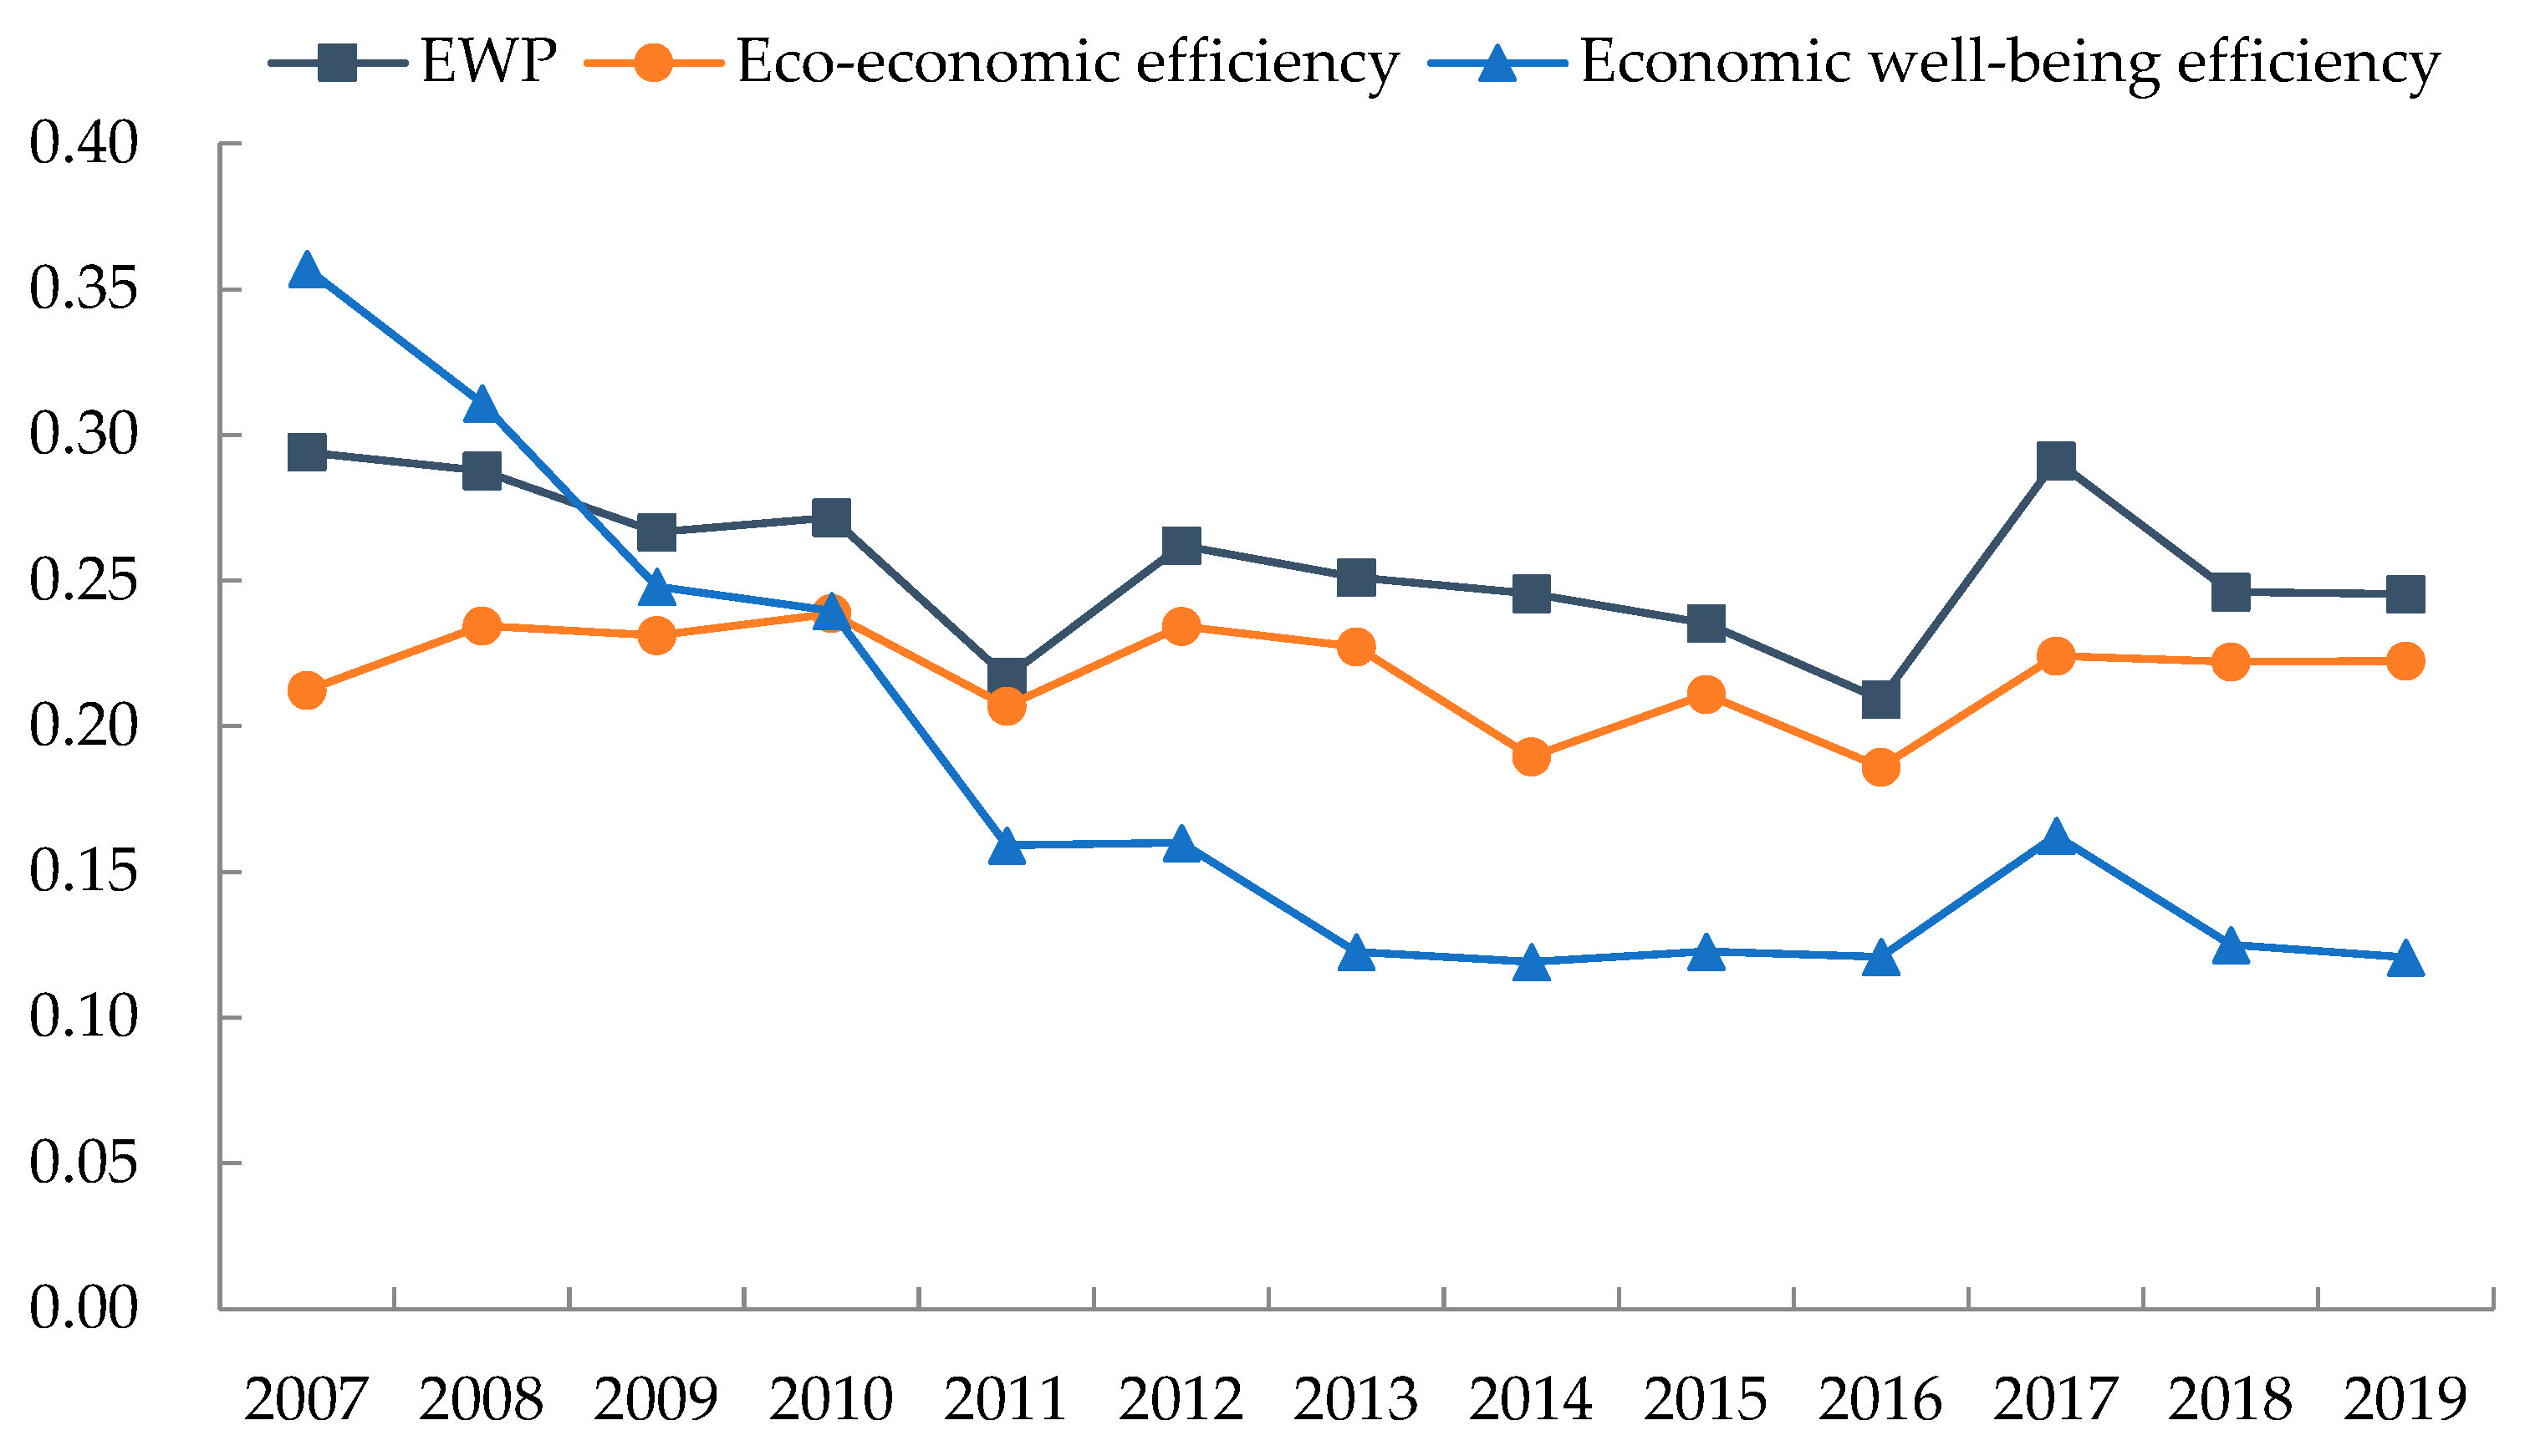
4.2.1. Sub-Stage Efficiency Analysis of EWP in the Poyang Lake Area
4.2.2. Redundancy Analysis of EWP in the Poyang Lake Area
4.3. Spatial Differences Analysis of EWP in the Poyang Lake Area
4.3.1. Overall Spatial Differences of EWP in the Poyang Lake Area
4.3.2. Spatial Differences Decomposition of EWP in the Poyang Lake Area
5. Discussion
6. Conclusions
Author Contributions
Funding
Institutional Review Board Statement
Informed Consent Statement
Data Availability Statement
Conflicts of Interest
References
- Signor, D.; Kim, J.; Tebaldi, E. Persistence and determinants of income inequality: The Brazilian case. Rev. Dev. Econ. 2019, 23, 1748–1767. [Google Scholar] [CrossRef]
- Daly, H.E. Beyond growth: The economics of sustainable development. Popul. Dev. Rev. 1996, 22, 783–789. [Google Scholar]
- Smith, H.E.; Ryan, C.M.; Vollmer, F.; Woollen, E.; Keane, A.; Fisher, J.A.; Baumert, S.; Grundy, I.M.; Carvalho, M.; Lisboa, S.N. Impacts of land use intensification on human wellbeing: Evidence from rural Mozambique. Glob. Environ. Chang. 2019, 59, 101976. [Google Scholar] [CrossRef]
- Yang, W.; Tao, J.; Lu, Q. Methodologies of human well-being assessment from the ecosystem service perspective. Acta Ecol. Sin. 2021, 41, 730–736. [Google Scholar]
- Zhou, B.; Cao, J.; Zhu, C.; Jin, B. Valuation of wetland ecosystem services along the Yangtze River in Anqing, Anhui Province. Geogr. Res. 2011, 30, 2296–2304. [Google Scholar]
- Yan, Z.; Zhou, Z.; Wen, T. Study on aquatic eco-civilization characteristics of great lake-basin and assessment system—A case study of Poyanghu Lake Basin. Water Resour. Hydropower Eng. 2018, 49, 97–105. [Google Scholar]
- Daly, H.E. The world dynamics of economic growth: The economics of the steady state. Am. Econ. Rev. 1974, 64, 15–21. [Google Scholar]
- Wang, S.; Zhang, Y.; Yao, X. Research on spatial unbalance and influencing factors of ecological well-being performance in China. Int. J. Environ. Res. Public Health 2021, 18, 9299. [Google Scholar] [CrossRef] [PubMed]
- Zhang, T.; Gao, Y.; Li, C.; Xie, Z.; Chang, Y.; Zhang, B. How human activity has changed the regional habitat quality in an eco-economic zone: Evidence from Poyang Lake Eco-Economic Zone, China. Int. J. Environ. Res. Public Health 2020, 17, 6253. [Google Scholar] [CrossRef] [PubMed]
- Xie, H.; Liu, Q.; Yao, G.; Tan, M. Measuring regional land use sustainability of the Poyang Lake Eco-economic Zone based on PSR modeling. Resour. Sci. 2015, 37, 449–457. [Google Scholar]
- Zhu, D. Beyond growth: What are differences between sustainable development economics and neoclassical economics. Acad. Mon. 2013, 45, 79–89. [Google Scholar]
- Wang, S.; Duan, L.; Jiang, S. Research on Spatial Differences and Driving Effects of Ecological Well-Being Performance in China. Int. J. Environ. Res. Public Health 2022, 19, 9310. [Google Scholar] [CrossRef]
- Zhu, D.; Zhang, S. Research on ecological well-being performance and its relationship with economic growth. China Popul. Resour. Environ. 2014, 24, 59–67. [Google Scholar]
- Zang, M.; Zhu, D.; Liu, G. Ecological well-being performance: Concept, connotation and empirical of G20. China Popul. Resour. Environ. 2013, 23, 118–124. [Google Scholar]
- Diener, E.; Emmons, R.A.; Larsen, R.J.; Griffin, S. The satisfaction with life scale. J. Personal. Assess. 1985, 49, 71–75. [Google Scholar] [CrossRef]
- Hervás, G.; Vázquez, C. Construction and validation of a measure of integrative well-being in seven languages: The pemberton happiness index. Health Qual. Life Outcomes 2013, 11, 66. [Google Scholar] [CrossRef]
- Borucke, M.; Moore, D.; Cranston, G.; Gracey, K.; Iha, K.; Larson, J.; Lazarus, E.; Morales, J.C.; Wackernagel, M.; Galli, A. Accounting for demand and supply of the biosphere’s regenerative capacity: The National Footprint Accounts’ underlying methodology and framework. Ecol. Indic. 2013, 24, 518–533. [Google Scholar] [CrossRef]
- Feng, Y.; Zhong, S.; Li, Q.; Zhao, X.; Dong, X. Ecological well-being performance growth in China (1994–2014): From perspectives of industrial structure green adjustment and green total factor productivity. J. Clean. Prod. 2019, 236, 117556. [Google Scholar] [CrossRef]
- Common, M. Measuring national economic performance without using prices. Ecol. Econ. 2007, 64, 92–102. [Google Scholar] [CrossRef]
- Behjat, A.; Tarazkar, M.H. Investigating the factors affecting the ecological well-being performance in Iran from 1994 to 2014. Environ. Dev. Sustain. 2021, 23, 13871–13889. [Google Scholar] [CrossRef]
- Li, C.; Zhang, S.; Zhang, W.; Liao, X. Measurement and influencing factors of inter-provincial ecological well-being performance in China. Sci. Geogr. Sin. 2019, 39, 1875–1883. [Google Scholar]
- Wang, Z.; Wang, Z. Spatial pattern evolution and influencing factors of ecological welfare performance in Yangtze River Economic Belt: Based on super efficiency SBM model. Resour. Environ. Yangtze Basin 2021, 30, 2822–2832. [Google Scholar]
- Xiao, L.; Zhang, X. Spatio-temporal characteristics of coupling coordination between green innovation efficiency and ecological welfare performance under the concept of strong sustainability. J. Nat. Resour. 2019, 34, 312–324. [Google Scholar] [CrossRef]
- Bian, J.; Ren, H.; Liu, P. Evaluation of urban ecological well-being performance in China: A case study of 30 provincial capital cities. J. Clean. Prod 2020, 254, 120109. [Google Scholar] [CrossRef]
- Guo, B.; Tang, L.; Jiang, Y.; Zhang, H. Regional differences and spatial convergence of ecological welfare performance in Yangtze River Economic Belt. Ecol. Econ. 2022, 38, 167–175. [Google Scholar]
- Bian, J.; Zhang, Y.; Shuai, C.; Shen, L.; Ren, H.; Wang, Y. Have cities effectively improved ecological well-being performance? Empirical analysis of 278 Chinese cities. J. Clean. Prod 2019, 245, 118913. [Google Scholar] [CrossRef]
- Fang, S.; Xiao, Q. Research on regional ecological well-being performance and spatial effect in China. China Popul. Resour. Environ. 2019, 29, 1–10. [Google Scholar]
- Zhong, Y.; Lu, Y. Regional economic disparities of Poyang Lake Ecological Economic Zone. Resour. Environ. Yangtze Basin 2010, 19, 1111–1118. [Google Scholar]
- Xiong, H.; Zeng, J. The study of regional economic differences in Poyang Lake Basin. Econ. Geogr. 2012, 32, 8–12. [Google Scholar]
- Long, L. Evaluation of urban ecological well-being performance of Chinese major cities based on two-stage super-efficiency network SBM Model. China Popul. Resour. Environ. 2019, 29, 1–10. [Google Scholar]
- Wang, S.; Zhang, Y.; Wen, H. Comprehensive measurement and regional imbalance of China’s green development performance. Sustainability 2021, 13, 1409. [Google Scholar] [CrossRef]
- Yang, L.; Zhang, X. Assessing regional eco-efficiency from the perspective of resource, environmental and economic performance in China: A bootstrapping approach in global data envelopment analysis. J. Clean. Prod. 2018, 173, 100–111. [Google Scholar] [CrossRef]
- Zhou, C.; Shi, C.; Wang, S.; Zhang, G. Estimation of eco-efficiency and its influencing factors in Guangdong province based on Super-SBM and panel regression models. Ecol. Indic. 2018, 86, 67–80. [Google Scholar] [CrossRef]
- Deng, Y.; Yang, X.; Ma, Q.; Wang, K. Regional disparity and convergence of China’ s ecological welfare performance level. China Popul. Resour. Environ. 2021, 31, 132–143. [Google Scholar]
- Meng, L.; Graus, W.; Worrell, E.; Huang, B. Estimating CO2 (carbon dioxide) emissions at urban scales by DMSP/OLS (Defense Meteorological Satellite Program’s Operational Linescan System) nighttime light imagery: Methodological challenges and a case study for China. Energy 2014, 71, 468–478. [Google Scholar] [CrossRef]
- Zhang, S.; Zhu, D.; Shi, Q.; Cheng, M. Which countries are more ecologically efficient in improving human well-being? An application of the index of ecological well-being performance. Resour. Conserv. Recycl. 2018, 129, 112–119. [Google Scholar] [CrossRef]
- He, J. Industrialization, environment and health: The impacts of industrial SO_2 emission on public health in China. Chin. J. Popul. Resour. Environ. 2008, 5, 14–24. [Google Scholar]
- Xiao, L.; Xiao, Q. Study on the differentiation and spatial convergence of urban ecological welfare performance patterns in the Yellow River Basin. Soft Sci. 2021, 35, 46–53. [Google Scholar]
- Ibrahim, M.D.; Alola, A.A.; Ferreira, D.C. A two-stage data envelopment analysis of efficiency of social-ecological systems: Inference from the sub-Saharan African countries. Ecol. Indic. 2021, 123, 107381. [Google Scholar] [CrossRef]
- Harvard Dataverse Platform. Available online: https://doi.org/10.7910/DVN/YGIVCD (accessed on 1 November 2021).
- University of Washington’s Atmospheric Composition Analysis Group. Available online: https://sites.wustl.edu/acag/datasets/surface-pm2-5/ (accessed on 1 November 2021).
- China Carbon Accounting Database. Available online: https://www.ceads.net.cn/ (accessed on 12 November 2021).
- Jiang, T.; Fan, L.; Jing, P. Operating efficiency evaluation and improvement for China’ s life insurance companies under the two-stage perspective—Based on network SBM model and DEA window analysis method. Insur. Stud. 2015, 36, 33–43. [Google Scholar]
- Cullinane, K.; Song, D.W.; Ji, P.; Wang, T.F. An application of DEA windows analysis to container port production efficiency. Rev. Netw. Econ. 2004, 3, 184–206. [Google Scholar] [CrossRef]
- Dagum, C. A new approach to the decomposition of the Gini income inequality ratio. Empir. Econ. 1997, 22, 515–531. [Google Scholar] [CrossRef]
- Kozera, A.; Standar, A.; Satola, L. Managing rural areas in the context of the growing debt of Polish local government units. Agriculture 2020, 10, 376. [Google Scholar] [CrossRef]

| Stage | Category | First Tier | Second Tier | Third Tier Indicators |
|---|---|---|---|---|
| Stage 1 (Eco-economic efficiency) | Input indicators | Ecological inputs | Energy | Energy consumption per capita |
| Land | Built-up area per capita | |||
| Water | Water use per capita | |||
| Nonecological inputs | Human capital | Education expenditure per capita | ||
| Science and technology | Science and technology expenditure per capita | |||
| Undesired output | Environmental pollution | Environmental pollution index | Average PM2.5 concentration, per capita carbon emission and per capita wastewater discharge | |
| Stage 2 (Economic well-being efficiency) | Desired output | Economic output | GDP | GDP per capita |
| Output indicators | Comprehensive well-being outputs | Economic well-being index | Urban per capita disposable income and rural disposable income per capita | |
| Environmental well-being index | Forest coverage rate, sewage treatment rate, per capita energy saving and environmental protection expenditure and per capita carbon dioxide sequestration | |||
| Social well-being index | Number of health technicians per 10,000 people, average years of education, public finance expenditure per capita, social security and employment expenditure per capita and number of employed persons |
| Region | 2007 | 2009 | 2011 | 2013 | 2015 | 2017 | 2019 | Average Value a | Average Value b | Growth Rate (%) |
|---|---|---|---|---|---|---|---|---|---|---|
| Yugan County | 0.514 | 0.530 | 0.713 | 0.910 | 1.150 | 1.931 | 0.869 | 0.907 | 1.544 | 4.478 |
| Nanchang County | 0.164 | 0.181 | 0.481 | 0.489 | 0.532 | 0.415 | 1.020 | 0.447 | 0.872 | 16.453 |
| Lushan City | 0.279 | 0.272 | 0.324 | 0.322 | 0.371 | 0.331 | 0.455 | 0.339 | 0.591 | 4.159 |
| De’an County | 0.209 | 0.260 | 0.610 | 0.676 | 0.433 | 0.669 | 1.018 | 0.527 | 0.833 | 14.089 |
| Xinjian District | 0.227 | 0.240 | 0.299 | 0.237 | 0.391 | 0.413 | 1.002 | 0.393 | 0.682 | 13.183 |
| Yongxiu County | 0.234 | 0.324 | 0.384 | 0.350 | 0.449 | 0.926 | 1.023 | 0.482 | 0.926 | 13.067 |
| Hukou County | 0.290 | 0.234 | 0.306 | 0.292 | 0.305 | 0.283 | 0.381 | 0.293 | 0.492 | 2.289 |
| Jinxian County | 0.449 | 0.558 | 0.736 | 0.678 | 0.740 | 0.771 | 0.734 | 0.676 | 1.203 | 4.189 |
| Duchang County | 1.090 | 0.996 | 0.815 | 0.944 | 0.722 | 0.776 | 0.535 | 0.870 | 1.316 | −5.756 |
| Poyang County | 1.044 | 0.777 | 0.832 | 1.004 | 1.029 | 0.986 | 1.034 | 1.005 | 1.225 | −0.082 |
| Fengcheng City | 0.304 | 0.287 | 0.365 | 0.399 | 0.446 | 0.475 | 0.585 | 0.406 | 1.013 | 5.622 |
| Xingan County | 0.328 | 0.323 | 0.440 | 0.694 | 0.436 | 0.332 | 0.392 | 0.444 | 0.846 | 1.476 |
| Zhangshu City | 0.258 | 0.380 | 0.380 | 0.393 | 0.443 | 0.301 | 0.337 | 0.378 | 0.943 | 2.256 |
| Gao’an City | 0.439 | 0.496 | 0.881 | 0.285 | 0.299 | 0.335 | 0.365 | 0.498 | 0.949 | −1.529 |
| Dongxiang District | 0.188 | 0.228 | 0.219 | 0.231 | 0.247 | 0.265 | 0.280 | 0.239 | 0.611 | 3.375 |
| Yujiang District | 0.531 | 0.445 | 0.528 | 0.568 | 0.945 | 0.593 | 0.887 | 0.670 | 1.113 | 4.364 |
| Guixi City | 0.181 | 0.246 | 0.296 | 0.437 | 0.594 | 0.378 | 0.346 | 0.390 | 0.850 | 5.541 |
| Wannian County | 0.185 | 0.349 | 0.452 | 0.663 | 0.499 | 0.464 | 0.459 | 0.492 | 0.880 | 7.865 |
| Leping City | 0.376 | 0.437 | 0.504 | 0.624 | 0.698 | 0.630 | 0.562 | 0.558 | 1.015 | 3.417 |
| Fuliang County | 0.429 | 0.853 | 0.595 | 0.736 | 1.011 | 0.953 | 0.886 | 0.793 | 1.188 | 6.231 |
| Anyi County | 0.306 | 0.390 | 0.410 | 0.417 | 0.481 | 0.377 | 0.354 | 0.431 | 0.625 | 1.210 |
| Wuning County | 0.378 | 0.803 | 0.726 | 1.050 | 0.729 | 0.398 | 0.384 | 0.670 | 1.178 | 0.141 |
| Pengze County | 0.526 | 0.321 | 0.431 | 0.483 | 0.545 | 0.570 | 0.860 | 0.535 | 0.984 | 4.182 |
| Chaisang District | 0.183 | 0.228 | 0.220 | 0.229 | 0.247 | 0.246 | 0.292 | 0.235 | 0.378 | 3.956 |
| Ruichang City | 0.287 | 0.364 | 0.397 | 0.451 | 0.457 | 0.447 | 0.411 | 0.409 | 0.706 | 3.046 |
| Poyang Lake basin | 0.450 | 0.437 | 0.550 | 0.590 | 0.612 | 0.750 | 0.807 | 0.594 | 0.968 | 4.988 |
| Ganjiang River basin | 0.332 | 0.371 | 0.517 | 0.443 | 0.406 | 0.361 | 0.420 | 0.432 | 0.938 | 1.968 |
| Fuhe River basin | 0.188 | 0.228 | 0.219 | 0.231 | 0.247 | 0.265 | 0.280 | 0.239 | 0.611 | 3.375 |
| Xinjiang River basin | 0.356 | 0.346 | 0.412 | 0.502 | 0.769 | 0.485 | 0.617 | 0.530 | 0.981 | 4.677 |
| Raohe River basin | 0.330 | 0.546 | 0.517 | 0.675 | 0.736 | 0.682 | 0.636 | 0.614 | 1.028 | 5.619 |
| Xiuhe River basin | 0.342 | 0.596 | 0.568 | 0.733 | 0.605 | 0.388 | 0.369 | 0.551 | 0.901 | 0.635 |
| Yangtze River basin | 0.332 | 0.304 | 0.349 | 0.388 | 0.417 | 0.421 | 0.521 | 0.393 | 0.689 | 3.827 |
| Region | 2007 | 2011 | 2015 | 2019 | 2007–2019 | |||||
|---|---|---|---|---|---|---|---|---|---|---|
| Stage1 | Stage2 | Stage1 | Stage2 | Stage1 | Stage2 | Stage1 | Stage2 | Stage1 | Stage2 | |
| Yugan County | 1.000 | 0.346 | 0.919 | 0.620 | 1.118 | 1.063 | 1.001 | 0.757 | 1.024 | 0.757 |
| Nanchang County | 0.359 | 0.126 | 0.633 | 0.396 | 0.626 | 0.564 | 1.108 | 0.837 | 0.580 | 0.456 |
| Lushan City | 0.654 | 0.316 | 0.384 | 0.608 | 0.404 | 0.798 | 0.514 | 0.747 | 0.437 | 0.603 |
| De’an County | 0.340 | 0.336 | 0.614 | 0.951 | 0.448 | 0.901 | 1.026 | 0.984 | 0.574 | 0.754 |
| Xinjian District | 0.410 | 0.185 | 0.382 | 0.470 | 0.556 | 0.468 | 1.048 | 0.914 | 0.537 | 0.431 |
| Yongxiu County | 0.469 | 0.229 | 0.444 | 0.674 | 0.484 | 0.830 | 1.089 | 0.877 | 0.570 | 0.625 |
| Hukou County | 0.552 | 0.258 | 0.382 | 0.498 | 0.376 | 0.572 | 0.470 | 0.545 | 0.391 | 0.476 |
| Jinxian County | 1.026 | 0.212 | 0.985 | 0.526 | 0.896 | 0.666 | 0.734 | 1.000 | 0.924 | 0.552 |
| Duchang County | 1.032 | 1.112 | 0.816 | 0.986 | 0.720 | 1.007 | 0.671 | 0.580 | 0.886 | 0.926 |
| Poyang County | 0.941 | 1.221 | 0.825 | 1.016 | 1.030 | 0.999 | 1.008 | 1.053 | 0.961 | 1.072 |
| Fengcheng City | 0.427 | 0.401 | 0.401 | 0.774 | 0.506 | 0.775 | 0.625 | 0.860 | 0.471 | 0.691 |
| Xingan County | 0.497 | 0.404 | 0.529 | 0.629 | 0.520 | 0.660 | 0.496 | 0.536 | 0.573 | 0.550 |
| Zhangshu City | 0.462 | 0.213 | 0.472 | 0.550 | 0.556 | 0.556 | 0.415 | 0.566 | 0.539 | 0.463 |
| Gao’an City | 0.752 | 0.301 | 1.066 | 0.688 | 0.311 | 0.922 | 0.428 | 0.646 | 0.594 | 0.701 |
| Dongxiang District | 0.358 | 0.256 | 0.249 | 0.707 | 0.263 | 0.870 | 0.280 | 1.000 | 0.277 | 0.752 |
| Yujiang District | 1.000 | 0.362 | 0.636 | 0.616 | 0.939 | 1.011 | 1.013 | 0.775 | 0.808 | 0.698 |
| Guixi City | 0.374 | 0.118 | 0.411 | 0.319 | 0.727 | 0.551 | 0.466 | 0.420 | 0.516 | 0.410 |
| Wannian County | 0.395 | 0.307 | 0.528 | 0.695 | 0.559 | 0.767 | 0.523 | 0.719 | 0.570 | 0.690 |
| Leping City | 0.813 | 0.234 | 0.651 | 0.515 | 0.789 | 0.772 | 0.594 | 0.881 | 0.732 | 0.590 |
| Fuliang County | 0.429 | 1.000 | 0.595 | 1.000 | 1.042 | 0.941 | 0.934 | 0.900 | 0.844 | 0.898 |
| Anyi County | 0.614 | 0.227 | 0.511 | 0.545 | 0.572 | 0.642 | 0.426 | 0.614 | 0.562 | 0.526 |
| Wuning County | 0.615 | 0.324 | 0.811 | 0.772 | 0.760 | 0.925 | 0.421 | 0.802 | 0.736 | 0.791 |
| Pengze County | 0.523 | 1.014 | 0.439 | 0.959 | 0.562 | 0.934 | 0.913 | 0.882 | 0.575 | 0.888 |
| Chaisang District | 0.431 | 0.213 | 0.279 | 0.507 | 0.294 | 0.638 | 0.336 | 0.691 | 0.316 | 0.518 |
| Ruichang City | 0.421 | 0.487 | 0.437 | 0.779 | 0.505 | 0.765 | 0.458 | 0.769 | 0.488 | 0.743 |
| Poyang Lake area | 0.596 | 0.408 | 0.576 | 0.672 | 0.622 | 0.784 | 0.680 | 0.774 | 0.619 | 0.662 |
| Lakeside area | 0.678 | 0.434 | 0.638 | 0.675 | 0.666 | 0.787 | 0.867 | 0.829 | 0.688 | 0.665 |
| Peripheral area of the lake | 0.541 | 0.391 | 0.534 | 0.670 | 0.594 | 0.782 | 0.555 | 0.737 | 0.573 | 0.661 |
| Poyang Lake basin | 0.678 | 0.434 | 0.638 | 0.675 | 0.666 | 0.787 | 0.867 | 0.829 | 0.688 | 0.665 |
| Ganjiang River basin | 0.534 | 0.330 | 0.617 | 0.660 | 0.473 | 0.728 | 0.491 | 0.652 | 0.544 | 0.601 |
| Fuhe River basin | 0.358 | 0.256 | 0.249 | 0.707 | 0.263 | 0.870 | 0.280 | 1.000 | 0.277 | 0.752 |
| Xinjiang River basin | 0.687 | 0.240 | 0.524 | 0.467 | 0.833 | 0.781 | 0.739 | 0.597 | 0.662 | 0.554 |
| Raohe River basin | 0.546 | 0.513 | 0.591 | 0.737 | 0.797 | 0.827 | 0.683 | 0.833 | 0.715 | 0.726 |
| Xiuhe River basin | 0.615 | 0.275 | 0.661 | 0.659 | 0.666 | 0.783 | 0.424 | 0.708 | 0.649 | 0.659 |
| Yangtze River basin | 0.458 | 0.572 | 0.385 | 0.748 | 0.454 | 0.779 | 0.569 | 0.781 | 0.460 | 0.716 |
| Region | R1 | R2 | R3 | N1 | N2 | I1 | U1 | D1 | D2 | D3 |
|---|---|---|---|---|---|---|---|---|---|---|
| Yugan County | −0.038 | 0.000 | −0.152 | −70.454 | −5.729 | −1900 | 0.000 | 0.000 | 0.058 | 0.149 |
| Nanchang County | 0.000 | 0.000 | 0.000 | 0.000 | 0.000 | −18,930 | 0.000 | −0.115 | 0.000 | 0.000 |
| Lushan City | −0.446 | −9.676 | −2.670 | −546.536 | −189.813 | −6030 | −0.168 | 0.000 | 0.216 | 0.000 |
| De’an County | 0.000 | 0.000 | 0.000 | 0.000 | 0.000 | −4010 | 0.000 | 0.000 | 0.000 | −0.087 |
| Xinjian District | 0.000 | 0.000 | 0.000 | 0.000 | 0.000 | −4420 | 0.000 | −0.014 | 0.000 | 0.000 |
| Yongxiu County | 0.000 | 0.000 | 0.000 | 0.000 | 0.000 | −9890 | 0.000 | 0.000 | −0.095 | −0.003 |
| Hukou County | −1.759 | −7.082 | −11.418 | −1082.392 | −136.320 | −33,560 | −0.230 | 0.000 | 0.100 | 0.000 |
| Jinxian County | −0.001 | −4.500 | −4.855 | −141.207 | −10.499 | 0.000 | −0.050 | 0.000 | 0.000 | 0.000 |
| Duchang County | −0.221 | 19.259 | −2.452 | −66.783 | −135.124 | −10,050 | −0.017 | 0.018 | 0.000 | 0.050 |
| Poyang County | 0.000 | 0.000 | 0.000 | 22.910 | 0.000 | −110 | 0.000 | −0.035 | −0.024 | −0.025 |
| Fengcheng City | −0.307 | −6.861 | 0.000 | −215.285 | −127.771 | −2090 | −0.087 | 0.000 | 0.000 | 0.110 |
| Xingan County | −0.260 | −15.426 | −9.462 | −412.562 | −179.506 | −15,870 | −0.168 | 0.000 | 0.106 | 0.190 |
| Zhangshu City | −1.121 | −18.671 | −13.809 | −1287.514 | −68.342 | −25,280 | −0.189 | 0.000 | 0.148 | 0.000 |
| Gao’an City | −1.687 | −11.080 | −10.217 | −585.006 | −233.354 | −17,250 | −0.150 | 0.000 | 0.000 | 0.041 |
| Dongxiang District | −1.866 | −33.874 | −15.675 | −995.799 | −356.135 | 0.000 | −0.202 | 0.000 | 0.000 | 0.000 |
| Yujiang District | −0.006 | −0.094 | −0.060 | 0.000 | −5.875 | −1670 | −0.002 | 0.063 | 0.236 | 0.020 |
| Guixi City | −1.468 | −22.379 | −5.032 | −1042.078 | −150.479 | −40,510 | −0.125 | 0.000 | 0.000 | 0.135 |
| Wannian County | −0.421 | −13.103 | −6.325 | −334.881 | −172.055 | −10,170 | −0.073 | 0.000 | 0.010 | 0.013 |
| Leping City | −0.383 | 0.000 | −4.315 | −705.835 | −104.048 | −3990 | −0.062 | 0.000 | 0.013 | 0.000 |
| Fuliang County | −0.507 | 0.000 | −0.366 | −31.875 | −5.048 | −1630 | −0.015 | 0.000 | 0.000 | 0.103 |
| Anyi County | −0.611 | −3.398 | −30.925 | −636.309 | −42.688 | −10340 | −0.246 | 0.000 | 0.179 | 0.118 |
| Wuning County | −0.952 | −13.437 | −11.980 | −665.343 | −222.333 | −7400 | −0.087 | 0.000 | 0.000 | 0.033 |
| Pengze County | −0.211 | 0.000 | −2.154 | −136.819 | −32.610 | −3800 | −0.023 | 0.087 | 0.000 | 0.000 |
| Chaisang District | −4.104 | −20.921 | −14.422 | 400.196 | −199.126 | −7660 | −0.539 | 0.000 | 0.261 | 0.000 |
| Ruichang City | −2.298 | −14.586 | −9.209 | −254.500 | −430.332 | −9440 | −0.132 | 0.000 | 0.125 | 0.000 |
| Year | G | Gw | Contribution Rate (%) | Gnb | Contribution Rate (%) | Gt | Contribution Rate (%) |
|---|---|---|---|---|---|---|---|
| 2007 | 0.294 | 0.078 | 26.67 | 0.091 | 30.95 | 0.125 | 42.38 |
| 2008 | 0.288 | 0.075 | 25.97 | 0.074 | 25.66 | 0.139 | 48.36 |
| 2009 | 0.267 | 0.061 | 23.05 | 0.119 | 44.67 | 0.086 | 32.28 |
| 2010 | 0.272 | 0.066 | 24.47 | 0.117 | 35.78 | 0.108 | 39.75 |
| 2011 | 0.217 | 0.047 | 21.50 | 0.085 | 39.35 | 0.085 | 39.15 |
| 2012 | 0.262 | 0.055 | 20.95 | 0.129 | 49.10 | 0.078 | 29.95 |
| 2013 | 0.251 | 0.054 | 21.50 | 0.120 | 47.93 | 0.077 | 30.57 |
| 2014 | 0.246 | 0.052 | 21.01 | 0.130 | 52.77 | 0.064 | 26.22 |
| 2015 | 0.235 | 0.050 | 21.03 | 0.128 | 54.45 | 0.058 | 24.52 |
| 2016 | 0.209 | 0.043 | 20.75 | 0.097 | 46.40 | 0.069 | 32.86 |
| 2017 | 0.291 | 0.072 | 24.61 | 0.168 | 57.52 | 0.052 | 17.87 |
| 2018 | 0.246 | 0.045 | 18.36 | 0.147 | 59.70 | 0.054 | 21.95 |
| 2019 | 0.245 | 0.043 | 17.48 | 0.158 | 64.55 | 0.044 | 17.97 |
| Region | Gjh | Region | Gjh | Region | Gjh |
|---|---|---|---|---|---|
| 1–2 | 0.282 | 2–4 | 0.226 | 3–7 | 0.247 |
| 1–3 | 0.424 | 2–5 | 0.234 | 4–5 | 0.184 |
| 1–4 | 0.257 | 2–6 | 0.190 | 4–6 | 0.235 |
| 1–5 | 0.237 | 2–7 | 0.196 | 4–7 | 0.216 |
| 1–6 | 0.276 | 3–4 | 0.360 | 5–6 | 0.201 |
| 1–7 | 0.296 | 3–5 | 0.431 | 5–7 | 0.253 |
| 2–3 | 0.283 | 3–6 | 0.369 | 6–7 | 0.252 |
Publisher’s Note: MDPI stays neutral with regard to jurisdictional claims in published maps and institutional affiliations. |
© 2022 by the authors. Licensee MDPI, Basel, Switzerland. This article is an open access article distributed under the terms and conditions of the Creative Commons Attribution (CC BY) license (https://creativecommons.org/licenses/by/4.0/).
Share and Cite
Wang, S.; Duan, L.; Zhu, Q.; Zhang, Y. Spatial Differences of Ecological Well-Being Performance in the Poyang Lake Area at the Local Level. Int. J. Environ. Res. Public Health 2022, 19, 11439. https://doi.org/10.3390/ijerph191811439
Wang S, Duan L, Zhu Q, Zhang Y. Spatial Differences of Ecological Well-Being Performance in the Poyang Lake Area at the Local Level. International Journal of Environmental Research and Public Health. 2022; 19(18):11439. https://doi.org/10.3390/ijerph191811439
Chicago/Turabian StyleWang, Shengyun, Liancheng Duan, Qin Zhu, and Yaxin Zhang. 2022. "Spatial Differences of Ecological Well-Being Performance in the Poyang Lake Area at the Local Level" International Journal of Environmental Research and Public Health 19, no. 18: 11439. https://doi.org/10.3390/ijerph191811439
APA StyleWang, S., Duan, L., Zhu, Q., & Zhang, Y. (2022). Spatial Differences of Ecological Well-Being Performance in the Poyang Lake Area at the Local Level. International Journal of Environmental Research and Public Health, 19(18), 11439. https://doi.org/10.3390/ijerph191811439


