

How Do Perceived Changes in Child and Adolescent Activities Relate to Perceptions of Health during COVID-19? Exploring Heterogeneity during the Pandemic


Abstract
:1. Introduction
2. Materials and Methods
2.1. Study Design
2.2. Measures
2.2.1. Changes in MH and PH
2.2.2. Changes in Child Activities
2.2.3. Covariates
2.3. Analysis
3. Results
3.1. Descriptive Statistics
3.2. Quantitative Results
3.2.1. Physical Health
3.2.2. Mental Health
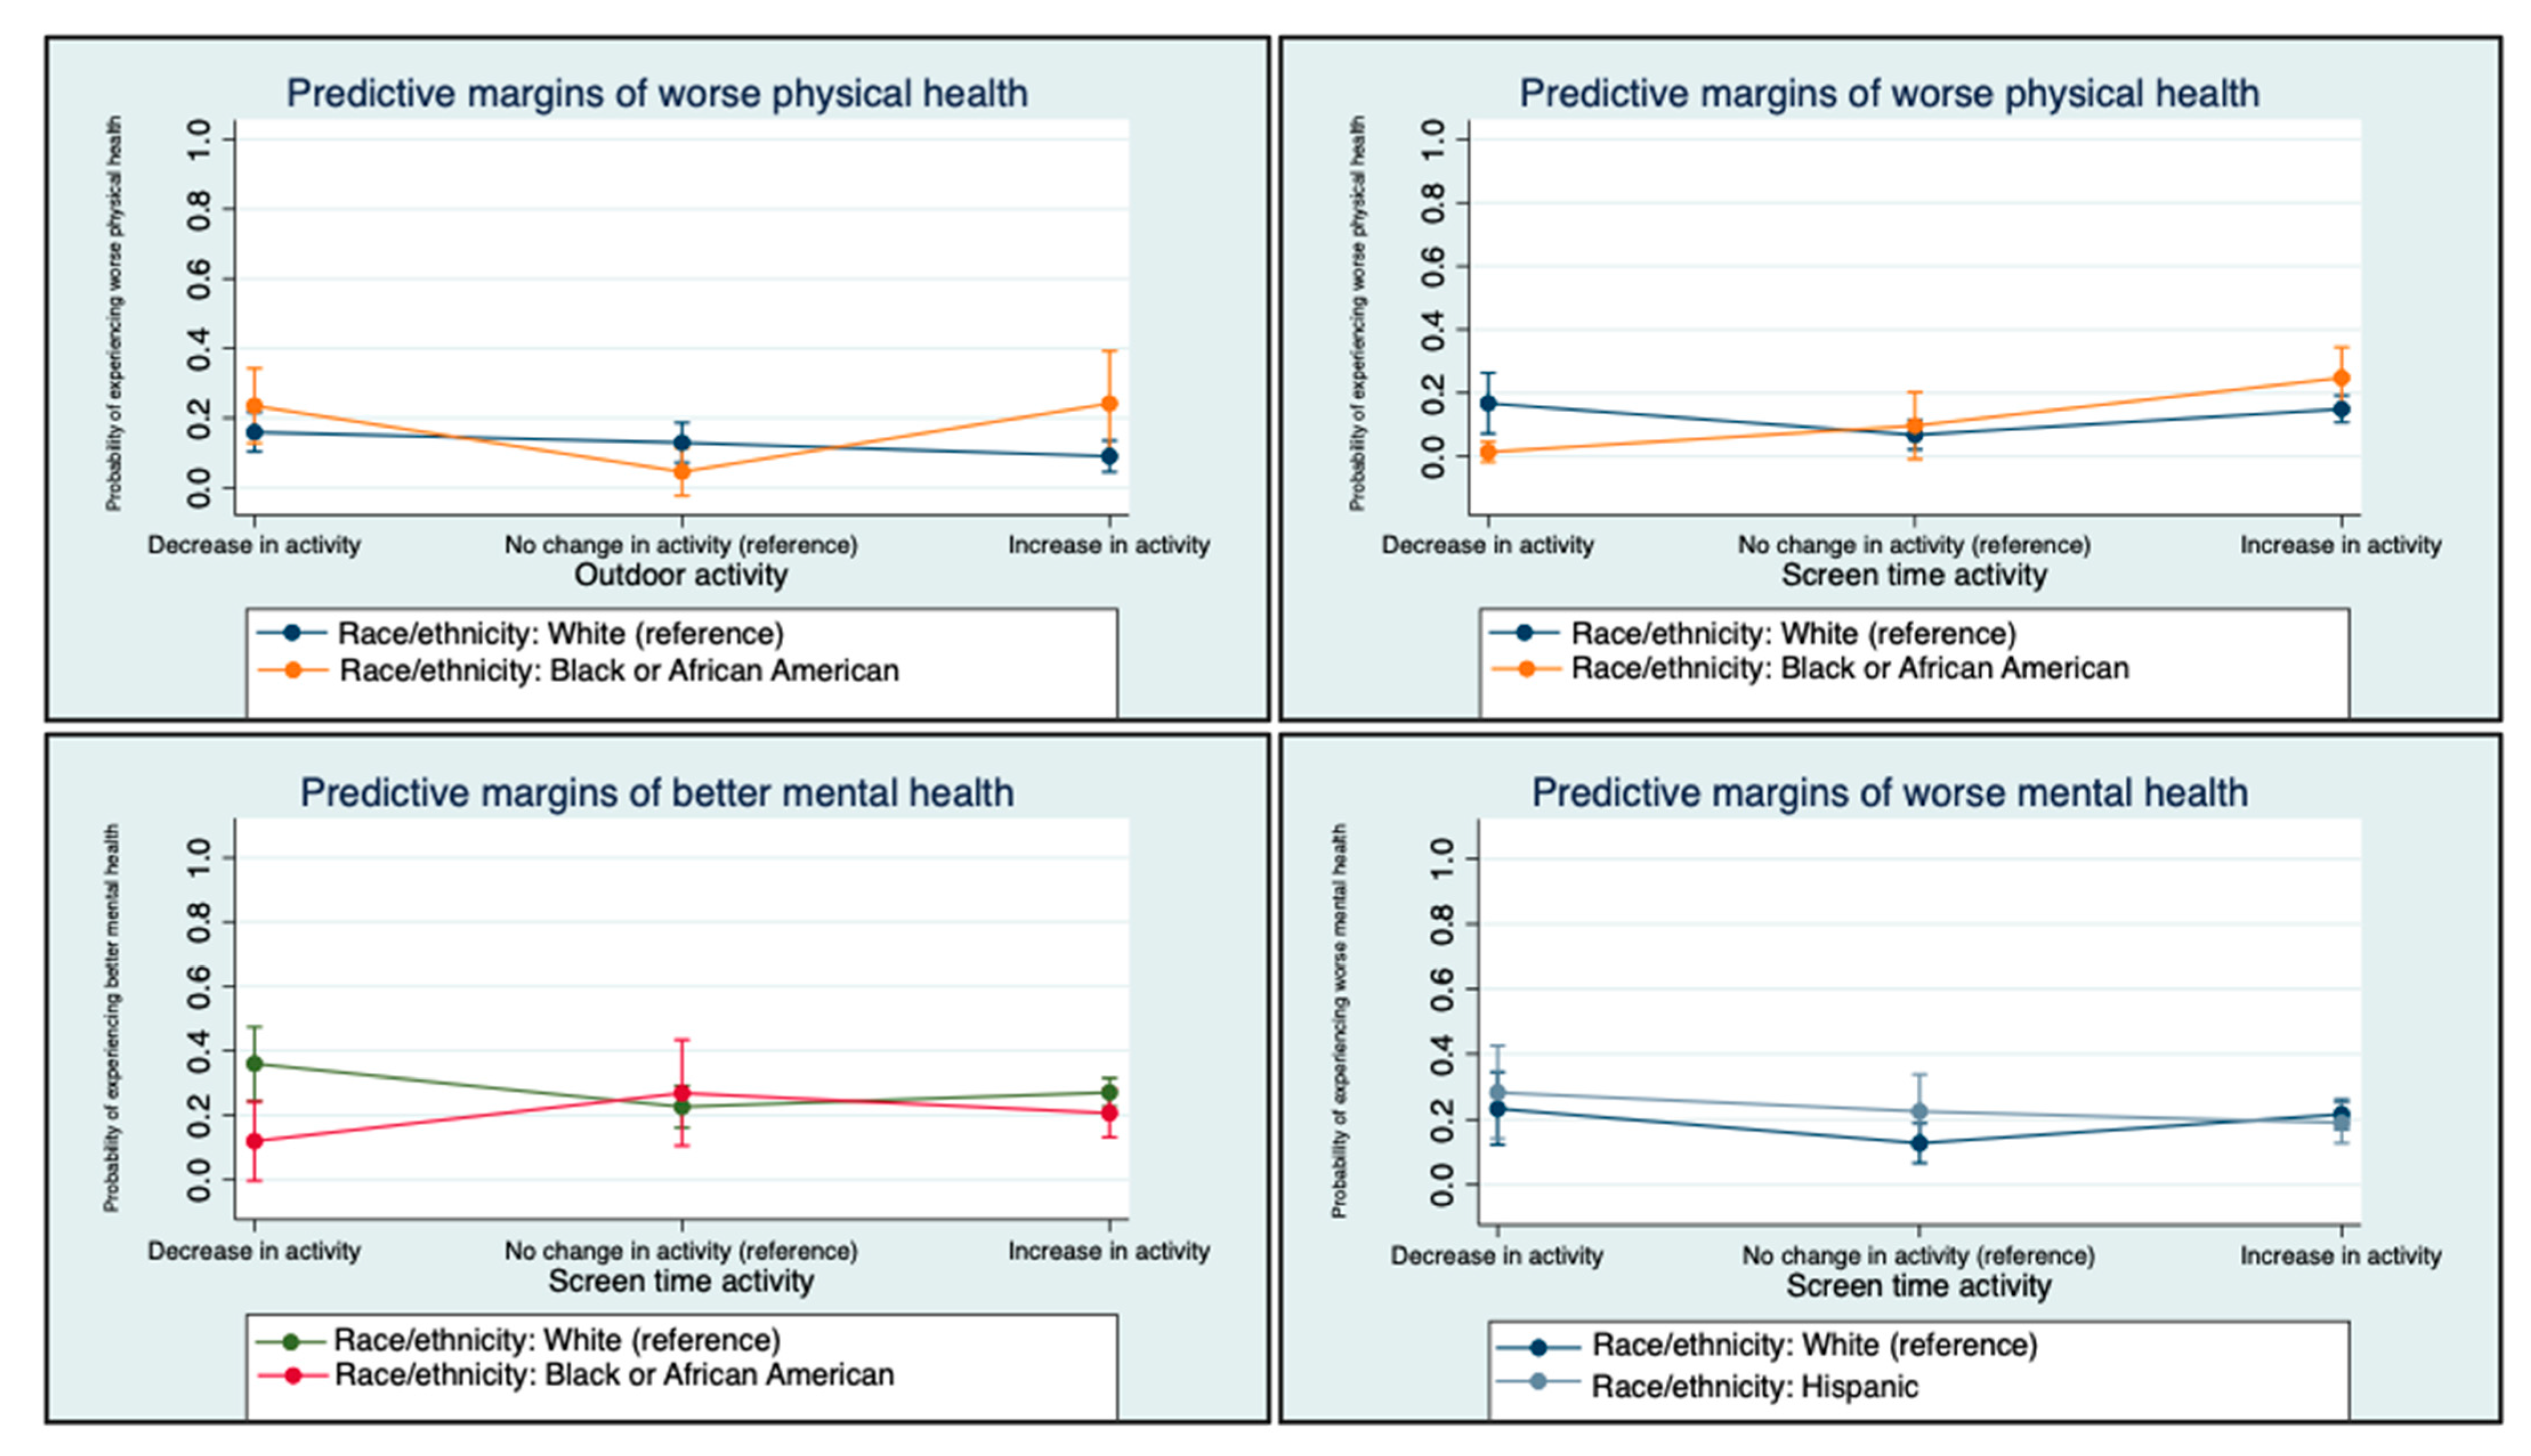
3.2.3. Interactions by Race/ethnicity
4. Discussion
Limitations
5. Conclusions
Author Contributions
Funding
Institutional Review Board Statement
Informed Consent Statement
Data Availability Statement
Acknowledgments
Conflicts of Interest
References
- Dunton, G.F.; Do, B.; Wang, S.D. Early effects of the COVID-19 pandemic on physical activity and sedentary behavior in children living in the U.S. BMC Public Health 2020, 20, 1351. [Google Scholar] [CrossRef] [PubMed]
- Eales, L.; Gillespie, S.; Alstat, R.A.; Ferguson, G.M.; Carlson, S.M. Children’s screen and problematic media use in the United States before and during the COVID-19 pandemic. Child Dev. 2021, 92, e866–e882. [Google Scholar] [CrossRef] [PubMed]
- Ilari, B.; Cho, E.; Li, J.; Bautista, A. Perceptions of Parenting, Parent-Child Activities and Children’s Extracurricular Activities in Times of COVID-19. J. Child Fam. Stud. 2022, 31, 409–420. [Google Scholar] [CrossRef] [PubMed]
- Nagata, J.M.; Magid, H.S.A.; Gabriel, K.P. Screen Time for Children and Adolescents During the Coronavirus Disease 2019 Pandemic. Obesity 2020, 28, 1582–1583. [Google Scholar] [CrossRef] [PubMed]
- Nagata, J.M.; Cortez, C.A.; Dooley, E.E.; Iyer, P.; Ganson, K.T.; Gabriel, K.P. Moderate-to-vigorous intensity physical activity among adolescents in the USA during the COVID-19 pandemic. Prev. Med. Rep. 2021, 25, 101685. [Google Scholar] [CrossRef]
- Suarez-Lopez, J.R.; Cairns, M.R.; Sripada, K.; Quiros-Alcala, L.; Mielke, H.W.; Eskenazi, B.; Etzel, R.A.; Kordas, K. COVID-19 and children’s health in the United States: Consideration of physical and social environments during the pandemic. Environ. Res. 2021, 197, 111160. [Google Scholar] [CrossRef]
- Samji, H.; Wu, J.; Ladak, A.; Vossen, C.; Stewart, E.; Dove, N.; Long, D.; Snell, G. Review: Mental health impacts of the COVID-19 pandemic on children and youth—A systematic review. Child Adolesc. Ment. Health 2021, 27, 173–189. [Google Scholar] [CrossRef]
- Racine, N.; McArthur, B.A.; Cooke, J.E.; Eirich, R.; Zhu, J.; Madigan, S. Global Prevalence of Depressive and Anxiety Symptoms in Children and Adolescents during COVID-19: A Meta-analysis. JAMA Pediatr. 2021, 175, 1142. [Google Scholar] [CrossRef]
- Jenssen, B.P.; Kelly, M.K.; Powell, M.; Bouchelle, Z.; Mayne, S.L.; Fiks, A.G. COVID-19 and Changes in Child Obesity. Pediatrics 2021, 147, e2021050123. [Google Scholar] [CrossRef]
- Ma, L.; Mazidi, M.; Li, K.; Li, Y.; Chen, S.; Kirwan, R.; Zhou, H.; Yan, N.; Rahman, A.; Wang, W.; et al. Prevalence of mental health problems among children and adolescents during the COVID-19 pandemic: A systematic review and meta-analysis. J. Affect. Disord. 2021, 293, 78–89. [Google Scholar] [CrossRef]
- Lange, S.J.; Kompaniyets, L.; Freedman, D.S.; Kraus, E.M.; Porter, R.; Blanck, H.M.; Goodman, A.B. Dnp3 Longitudinal Trends in Body Mass Index Before and During the COVID-19 Pandemic Among Persons Aged 2–19 Years—United States, 2018–2020. MMWR. Morb. Mortal. Wkly. Rep. 2021, 70, 1278–1283. [Google Scholar] [CrossRef] [PubMed]
- Krause, K.H.; Verlenden, J.V.; Szucs, L.E.; Swedo, E.A.; Merlo, C.L.; Niolon, P.H.; Leroy, Z.C.; Sims, V.M.; Deng, X.; Lee, S.; et al. Disruptions to School and Home Life Among High School Students During the COVID-19 Pandemic—Adolescent Behaviors and Experiences Survey, United States, January–June 2021. MMWR Morb. Mortal. Wkly. Rep. 2022, 71, 28–34. [Google Scholar] [CrossRef] [PubMed]
- Nagata, J.M.; Ganson, K.T.; Iyer, P.; Chu, J.; Baker, F.C.; Gabriel, K.P.; Garber, A.K.; Murray, S.B.; Bibbins-Domingo, K. Sociodemographic Correlates of Contemporary Screen Time Use among 9- and 10-Year-Old Children. J. Pediatr. 2022, 240, 213–220.e2. [Google Scholar] [CrossRef]
- Browne, N.T.; Snethen, J.A.; Greenberg, C.S.; Frenn, M.; Kilanowski, J.F.; Gance-Cleveland, B.; Burke, P.J.; Lewandowski, L. When Pandemics Collide: The Impact ofCOVID-19 on Childhood Obesity Nancy. J. Pediatr. Nurs. 2021, 56, 90–98. [Google Scholar] [CrossRef]
- Clark, E.; Fredricks, K.; Woc-Colburn, L.; Bottazzi, M.E.; Weatherhead, J. Disproportionate impact of the COVID-19 pandemic on immigrant communities in the United States. PLoS Negl. Trop. Dis. 2020, 14, e0008484. [Google Scholar] [CrossRef] [PubMed]
- Verlenden, J.V.; Pampati, S.; Rasberry, C.N.; Liddon, N.; Hertz, M.; Kilmer, G. Association of Children’s Mode of School Instruction with Child and Parent Experiences and Well-Being During the COVID-19 Pandemic. MMWR Morb. Mortal. Wkly. Rep. 2021, 70, 369–376. [Google Scholar] [CrossRef] [PubMed]
- Bambra, C.; Riordan, R.; Ford, J.; Matthews, F. The COVID-19 pandemic and health inequalities. J. Epidemiol. Community Health 2020, 74, 964–968. [Google Scholar] [CrossRef]
- Hasson, R.; Sallis, J.F.; Coleman, N.; Kaushal, N.; Nocera, V.G.; Keith, N. COVID-19: Implications for Physical Activity, Health Disparities, and Health Equity. Am. J. Lifestyle Med. 2021, 16, 420–433. [Google Scholar] [CrossRef]
- Tai, D.B.G.; Shah, A.; Doubeni, C.A.; Sia, I.G.; Wieland, M.L. The Disproportionate Impact of COVID-19 on Racial and Ethnic Minorities in the United States. Clin. Infect. Dis. 2021, 72, 703–706. [Google Scholar] [CrossRef]
- White, A.; Liburd, L.C.; Coronado, F. Addressing Racial and Ethnic Disparities in COVID-19 Among School-Aged Children: Are We Doing Enough? Prev. Chronic Dis. 2021, 18, E55. [Google Scholar] [CrossRef]
- Oberg, C.; Hodges, H.R.; Gander, S.; Nathawad, R.; Cutts, D. The impact of COVID-19 on children’s lives in the United States: Amplified inequities and a just path to recovery Charles. Curr. Probl. Pediatr. Adolesc. Health Care 2022, 2507, 101181. [Google Scholar] [CrossRef] [PubMed]
- Morales, D.X.; Morales, S.A.; Beltran, T.F. Racial/Ethnic Disparities in Household Food Insecurity During the COVID-19 Pandemic: A Nationally Representative Study. J. Racial Ethn. Health Disparities 2020, 8, 1300–1314. [Google Scholar] [CrossRef] [PubMed]
- Gilbert, A.S.; Schmidt, L.; Beck, A.; Kepper, M.M.; Mazzucca, S.; Eyler, A. Associations of physical activity and sedentary behaviors with child mental well-being during the COVID-19 pandemic. BMC Public Health 2021, 21, 1770. [Google Scholar] [CrossRef] [PubMed]
- Korczak, D.J.; Madigan, S.; Colasanto, M. Children’s Physical Activity and Depression: A Meta-analysis. Pediatrics 2017, 139, e20162266. [Google Scholar] [CrossRef] [PubMed]
- Hoare, E.; Milton, K.; Foster, C.; Allender, S. The associations between sedentary behaviour and mental health among adolescents: A systematic review. Int. J. Behav. Nutr. Phys. Act. 2016, 13, 108. [Google Scholar] [CrossRef] [PubMed]
- Suchert, V.; Hanewinkel, R.; Isensee, B. Sedentary behavior and indicators of mental health in school-aged children and adolescents: A systematic review. Prev. Med. 2015, 76, 48–57. [Google Scholar] [CrossRef]
- Oberle, E.; Ji, X.R.; Guhn, M.; Schonert-Reichl, K.A.; Gadermann, A.M. Benefits of Extracurricular Participation in Early Adolescence: Associations with Peer Belonging and Mental Health. J. Youth Adolesc. 2019, 48, 2255–2270. [Google Scholar] [CrossRef]
- Oberle, E.; Ji, X.R.; Kerai, S.; Guhn, M.; Schonert-Reichl, K.A.; Gadermann, A.M. Screen time and extracurricular activities as risk and protective factors for mental health in adolescence: A population-level study. Prev. Med. 2020, 141, 106291. [Google Scholar] [CrossRef]
- Chu PSen Saucier, D.A.; Hafner, E. Meta-analysis of the relationships between social support and well-being in children and adolescents. J. Soc. Clin. Psychol. 2010, 29, 624–645. [Google Scholar] [CrossRef]
- Sothern, M.S.; Loftin, M.; Suskind, R.M.; Udall, J.N.; Blecker, U. The health benefits of physical activity in children and adolescents: Implications for chronic disease prevention. Eur. J. Pediatr. 1999, 158, 271–274. [Google Scholar] [CrossRef]
- Ohrnberger, J.; Fichera, E.; Sutton, M. The relationship between physical and mental health: A mediation analysis. Soc. Sci. Med. 2017, 195, 42–49. [Google Scholar] [CrossRef] [PubMed]
- Perry, G.S.; Presley-Cantrell, L.R.; Dhingra, S. Addressing Mental Health Promotion in Chronic Disease Prevention and Health Promotion. Am. J. Public Health 2010, 100, 2337–2339. [Google Scholar] [CrossRef] [PubMed]
- Panchal, U.; Salazar de Pablo, G.; Franco, M.; Moreno, C.; Parellada, M.; Arango, C.; Fusar-Poli, P. The impact of COVID-19 lockdown on child and adolescent mental health: Systematic review. Eur. Child Adolesc. Psychiatry 2021. [Google Scholar] [CrossRef] [PubMed]
- Rossi, L.; Behme, N.; Breuer, C. Physical activity of children and adolescents during the COVID-19 pandemic—A scoping review. Int. J. Environ. Res. Public Health 2021, 18, 11440. [Google Scholar] [CrossRef] [PubMed]
- Sciberras, E.; Patel, P.; Stokes, M.A.; Coghill, D.; Middeldorp, C.M.; Bellgrove, M.A.; Becker, S.P.; Efron, D.; Stringaris, A.; Faraone, S.V.; et al. Physical Health, Media Use, and Mental Health in Children and Adolescents With ADHD During the COVID-19 Pandemic in Australia. J. Atten. Disord. 2022, 26, 549–562. [Google Scholar] [CrossRef]
- O’Brien, W.J.; Badenhorst, C.E.; Draper, N.; Basu, A.; Elliot, C.A.; Hamlin, M.J.; Batten, J.; Lambrick, D.; Faulkner, J. Physical Activity, Mental Health and Wellbeing during the First COVID-19 Containment in New Zealand: A Cross-Sectional Study. Int. J. Environ. Res. Public Health 2021, 18, 12036. [Google Scholar] [CrossRef]
- Centers for Disease Control and Prevention. Daily Trends in Number of COVID-19 Cases in The United States Reported to CDC. 2022. Available online: https://covid.cdc.gov/covid-data-tracker/#trends_dailycases_select_00 (accessed on 20 August 2022).
- Centers for Disease Control and Prevention. Daily Count of Doses by Date of Vaccine Administration, United States. 2022. Available online: https://covid.cdc.gov/covid-data-tracker/#vaccination-trends (accessed on 20 August 2022).
- Centers for Disease Control and Prevention. State-Issued Prevention Measures at the State-Level. 2022. Available online: https://covid.cdc.gov/covid-data-tracker/#state-level-covid-policy (accessed on 20 August 2022).
- US Department of Housing and Urban Development. DATASETS | HUD USER. 2020. Available online: https://www.huduser.gov/portal/pdrdatas_landing.html (accessed on 24 April 2022).
- Jackson, S.; Stevenson, K.; Larson, L.; Peterson, M.; Seekamp, E. Outdoor Activity Participation Improves Adolescents’ Mental Health and Well-Being during the COVID-19 Pandemic. Int. J. Environ. Res. Public Health 2021, 18, 2506. [Google Scholar] [CrossRef]
- Trust for America’s Health. The State of Obesity: Better Policies for a Healthier America. 2021. Available online: https://www.tfah.org/report-details/the-state-of-obesity-better-policies-for-a-healthier-america/ (accessed on 21 August 2022).
- Young, D.R.; Cradock, A.L.; Eyler, A.A.; Fenton, M.; Pedroso, M.; Sallis, J.F.; Whitsel, L.P.; On behalf of the American Heart Association Advocacy Coordinating Committee. Creating built environments that expand active transportation and active living across the United States: A policy statement from the American Heart Association. Circulation 2020, 142, 167–183. [Google Scholar] [CrossRef]
- U.S. Department of Transportation. Complete Streets. 2021. Available online: https://www.transportation.gov/mission/health/complete-streets (accessed on 21 August 2022).
- U.S. Department of Transportation. Safe Routes to School Programs. Available online: https://www.transportation.gov/mission/health/Safe-Routes-to-School-Programs (accessed on 21 August 2022).
- Przybylski, A.K.; Weinstein, N. A Large-Scale Test of the Goldilocks Hypothesis: Quantifying the Relations Between Digital-Screen Use and the Mental Well-Being of Adolescents. Psychol. Sci. 2016, 28, 204–215. [Google Scholar] [CrossRef] [PubMed]
- Kravitz-Wirtz, N.; Crowder, K.; Hajat, A.; Sass, V. The long-term dynamics of racial/ethnic inequality in neighborhood air pollution exposure, 1990–2009. Du Bois Rev. Soc. Sci. Res. Race 2016, 13, 237–259. [Google Scholar] [CrossRef] [Green Version]
- Hutch, D.J.; Bouye, K.E.; Skillen, E.; Lee, C.; Whitehead, L.; Rashid, J.R. Potential strategies to eliminate built environment disparities for disadvantaged and vulnerable communities. Am. J. Public Health 2011, 101, 587–595. [Google Scholar] [CrossRef] [PubMed]
- King, A.C.; Odunitan-Wayas, F.A.; Chaudhury, M.; Rubio, M.A.; Baiocchi, M.; Kolbe-Alexander, T.; Montes, F.; Banchoff, A.; Sarmiento, O.L.; Bälter, K.; et al. Community-based approaches to reducing health inequities and fostering environmental justice through global youth-engaged citizen science. Int. J. Environ. Res. Public Health 2021, 18, 892. [Google Scholar] [CrossRef] [PubMed]

| (1) | (2) | (3) | (4) | (5) | |
|---|---|---|---|---|---|
| Total n = 853 | White n = 491 (57.56%) | Black n = 98 (11.49%) | Hispanic n = 201 (23.56%) | Asian n= 63(7.39%) | |
| Outcomes, n (%) | |||||
| Mental Health: Worse | 168 (19.70) | 96 (19.55) | 19 (19.39) | 39 (19.40) | 14 (22.22) |
| Mental Health: No change | 473 (55.45) | 269 (54.79) | 60 (61.22) | 105 (52.24) | 39 (61.90) |
| Mental Health: Better | 212 (24.85) | 126 (25.66) | 19 (19.39) | 57 (28.36) | 10 (15.87) |
| Physical Health: Worse | 128 (15.01) | 59 (12.02) | 24 (24.49) | 35 (17.41) | 10 (15.87) |
| Physical Health: No change | 476 (55.80) | 284 (57.84) | 54 (55.10) | 97 (48.26) | 41 (65.08) |
| Physical Health: Better | 249 (29.19) | 148 (30.14) | 20 (20.41) | 69 (34.33) | 12 (19.05) |
| Child Activities, n (%) | |||||
| Outdoor activity: Decrease | 244 (28.60) | 116 (23.63) | 42 (42.86) | 59 (29.35) | 27 (42.86) |
| Outdoor activity: No change | 313 (36.69) | 190 (38.70) | 28 (28.57) | 70 (34.83) | 25 (39.68) |
| Outdoor activity: Increase | 296 (34.70) | 185 (37.68) | 28 (28.57) | 72 (35.82) | 11 (17.46) |
| School activity: Decrease | 146 (17.12) | 89 (18.13) | 14 (14.29) | 37 (18.41) | 6 (9.52) |
| School activity: No change | 402 (47.13) | 250 (50.92) | 41 (41.84) | 79 (39.30) | 32 (50.79) |
| School activity: Increase | 305 (35.76) | 152 (30.96) | 43 (43.88) | 85 (42.29) | 25 (39.68) |
| Time with friends: Decrease | 394 (46.19) | 217 (44.20) | 50 (51.02) | 94 (46.77) | 33 (52.38) |
| Time with friends: No change | 275 (32.24) | 164 (33.40) | 28 (28.57) | 67 (33.33) | 16 (25.40) |
| Time with friends: Increase | 184 (21.57) | 110 (22.40) | 20 (20.41) | 40 (19.90) | 14 (22.22) |
| Screen time: Decrease | 82 (9.61) | 42 (8.55) | 10 (10.20) | 26 (12.94) | 4 (6.35) |
| Screen time: No change | 284 (33.29) | 174 (35.44) | 25 (25.51) | 63 (31.34) | 22 (34.92) |
| Screen time: Increase | 487 (57.09) | 275 (56.01) | 63 (64.29) | 112 (55.72) | 37 (58.73) |
| Extracurricular activity: Decrease | 298 (34.94) | 169 (34.42) | 34 (34.69) | 67 (33.33) | 28 (44.44) |
| Extracurricular activity: No change | 344 (40.33) | 199 (40.53) | 40 (40.82) | 81 (40.30) | 24 (38.10) |
| Extracurricular activity: Increase | 211 (24.74) | 123 (25.05) | 24 (24.49) | 53 (26.37) | 11 (17.46) |
| Covariates, n (%) | |||||
| Gender: Female | 458 (53.69) | 225 (45.82) | 69 (70.41) | 128 (63.68) | 36 (57.14) |
| Child grade: Pre-school | 74 (8.68) | 41 (8.35) | 11 (11.22) | 19 (9.45) | 3 (4.76) |
| Child grade: Kindergarten | 73 (8.56) | 38 (7.74) | 11 (11.22) | 18 (8.96) | 6 (9.52) |
| Child grade: 1st through 2nd grade | 77 (9.03) | 40 (8.15) | 11 (11.22) | 19 (9.45) | 7 (11.11) |
| Child grade: 3rd through 5th grade | 176 (20.63) | 106 (21.59) | 15 (15.31) | 44 (21.89) | 11 (17.46) |
| Child grade: 6th through 8th grade | 168 (19.70) | 198 (19.96) | 20 (20.41) | 39 (19.40) | 11 (17.46) |
| Child grade: 9th through 12th grade | 285 (33.41) | 168 (34.22) | 30 (30.61) | 62 (30.85) | 25 (39.68) |
| Income: (0–50%) AMI | 219 (25.67) | 108 (22.00) | 37 (37.76) | 58 (28.86) | 16 (25.40) |
| Income: (50–80%) AMI | 148 (17.35) | 85 (17.31) | 16 (16.33) | 40 (19.90) | 7 (11.11) |
| Income: (80–120%) AMI | 194 (22.74) | 107 (21.79) | 22 (22.45) | 46 (22.89) | 19 (30.16) |
| Income: (120%+) AMI | 292 (34.23) | 191 (38.90) | 23 (23.47) | 57 (28.36) | 21 (33.33) |
| Job/income loss: Yes | 293 (34.35) | 156 (31.77) | 31 (31.63) | 90 (44.78) | 16 (25.40) |
| Bachelor’s degree: Yes | 662 (77.61) | 380 (77.39) | 79 (80.61) | 146 (72.64) | 57 (90.48) |
| Primary language: English | 814 (95.43) | 489 (99.59) | 96 (97.96) | 174 (86.57) | 55 (87.30) |
| Primary language: Spanish/Other | 39 (4.57) | 2 (0.41) | 2 (2.04) | 27 (13.43) | 8 (12.70) |
| Children: One child | 395 (46.31) | 222 (45.21) | 54 (55.10) | 85 (42.29) | 34 (53.97) |
| Children: More than one child | 458 (53.69) | 269 (54.79) | 44 (44.90) | 116 (57.71) | 29 (46.03) |
| Spouse employment: Single | 155 (18.17) | 70 (14.26) | 37 (37.76) | 39 (19.40) | 9 (14.29) |
| Spouse employment: Working full time | 492 (57.68) | 291 (59.27) | 43 (43.88) | 121 (60.20) | 37 (58.73) |
| Spouse employment: Working part time | 86 (10.08) | 52 (10.59) | 7 (7.14) | 19 (9.45) | 8 (12.70) |
| Spouse employment: Not working | 120 (14.07) | 78 (15.89) | 11 (11.22) | 22 (10.95) | 9 (14.29) |
| Employment: Working full time | 602 (70.57) | 356 (72.51) | 68 (69.39) | 138 (68.66) | 40 (63.49) |
| Employment: Working part time | 102 (11.96) | 52 (10.59) | 10 (10.20) | 32 (15.92) | 8 (12.70) |
| Employment: Not working | 149 (17.47) | 83 (16.90) | 20 (20.41) | 31 (15.42) | 15 (23.81) |
| School plan: In-person only | 189 (22.16) | 132 (26.88) | 13 (13.27) | 37 (18.41) | 7 (11.11) |
| School plan: Online only | 262 (30.72) | 127 (25.87) | 44 (44.90) | 69 (34.33) | 22 (34.92) |
| School plan: Mix of in-person and online | 314 (36.81) | 182 (37.07) | 31 (31.63) | 76 (37.81) | 25 (39.68) |
| School plan: Choice of in-person and online | 88 (10.32) | 50 (10.18) | 10 (10.20) | 19 (9.45) | 9 (14.29) |
| School quality pre COVID: Poor | 61 (7.15) | 36 (7.33) | 13 (13.27) | 10 (4.98) | 2 (3.17) |
| School quality pre COVID: Average | 230 (26.96) | 114 (23.22) | 30 (30.61) | 64 (31.84) | 22 (34.92) |
| School quality pre COVID: Good | 562 (65.89) | 341 (69.45) | 55 (56.12) | 127 (63.18) | 39 (61.90) |
| School quality during COVID: Poor | 87 (10.20) | 56 (11.41) | 9 (9.18) | 17 (8.46) | 5 (7.94) |
| School quality during COVID: Average | 261 (30.60) | 125 (25.46) | 39 (39.80) | 74 (36.82) | 23 (36.51) |
| School quality during COVID: Good | 505 (59.20) | 310 (63.14) | 50 (51.02) | 110 (54.73) | 35 (55.56) |
| Online learning tool at home: Yes | 548 (64.24) | 318 (64.77) | 57 (58.16) | 131 (65.17) | 42 (66.67) |
| Adult learning assistance at home: Yes | 404 (47.36) | 247 (50.31) | 47 (47.96) | 85 (42.29) | 25 (39.68) |
| Broadband at home: Yes | 579 (67.88) | 341 (69.45) | 66 (67.35) | 131 (65.17) | 41 (65.08) |
| Quiet place to study at home: Yes | 533 (62.49) | 308 (62.73) | 65 (66.33) | 119 (59.20) | 41 (65.08) |
| Cumulative COVID-19 incidences (County),a M (SD) | 10.90 (1.61) | 10.61 (1.62) | 11.06 (1.64) | 11.43 (1.46) | 11.28 (1.50) |
| Population Density (Thousands per Sq. Mile), M (SD) | 1.55 (2.15) | 1.42 (2.12) | 1.76 (2.19) | 1.49 (1.57) | 2.51 (3.50) |
| (1) | (2) | |||||||
|---|---|---|---|---|---|---|---|---|
| Physical Health: Worse | Physical Health: Better | Mental Health: Worse | Mental Health: Better | |||||
| RRR | (se) | RRR | (se) | RRR | (se) | RRR | (se) | |
| Outdoor activity: Decrease | 2.63 ** | 0.83 | 2.33 ** | 0.73 | 2.20 ** | 0.64 | 1.69 | 0.56 |
| Outdoor activity: Increase | 1.36 | 0.46 | 2.36 ** | 0.67 | 1.45 | 0.44 | 1.64 | 0.51 |
| School activity: Decrease | 2.51 ** | 0.77 | 2.30 * | 0.76 | 5.10 *** | 1.47 | 2.35 * | 0.85 |
| School activity: Increase | 1.34 | 0.40 | 3.07 *** | 0.81 | 1.94 * | 0.53 | 4.13 *** | 1.14 |
| Time with friends: Decrease | 2.01 | 0.74 | 0.67 | 0.20 | 3.23 *** | 1.07 | 1.01 | 0.33 |
| Time with friends: Increase | 3.56 ** | 1.60 | 3.60 *** | 1.17 | 2.19 | 0.92 | 3.34 *** | 1.09 |
| Screen time: Decrease | 2.56 * | 1.14 | 1.88 | 0.71 | 3.05 ** | 1.27 | 2.56 * | 1.02 |
| Screen time: Increase | 2.23 * | 0.81 | 1.18 | 0.34 | 1.56 | 0.50 | 1.28 | 0.39 |
| Extracurricular activity: Decrease | 1.05 | 0.30 | 0.69 | 0.20 | 0.95 | 0.25 | 1.18 | 0.38 |
| Extracurricular activity: Increase | 0.55 | 0.23 | 3.05 *** | 0.88 | 0.89 | 0.32 | 4.48 *** | 1.35 |
| Race/ethnicity: Black | 1.42 | 0.51 | 0.56 | 0.21 | 0.67 | 0.24 | 0.46 * | 0.18 |
| Race/ethnicity: Asian | 1.12 | 0.52 | 0.58 | 0.27 | 1.09 | 0.46 | 0.39 | 0.19 |
| Race/ethnicity: Hispanic | 1.81 * | 0.54 | 1.4 | 0.38 | 1.07 | 0.30 | 0.87 | 0.25 |
| Gender: Female | 0.94 | 0.25 | 0.73 | 0.17 | 1.01 | 0.25 | 0.76 | 0.19 |
| Child grade: Kindergarten | 0.82 | 0.48 | 0.66 | 0.34 | 0.50 | 0.30 | 1.08 | 0.55 |
| Child grade: 1st through 2nd grade | 0.55 | 0.33 | 0.86 | 0.43 | 0.95 | 0.53 | 1.65 | 0.83 |
| Child grade: 3rd through 5th grade | 0.78 | 0.39 | 1.06 | 0.46 | 0.89 | 0.43 | 0.85 | 0.37 |
| Child grade: 6th through 8th grade | 0.73 | 0.37 | 0.89 | 0.39 | 1.05 | 0.50 | 1.17 | 0.52 |
| Child grade: 9th through 12th grade | 0.9 | 0.43 | 1.06 | 0.44 | 1.56 | 0.71 | 0.82 | 0.35 |
| Income: (50–80%) AMI | 0.75 | 0.26 | 0.91 | 0.3 | 1.50 | 0.49 | 0.77 | 0.26 |
| Income: (80–120%) AMI | 0.58 | 0.21 | 1.10 | 0.36 | 0.95 | 0.33 | 0.68 | 0.23 |
| Income: (120%+) AMI | 0.84 | 0.29 | 0.92 | 0.30 | 1.33 | 0.45 | 0.56 | 0.19 |
| Job/income loss: Yes | 1.56 | 0.39 | 1.54 | 0.35 | 1.21 | 0.29 | 1.11 | 0.27 |
| Bachelor’s degree: Yes | 0.56 | 0.18 | 0.77 | 0.23 | 0.67 | 0.20 | 1.18 | 0.38 |
| Primary language: Spanish/Other | 0.36 | 0.21 | 0.49 | 0.28 | 0.57 | 0.32 | 2.05 | 1.07 |
| Children: More than one child | 0.88 | 0.21 | 1.33 | 0.29 | 0.83 | 0.18 | 1.31 | 0.30 |
| Spouse employment: Working part time | 1.23 | 0.50 | 1.73 | 0.60 | 1.69 | 0.63 | 1.79 | 0.67 |
| Spouse employment: Not working | 0.64 | 0.24 | 0.47 * | 0.16 | 0.73 | 0.24 | 0.50 * | 0.18 |
| Spouse employment: Single | 1.50 | 0.51 | 0.65 | 0.24 | 0.90 | 0.30 | 0.59 | 0.23 |
| Employment: Working part time | 0.50 | 0.19 | 0.84 | 0.29 | 1.36 | 0.47 | 1.14 | 0.41 |
| Employment: Not working | 0.90 | 0.29 | 1.14 | 0.39 | 1.69 | 0.50 | 1.35 | 0.49 |
| School plan: Online only | 0.93 | 0.34 | 2.16 * | 0.68 | 1.16 | 0.40 | 2.50 ** | 0.81 |
| School plan: Mix of in-person and online | 1.44 | 0.49 | 1.77 | 0.55 | 1.91 * | 0.61 | 1.98 * | 0.64 |
| School plan: Choice of in-person and online | 0.97 | 0.44 | 2.04 | 0.88 | 1.29 | 0.54 | 1.50 | 0.72 |
| School quality pre-COVID: Poor | 3.24 ** | 1.44 | 2.88 * | 1.35 | 2.34 * | 0.99 | 0.88 | 0.44 |
| School quality pre-COVID: Good | 0.87 | 0.25 | 1.36 | 0.40 | 0.84 | 0.24 | 1.00 | 0.31 |
| School quality during COVID: Poor | 1.69 | 0.59 | 1.10 | 0.47 | 1.34 | 0.47 | 1.57 | 0.71 |
| School quality during COVID: Good | 0.91 | 0.26 | 2.19 ** | 0.59 | 0.76 | 0.20 | 2.11 ** | 0.60 |
| Cumulative COVID-19 incidences (County) a | 1.14 | 0.09 | 1.12 | 0.08 | 0.98 | 0.07 | 1.07 | 0.08 |
| Population Density (Thousands per Sq. Mile) | 0.99 | 0.06 | 0.99 | 0.05 | 0.96 | 0.05 | 0.95 | 0.05 |
| Online learning tool at home: Yes | 0.94 | 0.24 | 1.04 | 0.25 | 0.69 | 0.16 | 0.86 | 0.22 |
| Adult learning assistance at home: Yes | 0.91 | 0.23 | 0.69 | 0.17 | 0.95 | 0.23 | 0.72 | 0.19 |
| Broadband at home: Yes | 1.21 | 0.33 | 1.32 | 0.33 | 1.1 | 0.28 | 0.96 | 0.24 |
| Quiet place to study at home: Yes | 0.85 | 0.23 | 0.95 | 0.22 | 1.43 | 0.36 | 1.46 | 0.36 |
| Observations | 853 | 853 | ||||||
| Pseudo R2 | 0.32 | 0.32 | ||||||
| (1) | (2) | (3) | (4) | (5) | ||||||||||||||||
|---|---|---|---|---|---|---|---|---|---|---|---|---|---|---|---|---|---|---|---|---|
| Outdoor Activity × Race/ethnicity | School Activity × Race/ethnicity | Time with Friends × Race/ethnicity | Screen Time × Race/ethnicity | Extracurricular Activity × Race/ethnicity | ||||||||||||||||
| Physical Health | Physical Health | Physical Health | Physical Health | Physical Health | ||||||||||||||||
| Worse | Better | Worse | Better | Worse | Better | Worse | Better | Worse | Better | |||||||||||
| RRR | (se) | RRR | (se) | RRR | (se) | RRR | (se) | RRR | (se) | RRR | (se) | RRR | (se) | RRR | (se) | RRR | (se) | RRR | (se) | |
| Race/ethnicity: Black | 0.23 | 0.23 | 0.46 | 0.35 | 1.44 | 0.79 | 0.81 | 0.49 | 1.66 | 1.33 | 0.58 | 0.39 | 1.63 | 1.41 | 1.10 | 0.77 | 0.70 | 0.43 | 0.63 | 0.35 |
| Race/ethnicity: Asian | - | - | 0.06 | 0.44 | 1.00 | 0.69 | 0.45 | 0.38 | 1.71 | 1.97 | 0.95 | 0.81 | 0.77 | 0.94 | 0.13* | 0.13 | 0.72 | 0.64 | 0.32 | 0.24 |
| Race/ethnicity: Hispanic | 1.46 | 0.75 | 1.65 | 0.76 | 1.23 | 0.57 | 1.09 | 0.48 | 1.27 | 0.81 | 1.05 | 0.46 | 3.16 | 1.97 | 1.00 | 0.48 | 1.72 | 0.80 | 1.08 | 0.46 |
| Outdoor activity: Decrease | 1.61 | 0.67 | 2.02 | 0.86 | 2.82 ** | 0.90 | 2.38 ** | 0.75 | 2.47 ** | 0.79 | 2.31 ** | 0.74 | 2.29 * | 0.74 | 2.13 * | 0.69 | 2.66 ** | 0.85 | 2.41 ** | 0.77 |
| Outdoor activity: Increase | 0.81 | 0.37 | 2.75 ** | 1.02 | 1.40 | 0.48 | 2.37 ** | 0.68 | 1.30 | 0.45 | 2.35 ** | 0.67 | 1.21 | 0.42 | 2.31 ** | 0.67 | 1.41 | 0.49 | 2.33 ** | 0.67 |
| School activity: Decrease | 2.67 ** | 0.84 | 2.38 ** | 0.79 | 2.06 | 0.81 | 2.13 | 0.85 | 2.49 ** | 0.77 | 2.32 * | 0.77 | 2.38 ** | 0.74 | 2.32 * | 0.78 | 2.53 ** | 0.78 | 2.23* | 0.74 |
| School activity: Increase | 1.47 | 0.45 | 3.07 *** | 0.82 | 1.17 | 0.53 | 2.90 ** | 0.99 | 1.31 | 0.39 | 3.16 *** | 0.85 | 1.31 | 0.39 | 3.03 *** | 0.81 | 1.35 | 0.40 | 3.18 *** | 0.85 |
| Time with friends: Decrease | 2.07 * | 0.77 | 0.66 | 0.20 | 2.01 | 0.74 | 0.65 | 0.20 | 1.79 | 0.85 | 0.59 | 0.21 | 2.34 * | 0.87 | 0.69 | 0.21 | 2.13 * | 0.78 | 0.66 | 0.20 |
| Time with friends: Increase | 3.48 ** | 1.63 | 3.50 *** | 1.15 | 3.55 ** | 1.61 | 3.55 *** | 1.16 | 4.12 * | 2.55 | 3.67 ** | 1.53 | 4.63 *** | 2.14 | 4.29 *** | 1.43 | 3.49 ** | 1.61 | 3.77 *** | 1.24 |
| Screen time: Decrease | 3.04 * | 1.40 | 1.92 | 0.73 | 2.45* | 1.11 | 1.90 | 0.73 | 3.07 * | 1.40 | 1.93 | 0.73 | 4.44 * | 2.89 | 2.30 | 1.18 | 2.71* | 1.22 | 1.95 | 0.74 |
| Screen time: Increase | 2.36 * | 0.87 | 1.19 | 0.35 | 2.18 * | 0.80 | 1.17 | 0.35 | 2.48 * | 0.92 | 1.19 | 0.35 | 2.85 * | 1.43 | 0.94 | 0.33 | 2.26* | 0.82 | 1.2 | 0.35 |
| Extracurricular activity: Decrease | 1.10 | 0.32 | 0.69 | 0.21 | 1.02 | 0.30 | 0.68 | 0.20 | 1.05 | 0.30 | 0.68 | 0.20 | 1.01 | 0.29 | 0.67 | 0.20 | 0.80 | 0.31 | 0.67 | −0.24 |
| Extracurricular activity: Increase | 0.54 | 0.23 | 3.14 *** | 0.91 | 0.56 | 0.24 | 3.11 *** | 0.90 | 0.57 | 0.24 | 3.05 *** | 0.88 | 0.49 | 0.21 | 3.15 *** | 0.92 | 0.52 | 0.31 | 2.24 * | 0.84 |
| Activity: Decrease × Black | 7.55 | 8.28 | 1.89 | 1.86 | 0.65 | 0.58 | 0.25 | 0.34 | 1.20 | 1.07 | 0.96 | 0.85 | 0.02 * | 0.03 | 0.11 | 0.13 | 3.27 | 2.47 | 0.27 | 0.33 |
| Activity: Decrease × Asian | - | - | - | - | 2.33 | 2.74 | - | - | 0.47 | 0.61 | 0.59 | 0.64 | 2.08 | 4.03 | 4.40 | 7.54 | 2.18 | 2.27 | 0.68 | 0.91 |
| Activity: Decrease × Hispanic | 1.71 | 1.14 | 1.44 | 0.94 | 2.42 | 1.71 | 2.16 | 1.53 | 1.64 | 1.18 | 1.65 | 0.93 | 0.69 | 0.66 | 1.09 | 0.89 | 1.00 | 0.59 | 1.33 | 0.78 |
| Activity: Increase × Black | 14.68 * | 17.18 | 1.11 | 1.06 | 1.12 | 0.88 | 0.69 | 0.53 | 0.15 | 0.20 | 0.63 | 0.59 | 1.21 | 1.13 | 0.53 | 0.43 | 1.54 | 1.78 | 1.23 | 1.01 |
| Activity: Increase × Asian | - | - | - | - | 0.84 | 0.88 | 1.73 | 1.77 | 1.50 | 2.25 | 0.48 | 0.56 | 1.68 | 2.24 | 8.43 | 9.90 | - | - | 6.70 | 7.61 |
| Activity: Increase × Hispanic | 1.02 | 0.75 | 0.51 | 0.31 | 1.61 | 1.09 | 1.31 | 0.75 | 1.38 | 1.46 | 1.36 | 1.05 | 0.47 | 0.33 | 1.87 | 1.08 | 1.11 | 1.03 | 1.76 | 1.14 |
| Model Covariates Included | Y | Y | Y | Y | Y | |||||||||||||||
| Observations | 853 | 853 | 853 | 853 | 853 | |||||||||||||||
| Pseudo R2 | 0.33 | 0.32 | 0.32 | 0.33 | 0.33 | |||||||||||||||
| (1) | (2) | (3) | (4) | (5) | ||||||||||||||||
|---|---|---|---|---|---|---|---|---|---|---|---|---|---|---|---|---|---|---|---|---|
| Outdoor activity × Race/ethnicity | School activity × Race/ethnicity | Time with friends × Race/ethnicity | Screen time × Race/ethnicity | Extracurricular activity × Race/ethnicity | ||||||||||||||||
| Mental Health | Mental Health | Mental Health | Mental Health | Mental Health | ||||||||||||||||
| Worse | Better | Worse | Better | Worse | Better | Worse | Better | Worse | Better | |||||||||||
| RRR | (se) | RRR | (se) | RRR | (se) | RRR | (se) | RRR | (se) | RRR | (se) | RRR | (se) | RRR | (se) | RRR | (se) | RRR | (se) | |
| Race/ethnicity: Black | 0.85 | 0.65 | 1.04 | 0.75 | 1.10 | 0.59 | 0.32 | 0.28 | 2.21 | 1.69 | 0.68 | 0.51 | 2.02 | 1.63 | 1.70 | 1.34 | 1.42 | 0.76 | 0.22 | 0.18 |
| Race/ethnicity: Asian | 1.50 | 1.15 | 0.85 | 0.62 | 0.96 | 0.59 | 0.19 | 0.21 | 1.82 | 2.08 | 0.43 | 0.50 | 2.08 | 1.86 | 0.53 | 0.49 | 2.15 | 1.54 | 0.24 | 0.21 |
| Race/ethnicity: Hispanic | 1.60 | 0.77 | 1.23 | 0.66 | 0.77 | 0.35 | 0.99 | 0.48 | 1.90 | 1.08 | 0.58 | 0.30 | 2.74 | 1.52 | 1.60 | 0.84 | 1.39 | 0.63 | 0.61 | 0.3 |
| Outdoor activity: Decrease | 3.55 ** | 1.38 | 2.84 * | 1.29 | 2.31 ** | 0.68 | 1.68 | 0.55 | 2.40 ** | 0.71 | 1.75 | 0.58 | 2.53 ** | 0.76 | 1.65 | 0.56 | 2.18 ** | 0.64 | 1.66 | 0.55 |
| Outdoor activity: Increase | 1.36 | 0.54 | 2.13 | 0.87 | 1.45 | 0.45 | 1.64 | 0.51 | 1.43 | 0.44 | 1.61 | 0.50 | 1.53 | 0.48 | 1.55 | 0.49 | 1.36 | 0.42 | 1.59 | 0.50 |
| School activity: Decrease | 4.92 *** | 1.43 | 2.34 * | 0.85 | 4.12 *** | 1.48 | 2.20 | 0.98 | 5.15 *** | 1.50 | 2.32 * | 0.85 | 4.79 *** | 1.40 | 2.24 * | 0.82 | 5.32 *** | 1.56 | 2.26* | 0.83 |
| School activity: Increase | 1.99 * | 0.55 | 4.17 *** | 1.15 | 2.43 * | 0.93 | 4.13 *** | 1.45 | 2.05 ** | 0.57 | 4.35 *** | 1.22 | 1.96 * | 0.54 | 4.25 *** | 1.18 | 2.02 * | 0.55 | 4.19 *** | 1.17 |
| Time with friends: Decrease | 3.37 *** | 1.13 | 1.03 | 0.34 | 3.33 *** | 1.11 | 1.00 | 0.33 | 5.18 *** | 2.25 | 1.03 | 0.41 | 3.31 *** | 1.13 | 1.06 | 0.35 | 3.14 *** | 1.05 | 1.01 | 0.33 |
| Time with friends: Increase | 2.03 | 0.87 | 3.27 *** | 1.07 | 2.11 | 0.89 | 3.24 *** | 1.06 | 2.35 | 1.37 | 2.49 * | 1.03 | 2.30 | 0.99 | 3.58 *** | 1.19 | 2.25 | 0.96 | 3.45 *** | 1.14 |
| Screen time: Decrease | 2.95 * | 1.25 | 2.41 * | 0.96 | 3.13 ** | 1.33 | 2.64 * | 1.06 | 3.10 ** | 1.31 | 2.61 * | 1.05 | 3.97 * | 2.37 | 4.24 * | 2.39 | 2.95 ** | 1.24 | 2.69* | 1.09 |
| Screen time: Increase | 1.63 | 0.53 | 1.31 | 0.40 | 1.56 | 0.51 | 1.29 | 0.39 | 1.60 | 0.52 | 1.29 | 0.39 | 2.66* | 1.09 | 1.86 | 0.71 | 1.56 | 0.50 | 1.34 | 0.41 |
| Extracurricular activity: Decrease | 0.94 | 0.25 | 1.14 | 0.37 | 0.90 | 0.24 | 1.16 | 0.37 | 0.91 | 0.24 | 1.16 | 0.37 | 0.96 | 0.26 | 1.16 | 0.37 | 1.38 | 0.48 | 0.99 | 0.39 |
| Extracurricular activity: Increase | 0.89 | 0.32 | 4.41 *** | 1.34 | 0.84 | 0.31 | 4.39 *** | 1.33 | 0.89 | 0.33 | 4.63 *** | 1.40 | 0.84 | 0.31 | 4.49 *** | 1.37 | 1.18 | 0.58 | 3.26 ** | 1.26 |
| Activity: Decrease × Black | 0.47 | 0.42 | 0.30 | 0.28 | 0.68 | 0.60 | 1.39 | 1.89 | 0.20 | 0.18 | 0.48 | 0.45 | 0.14 | 0.19 | 0.04 * | 0.05 | 0.36 | 0.26 | 2.08 | 2.23 |
| Activity: Decrease × Asian | 0.37 | 0.35 | 0.29 | 0.33 | 0.75 | 0.88 | - | - | 0.36 | 0.46 | 0.67 | 0.92 | - | - | - | - | 0.44 | 0.39 | 0.58 | 0.86 |
| Activity: Decrease × Hispanic | 0.33 | 0.21 | 0.43 | 0.31 | 3.27 | 2.26 | 1.25 | 0.98 | 0.43 | 0.28 | 1.33 | 0.85 | 0.50 | 0.45 | 0.56 | 0.48 | 0.51 | 0.29 | 1.65 | 1.05 |
| Activity: Increase × Black | 1.37 | 1.38 | 0.37 | 0.34 | 0.33 | 0.25 | 1.47 | 1.44 | 0.36 | 0.42 | 0.82 | 0.82 | 0.26 | 0.23 | 0.28 | 0.25 | - | - | 2.72 | 2.73 |
| Activity: Increase × Asian | 2.31 | 2.83 | 0.23 | 0.28 | 1.23 | 1.08 | 3.10 | 3.92 | 2.03 | 2.92 | 1.33 | 1.86 | 0.29 | 0.29 | 0.62 | 0.68 | - | - | 3.19 | 3.74 |
| Activity: Increase × Hispanic | 1.00 | 0.66 | 0.83 | 0.55 | 0.91 | 0.58 | 0.75 | 0.45 | 0.83 | 0.84 | 2.85 | 2.18 | 0.26 * | 0.17 | 0.40 | 0.25 | 1.58 | 1.25 | 1.82 | 1.24 |
| Model Covariates Included | Y | Y | Y | Y | Y | |||||||||||||||
| Observations | 853 | 853 | 853 | 853 | 853 | |||||||||||||||
| Pseudo R2 | 0.33 | 0.33 | 0.33 | 0.33 | 0.33 | |||||||||||||||
Publisher’s Note: MDPI stays neutral with regard to jurisdictional claims in published maps and institutional affiliations. |
© 2022 by the authors. Licensee MDPI, Basel, Switzerland. This article is an open access article distributed under the terms and conditions of the Creative Commons Attribution (CC BY) license (https://creativecommons.org/licenses/by/4.0/).
Share and Cite
Gilbert, A.S.; Jabbari, J.; Hernández, R. How Do Perceived Changes in Child and Adolescent Activities Relate to Perceptions of Health during COVID-19? Exploring Heterogeneity during the Pandemic. Int. J. Environ. Res. Public Health 2022, 19, 11206. https://doi.org/10.3390/ijerph191811206
Gilbert AS, Jabbari J, Hernández R. How Do Perceived Changes in Child and Adolescent Activities Relate to Perceptions of Health during COVID-19? Exploring Heterogeneity during the Pandemic. International Journal of Environmental Research and Public Health. 2022; 19(18):11206. https://doi.org/10.3390/ijerph191811206
Chicago/Turabian StyleGilbert, Amanda S., Jason Jabbari, and Racquel Hernández. 2022. "How Do Perceived Changes in Child and Adolescent Activities Relate to Perceptions of Health during COVID-19? Exploring Heterogeneity during the Pandemic" International Journal of Environmental Research and Public Health 19, no. 18: 11206. https://doi.org/10.3390/ijerph191811206
APA StyleGilbert, A. S., Jabbari, J., & Hernández, R. (2022). How Do Perceived Changes in Child and Adolescent Activities Relate to Perceptions of Health during COVID-19? Exploring Heterogeneity during the Pandemic. International Journal of Environmental Research and Public Health, 19(18), 11206. https://doi.org/10.3390/ijerph191811206